

Abstract
In March 2021, Italian health authorities suspended the Vaxzevria vaccine (VA) for 4 days over reports of very rare blood disorders among recipients. We exploit the quasi‐experimental setting arising from this break to study the drivers of vaccine hesitancy. Before the suspension, the VA vaccination trend followed the same pattern as Pfizer‐Biontech (PB). After the suspension, VA and PB injections started to diverge, with VA daily decreasing by almost 60 doses per 100,000 inhabitants for the following 3 weeks. The resulting vaccination rate was 60 percent lower than the value that would have stemmed from the VA pre‐suspension pattern. We show that the slowdown was weaker and less persistent in regions with higher COVID penetration and steadier and more pronounced in regions displaying greater attention to vaccine side effects as detected through Google searches. The public's interest in vaccine adverse events negatively correlates with COVID cases and deaths across regions.
Keywords: COVID‐19, Google searches, vaccine hesitancy, Vaxzevria vaccine
1. INTRODUCTION
Vaccination against COVID‐19 is a public good with substantial private benefits and crucial positive externalities for public health and the economy. However, vaccine hesitancy threatens the success of the immunization campaign, with immunization rates lagging below target in many countries and regions (Savulescu et al., 2021).
The literature explains the decision to get vaccinated as a rational choice between the risk of contracting the disease and the risk of experiencing vaccine side effects (Binder and Nuscheler, 2017; Bohm et al., 2016; Brown et al., 2010; Weinstein, 2000). 1 The public's perception of these two risks plays a crucial role in the success of an immunization campaign. Previous studies suggest that the overestimation of the incidence and severity of adverse events is a major driver of hesitancy (e.g., Betsch et al., 2011; Brewer et al., 2007).
In this paper, we exploit a quasi‐experiment arising from the suspension of the ChAdOx1‐S vaccine (hereafter Vaxzevria, or VA) to study the drivers of vaccine hesitancy, intended as the delay in acceptance or refusal of vaccination despite the availability of vaccination services (WHO, 2014). 2 In Italy, the National Medicines Agency (AIFA) interrupted the inoculations of a VA batch on March 11 following evidence that vaccination with VA can result in the very rare development of immune thrombotic thrombocytopenia (Greinacher et al., 2021; Scully et al., 2021). On March 15, the AIFA suspended all VA vaccinations for 4 days to examine the potential size and severity of the adverse events while allowing Pfizer‐Biontech (PB) injections to continue. We take advantage of this decision to perform a difference‐in‐differences analysis that quantifies the decline in VA vaccinations after the campaign was restored and explores the possible drivers of the slowdown of the vaccination campaign. The mandatory break in injections increased uncertainty about the side effects of vaccination with VA, drawing the public's attention to vaccine adverse events. This treatment arguably inflated the risk of adverse events in the perception of candidate recipients. The analysis covers the period from February 18 to March 31, 2021, 3 weeks after the suspension was lifted.
We first show that the per capita number of VA and PB doses daily administered in the Italian regions evolved in parallel until the suspension on March 15. 3 In the suspension week, the VA vaccination rate decreased by roughly 46 daily doses per 100,000 inhabitants. The resulting value was approximately 60% lower than the level that would have stemmed from the pre‐event pattern. After the campaign resumed on March 19, the daily rate of VA inoculations further significantly declined. We observe a reduction of 63 daily doses per 100,000 inhabitants, implying a 55% lower vaccination rate. 2 weeks later, the negative effect persisted leading to a drop of 86 daily doses per 100,000 inhabitants, corresponding to a 58% lower level. Over the three post‐treatment weeks, 59 fewer VA average daily doses per 100,000 were administered with respect to the potential level.
To delve deeper into the possible drivers of hesitancy, we test whether the response to the VA suspension varied with the severity of the outbreak. We find that, after authorities resumed VA roll‐out, the gap between the two vaccines inoculation rates shrank with local COVID cases. We then exploit Google searches for the keyword “thrombosis” to proxy the public's attention to vaccine adverse events. The analysis shows that, after March 19, the VA vaccination rate decreased significantly more in regions displaying greater attention to the potential side effects of immunization. All results hold after controlling for day and region fixed effects and an index capturing the supply of the two vaccines across regions. Finally, we find that the public's interest in vaccine adverse events negatively correlates with the severity of the outbreak.
Overall, our findings suggest that the slowdown in the immunization campaign was demand‐driven. The 4‐day suspension caused a significant reduction in VA injections that persisted weeks after authorities restored the immunization campaign and reassured the public about the vaccine's safety.
The heterogeneity analysis helps disentangle the possible motives of hesitancy. The broadening gap between the two vaccines in regions displaying greater interest in “thrombosis” suggests that the VA suspension may have attracted the public's attention to vaccine adverse events related to VA injections, possibly inflating their risk. This evidence is in line with the literature on hesitancy that identifies concerns about the incidence and severity of adverse events as one of the main drivers of the decision to postpone or refuse vaccination (e.g., Brown et al., 2010; Carrieri et al., 2019; Carrieri et al., 2021; Chang, 2018; Qian et al., 2020; Smith et al., 2008). On the other hand, the outbreak's severity likely increased the perceived risk of contracting the disease, in line with previous evidence that outbreaks encourage vaccinations (Oster, 2018; Philipson, 1996).
In summary, the suspension may have unintendedly altered the balance between the perceived risks of contracting the disease and incurring vaccine adverse events for many people, resulting in increased reluctance to get the vaccine.
2. DATA
We draw data on COVID‐19 vaccines from an open data repository provided by the Italian Prime Minister's Office. 4 The database contains information on the number of doses supplied and injected for each manufacturer (Pfizer‐Biontech, Vaxzevria, and Moderna) in the Italian regions. Our period of analysis (February 18‐March 31, 2021) overlaps with two stages of the vaccination campaign. In the first stage (January‐February 2021), vaccines were administered to health workers and the elderly (over 80). The second stage (March‐June 2021) was initially devoted to school and university staff, patients with severe co‐morbidities, and adults over 60. 5
Figure 1 describes the daily total number of doses administered in Italy per 100,000 inhabitants. The solid red and blue lines describe the trends in VA and PB injections, respectively. Lines without markers show the respective trends resulting from local polynomial regressions. The inoculation rates for the two vaccines followed parallel patterns until the suspension of the first VA batch on March 11. From March 15–18, no VA doses were administered. On March 19 authorities resumed VA vaccinations and reassured the public about the vaccine's safety. In the following weeks, the trend in VA vaccinations flattened and started diverging sensibly from the PB pattern. The green line represents the trend in daily online searches for “thrombosis”, which peaks during the suspension week.
FIGURE 1.
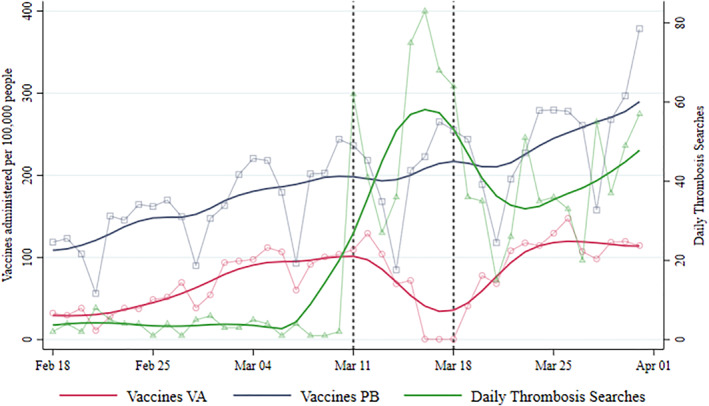
Administered vaccines and searches for “thrombosis”. Left axis: daily average number of VA and Pfizer‐Biontech (PB) vaccines administered in Italian regions per 100,000 inhabitants. Right axis: index of daily searches for the term “thrombosis”. Plots with markers represent raw data. Smoothed lines are obtained using local polynomial regressions
Figure 2 displays the geographical distribution of the variables we use in the heterogeneity analysis to understand the drivers of vaccine hesitancy after the VA suspension.
FIGURE 2.
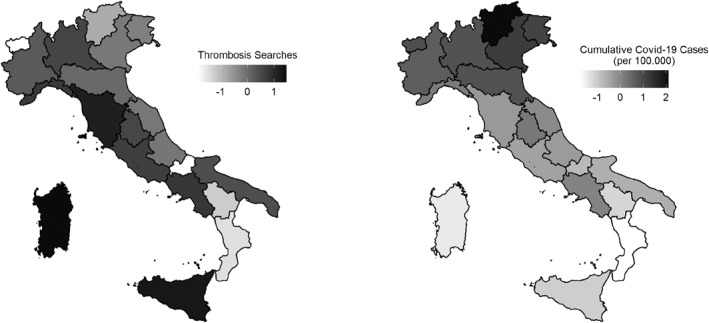
Cumulative COVID‐19 cases and searches for “thrombosis” across Italian regions. The map in the left panel illustrates the geographic distribution of the search intensity for the term “thrombosis” over 11–18 March 2021. The map in the right panel illustrates the geographic distribution of the cumulative number of COVID‐19 cases per 100,000 people from the beginning of the pandemic until March 11, 2021. Values in both plots are standardized using the national average and standard deviation
To proxy the public's attention to vaccine adverse events, we trace the daily ratio of queries for the keyword “thrombosis” to the number of total queries in each region (the search volume index, Search Volume Intensity (SVI), represented by the green dashed line in Figure 1). The left side of Figure 2 shows the search intensity for the term “thrombosis” in the suspension week (11–18 March 2021).
Previous studies show that Google trends can be used to trace the actual demand for information on a specific topic (Jetter, 2017). Queries for “thrombosis” signal the extent to which the public paid attention to the vaccine adverse events that the media were covering in our period of analysis. The index did not react uniformly to the suspension of the VA campaign. Instead, a visual inspection of Figure 2 and the empirical analysis in Section 4 show that searches negatively correlate with the severity of the outbreak after March 19, suggesting that the public devoted lesser attention to vaccine adverse events in the areas with higher risk of contracting the disease.
To capture the severity of the outbreak, which may affect the perceived risk of contracting the disease (Oster, 2018), we use the cumulative number of positive cases at the regional level. The right side of Figure 2 shows the geographic distribution of the cumulative number of COVID‐19 cases per 100,000 people from the beginning of the pandemic to March 11, 2021.
3. EXPERIMENT DESIGN
To understand the drivers of vaccine hesitancy, we exploit the quasi‐experimental setting arising from the temporary suspension of the VA vaccine between March 15 and 18, 2021, using a difference‐in‐differences design. We define the VA vaccine as our treatment group, with PB functioning as a control group. This choice stems from the specific layout of the Italian immunization campaign. The two vaccines shared the same logistic organization, with centralized management of the supply, distribution, booking, and administration of doses. Each hub could inject doses from both providers. However, hubs were not allowed to choose which vaccine to administer to priority groups. Candidate recipients were entitled to specific vaccines and could not choose between providers or switch their booking for a VA injection to PB. Potential differences in the Italian regions' ability to manage the logistics of vaccinations unlikely depended on targeted sub‐populations since targeting is homogeneous across regions.
A visual inspection of Figure 1 and the estimated coefficients of the event study (Figure 3 and Figure A2 in the Appendix) show that the trends in the two vaccines' inoculation rates were parallel until the suspension week. The mandatory break in VA vaccinations arguably drew the public's attention to adverse events, possibly raising uncertainty about the immunization side effects of the suspended vaccine. We expect the increased uncertainty to affect the trend in VA vaccination rate while sparing PB inoculations. This sudden divergence makes the trend in PB vaccinations a convenient counterfactual for the evolution in VA vaccinations in a difference‐in‐differences framework, where the cross‐sectional unit is the vaccine v (VA or PB) in region r, and time is expressed in days, d. In summary, we have a vr − d panel. The main equation we estimate is:
| (1) |
where Y vrd is the number of doses from supplier v (VA and PF) administered in region r on day d per 100,000 inhabitants.
FIGURE 3.
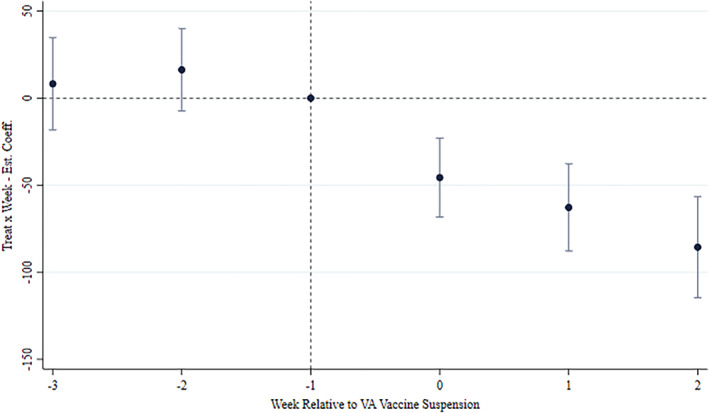
Event study of the main result. The plot reports the estimated β j coefficients from Equation (2) associated with the interaction between the Treat indicator and week dummies relative to the announcement of the VA vaccine suspension (w = −3…2). The dependent variable of the estimated regression is the number of doses administered in day d in region r per 100,000 inhabitants. The regression contains (i) Day FE, (ii) Supplier x Region FE, and (iii) the term Avail. × Region × Supplier, as the main specification in columns 2 in Table 1
The main coefficient of interest, β, relates to the interaction between the dummy variable Treat, which equals 1 for VA vaccines, and the dummy indicating the post‐announcement period, Post, that is from March 11, 2021. Our preferred specification includes Region × Supplier fixed effects, μ vr , and day fixed effects, τ d .
In addition, we control for the daily availability of the two vaccines across regions (Avail vrd ). 6 Avail enters Equation (1) as an interaction term with regional and supplier fixed effects, μ vr . This specification allows us to estimate an entire set of region‐vaccine‐specific supply effects on the injection rate. Finally, ɛ vrd are idiosyncratic errors.
Figure A1 in the Appendix shows the nationwide trend in the indicator of the availability of the two vaccines from February 18 to April 1, 2021. The supply of PB doses is relatively stable, different from VA that steadily decreases. Since PB doses were administered close to saturation in the post‐treatment period, any decrease in the PB vaccination rate due to a vaccine shortage would likely induce a downward bias in our estimates. As a result, the estimated effect in the paper would be a lower bound of the actual effect.
Our identification strategy relies on the assumption that the VA and PB vaccination rates followed a similar path before the suspension, allowing us to use PB vaccinations as a counterfactual for the evolution in the VA vaccination rate. To ensure that the suspension is not endogenously related to previous vaccination trends, we use an event‐study approach and re‐estimate our main specification allowing for leads and lags of the suspension period.
More specifically, we allow for three pre‐ and three post‐treatment effects. The baseline is the week before the withdrawal of the first VA batch on March 11, that is, j = −1. Leads and lags are identified by the coefficients β w for the 2 weeks before the baseline and the 3 weeks after the suspension. This model specification can be written as:
| (2) |
The lags coefficients β −2 and β −3 serve to strengthen analytically the visual evidence on the validity the common trend assumption provided in Figure 1. Coefficients for w ≥ 0 identify the evolution of the effect across weeks in the post‐suspension period.
To delve deeper into the drivers of vaccination rates across Italian regions, we add two triple‐interaction terms to our specifications. The first interaction includes the cumulative number of cases (Cumulative Cases r ), the search volume for “thrombosis” (Thrombosis Searches r ) over 11–18 March 2021, and the term Treat v × Post d in Equation (1). Similarly, we include the interaction between these two variables and the term Treat v × 1[d ∈ w] in Equation (2). 7 Both variables are standardized using the national average and standard deviation. Figure 2 shows the geographic distribution of these two measures.
4. RESULTS
Table 1 displays the estimates of Equation (1). In Columns 1–5, the outcome is the number of doses of the vaccine v, that is, VA and PF, administered in region r on day d per 100,000 inhabitants. Our main variable of interest is the interaction between the two dummies identifying the treated group, that is, VA, and the period following the suspension of the first VA batch (March 11, 2021). Column 2 reports the estimates including day and Region × Supplier fixed effects, while column also accounts for regional heterogeneity.
TABLE 1.
Main results
| Dep. variables | Administered vaccines (per 100,000 people) | Daily Thrombosis searches | ||||
|---|---|---|---|---|---|---|
| (1) | (2) | (3) | (4) | (5) | (6) | |
| Treat × post | −48.410*** | −59.347*** | −62.891*** | −56.265*** | −59.760*** | |
| (6.715) | (9.890) | (9.365) | (9.366) | (9.430) | ||
| Treat × post × cumulative cases | 36.058*** | 28.318*** | ||||
| (9.258) | (9.576) | |||||
| Treat × post × thrombosis searches | −39.999*** | −33.055*** | ||||
| (9.200) | (9.523) | |||||
| Post × cumulative cases | −1.974*** | |||||
| (0.651) | ||||||
| Region FE | ✓ | |||||
| Day FE | ✓ | ✓ | ✓ | ✓ | ✓ | ✓ |
| Region × supplier FE | ✓ | ✓ | ✓ | ✓ | ✓ | |
| Avail. × region × supplier | ✓ | ✓ | ✓ | ✓ | ||
| Observations | 1680 | 1680 | 1680 | 1680 | 1680 | 840 |
Note: The dependent variable in columns (1)‐(5) is the number of doses administered in day d in region r per 100,000 inhabitants. The dependent variable in column (6) is the region‐specific daily indicator of Search Volume Intensity (SVI) for the term “thrombosis”. The variable Treat equals 1 for VA vaccines, and 0 for PB vaccines. The variable Cumulative cases measures the cumulative number of cases in region r per 100,000 people from the beginning of the COVID‐19 pandemic until the week before the suspension of VA vaccines. The variable Thrombosis searches measures the SVI for the term “thrombosis” in region r in the week of the suspension announcement (11–18 March 2021). Variables Cumulative cases and Thrombosis searches are standardized using the national average and standard deviation. The variable Avail measures the availability of vaccines in region r in day d, separately for VA and PB. It is computed as the fraction of not‐administered vaccines out of the number of doses received until day d − 1. Robust standard errors in parentheses.
*p < 0.10, **p < 0.05, ***p < 0.0.
Columns 3–5 report the heterogeneity in the treatment effects. Estimates in column 3 include a triple interaction between the VA and suspension dummies and the cumulative number of COVID cases. Estimates in Column 4 include an interaction term between the two dummies and the SVI for “thrombosis”. Column 5 accounts for both the interactions.
Finally, Column 6 reports the result of a similar regression of the daily volume of searches for “thrombosis” on the interaction between the cumulative number of COVID cases and the indicator for the post‐suspension period. The public's attention to vaccine adverse events in the post‐suspension period rose significantly less in areas characterized by a greater severity of the outbreak.
We find a large drop in the total number of administered doses per 100,000 inhabitants. The negative effect is strongly significant at the 1% level, indicating that the suspension decreased the number of doses by almost 60 per 100,000 inhabitants with respect to the average value observed in the control group before the suspension, resulting in a vaccination rate 60% lower than the level that would have stemmed from the pre‐suspension pattern. 8
Columns 4–6 show that after VA vaccinations resumed on March 19, the gap between the two vaccination rates narrows with the severity of the outbreak and broadens with the public's attention to vaccine adverse events. A standard deviation increase in the cumulative number of cases is associated with an increase of the vaccination rate by approximately 36 doses per 100,000 inhabitants. By contrast, a standard deviation increase in the queries for “thrombosis” causes a further drop in the VA vaccination rate by approximately 40 doses per 100,000 inhabitants.
To strengthen the visual evidence provided in Figure 1 and mitigate concerns about the validity of the common trend assumption, we rely on the dynamics of the effects, particularly before March 11, when authorities withdrew the first VA batch. Figure 3 shows there is no evidence of a differential take‐up between the treated and the control group before the suspension. In all cases, we observe that the coefficients in the pre‐suspension period are never statistically different from zero. 9 In the Appendix we provide a daily event study showing there are no anticipation effects related to news reports of blood disorders among VA recipients before the suspension (Figure A2). This evidence suggests that the spreading of alarming news about vaccine adverse events did not prompt a statistically significant reaction in candidate recipients. Instead, people seemingly started to revise their assessment of the two risks informing vaccination decisions when doubts about the safety of the VA vaccine arose from health authorities. Table A1 in the Appendix also shows the absence of statistically significant lead interaction terms when estimating heterogeneous effects. This evidence further corroborates the validity of the parallel trend assumption.
In the suspension week (w = 0) daily injected doses decreased by almost 46 per 100,000 inhabitants, resulting in a 60% lower vaccination rate with respect to the level that would have stemmed from the pre‐suspension pattern. The week after the campaign resumed on March 19, the daily rate of VA inoculations further diverged from the counterfactual level, resulting in 63 less daily doses per 100,000 inhabitants (−55%). 3 weeks later, the deviation was still significant and reached 86 less daily doses per 100,000 inhabitants (−58%).
This evidence, jointly with the more substantial decline in VA vaccinations in regions displaying greater attention to adverse events after the campaign resumed, suggests that the suspension may have unintendedly drawn the public's attention to news reports covering blood cases among VA recipients. 10
Overall, our findings are consistent with previous evidence that the severity of an outbreak encourages vaccination (e.g., Oster, 2018; Philipson, 1996), while alarming information that inflates the risk of adverse events leads to hesitancy (e.g., Brown et al., 2010; Carrieri et al., 2019; Chang, 2018; Qian et al., 2020). Previous studies on the impact of the measles‐mumps‐rubella (MMR) vaccine‐autism controversy analyzed a longer time period spanning years prior and after the controversy (e.g., Chang, 2018). Instead, our work covers a much limited period spanning a few weeks before and after the suspension of the Vaxzevria vaccine. Therefore, differently from Smith et al. (2008) and Chang (2018), we cannot infer the persistence of the treatment effects in the long run. In addition, the aggregated data we employ in the analysis do not allow us to observe the motives that led many people to postpone or refuse vaccination directly. Though necessarily having a short‐term perspective, our study has the advantage of providing clues on the drivers of COVID‐19 vaccine hesitancy when the pandemic and the immunization campaign are still ongoing.
5. CONCLUSION
The empirical analysis in this paper documents the slowdown in the COVID immunization campaign in the wake of the Vaxzevria vaccine suspension, suggesting that the decline was demand‐driven. Our findings support the view that the decision to get the vaccine results from a rational choice weighing the two alternative risks of contracting the disease or incurring vaccine side effects. The heterogeneity in treatment effects points to the possibility that the VA suspension unintendedly altered the balance between the two perceived risks for many people, making them reluctant to get vaccinated. The broadening gap between the two vaccines in regions displaying greater attention to adverse events after vaccinations resumed suggests that the suspension may have inflated the risk of vaccine side effects, despite health authorities repeatedly reassured the public on vaccine's safety after the campaign resumed. On the other hand, the gap narrowed with the severity of the outbreak, suggesting that COVID penetration may have deterred hesitancy. Altogether, our results reaffirm the importance of providing accurate institutional information about the relative incidence of the alternative risks that individuals weigh when rationally deciding whether to get vaccinated.
CONFLICT OF INTEREST
No.
ACKNOWLEDGMENTS
Open Access Funding provided by Universita degli Studi di Cagliari within the CRUI‐CARE Agreement.
FIGURE A1.
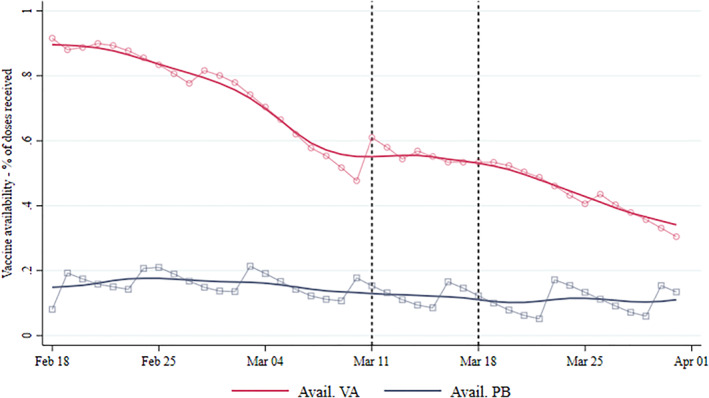
Vaccines availability 18 Feb‐1 Apr. Daily average number of VA and Pfizer‐Biontech (PB) vaccines available in Italian regions. Vaccine availability for region r in day d is computed as the fraction of not‐administered vaccines out of the number of doses received until day d − 1. Plots with markers represent raw data. Smoothed lines are obtained using local polynomial regressions
FIGURE A2.
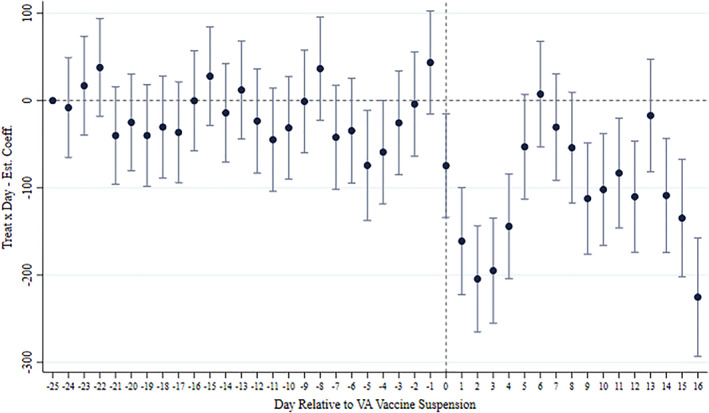
Daily event study of the main result. The plot reports the estimated coefficients of the interaction between the Treat indicator and day dummies relative to the announcement of the VA vaccine suspension (March 15, 2021). The dependent variable of the estimated regression is the number of vaccines administered in day d in region r per 100,000 inhabitants. The regression contains (i) Day FE, (ii) Supplier x Region FE, and (iii) the term Avail. × Region × Supplier, as the main specification in column 2 in Table 1
TABLE A1.
Heteogeneous effects: event study
| Before | After | ||
|---|---|---|---|
| Treat × 1[week = −3] | 6.894 | Treat × 1[week = 0] | −46.355*** |
| (14.914) | (11.449) | ||
| Treat × 1[week = −2] | 16.476 | Treat × 1[week = 1] | −62.266*** |
| (13.097) | (12.234) | ||
| Treat × 1[week = −3] × cumulative cases | −16.385 | Treat × 1[week = 2] | −81.925*** |
| (16.298) | (14.36) | ||
| Treat × 1[week = −2] × cumulative cases | −3.439 | Treat × 1[week = 0] × cumulative cases | 19.983* |
| (14.154) | (11.924) | ||
| Treat × 1[week = −3] × thrombosis searches | 2.633 | Treat × 1[week = 1] × cumulative cases | 39.495*** |
| (13.683) | (12.992) | ||
| Treat × 1[week = −2] × thrombosis searches | 16.719 | Treat × 1[week = 2] × cumulative cases | 56.378*** |
| (12.662) | (16.706) | ||
| Treat × 1[week = 0] × thrombosis searches | −25.514** | ||
| (12.076) | |||
| Treat × 1[week = 1] × thrombosis searches | −31.013** | ||
| (13.182) | |||
| Treat × 1[week = 2] × thrombosis searches | −24.071 | ||
| (16.002) | |||
| Day FE | ✓ | ||
| Region × supplier FE | ✓ | ||
| Avail × region × supplier FE | ✓ | ||
| Observations | 1680 | ||
Note: The dependent variable is the number of vaccines administered in day d in region r per 100,000 inhabitants. The variable Treat equals 1 for VA vaccines, and 0 for PB vaccines. The variable Cumulative cases measures the cumulative number of cases in region r per 100,000 inhabitants from the beginning of the COVID‐19 pandemic until the week before the suspension of VA vaccines. The variable Thrombosis searches measures the relative search intensity for the term “Thrombosis” in region r in the week of the suspension announcement March 11, 2021 ‐ March 18, 2021. Variables Cumulative cases and Thrombosis searches are standardized using the national average and standard deviation. The variable Avail measures the availability of vaccines in region r in day d, separately for VA and PB. It is computed as the fraction of not‐administered vaccines out of the number of doses received up to day d − 1. Robust standard errors in parentheses.
*p < 0.10, **p < 0.05, ***p < 0.0.
Deiana, C. , Geraci, A. , Mazzarella, G. , & Sabatini, F. (2022). Perceived risk and vaccine hesitancy: Quasi‐experimental evidence from Italy. Health Economics, 31(6), 1266–1275. 10.1002/hec.4506
We thank the editor Gyrd‐Hanse, and two referees for their comments and suggestions.
ENDNOTES
Unselfish individuals may also internalize the social benefits of vaccination in their decision‐making (e.g., Wells et al., 2020).
At the moment of the suspension, the ChAdOx1‐S vaccine was called Astrazeneca (AZ). On April 1, the European Medicines Agency (EMA) approved AZ rebranding as Vaxzevria. For simplicity, we refer to ChAdOx1‐S as Vaxzevria (VA) throughout the paper.
We exclude the Moderna vaccine from the analysis for two reasons. First, the number of Moderna doses supplied and inoculated was small compared to the other providers. Until March 31, roughly 815,000 Moderna doses were administered in Italy, compared to 2,655,000 and 8,700,000 for Vaxzevria (VA) and Pfizer‐Biontech (PB), respectively. Perhaps more importantly, the trend of Moderna vaccinations before the temporary VA ban was very different from PB and VA, preventing the adoption of the Difference‐in‐Differences design used in the analysis.
In June 2021, the definition of target groups was relaxed with the establishment of “open days” allowing every adult to book vaccination.
Avail is an indicator of the number of doses of vaccine v that are available in region r on day d. This indicator is computed as , with Adm vrk being the injected doses and Rec vrk the doses supplied to vaccination hubs.
When we estimate triple interaction terms, we include the relative double interactions in the estimating equations.
Percent deviations are computed as the ratio between the estimated effects and the computed counterfactual levels. The latter are obtained subtracting the estimated effect to the mean of the fitted values of VA vaccines, separately for each week.
Although not a formal proof, this test is usually interpreted as supportive of the parallel trend assumption.
News reports about rare blood disorders among vaccine recipients spread from early January 2021, mainly regarding Moderna and PB vaccines (e.g., https://www.nytimes.com/2021/01/12/health/covid‐vaccine‐death.html). News about severe coagulation disorders among VA recipients spread towards early on February 2021, leading to the suspension of specific VA batches in several countries in the first week of March (e.g., https://www.bloomberg.com/news/articles/2021‐01‐18/what‐to‐know‐about‐vaccine‐related‐deaths‐allergies‐quicktake). However, we observe a decline in the VA vaccination rate only after March 18, when the campaign resumed after the suspension.
DATA AVAILABILITY STATEMENT
Data derived from public domain resources Template for data availability statement: The data that support the findings of this study were derived from the following resources available in the public domain: (1) data on vaccinations are taken from https://github.com/italia/covid19‐opendata‐vaccini; (2) data on COVID cases are taken from https://github.com/pcm‐dpc/COVID‐19 (3) data on Google queries search volume index are taken from https://trends.google.it/trends/?geo=IT.
REFERENCES
- Betsch, C. , Ulshöfer, C. , Renkewitz, F. , & Betsch, T. (2011). The influence of narrative v. statistical information on perceiving vaccination risks. Medical Decision Making, 31(5), 742–753. [DOI] [PubMed] [Google Scholar]
- Binder, S. , & Nuscheler, R. (2017). Risk‐taking in vaccination, surgery, and gambling environments: Evidence from a framed laboratory experiment. Health Economics, 26(S3), 76–96. [DOI] [PubMed] [Google Scholar]
- Bohm, R. , Betsch, C. , & Korn, L. (2016). Selfish‐rational non‐vaccination: Experimental evidence from an interactive vaccination game. Journal of Economic Behavior and Organization, 131, 183–195. [Google Scholar]
- Brewer, N. , Gibbons, F. X. , Gerrard, M. , McCaul, K. D. , & Weinstein, N. D. (2007). Meta‐analysis of the relationship between risk perception and health behavior: The example of vaccination. Health Psychology, 26(2), 136–145. [DOI] [PubMed] [Google Scholar]
- Brown, K. F. , Kroll, J. S. , Hudson, M. J. , Ramsay, M. , Green, J. , Vincent, C. A. , Fraser, G. , & Sevdalis, N. (2010). Omission bias and vaccine rejection by parents of healthy children: Implications for the influenza A/H1N1 vaccination programme. Vaccine, 28(25), 4181–4185. [DOI] [PubMed] [Google Scholar]
- Carrieri, V. , Lagravinese, R. , & Resce, G. (2021). Predicting vaccine hesitancy from area‐level indicators: A machine learning approach. Health Economics, 30(12), 3248–3256. [DOI] [PubMed] [Google Scholar]
- Carrieri, V. , Madio, L. , & Principe, F. (2019). Vaccine hesitancy and (fake) news: Quasi experimental evidence from Italy. Health Economics, 28, 1377–1382. [DOI] [PMC free article] [PubMed] [Google Scholar]
- Chang, L. V. (2018). Information, education, and health behaviors: Evidence from the MMR vaccine autism controversy. Health Economics, 27, 1043–1062. [DOI] [PubMed] [Google Scholar]
- Greinacher, A. G. , Thiele, T. , Warkentin, T. E. , Weisser, K. , Kyrle, P. A. , & Eichinger, S. (2021). Thrombotic Thrombocytopenia after ChAdOx1 nCov‐19 Vaccination. New England Journal of Medicine, 384, 2092–2101. [DOI] [PMC free article] [PubMed] [Google Scholar]
- Jetter, M. (2017). The effect of media attention on terrorism. Journal of Public Economics, 153, 32–48. [Google Scholar]
- Oster, E. (2018). Does disease cause vaccination? Disease outbreaks and vaccination response. Journal of Health Economics, 57, 90–101. [DOI] [PMC free article] [PubMed] [Google Scholar]
- Philipson, T. (1996). Private vaccination and public health: An empirical examination for U.S. measles. Journal of Human Resources, 31(3), 611–630. [Google Scholar]
- Qian, M. , Chou, S.‐Y. , & Lai, E. K. (2020). Confirmatory bias in health decisions: Evidence from the MMR‐autism controversy. Journal of Health Economics, 70, 102284. 10.1016/j.jhealeco.2019.102284 [DOI] [PubMed] [Google Scholar]
- Savulescu, J. , Pugh, J. , & Wilkinson, D. (2021). Balancing incentives and disincentives for vaccination in a pandemic. Nature Medicine, 27, 1500–1503. 10.1038/s41591-021-01466-8 [DOI] [PubMed] [Google Scholar]
- Scully, M. D. , Singh, D. , Lown, R. , Poles, A. , Solomon, T. , Levi, M. D. , Goldblatt, D. , Kotoucek, M. D. , Thomas, W. , & Lester, W. (2021). Pathologic Antibodies to Platelet Factor 4 after ChAdOx1 nCoV‐19 Vaccination. New England Journal of Medicine, 384, 2202–2211. [DOI] [PMC free article] [PubMed] [Google Scholar]
- Smith, M. J. , Ellenberg, S. S. , Bell, L. M. , & Rubin, D. M. (2008). Media coverage of the measles‐mumps‐rubella vaccine and autism controversy and its relationship to MMR immunization rates in the United States. Pediatrics, 121(4), 836–843. [DOI] [PubMed] [Google Scholar]
- Weinstein, N. D. (2000). Perceived probability, perceived severity, and health‐protective behavior. Health psychology, 19(1), 65–74. [DOI] [PubMed] [Google Scholar]
- Wells, C. R. , Huppert, A. , Fitzpatrick, M. C. , Pandey, A. , Velan, B. , Singer, B. H. , Bauch, C. T. , & Galvani, A. P. (2020). Prosocial polio vaccination in Israel. Proceedings of the National Academy of Science, 117(23), 13138–13144. [DOI] [PMC free article] [PubMed] [Google Scholar]
- WHO . (2014). Report of the sage working group on vaccine hesitancy (Technical report). World Health Organization. [Google Scholar]
Associated Data
This section collects any data citations, data availability statements, or supplementary materials included in this article.
Data Availability Statement
Data derived from public domain resources Template for data availability statement: The data that support the findings of this study were derived from the following resources available in the public domain: (1) data on vaccinations are taken from https://github.com/italia/covid19‐opendata‐vaccini; (2) data on COVID cases are taken from https://github.com/pcm‐dpc/COVID‐19 (3) data on Google queries search volume index are taken from https://trends.google.it/trends/?geo=IT.