

Abstract
How people make perceived message effectiveness (PME) judgments remains mostly unexplored. This study assessed whether people need to spontaneously think about message effectiveness in order to report the message as effective on rating scales and investigated emotions as precursors to PME. After viewing one of four e-cigarette prevention messages, 1,968 adult current and former smokers and non-smokers freely expressed thoughts about the messages in an open-ended question, and answered close-ended PME items. Four expressed PME variables (positive message perceptions, negative message perceptions, positive effect perceptions, and negative effect perceptions) were coded (1 = present, 0 = absent) in the open-ended responses and all were significantly associated with measured PME. Positive and negative emotions predicted both expressed and measured PME. Negative message perceptions was the only expressed PME construct that mediated the relationships between emotions and measured PME, and outcomes (perceived risk and behavioral intentions). This suggests that messages may not need to induce effectiveness thoughts to be reported as effective, but thoughts of message ineffectiveness are a useful indicator deserving further research.
Keywords: perceived message effectiveness (PME), perceived effectiveness (PE), persuasion, electronic cigarettes, message
Perceived message effectiveness (PME) refers to people’s belief regarding the extent to which a message would affect them personally in terms of specific message objectives (Yzer et al., 2015). PME is widely used in formative research, particularly for health communication campaigns, and its use is growing (Noar, Bell, et al., 2018). It is an easy and cost-effective way to evaluate multiple messages, but our understanding of what PME is and its related psychological state is limited. Although research on PME has come a long way from treating PME as a “conceptual primitive” (Dillard et al., 2007), p. 617), the concept remains undertheorized. Specifically, the question of how people make PME judgements is still largely unexplored but might be central to understanding the relationship between PME judgements and actual effects of messages (Noar, Barker, et al., 2020; Noar, Barker, et al., 2018; Yzer et al., 2015; Yzer et al., 2011). In this paper, we explore whether people need to spontaneously think about message effectiveness in order to report the message as effective on rating scales.
What is PME?
Most research on conceptualizing PME has been inductive, driven by the desire to organize and make sense of the multiple ways PME has been measured and to bring order to the chaos by determining the dimensions of PME (Dillard & Ye, 2008; Yzer et al., 2015). Most recently, PME has been conceptualized as two broad types of perceptions: message perceptions and effect perceptions (Baig et al., 2019; Noar, Bell, et al., 2018). Message perceptions deal with how people evaluate the message and its attributes, such as how convincing, believable, and attention-grabbing a message is. Effect perceptions focus on the beliefs about what effects the message would likely have on a specific target audience (self or others), such as to what extent the message would make the viewer want to get vaccinated.
Past research overwhelmingly used close-ended measures of PME (Noar, Bell, et al., 2018), such as asking respondents to indicate, on a 5-point scale, whether they agree that “This message discourages me from wanting to smoke” (Baig et al., 2019). To help understand how participants arrive at the numbers they select in response to such questions, it is useful to examine how perceptions of messages effectiveness are spontaneously expressed as reactions to the messages. Do people need to think about message effectiveness for the message to be reported as effective? In addition, given the most recent conceptualization of PME as message perceptions and effects perceptions, it is necessary to evaluate how different types of expressed PME are related to measured PME. Our study asked participants to write down all thoughts that came to their mind when viewing the message and coded their open-ended responses for presence of message and effect perceptions (we refer to it as “expressed PME”). We also differentiated between positive and negative expressions of each type of expressed PME because viewers could comment on the message being effective and criticize the message attributes. Our goal was to evaluate how these four expressed PME variables are associated with close-ended measured PME (referred to as “measured PME”). For measured PME, in this study we used questions that tapped into effects perceptions only (rather than both message and effects perceptions) because, like Baig et al. (2019), we believe that the ultimate goal of health prevention messages is to change behavior, and PME measures focused on effects perceptions are conceptually close to behavioral outcomes. Also, in a model with both message perceptions and effects perceptions, only effects perceptions predicted actual effectiveness (perceived risk, attitudes, and behavioral intentions) (Noar, Rohde, et al., 2020). For these reasons and to reduce the burden on participants, we measured PME using close-ended questions for effects perceptions only. We hypothesized that:
H1: Positive expressed PME (positive expressed message perceptions and positive expressed effects perceptions) will be positively associated with measured PME, and negative expressed PME (negative expressed message perceptions and negative expressed effects perceptions) will be negatively associated with measured PME.
How Do People Make Judgements About PME?
To help answer this question, it is useful to consider theories of information processing. According to the dual-process theories of information processing, people make decisions using two different systems (Epstein, 1994). Analytic system is deliberate, more effortful, conscious, slow, and relies on logical connections between symbols, words, and numbers. Experiential system is affective, holistic, often preconscious, rapid, and uses associative connections between images, narratives, and emotions (Epstein, 1994). The two systems are similar to the dichotomies described in the dual-process social psychological theories, such as heuristic-systematic model (Chaiken & Trope, 1999) and the central-peripheral processing (Petty & Cacioppo, 1986).
Prior theorizing about precursors to PME judgements sometimes brought up constructs from the analytic system, such as “lay beliefs”, defined as “(implicit or explicit) beliefs about what persuades” (O’Keefe, 1993, p. 231). However, others pointed out that affect-based experiential decision-making would be more appropriate to study as a precursor to PME (Dillard & Peck, 2000; Yzer et al., 2011). Yzer and colleagues research on emotional arousal as antecedents to PME revealed that emotional valence and the level of arousal were associated with PME ratings (Yzer et al., 2011). In the field of risky health behaviors, such as tobacco use, the mostly automatic affective decisions from the experiential system often come before and drive the slower analytical reasoning (Finucane et al., 2000; Zajonc, 1980). Indeed, affect predicted tobacco use intentions and behaviors (Marks et al., 2008; Popova et al., 2018; Slovic et al., 2007). It is likely that the inputs from the experiential system, such as emotional reactions to the messages, would be used by viewers to make quick judgements on whether they deem an ad to be effective in changing their behaviors.
In past research on affect as predictor of PME, Yzer (2011) found that advertisements that elicited high emotional arousal and negative emotions were perceived as the most convincing by adolescents. Dillard and Peck (2000) found that specific discrete emotions such as fear, anger, and happiness were associated with higher perceived effectiveness. Because messages might evoke both positive and negative emotions, in this study we investigated the role of negative emotions separately from positive emotions. For negative emotions, we measured seven emotions and grouped them into a single scale because past studies did not identify a single most important negative emotion in reactions to e-cigarette messages and because our current study and past research indicated high correlations between discrete negative emotions. For positive emotions, based on our past research, hope was the only positive emotion that was consistently associated with important outcomes such as perceptions of risk and behavioral intentions around e-cigarettes, while other positive emotions, such as happiness and contentment, were not (Popova et al., 2017; Yang et al., 2019). Similarly, Dillard and Peck (2000) found that contentment was not significantly associated with perceived message effectiveness. Thus, we used hope as a positive emotion in this study rather than measuring multiple positive emotions and creating an index. We used close-ended measures of emotions and did not code emotions in the open-ended responses. Based on past findings (Dillard & Peck, 2000; Yzer et al., 2011), we hypothesized and asked:
H2: Negative and positive emotions will be positively associated with measured PME.
RQ1: To what extent are negative and positive emotions associated with expressed PME variables (positive and negative message perceptions and effect perceptions)?
RQ2a: Do expressed PME variables mediate the paths between emotions and measured PME?
RQ2b: Does measured PME mediate the paths between emotions and outcomes?
RQ2c: Do expressed PME variables and measured PME mediate the paths between emotions and outcomes?
We explore these questions in the context of messages communicating about harms of electronic cigarettes (e-cigarettes). E-cigarettes are tobacco products that use battery power to heat a liquid solution of nicotine, flavors, and propylene glycol and/or vegetable glycerin to produce aerosol for the user to inhale. Combusted cigarette smoke contains over 7,000 harmful chemicals, but e-cigarettes (which do not involve combustion) expose users to lower levels of some of the chemicals (National Academies of Sciences, 2018). E-cigarettes would bring population-level benefit if smokers who are otherwise not willing to quit switched to e-cigarettes completely; however, the patterns of use indicate that most e-cigarette users continue to smoke and that the rates of e-cigarette use among non-smokers, particularly youth, are skyrocketing, necessitating preventive e-cigarette messaging (Cullen et al., 2019; McMillen et al., 2014), which is the focus of this study. We conducted a study in 2018 evaluating four different e-cigarette prevention messages developed by our team. Our earlier publications presented findings on the effects of individual messages (Owusu et al., 2020) and how the content of open-ended responses differed by message (Li et al., 2020).
Method
Participants and Procedures
This study was a part of a larger experimental study examining effects of e-cigarette prevention messages. Participants were randomized to view one of four e-cigarette prevention messages focused on different themes (harmful chemicals, uncertain ingredients, economic costs, and tobacco industry’s deception) or a control message (bottled water ad).
The main study included 2,801 U.S. adults from Toluna online panel, who were recruited through various online strategies, such as pay-per-click, website referral, web banners, and affiliate marketing. Inclusion criteria were being 18 years old or older and being either a current smoker (smoked at least 100 cigarettes in their lifetime and were currently smoking cigarettes every day or some days), a recent former smoker (smoked at least 100 cigarettes in their lifetime but were not currently smoking and quit in the past 2 years), or never smoker (never smoked or smoked less than 100 cigarettes). After excluding participants in the control group (n = 552) and those who provided invalid open-ended responses (e.g., “1234” “none”; n = 381), this article reports on the results from 1,968 participants. Participants were 48 years old on average (range: 18–91); 53% (1,043) women; 80% (1,574) White, 11% (216) Black; and 30% (590) had high school or lower education, 35% (689) had some college education, and 35% (689) had a bachelor’s or higher degree. Smoking status included current smokers (58%, 1,141), recent former smokers (6%, 118), and never smokers (36%, 708). Most participants never used e-cigarettes (60%, 1,181), 24% (472) were current (past 30 day) users, and 16% (315) used e-cigarettes before, but not in the past 30 days.
The study was approved by the Georgia State University IRB and all participants provided informed consent. Before the exposure, participants answered questions about sociodemographic factors. Immediately after message exposure, participants completed the open-ended task, and then completed measures of PME, emotions, and other outcomes. At the conclusion of the survey, participants were shown a debriefing page saying that the messages were used for research only and had not been approved by any public health or federal agency and referred to smoking cessation resources.
Measures
Open-ended perceived message effectiveness (expressed PME).
Immediately after seeing the message, participants were asked to “type in every thought that came to mind while looking at that picture.” They were given an unlimited amount of time and instructed to list as many thoughts as possible. All 1,968 participants provided open-ended responses.
We conducted a content analysis of open-ended responses, coding for four types of PME: (a) positive message perceptions (310 out of 1,968, 15.75%), operationally defined as participants positively mentioning the message attributes and features, such as creditability, understandability, and other aspects of message design (e.g., “I like the design look of the ad”); (b) negative message perceptions (165, 8.38%), defined as negative mentions of message attributes and features (e.g., “The image is pretty plain and irrelevant to the message”); (c) positive effect perceptions (68, 3.46%), defined as respondents mentioning that messages had positive influences on their own or other people’s perceptions and behaviors, such as increasing their negative attitudes toward vaping and motivating them to quit vaping (e.g., “Looking at the ad made me not want to use e-cigs”); and (d) negative effect perceptions (27, 1.37%), defined as participants mentioning that the messages were not effective in changing people’s attitudes or behaviors in the desired direction (e.g., “The ad will not make people quit vaping”).
The four PME types were not mutually exclusive and coded as either present (1) or absent (0). A single response could have multiple PME variables. For instance, “It immediately caught my attention and made me want to learn more about the situation and what it means to me,” included positive message perceptions and positive effect perceptions. The response, “The message is from a trustworthy source, but I don’t like the color of the ad,” included positive and negative message perceptions. Thus, instead of simply coding the existence of message perceptions and effect perceptions respectively, we differentiated the valence of the two PME perceptions. This allowed us to explore the nuances of people’s PME perceptions and because each expressed PME variable was binary (1 = Present, 0 = Absent), we were able to perform data analyses based on those variables. Details on coder training and procedures, as well as the descriptive results by message are presented in Li et al. (2020). Briefly, all research team members (the first author, the second author, and a research assistant) read the open-ended responses to be familiar with the data and refined an initial codebook created by the second author. The second author then conducted a 3-hour training with the research assistant, in which the codebook was finalized. Then, the two members independently coded a random 20% of all responses. The results were compared and intercoder reliability were calculated. After another 3-hour meeting where coding discrepancies were discussed and more trainings were performed, the two coders than separately code the remaining data. Intercoder reliability (Krippendorff’s alpha) ranged between .94 and .96.
Close-ended perceived message effectiveness (measured PME).
Two items, “The message makes me more concerned about the health risks of e-cigarettes” and “The message motivates me to not use e-cigarettes,” evaluated measured PME on a 9-point scale (1 = not at all, 9 = extremely). The two items were highly correlated, r(1,968) = .69, p < .001, and averaged to index measured PME (M = 6.61, SD = 2.47).
Emotions.
Negative emotions were assessed by asking to what extent (1 = not at all, 9 = extremely) participants felt sad, angry, afraid, guilty, disgusted, worried, and ashamed while looking at the message. Items were averaged, with higher values indicating higher levels of negative emotions (M = 3.68, SD = 2.08, Cronbach’s α= .91). A single item (hope) assessed positive emotions (M = 2.62, SD = 2.30).
Perceived harm.
On a 7-point scale (0 = not at all, 6 = extremely), a single item, “In your opinion, how harmful is using e-cigarettes to general health?” evaluated perceived harm (M = 4.53, SD = 1.57).
Behavioral intentions.
On a 9-point scale (1 = not at all open, 9 = extremely open), a single item, “How open are you to trying e-cigarettes in the future?” evaluated behavioral intentions (M = 2.99, SD = 2.67).
Covariates.
Control variables included message conditions, gender (men vs. women), race (White vs. people of color), education (less than bachelor’s degree vs. bachelor’s degree or higher), being a current vaper (past 30- day e-cigarette user), and being a current smoker.
Data Analysis
Descriptive and correlation analyses were conducted in IBM SPSS v26. Path analyses using Mplus 8.4 tested hypotheses and explored research questions. Data were estimated using maximum likelihood estimation. There were no missing data. Model-based tests for mediated effects were utilized. We used the following criteria for the model fit evaluation: a model with RMSEA ≤ .06, CFI ≥ .95, TLI ≥ .95, and SRMR ≤ .05 is considered well fitted (Hu & Bentler, 1999).
Results
Path Analysis
Table 1 shows bivariate correlations between the study variables. Model 1 used perceived harm as an outcome (Figure 1) and Model 2 used behavioral intentions (Figure 2). Both models controlled for message condition and participants’ gender, age, race, education, vaping, and smoking status. Both models fit the data well; Model 1: χ2(10) = 19.964, p = .029; RMSEA = .023, 95% CI [.007, .037]; CFI = .995, TLI = .962; SRMR = .007; Model 2: χ2(10) = 12.060, p = .281; RMSEA = .010, 95% CI [.000, .028]; CFI = .999, TLI = .992; SRMR = .005. Relationships between emotions, expressed PME variables, and measured PME were consistent between the two models.
Table 1.
Correlation Analysis Results
| 1 | 2 | 3 | 4 | 5 | 6 | 7 | 8 | |
|---|---|---|---|---|---|---|---|---|
| 1. Positive emotions | ||||||||
| 2. Negative emotions | .20*** | |||||||
| 3. Positive message perceptions | .07** | −.07** | ||||||
| 4. Negative message perceptions | −.09*** | −.13*** | .00 | |||||
| 5. Positive effect perceptions | .03 | .04 | −.02 | −.02 | ||||
| 6. Negative effect perceptions | −.06** | −.05* | −.04 | .03 | .00 | |||
| 7. Measured PME | .12*** | .41*** | .01 | −.33*** | .07** | −.10*** | ||
| 8. Perceived harm | −.06* | −.11*** | −.04 | .00 | −.01 | −.00 | −.08** | |
| 9. Behavioral intentions | .23*** | .01 | −.00 | .10*** | −.01 | .03 | −.32*** | −.06** |
Note. N = 1,968.
p < .05,
p< .01,
p < .001.
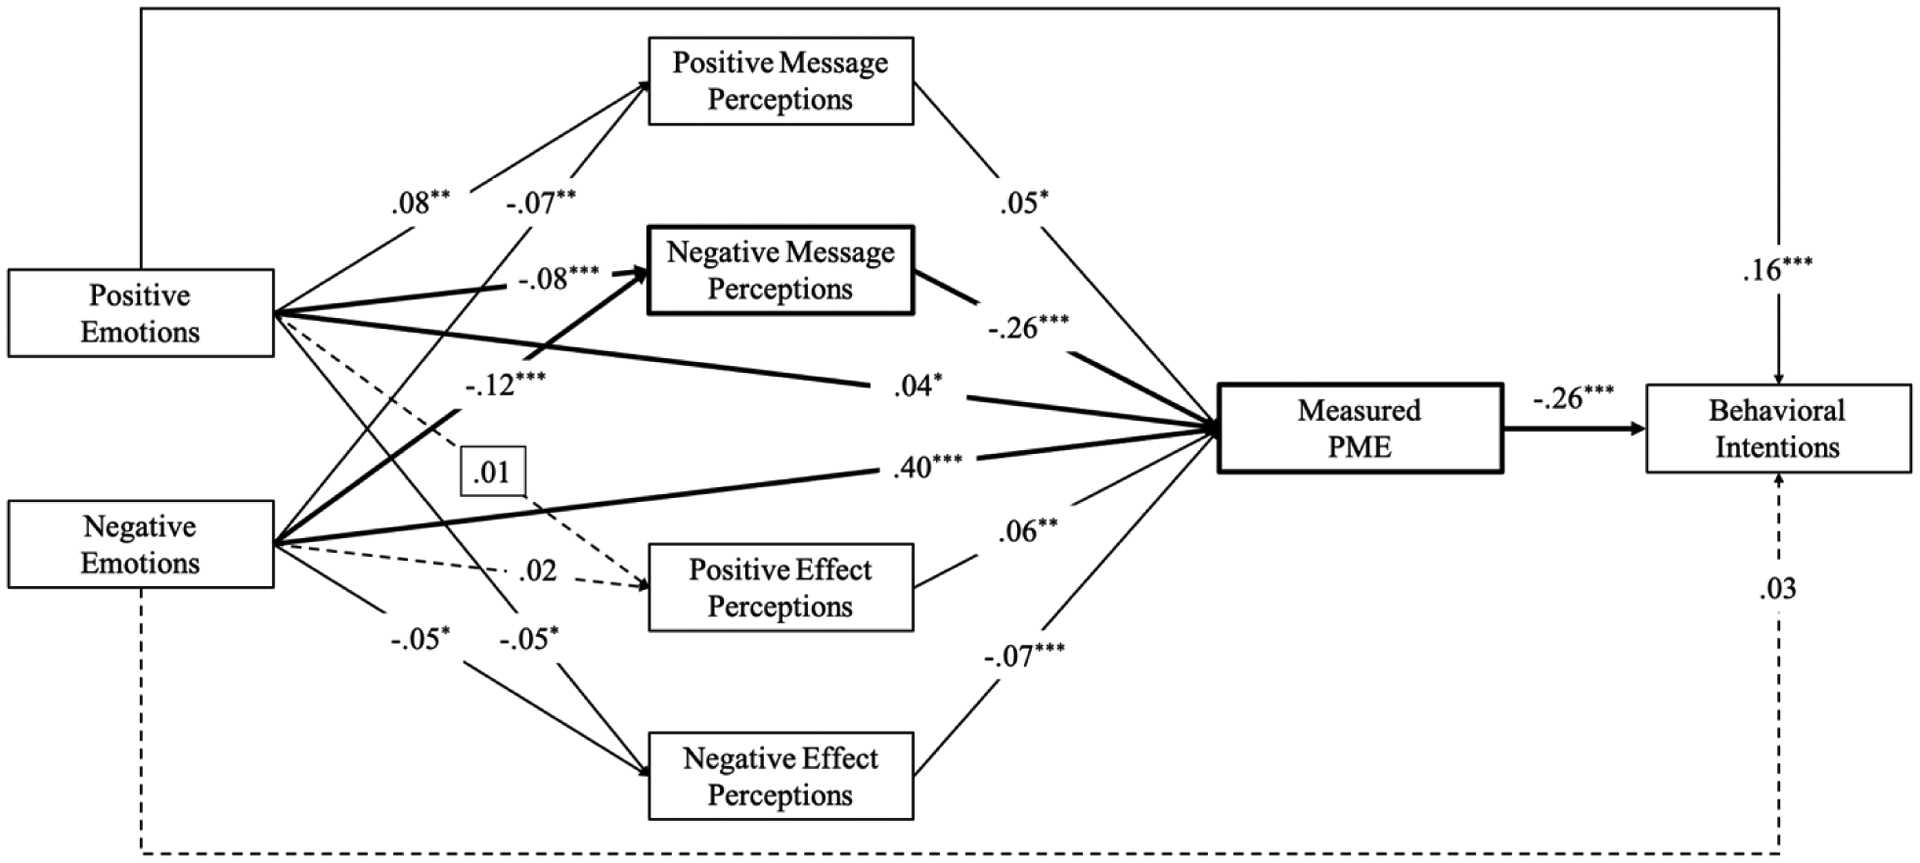
Figure 1. Path Analysis Results of Model 1.

Note. N = 1,968. Numbers are standardized path coefficients. Solid lines indicate significant paths. Dotted lines indicate non-significant paths. Bolded lines indicated significant mediation paths. *p < .05, **p< .01, ***p < .001.
Figure 2. Path Analysis Results of Model 2.
Note. N = 1,968. Numbers are standardized path coefficients. Solid lines indicate significant paths. Dotted lines indicate non-significant paths. Bolded lines indicated significant mediation paths. *p < .05, **p< .01, ***p < .001.
H1 stated that positive expressed PME variables will be positively associated with measured PME and negative expressed PME variables will be negatively associated with measured PME. Consistent with H1, positive message perceptions (β = .05, p = .017) and positive effect perceptions (β = .06, p = .001) were positively associated with measured PME. Negative message perceptions (β = −.26, p < .001) and negative effect perceptions (β = −.07, p < .001) negatively predicted measured PME.
H2 posited that positive and negative emotions will be positively associated with measured PME. H2 was supported: positive (β = .04, p = .031) and negative (β = .40, p < .001) emotions positively predicted measured PME.
RQ1 asked to what extent positive and negative emotions were associated with expressed PME variables. Results showed that positive emotions positively predicted positive message perceptions (β = .08, p = .001) and negatively predicted negative message perceptions (β = −.08, p < .001) and negative effect perceptions (β = −.05, p = .028). There was no relationship between positive emotions and positive effect perceptions (β = .01, p = .731). Negative emotions negatively predicted positive message perceptions (β = −.07, p = .002), negative message perceptions (β = −.12, p < .001), and negative effect perceptions (β = −.05, p = .042). Negative emotions were not related to positive effect perceptions (β = .02, p = .535).
In addition, in Model 1, measured PME positively predicted perceived harm (β = .60, p < .001). While positive emotions were not related to perceived harm (β = −.002, p = .901), negative emotions positively predicted perceived harm (β = .08, p < .001). In Model 2, measured PME negatively predicted behavioral intentions (β = −.26, p < .001). Positive emotions positively predicted intentions to vape (β = .16, p < .001) but negative emotions were not directly related to behavioral intentions (β = .03, p = .198).
Mediation Analyses
Mediation analyses explored RQ2a that asked whether expressed PME variables mediate the paths between emotions and measured PME. Results (Table 2) showed that for both models, negative message perceptions mediated the association between positive emotions and measured PME, and the association between negative emotions and measured PME. Other expressed PME variables did not mediate the relationships between emotions and measured PME.
Table 2.
Indirect Effect Results
| Indirect Effect | Estimate | SE | p | 95 CI | |
|---|---|---|---|---|---|
| LL | UL | ||||
| Model 1 & Model 2 | |||||
| PosEmo → Pos MP → PME | .004 | .002 | .051 | −.000 | .007 |
| PosEmo → Neg MP → PME* | .022 | .006 | .000 | .009 | .034 |
| PosEmo → Pos EP → PME | .000 | .001 | .732 | −.002 | .003 |
| PosEmo → Neg EP → PME | .004 | .002 | .058 | .000 | .007 |
| NegEmo → Pos MP → PME | −.003 | .002 | .060 | −.007 | .000 |
| NegEmo → Neg MP → PME* | .031 | .006 | .000 | .018 | .043 |
| NegEmo → Pos EP → PME | .001 | .001 | .543 | −.002 | .004 |
| NegEmo → Neg EP → PME | .003 | .002 | .073 | −.000 | .007 |
| Model 1 | |||||
| PosEmo → PME → Harm* | .025 | .012 | .031 | .002 | .049 |
| PosEmo → Pos MP → PME → Harm | .002 | .001 | .051 | −.000 | .004 |
| PosEmo → Neg MP → PME → Harm* | .013 | .004 | .001 | .006 | .020 |
| PosEmo → Pos EP → PME → Harm | .000 | .001 | .732 | −.001 | .002 |
| PosEmo → Neg EP → PME → Harm | .002 | .001 | .058 | −.000 | .004 |
| NegEmo → PME → Harm* | .229 | .013 | .000 | .203 | .255 |
| NegEmo → Pos MP → PME → Harm | −.002 | .001 | .060 | −.004 | .000 |
| NegEmo → Neg MP → PME → Harm* | .018 | .004 | .000 | .011 | .026 |
| NegEmo → Pos EP → PME → Harm | .001 | .001 | .543 | −.001 | .002 |
| NegEmo → Neg EP → PME → Harm | .002 | .001 | .073 | −.000 | .004 |
| Model 2 | |||||
| PosEmo → PME → BI* | −.011 | .005 | .033 | −.025 | −.001 |
| PosEmo → Pos MP → PME → BI | −.001 | .000 | .053 | −.002 | .000 |
| PosEmo → Neg MP → PME → BI* | −.006 | .002 | .001 | −.010 | −.003 |
| PosEmo → Pos EP → PME → BI | .000 | .000 | .732 | −.001 | .001 |
| PosEmo → Neg EP → PME → BI | −.001 | .001 | .060 | −.002 | .000 |
| NegEmo → PME → BI* | −.099 | .009 | .000 | −.117 | −.082 |
| NegEmo → Pos MP → PME → BI | .001 | .000 | .062 | −.000 | .002 |
| NegEmo → Neg MP → PME → BI* | −.008 | .002 | .000 | −.011 | −.005 |
| NegEmo → Pos EP → PME → BI | .000 | .000 | .543 | −.001 | .001 |
| NegEmo → Neg EP → PME → BI | −.001 | .000 | .076 | −.002 | .000 |
Note. N = 1,968. PosEmo = Positive emotions, NegEmo = Negative emotions, Pos MP = Positive message perceptions, Neg MP = Negative message perceptions, Pos EP = Positive effect perceptions, Neg EP = Negative effect perceptions, PME = Measured perceived message effectiveness, Harm = Perceived harm, BI = Behavioral intentions.
indicates significant indirect effects at p < .05.
RQ2b asked whether measured PME mediated the paths between emotions and outcomes. RQ2c explored whether emotions predicted outcomes indirectly via expressed PME variables and measured PME. In Model 1, measured PME mediated the relationships between emotions and perceived harm. Positive and negative emotions also significantly indirectly predicted perceived harm via negative message perceptions and measured PME. Similarly, in Model 2, measured PME mediated the relationships between emotions and behavioral intentions. Positive and negative emotions also significantly indirectly predicted behavioral intentions via negative message perceptions and measured PME.
Discussion
How people make perceived message effectiveness (PME) judgements about health communication messages remains mostly unexplored. This article introduced a novel way to assess PME expressed in participants’ thought listing after message exposure. We also examined emotions as predictors of PME and investigated how PME mediated the effect of emotions on outcomes (perceived harm and behavioral intentions around e-cigarettes). In the current study of 1,968 adult current and former smokers and non-smokers exposed to e-cigarette prevention messages, we found that expressed PME was associated with measured PME, emotions were related to both expressed and measured PME, but only one type of expressed PME (negative message perceptions) mediated the path between emotions, measured PME, and outcomes.
Past quantitative studies typically used close-ended measures to assess PME (Noar, Bell, et al., 2018). To help better conceptualize PME, we investigated to what extent people need to explicitly think about message effectiveness for the message to be reported as effective. Expressed PME was consistently correlated with measured PME, indicating that the two ways of measuring PME tap into the same underlying construct. In addition, it seems that when exposed to prevention messages, most people do not think about (or do not report the thoughts on) whether these messages are effective. Only about one in four participants in our study expressed any thoughts about message effectiveness; yet, when asked directly, the mean rating of measured PME was 6.6, significantly above the mid-point of the 1–9 scale. More importantly, while emotions predicted outcomes via expressed PME and then measured PME, emotions also predicted outcomes only through measured PME, without via expressed PME. Thus, these results suggest that messages do not need to induce effectiveness thoughts in order to be perceived as effective.
Notably, different types of expressed PME (positive and negative message perceptions, and positive and negative effects perceptions) seem to function differently in the decision-making process. Among the four expressed PME constructs, negative message perceptions had the strongest association with measured PME. It was also the only construct that mediated the paths from positive and negative emotions to measured PME, and to outcomes. This indicates that while it might not be necessary for people to think about how effective a message is to give it a high effectiveness score, a message that makes participants think about how bad it is would be scored lower. Thus, in both qualitative and quantitative formative studies, researchers should pay more attention to the negative comments made by participants about the messages. While praise for the messages might or might not be indicative of the message effectiveness, criticism for the message seems to be a good indicator of perceived message ineffectiveness.
Measured PME typically focuses on positive message and effect perceptions with items like “These ads are powerful, informative, meaningful, convincing” (Davis et al., 2013) and “The ads keep me from wanting to vape” (Noar, Rohde, et al., 2020). Although it is likely that low evaluations on these items are indicative of negative message perceptions and negative effect perceptions, it might be worthwhile to explore perceived message ineffectiveness in greater depth and assess specific items that measure it (e.g., “This ad is weak” and “This ad fails to convince me to quit smoking”). This would help further develop the conceptualization and operationalization of PME.
We examined positive and negative emotions as precursors to PME. Both positive and negative emotions participants felt while looking at the messages were correlated with measured PME. This is consistent with earlier findings where emotions predicted PME for adults (Dillard & Peck, 2000) and youth (Yzer et al., 2011). Emotions were also correlated with three out of four constructs of expressed PME. Emotions were not predictive of positive effect perceptions. This may be because that less than 4% of participants mentioned positive effect perceptions. Another possible explanation is that other cognitive factors, such as attitudes towards tobacco use and control, and perceived self-efficacy, may play a role in whether people say something about the ad motivating behavior or changing perceptions and attitudes. Future studies should examine other antecedents to PME, such as physiological and cognitive factors.
Informed by theories of information processing (Epstein, 1994; Slovic et al., 2007), the model we tested reflects the hypothesized temporal ordering of the judgments with emotions experienced during the exposure to the message happening first, followed by thoughts about PME (expressed PME), and then measure PME and outcomes. Our order of measurement reflected this sequence with one exception: expressed PME was measured immediately after the message exposure, followed by self-reported emotions. We measured expressed PME first because it is time-sensitive (participants can forget what thoughts crossed their minds while they were looking at the message) and because this measure (“type in every thought that came to mind while looking at that picture”) could be influenced by measures evaluating the message. It is unlikely that expressed PME (thoughts that participants had while looking at the message) influences their report of the emotions for two reasons. First, the emotions they felt likely preceded thoughts about message effectiveness because affective or experiential decision making is simply quicker (Finucane et al., 2000; Zajonc, 1980). Second, people are good at recognizing and remembering their emotions, and past research has shown that self-report is a reliable method for measuring emotions, especially when the emotional experience being measured is current or very recent (Robinson & Clore, 2002).
Limitations of this study include a non-representative convenience sample. As with other research on PME, measures of expressed PME, measured PME, and outcomes were taken from the same participants. It is possible that some other variables (e.g., participant characteristics) might influence all of them, resulting in spurious correlations. However, because in all our analyses we controlled for participant characteristics, the influence of participant factors should be minimized. In addition, our study only examined emotions and did not test and compare the differential influences of analytical and experiential systems of decision-making. Ramsay et al. (2013), for instance, found that although both executive (analytical) and affective (experiential) systems were activated simultaneously in the brain when processing messages with high PME, participants’ own rating of PME was correlated only with executive system (Ramsay et al., 2013). While our path model was theory-based, other configurations are also possible. Future studies should continue exploring and comparing analytical and experiential antecedents to measured and expressed PME and examining different reconfigurations of the model. Moreover, we used hope as the single indicator of positive emotions and leave the role of other positive emotions, such as happiness and excitement, to future research. Our measured PME comprised two items only and focused on effects perceptions. The question about perceived harm might have been interpreted differently by different people to mean either personal or population harm, and future studies should use items assessing harm to self. The behavioral intentions item tapped into behavioral openness; future research should evaluate deliberate behavioral intentions. Data were also cross-sectional, precluding causality.
In conclusion, this study answered the call on examining determinants of PME by investigative spontaneously expressed PME and by examining the role of positive and negative emotions and the mediating role of PME between emotions and outcomes. About a quarter of participants spontaneously expressed thoughts of PME after message exposures. While all four types of expressed PME were correlated with measured PME, negative message perceptions was the only expressed PME construct that mediated the relationships between emotions and measured PME, and outcomes. This suggests that messages may not need to induce effectiveness thoughts in order to be perceived and reported as effective. Further conceptual work on PME needs to explicate the role of perceived message ineffectiveness and consider PME as a valid indicator of message effectiveness resulting from heuristic and conscious calculus.
Funding:
Research reported in this publication was supported by the by the National Cancer Institute of the National Institutes of Health (www.cancer.gov) and the Food and Drug Administration Center for Tobacco Products (https://www.fda.gov/tobaccoproducts) (grant number R00CA187460 to LP). The content is solely the responsibility of the authors and does not necessarily represent the official views of the funders. The funders had no role in study design, data collection and analysis, decision to publish, or preparation of the manuscript.
Footnotes
CONFLICT OF INTERESTS:
The authors declare that there are no conflicts of interest
Contributor Information
Lucy Popova, School of Public Health, Georgia State University, Atlanta, GA, USA;.
Yachao Li, Department of Communication Studies and Department of Public Health, The College of New Jersey; Ewing, NJ, USA;.
Data Availability Statement:
The data underlying this article are available from openICPSR (doi: 10.3886/E123702V1).
References
- Baig SA, Noar SM, Gottfredson NC, Boynton MH, Ribisl KM, & Brewer NT (2019). UNC perceived message effectiveness: Validation of a brief scale. Annals of Behavioral Medicine, 53(8), 732–742. 10.1093/abm/kay080 [DOI] [PMC free article] [PubMed] [Google Scholar]
- Chaiken S, & Trope Y (1999). Dual-process theories in social psychology. Guilford Press. [Google Scholar]
- Cullen KA, Gentzke AS, Sawdey MD, Chang JT, Anic GM, Wang TW, Creamer MR, Jamal A, Ambrose BK, & King BA (2019). E-cigarette use among youth in the United States, 2019. JAMA, 322(21), 2095–2103. 10.1001/jama.2019.18387 [DOI] [PMC free article] [PubMed] [Google Scholar]
- Davis KC, Nonnemaker J, Duke J, & Farrelly MC (2013). Perceived effectiveness of cessation advertisements: the importance of audience reactions and practical implications for media campaign planning. Health Communication, 28(5), 461–472. 10.1080/10410236.2012.696535 [DOI] [PubMed] [Google Scholar]
- Dillard JP, & Peck E (2000, Aug). Affect and persuasion - Emotional responses to public service announcements. Communication Research, 27(4), 461–495. 10.1177/009365000027004003 [DOI] [Google Scholar]
- Dillard JP, Weber KM, & Vail RG (2007). The relationship between the perceived and actual effectiveness of persuasive messages: A meta-analysis with implications for formative campaign research. Journal of Communication, 57(4), 613–631. 10.1111/j.1460-2466.2007.00360.x [DOI] [Google Scholar]
- Dillard JP, & Ye S (2008). The perceived effectiveness of persuasive messages: Questions of structure, referent, and bias. Journal of Health Communication, 13(2), 149–168. 10.1080/10810730701854060 [DOI] [PubMed] [Google Scholar]
- Epstein S (1994). Integration of the cognitive and the psychodynamic unconscious. American Psychologist, 49(8), 709–724. 10.1037/0003-066X.49.8.709 [DOI] [PubMed] [Google Scholar]
- Finucane ML, Alhakami A, Slovic P, & Johnson SM (2000). The affect heuristic in judgments of risks and benefits. Journal of Behavioral Decision Making, 13(1), 1–17. 10.1002/(SICI)1099-0771(200001/03)13:1lt;1::AID-BDM333gt;3.0.CO;2-S [DOI] [Google Scholar]
- Hu L. t., & Bentler PM (1999). Cutoff criteria for fit indexes in covariance structure analysis: Conventional criteria versus new alternatives. Structural Equation Modeling: A Multidisciplinary Journal, 6(1), 1–55. 10.1080/10705519909540118 [DOI] [Google Scholar]
- Li Y, Yang B, Henderson K, & Popova L (2020). A Content Analysis of US Adults’ Open-Ended Responses to E-Cigarette Risk Messages. Health Communication, 1–11. [DOI] [PMC free article] [PubMed] [Google Scholar]
- Marks AD, O’Neill G, & Hine DW (2008). Role of affect, expectancies and dual processes of cognition in predicting adult cigarette smoking. Australian Journal of Psychology, 60(3), 160–167. 10.1080/00049530701656273 [DOI] [Google Scholar]
- McMillen RC, Gottlieb MA, Shaefer RMW, Winickoff JP, & Klein JD (2014). Trends in electronic cigarette use among US adults: Use is increasing in both smokers and nonsmokers. Nicotine & Tobacco Research, 17(10), 1195–1202. 10.1093/ntr/ntu213 [DOI] [PubMed] [Google Scholar]
- National Academies of Sciences, Engineering, and Medicine. (2018). Public health consequences of e-cigarettes. The National Academies Press. [PubMed] [Google Scholar]
- Noar SM, Barker J, Bell T, & Yzer M (2020). Does perceived message effectiveness predict the actual effectiveness of tobacco education messages? A systematic review and meta-analysis. Health Communication, 35(2), 148–157. 10.1080/10410236.2018.1547675 [DOI] [PMC free article] [PubMed] [Google Scholar]
- Noar SM, Barker J, & Yzer M (2018). Measurement and design heterogeneity in perceived message effectiveness studies: A call for research. The Journal of communication, 68(5), 990. 10.1093/joc/jqy047 [DOI] [PMC free article] [PubMed] [Google Scholar]
- Noar SM, Bell T, Kelley D, Barker J, & Yzer M (2018). Perceived message effectiveness measures in tobacco education campaigns: A systematic review. Communication Methods and Measures, 12(4), 295–313. 10.1080/19312458.2018.1483017 [DOI] [PMC free article] [PubMed] [Google Scholar]
- Noar SM, Rohde JA, Prentice-Dunn H, Kresovich A, Hall MG, & Brewer NT (2020). Evaluating the Actual and Perceived Effectiveness of E-Cigarette Prevention Advertisements among Adolescents. Addictive Behaviors, 106473. 10.1016/j.addbeh.2020.106473 [DOI] [PMC free article] [PubMed] [Google Scholar]
- Owusu D, Massey Z, & Popova L (2020). An experimental study of messages communicating potential harms of electronic cigarettes. PloS One, 15(10), e0240611. [DOI] [PMC free article] [PubMed] [Google Scholar]
- Petty RE, & Cacioppo JT (1986). The elaboration likelihood model of persuasion. In Communication and Persuasion (pp. 1–24). Springer. [Google Scholar]
- Popova L, Owusu D, Weaver SR, Kemp CB, Mertz CK, Pechacek TF, & Slovic P (2018). Affect, risk perception, and the use of cigarettes and e-cigarettes: A population study of U.S. adults. BMC Public Health, 18, 395. 10.1186/s12889-018-5306-z [DOI] [PMC free article] [PubMed] [Google Scholar]
- Popova L, So J, Sangalang A, Neilands TB, & Ling P (2017). Do emotions spark interest in alternative tobacco products? Health Education & Behavior, 44(2), 598–612. 10.1177/1090198116683169 [DOI] [PMC free article] [PubMed] [Google Scholar]
- Ramsay IS, Yzer M, Luciana M, Vohs KD, & MacDonald III AW (2013). Affective and executive network processing associated with persuasive antidrug messages. Journal of Cognitive Neuroscience, 25(7), 1136–1147. 10.1162/jocn_a_00391 [DOI] [PubMed] [Google Scholar]
- Robinson MD, & Clore GL (2002). Episodic and semantic knowledge in emotional self-report: evidence for two judgment processes. Journal of Personality and Social Psychology, 83(1), 198. 10.1037/0022-3514.83.1.198 [DOI] [PubMed] [Google Scholar]
- Slovic P, Finucane ML, Peters E, & MacGregor DG (2007). The affect heuristic. European Journal of Operational Research, 177(3), 1333–1352. 10.1016/j.ejor.2005.04.006 [DOI] [Google Scholar]
- Yang B, Liu J, & Popova L (2019). Feeling hopeful motivates change: Emotional responses to messages communicating comparative risk of electronic cigarettes and combusted cigarettes. Health Education & Behavior, 46(3), 471–483. 10.1177/1090198118825236 [DOI] [PMC free article] [PubMed] [Google Scholar]
- Yzer M, LoRusso S, & Nagler RH (2015). On the conceptual ambiguity surrounding perceived message effectiveness. Health Communication, 30(2), 125–134. 10.1080/10410236.2014.974131 [DOI] [PMC free article] [PubMed] [Google Scholar]
- Yzer M, Vohs KD, Luciana M, Cuthbert BN, & MacDonald AW (2011, Sep). Affective antecedents of the perceived effectiveness of antidrug advertisements: An analysis of adolescents’ momentary and retrospective evaluations. Prevention Science, 12(3), 278–288. 10.1007/s11121-011-0212-y [DOI] [PMC free article] [PubMed] [Google Scholar]
- Zajonc RB (1980). Feeling and thinking: Preferences need no inferences. American Psychologist, 35(2), 151–175. 10.1037/0003-066X.35.2.151 [DOI] [Google Scholar]
Associated Data
This section collects any data citations, data availability statements, or supplementary materials included in this article.
Data Availability Statement
The data underlying this article are available from openICPSR (doi: 10.3886/E123702V1).