

Abstract
Introduction
This systematic review aimed to investigate variations of reference scores for the Pain Catastrophizing Scale (PCS) between language versions and between countries in patients with chronic primary pain (CPP) or chronic primary pain, not otherwise specified (CPP-NOS).
Methods
Electronic searches of the Ovid/Embase, Ovid/MEDLINE, and Ovid/PsycINFO databases were conducted to retrieve studies assessing PCS scores in adults with CPP or CPP-NOS proposed by the International Classification of Diseases, Eleventh Revision for any country where the translated PCS was available. The protocol for this systematic review was prospectively registered on the International Prospective Register of Systematic Reviews 2018 (registration number: CRD 42018086719).
Results
A total of 3634 articles were screened after removal of duplicates. From these, 241 articles reporting on 32,282 patients with chronic pain were included in the review. The mean (± standard deviation) weighted PCS score across all articles was 25.04 ± 12.87. Of the 12 language versions and 21 countries included in the review, the weighted mean PCS score in Asian languages or Asian countries was significantly higher than that in English, European, and other languages or Western and other countries. The highest mean score of the weighted PCS based on language was in Japanese (mean 33.55), and the lowest was in Russian (mean 20.32). The highest mean score of the weighted PCS based on country was from Japan (mean 33.55), and the lowest was from Australia (mean 19.80).
Conclusion
The weighted PCS scores for people with CPP or CPP-NOS were significantly higher in Asian language versions/Asian countries than in English, European and other language versions or Western and other countries.
Supplementary Information
The online version contains supplementary material available at 10.1007/s40122-022-00390-0.
Keywords: Catastrophization, Chronic primary pain, Culture, Language, Systematic reviews
Plain Language Summary
Our previous research has indicated that the clinical significance of the Pain Catastrophizing Scale (PCS) score would vary across different language versions and different countries (Ikemoto et al. in Eur J Pain 2020; 24(7):1228–1241. https://doi.org/10.1002/ejp.1587). This systematic review investigated cross-cultural differences in the PCS score between different languages and countries among patients with chronic primary pain. From 241 articles reporting on 32,282 patients with chronic primary pain, involving 12 language versions and 21 countries, the weighted mean PCS score in Asian languages or Asian countries was significantly higher than that in English, European and other languages or Western and other countries. Given the variations of PCS scores in different contexts, a universal comparison PCS reference or a cutoff score should not be used to compare different cultures even when a sample has the same pain condition.
Supplementary Information
The online version contains supplementary material available at 10.1007/s40122-022-00390-0.
Key Summary Points
| Our previous research has indicated that the clinical significance of the Pain Catastrophizing Scale (PCS) score would vary across different language versions and countries. |
| This study investigated cross-cultural differences in the PCS score between different languages and countries among patients with chronic primary (non-specific) pain. |
| A total of 241 articles reporting on 32,282 patients with chronic primary (non-specific) pain, involving 12 language versions and 21 countries, were assessed in this systematic review. |
| The weighted mean PCS score in Asian languages or Asian countries were significantly higher than those in English, European and other languages or Western and others countries. |
| Given these variations, a universal comparison PCS reference or a cutoff score should not be used to compare different cultures even when a sample has the same pain condition. |
Introduction
Pain catastrophizing is defined as an exaggerated negative mental set brought to bear during an actual or anticipated painful experience [1, 2]. This phenomenon plays a crucial role in the chronic pain experience, significantly contributing to an increase in pain and disability [3] and is an important process variable that mediates improvements in pain and disability through interventions [3].
Pain catastrophizing is widely assessed using the following questionnaires [4]: the catastrophizing subscale of the Coping Strategies Questionnaire [5], the catastrophizing subscale of the Cognitive Coping Strategies Inventory [6], the catastrophizing subscale of the Pain Cognition List [7], the catastrophizing subscale of the Pain-Related Self-Statements Scale [8], the Pain Catastrophizing Scale (PCS) [2], and the catastrophizing subscale of the Avoidance Endurance Questionnaire [9]. The PCS is the most popular tool, and has been cited over 5000 times in Google Scholar since it was developed. A recent assessment of the validation processes undertaken for the PCS used in different countries noted different factor-structures for each translated version [10]. While the total score of the PCS was assessed as being comparable, caution was recommended when comparing the subdomains (rumination, magnification, and helplessness). In addition, the correlation between chronic pain intensity and total PCS score also varied across the studies [10], suggesting that the clinical significance of the PCS score varies across different language versions and countries.
The reference scores of the PCS also vary across different language versions. The PCS user manual (English, USA; [2]) reports a median score of 20 points as a cutoff for a high risk of developing chronic pain of 30 points (75th percentile of the distribution). In comparison, the reference score for a high PCS in studies in other languages varies from 21 [11] to 45 points [12]. A systematic review highlighted that the reference score of the PCS is associated with pain diagnosis and language version [13], although this review included patients with various acute and chronic pain conditions. Moreover, other studies have reported that ethnic differences in interpreting the PCS are found between Chinese and Euro-Canadian subjects [14]. To minimize the sample variation due to differing pain conditions, we sought to investigate the properties of the PCS among subjects with chronic primary pain (CPP) or chronic primary pain, not otherwise specified (CPP-NOS) proposed by the International Classification of Diseases, Eleventh Revision (ICD-11) categories of pain, rather than pain due to an identifiable cause, such as chronic secondary pain [15, 16].
The aim of this study was to investigate cross-cultural differences in the PCS score between different languages and countries among patients with CPP or CPP-NOS.
Methods
Registration
This systematic review was performed following current guidelines and was reported according to the Preferred Reporting Items for Systematic Reviews and Meta-Analyses (PRISMA) [17] and Meta-analysis of Observational Studies in Epidemiology (MOOSE) statements [18]. The protocol of this study is available in the International Prospective Register of Systematic Reviews (PROSPERO) (Reg. number: CRD42018086719).
Ethics Compliance
This article is based on previously conducted studies and does not contain any studies with human participants or animals performed by any of the authors.
Search Strategy
To identify the relevant literature, the Ovid/Embase, Ovid/MEDLINE, and Ovid/PsycINFO databases were searched for relevant articles since inception to January 2018. A comprehensive search strategy was designed with the assistance of an experienced research librarian and adjusted to account for differences in indexing across databases. An additional search update was conducted in December 2020 to cover the full date range, and duplicate records found in the previous searches were removed, based on the methods described by Bramer et al. [19].
The search encompasses terms for the two domains of interest: chronic pain and catastrophizing. Terms for each domain were combined using the AND operator. This review focused on CPP or CPP-NOS proposed by the classification of chronic pain in ICD-11 [16]. The subcategories of chronic primary pain included in the search strategy were taken from a classification of chronic pain syndromes for ICD-11 (beta version). Relevant articles were retrieved from the database using the registration terms (PROSPERO: CRD42018086719).
Selection of Studies and Outcomes
The outcome of interest was the PCS score at cross-sectional points or at baseline (prior to intervention). Interventional studies (e.g., randomized controlled trials) were included if baseline (before intervention) data were reported.
Eligibility Criteria
Inclusion criteria were:
Original articles with any study design.
Subjects aged ≥ 18 years.
Studies were also included if most of the subjects could be regarded as adults, i.e., aged ≥ 18 years even when the study did not describe the age range of the subjects.
‘Chronic primary pain’ or ‘Chronic primary pain, not otherwise specified’ proposed by the classification of chronic pain ICD-11 [15, 16].
English-speaking and non-English-speaking countries where the translated-PCS was available.
Studies reporting PCS (ranging from 0 to 52) by Sullivan et al. [2].
Exclusion criteria were:
Full texts written in a language other than English.
Studies including more than one language in which results were not reported separately.
Studies recruiting people aged < 18 years.
Studies including patients with chronic pain with additional acute pathology, including fracture, cancer recurrence, infection, or acute inflammation.
Studies including secondary chronic pain as defined in the ICD-11.
Review, editorial, and non-primary articles.
Studies reporting outcomes of related persons (e.g., spouse, sibling, or caregiver) other than the chronic pain patient.
Studies in which mean and standard deviation (SD) of PCS scores could not be extracted.
Studies using a “non-primary language version” of PCS (e.g., the original version of the PCS [in English] is cited in the text despite being conducted in a country with a different primary language).
Studies using specific inclusion and exclusion criteria for subject selection in addition to chronic pain (pain lasting > 3 months) (e.g., subjects reporting pain intensity of ≥ 4 on a 0–10 scale).
Studies reporting duplicate PCS data.
Studies in which catastrophizing was assessed by measures other than the PCS.
Studies assessing a PCS language version for which the total sample size did not reach 100.
Data Extraction and Management
After the removal of duplicate papers, the identification of studies that met the inclusion criteria were independently conducted by two reviewers (KH & TI) based on the title and then the abstract. The papers on these studies were reviewed independently by two reviewers for their eligibility using a standardized eligibility sheet. Any disagreement arising between the reviewers was resolved through discussion and consensus with a third reviewer (YCA) at all stages of screening. Full-text papers were reviewed for eligibility using a standardized eligibility sheet and the reasons for exclusion were recorded. The following data were extracted from the included studies by the reviewers:
Study features, i.e., study title, authors name, journal, publication date.
Study population, i.e., sample size, participant characteristics (age, gender, pain diagnosis).
Recruitment source (community, primary, secondary or tertiary clinic, or patient association).
PCS scores (mean and SD).
Quality Assessment
Risk of bias was assessed using RoBANS checklist [20], which was modified to fit our purpose. Of the six assessment items in this checklist, only the first item (selection of participant) was used as the present study only assessed cross-sectional data or baseline data, and not longitudinal data related to observations or intervention. To assess risk of bias of participant selection in each study, we applied the quality assessment tool reported by Wheeler et al. [13] as listed below.
Was the study population clearly specified and defined?
Was the participation rate of eligible persons at least 50%?
Were all the subjects selected or recruited from the same or similar populations (including the same period)?
Were inclusion and exclusion criteria for being in the study prespecified and applied uniformly to all participants?
Studies that fulfilled the criteria for all four of these screening questions were considered as having low risk of bias, otherwise studies were considered as having high risk of bias for participant selection.
Data Synthesis and Statistical Analysis
Means and SD of PCS scores of individual studies were used. Comparisons of PCS scores between each pair of eligible languages were performed using the Student's t-test, calculated by using the number of the subjects, pooled mean and pooled SD in each language. Where samples of sufficient size were available, subgroup analyses were performed based on recruitment source as defined in each report (e.g., primary, secondary or tertiary clinic) and pain category (CPP vs. CPP-NOS). Effect sizes are presented as standardized mean differences (SMD). For evaluating statistical significance, p values < 0.01 were considered to indicate a significant difference for multiple pairwise comparisons.
Results
Study Selection
As shown in Fig. 1, the database searches identified 6291 articles, of which 3634 articles were subsequently screened after the removal of duplicates. Following title and abstract screening, 1793 articles were selected for full-text review. Ultimately, 241 articles were included in the present systematic review. The main reasons for exclusion of articles are given in Fig. 1.
Fig. 1.

Flow chart of study selection. The database searches identified 3634 articles, of which 241 articles met the inclusion criteria and were ultimately included in the present systematic review. ICD-11 International Classification of Diseases, Eleventh Revision, PCS Pain Catastrophizing Scale
Study Characteristics
A total of 32,282 patients with CPP or CPP-NOS reported in the 241 articles were included in this systematic review (see Electronic Supplementary Material). The mean (± SD) weighted PCS scores across all studies was 25.04 ± 12.87. Study designs were either cross-sectional, cohort, or randomized controlled. Overall, the included studies used 12 language versions of the PCS and involved 21 countries.
Recruitment sources included primary, secondary, or tertiary clinics, and other (non-clinical community care, patient support-groups or online) or mixed sources. Pain diagnoses/locations included fibromyalgia, low back pain, headache, neck pain, and mixed.
Risk of Bias Analysis
In the 241 articles included in this review, 123 studies fulfilled the criteria for all four screening questions, which meant that these studies were considered to be of low risk of bias for participant selection. The weighted PCS scores for studies that did or did not meet all of the risk of bias criteria were calculated. No statistical difference was found in PCS scores between studies that did and did not meet all of the risk of bias criteria (SMD 0.130, p = 0.38; Table 1).
Table 1.
Weighted mean PCS scores for all studies included in this systematic review, including both studies meeting a risk of bias criteria and studies not meeting these criteria
| Study category | Total score of the PCS | Number of: | |||
|---|---|---|---|---|---|
| Weighted mean | Weighted SD | Weighted SE | Subjects | Articles | |
| Studies meeting all risk of bias criteria | 24.98 | 12.76 | 0.10 | 16,828 | 126 |
| Studies not meeting any risk of bias criteria | 25.10 | 12.97 | 0.10 | 15,454 | 115 |
| Overall | 25.04 | 12.87 | 0.07 | 32,282 | 241 |
PCS Pain Catastrophizing Scale, SD standard deviation, SE standard error
Difference in the PCS Score Between Different Language Versions
A forest plot of weighted PCS scores is shown in Fig. 2. Across the 12 languages assessed in the present study, the greatest number of patients and articles were English speaking and in English, respectively (18,011 patients), followed by Spanish (6447 patients) and Dutch (2700 patients). The weighted mean PCS scores in Asian languages (i.e., Japanese, Chinese, and Korean) were significantly higher than those in English, European, and other languages (all p < 0.01) (Table 2). The highest mean score of the weighted PCS based on language was in Japanese (mean 33.55), and the lowest was in Russian (mean 20.32).
Fig. 2.
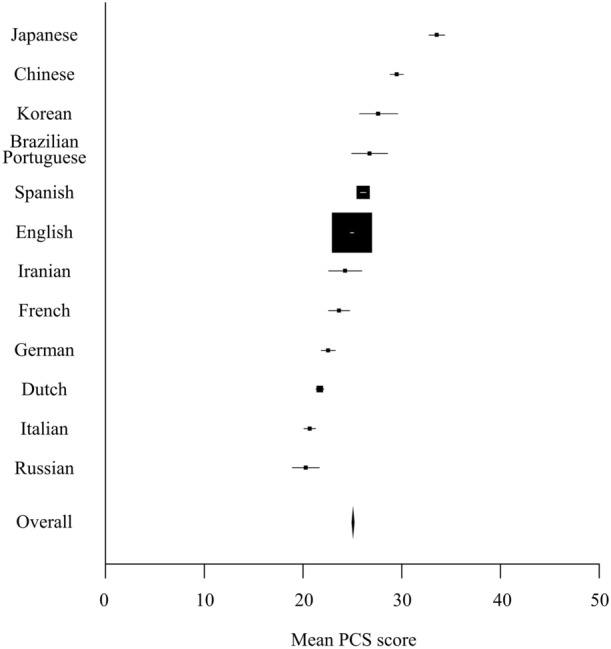
Differences in weighted mean PCS scores among language versions. Forest plot shows the weighted mean scores and confidence interval for groups of participants based on language versions of the PCS
Table 2.
Standardized mean differences (SMD) in weighted mean PCS scores between different languages

t, t-statistic value; p, p value; SMD, standardized mean difference
Difference in the PCS Score Between Countries
Of the 21 countries included in the studies, the greatest number of patients and articles were from the USA (10,655 patients), followed by Spain (6142 patients), and Canada (4605 patients) (Fig. 3). The weighted mean PCS scores in Asia (Japan, China, Korea, Iran, and India) were significantly higher than those in Western and other countries (all p < 0.01) (Table 3). The highest mean score of the weighted PCS based on country was from Japan (mean 33.55), and the lowest was from Australia (mean 19.80). Geographic differences in weighted mean PCS score by countries are shown in Fig. 4.
Fig. 3.
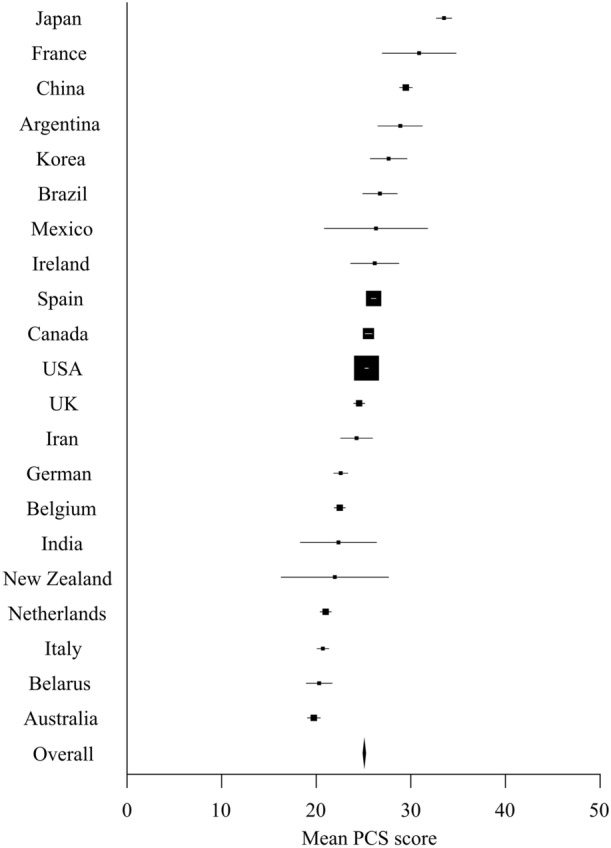
Difference in weighted mean PCS score among countries. Forest plot shows the weighted mean scores and confidence interval for groups of participants based on countries
Table 3.
Standardized mean differences in weighted mean PCS score between different geographic regions
| Geographic regiona | Values | Asia | North America | Europe | Oceania | |
|---|---|---|---|---|---|---|
| Asia | Number of patients | 2295 | t, 16.91 | t, 21.25 | t, 22.39 | |
| Number of studies | 13 | p, < 0.01 | p, < 0.01 | p, < 0.01 | ||
| Mean | 30.25 | SMD, 0.38 | SMD, 0.48 | SMD, 0.79 | ||
| SD | 13.16 | |||||
| North America | Number of patients | 15,282 | t, 8.32 | t, 14.57 | ||
| Number of studies | 90 | p, < 0.01 | p, < 0.01 | |||
| Mean | 25.40 | SMD, 0.10 | SMD, 0.43 | |||
| SD | 12.76 | |||||
| Europe | Number of patients | 12,599 | t, 11.28 | |||
| Number of studies | 119 | p, < 0.01 | ||||
| Mean | 24.13 | SMD, 0.34 | ||||
| SD | 12.60 | |||||
| Oceania | Number of patients | 1215 | ||||
| Number of studies | 13 | |||||
| Mean | 19.85 | |||||
| SD | 12.97 |
aJapan, China, India, and Korea were included in Asia; Mexico, Canada, and USA were included in North America; France, Spain, Ireland, UK, Belgium, Germany, the Netherlands, and Italy were included in Europe; New Zealand and Australia were included in Oceania
t t-statistic value, p p value, SMD standardized mean difference
Fig. 4.

Geographic differences in weighted mean PCS score by countries. The darker the color, the higher the PCS score. No data are available for the countries shown in white (blank). This map was created using the MapChart site (https://www.mapchart.net/index.html; licensed under CC BY 4.0)
Subgroup Analyses Based on Recruitment Source
The weighted mean PCS score in secondary or tertiary clinics was significantly higher that from primary clinic or community groups across all studies (SMD 0.12, p < 0.01). Given the substantial differences in healthcare systems between countries, we examined studies conducted in a single country, Spain, to remove this bias. Spain was chosen because it provided the second highest number of patients and articles after the USA and, unlike the USA, the Spanish National Healthcare system provides a predominantly universal health care for all citizens. We found that in Spanish studies no significant difference in the weighted mean PCS score was present between recruitment sources (SMD 0.02, p = 0.54) (Fig. 5; Table 4).
Fig. 5.

Difference in weighted mean PCS score by recruitment sources. a All studies, b Spanish studies
Table 4.
Weighted mean PCS scores by recruitment source
| Overall studiesa | Total score of the PCS | Number of: | |||
|---|---|---|---|---|---|
| Weighted mean PCS score | Weighted SD | Weighted SE | Subjects | Articles | |
| Studies in primary clinics | 23.73 | 13.40 | 0.31 | 1806 | 22 |
| Studies in secondary clinics or tertiary clinics | 25.25 | 12.67 | 0.08 | 28,520 | 185 |
| Studies in mixed recruitment sources | 23.16 | 14.76 | 0.33 | 1956 | 34 |
| Overall | 25.04 | 12.87 | 0.07 | 32,282 | 241 |
| Spanish studiesb | Total score of the PCS | Number of: | |||
|---|---|---|---|---|---|
| Weighted mean PCS score | Weighted SD | Weighted SE | Subjects | Articles | |
| Studies in primary clinics | 25.84 | 12.79 | 0.36 | 1243 | 13 |
| Studies in secondary clinics or tertiary clinics | 26.09 | 12.96 | 0.19 | 4705 | 37 |
| Studies in mixed recruitment sources | 27.15 | 14.10 | 0.63 | 499 | 4 |
| Overall | 26.13 | 13.02 | 0.16 | 6447 | 54 |
aThe weighted mean PCS score in secondary clinics or tertiary clinics were significantly higher than that in primary clinics (SMD 0.12, p < 0.01) in all studies
bThere is no significant difference in the weighted mean PCS score between recruitment sources in the Spanish studies
Subgroup Analyses Based on Pain Category
No statistically significant difference was found in the weighted mean PCS score between the CPP group (fibromyalgia, headache, etc.) and the CPP-NOS group (SMD 0.31, p = 0.046; Fig. 6; Table 5).
Table 6.
Comparison of PCS scores between CPP and CPP-NOS by geographic regions
| Geographic regiona | Chronic pain category | Study (n) | Sample size (n) | Mean (SD) | Differenceb |
|---|---|---|---|---|---|
| Asia | CPP | 2 | 81 | 25.26 (15.10) |
t, 3.48 p, < 0.01 SMD, 0.39 |
| CPP-NOS | 11 | 2214 | 30.43 (13.05) | ||
| North America | CPP | 27 | 1801 | 23.03 (12.72) |
t, 8.42 p, < 0.01 SMD, 0.21 |
| CPP-NOS | 63 | 13,481 | 25.72 (12.73) | ||
| Europe | CPP | 56 | 6833 | 25.71 (12.85) |
t, 15.45 p, < 0.01 SMD, 0.28 |
| CPP-NOS | 63 | 5766 | 22.26 (12.04) | ||
| Oceania | CPP | 1 | 99 | 21.24 (14.03) |
t, 1.11 p, 0.27 SMD, 0.12 |
| CPP-NOS | 12 | 1116 | 19.73 (12.87) |
aJapan, China, and Korea were included in Asia; Mexico, Canada, and USA were included in North America; France, Spain, Ireland, UK, Belgium, Germany, the Netherlands, Italy, and Belarus were included in Europe; New Zealand and Australia were included in Oceania
bt and p are as defined in footnote of Table 3
Fig. 6.

Difference in weighted mean PCS score by pain category
Table 5.
Weighted mean PCS scores by pain category
| Pain category | PCS total score | Number of: | |||
|---|---|---|---|---|---|
| Weighted mean PCS score | Weighted SD | Weighted SE | Subjects | Articles | |
| CPP | 25.31 | 12.94 | 0.13 | 9205 | 89 |
| CPP-NOS | 24.93 | 12.83 | 0.08 | 23,077 | 152 |
| Overall | 25.04 | 12.87 | 0.07 | 32,282 | 241 |
We found inconsistent differences in PCS score between patients with CPP and CPP-NOS by geographic region (Table 6). The weighted mean of PCS scores was significantly higher for CPP than CPP-NOS in European countries, but significantly lower for CPP than CPP-NOS in Asian and North American countries
CPP Chronic primary pain, CPP-NOS chronic primary pain not otherwise specified
Discussion
In the present systematic review we compared the reference scores of the PCS in patients with CPP or CPP-NOS between the different language versions of the questionnaire and between countries. Although recent studies have indicated that levels of pain catastrophizing vary across countries [13, 14, 21, 22], this is the first study to demonstrate differences in the reference level of PCS by language and country, among patients with chronic primary (non-specific) pain. The weighted mean PCS total score was approximately 25 across all subjects (n = 32,282). The weighted PCS scores in Asian languages, particularly Japanese, were significantly higher than those in English, European and other languages in patients with CPP. Also, the weighted mean PCS scores in Asian countries were significantly higher than those in Western and other countries.
Variations with Culture
Culture describes the ideas, customs, and social behavior of a particular people or society [23]. Cultural background may influence trait levels of pain catastrophizing. In addition, higher levels of pain catastrophizing may be reflected by the difference in frequency of healthcare delivery between countries. On a per-population basis, Asian countries, particularly Japan, tend to have a high number of medical practitioner consultations, hospital beds, lengths of stay in hospital, magnetic resonance imaging units, and computed tomography (CT) scanners than European countries [24]; for example, the number of CT scanners per population in Japan is approximately double the number in Australia [25]. Frequent testing and visits to doctors have been found to provide little reassurance and increase feelings of worry and anxiety among patients [26]. In addition, reliance on clinical care may have a negative effect on recovery by promoting the use of passive coping strategies [27].
Culturally-specific attitudes on the meaning of pain may also influence the perception and response of patients to their own pain [28]. For example, it has been reported that Aborigines in Australia do not perceive back pain to be a health problem and consequently do not complain of symptoms, or seek treatment [29]. A recent study indicates that Japanese patients with knee osteoarthritis present with higher pain catastrophizing than Australian patients despite similar pain severity [30].
In Lithuania, there is little awareness of the notion that persistent neck pain may result from motor vehicle whiplash injury [31]. In contrast, patients with chronic low back pain in Spain have been reported to use more aggressive terms (like being stabbed with a knife) and express more negative attitudes when describing their pain compared to those in Brazil, regardless of the intensity and duration of pain [32]. Another study found Spanish patients with chronic low back pain experienced high levels of guilt and tended to isolate themselves because of a sense of burden to others [33].
Variations with Race
Race is a complex classification that has been socially, politically, and legally constructed over the past five centuries [34]. Of interest, higher levels of pain catastrophizing have been reported in Chinese Canadians compared to European Canadians [14] and in African-Americans compared to white Americans [21] when the same language version of the PCS was used. Genetic factors may play a role in the differences observed. For example, the population frequency of carriers of short or long alleles of the serotonin transporter gene (serotonin-transporter-linked promoter region [5-HTTLPR]) differs among geographical regions of the world [35]. The percentage of people with the short allele genotype in Asia is 70–80% and 40–45% in Europe, USA, and Australia [35]. Japan has the highest frequency of those with the short allele genotype among 29 investigated countries [35, 36]. Populations with the short allele genotype of 5-HTTLPR have greater anxiety-related personality traits [37], depressive symptoms [38], and neuroticism [39] than those with the long allele. In addition, triallelic polymorphism of this gene has also been associated with dorsolateral prefrontal cortex (DLPFC) thickness [40], which is itself also associated with pain catastrophizing [41].
Difference by Pain Category
In terms of differences of the PCS in pain diagnosis, Wheeler et al. [13] reported that PCS scores were higher among patients with fibromyalgia (generalized pain) than among those with other pain diagnoses. These authors proposed that in contrast to other well-defined conditions, patients given the diagnosis fibromyalgia may have more specific worries given the controversies surrounding the criterion for the diagnosis and the lack of biomarkers or specific laboratory alterations. Variation in the criteria used for diagnosing fibromyalgia was observed across studies during this review. Recently, a new term “nociplastic pain” has been coined to explain the pathophysiology of CPP [42]. It is now proposed that CPP is characterized by altered nociceptive function rather than actual or threatened tissue damage [43]. In this study, we chose to focus on CPP or CPP-NOS, so a comparison with chronic secondary pain (pain arising from an identified source) was not made. Although there was no significant difference in PCS score between patients with CPP and CPP-NOS overall, these differences may differ by geographic region. We believe that most recent algorithm for ICD-11 chronic pain classification is necessary to solve this problem [44].
Limitations
In general, our analysis identified differences in PCS scores between countries, but it is difficult to conclude which factors these differences can be attributed to. This systematic review is also limited by the lower number of studies carried out in Asian countries compared to Western countries. The pain diagnoses were mostly mixed and varied in terms of the required duration of pain (i.e., > 3 months, 6 months, or 1 year). These differences may have biased the samples for the different language versions and countries.
Conclusion
The weighted PCS scores in Asian languages, particularly Japanese, are significantly higher than those in English, European, and other languages in patients with chronic primary (non-specific) pain. A difference in reference score of the PCS also appears to exist between language versions and countries in patients with chronic primary pain. Given the variation of PCS scores in different contexts, a universal comparison PCS reference or a cutoff score should not be used to compare different cultures even when a sample has the same pain condition.
Supplementary Information
Below is the link to the electronic supplementary material.
Acknowledgements
We would like to thank a research librarian for the assistance of comprehensive search.
Funding
No funding or sponsorship was received for the publication of this article.
Author Contributions
Kazuhiro Hayashi, Tatsunori Ikemoto, Anna Marcuzzi, Daniel Costa and Paul Wrigley conceptualized and designed the study. Tatsunori Ikemoto, Kazuhiro Hayashi, Yukiko Shiro, and Young-Chang Arai acquired the data. All authors discussed the data and involved in the interpretation of the data. Tatsunori Ikemoto drafted the article, and Anna Marcuzzi, Daniel Costa, and Paul Wrigley critically revised the article. All authors approved the final version of this article.
Disclosures
Tatsunori Ikemoto is a member of the Editorial Board of Pain and Therapy. Kazuhiro Hayashi, Yukiko Shiro, Young-Chang Arai, Anna Marcuzzi, Daniel Costa, and Paul Wrigley have nothing to disclose.
Compliance with Ethics Guidelines
This article is based on previously conducted studies and does not contain any new studies with human participants or animals performed by any of the authors.
Data Availability
All available data (xlsx file format) can be downloaded as a supplement file.
References
- 1.Sullivan MJL, Thorn B, Haythornthwaite JA, et al. Theoretical perspectives on the relation between catastrophizing and pain. Clin J Pain. 2001;17(1):52. https://journals.lww.com/clinicalpain/fulltext/2001/03000/theoretical_perspectives_on_the_relation_between.8.aspx. [DOI] [PubMed]
- 2.Sullivan MJL, Bishop SR, Pivik J. The pain catastrophizing scale: development and validation. Psychol Assess. 1995;7(4):524–32. https://psycnet.apa.org/fulltext/1996-10094-001.pdf.
- 3.Wertli MM, Burgstaller JM, Weiser S, Steurer J, Kofmehl R, Held U. Influence of catastrophizing on treatment outcome in patients with nonspecific low back pain: a systematic review. Spine. 2014;39(3):263–273. doi: 10.1097/BRS.0000000000000110. [DOI] [PubMed] [Google Scholar]
- 4.Crombez G, De Paepe AL, Veirman E, Eccleston C, Verleysen G, Van Ryckeghem DML. Let’s talk about pain catastrophizing measures: an item content analysis. PeerJ. 2020;4(8):e8643. doi: 10.7717/peerj.8643. [DOI] [PMC free article] [PubMed] [Google Scholar]
- 5.Rosenstiel AK, Keefe FJ. The use of coping strategies in chronic low back pain patients: relationship to patient characteristics and current adjustment. Pain. 1983;17(1):33–44. doi: 10.1016/0304-3959(83)90125-2. [DOI] [PubMed] [Google Scholar]
- 6.Butler RW, Damarin FL, Beaulieu C, Schwebel AI, Thorn BE. Assessing cognitive coping strategies for acute postsurgical pain. Psychol Assessment J Consult Clin Psychol. 1989;1(1):41–5. https://psycnet.apa.org/fulltext/1989-24575-001.pdf.
- 7.Vlaeyen JW, Geurts SM, Kole-Snijders AM, Schuerman JA, Groenman NH, van Eek H. What do chronic pain patients think of their pain? Towards a pain cognition questionnaire. Br J Clin Psychol. 1990;29(4):383–394. doi: 10.1111/j.2044-8260.1990.tb00901.x. [DOI] [PubMed] [Google Scholar]
- 8.Flor H, Behle DJ, Birbaumer N. Assessment of pain-related cognitions in chronic pain patients. Behav Res Ther. 1993;31(1):63–73. doi: 10.1016/0005-7967(93)90044-u. [DOI] [PubMed] [Google Scholar]
- 9.Hasenbring MI, Hallner D, Rusu AC. Fear-avoidance- and endurance-related responses to pain: development and validation of the Avoidance-Endurance Questionnaire (AEQ) Eur J Pain. 2009;13(6):620–628. doi: 10.1016/j.ejpain.2008.11.001. [DOI] [PubMed] [Google Scholar]
- 10.Ikemoto T, Hayashi K, Shiro Y, Arai Y-C, Marcuzzi A, Costa D, et al. A systematic review of cross-cultural validation of the pain catastrophizing scale. Eur J Pain. 2020;24(7):1228–1241. doi: 10.1002/ejp.1587. [DOI] [PubMed] [Google Scholar]
- 11.Park SJ, Lee R, Yoon DM, Yoon KB, Kim K, Kim SH. Factors associated with increased risk for pain catastrophizing in patients with chronic neck pain. Medicine (Baltimore) 2016;95(37):4698. doi: 10.1097/md.0000000000004698. [DOI] [PMC free article] [PubMed] [Google Scholar]
- 12.Takura T, Shibata M, Inoue S, et al. Socioeconomic value of intervention for chronic pain. J Anesth. 2016;30(4):553–561. doi: 10.1007/s00540-016-2162-9. [DOI] [PubMed] [Google Scholar]
- 13.Wheeler CHB, de Williams ACC, Morley SJ. Meta-analysis of the psychometric properties of the Pain Catastrophizing Scale and associations with participant characteristics. Pain. 2019;160(9):1946–1953. doi: 10.1097/j.pain.0000000000001494. [DOI] [PubMed] [Google Scholar]
- 14.Hsieh AY, Tripp DA, Ji L-J, Sullivan MJL. Comparisons of catastrophizing, pain attitudes, and cold-pressor pain experience between Chinese and European Canadian young adults. J Pain. 2010;11(11):1187–1194. doi: 10.1016/j.jpain.2010.02.015. [DOI] [PubMed] [Google Scholar]
- 15.Treede R-D, Rief W, Barke A, et al. Chronic pain as a symptom or a disease: the IASP classification of chronic pain for the International Classification of Diseases (ICD-11) Pain. 2019;160(1):19–27. doi: 10.1097/j.pain.0000000000001384. [DOI] [PubMed] [Google Scholar]
- 16.Treede R-D, Rief W, Barke A, et al. A classification of chronic pain for ICD-11. Pain. 2015;156(6):1003–1007. doi: 10.1097/j.pain.0000000000000160. [DOI] [PMC free article] [PubMed] [Google Scholar]
- 17.Moher D, Liberati A, Tetzlaff J, Altman DG, PRISMA Group. Preferred Reporting Items for Systematic Reviews and Meta-Analyses: the PRISMA statement. Ann Intern Med. 2009;151(4):264–9. 10.7326/0003-4819-151-4-200908180-00135. [DOI] [PubMed]
- 18.Stroup DF, Berlin JA, Morton SC, et al. Meta-analysis of observational studies in epidemiology: a proposal for reporting. JAMA. 2000;283(15):2008–12. https://jamanetwork.com/journals/jama/fullarticle/192614. [DOI] [PubMed]
- 19.Bramer W, Bain P. Updating search strategies for systematic reviews using EndNote. J Med Libr Assoc. 2017;105(3):285–289. doi: 10.5195/jmla.2017.183. [DOI] [PMC free article] [PubMed] [Google Scholar]
- 20.Kim SY, Park JE, Lee YJ, et al. Testing a tool for assessing the risk of bias for nonrandomized studies showed moderate reliability and promising validity. J Clin Epidemiol. 2013;66(4):408–414. doi: 10.1016/j.jclinepi.2012.09.016. [DOI] [PubMed] [Google Scholar]
- 21.Forsythe LP, Thorn B, Day M, Shelby G. Race and sex differences in primary appraisals, catastrophizing, and experimental pain outcomes. J Pain. 2011;12(5):563–572. doi: 10.1016/j.jpain.2010.11.003. [DOI] [PubMed] [Google Scholar]
- 22.Sharma S, Ferreira-Valente A, de Williams AC, Abbott JH, Pais-Ribeiro J, Jensen MP. Group differences between countries and between languages in pain-related beliefs, coping, and catastrophizing in chronic pain: a systematic review. Pain Med. 2020;21(9):1847–62. 10.1093/pm/pnz373.. [DOI] [PMC free article] [PubMed]
- 23.Tylor BE. Harry Houdini Collection (Library of Congress). Primitive culture: researches into the development of mythology, philosophy, religion, language, art, and custom. London: John Murray/New York: G.P. Putnam’s Sons; 1920. https://www.worldcat.org/title/primitive-culture-researches-into-the-development-of-mythology-philosophy-religion-language-art-and-custom/oclc/2439197.
- 24.Organization for Economic Co-operation and Development (OECD). Health at a glance. 2017. 10.1787/health_glance-2017-en. Accessed 10 Dec 2021.
- 25.Sakamoto H, Rahman M, Nomura S, et al. Japan health system review. 2018. https://apps.who.int/iris/handle/10665/259941. Accessed 10 Dec 2021.
- 26.Barsky AJ, Borus JF. Functional somatic syndromes. Ann Intern Med. 1999;130(11):910–921. doi: 10.7326/0003-4819-130-11-199906010-00016. [DOI] [PubMed] [Google Scholar]
- 27.Carroll LJ, Cassidy JD, Côté P. The role of pain coping strategies in prognosis after whiplash injury: passive coping predicts slowed recovery. Pain. 2006;124(1–2):18–26. doi: 10.1016/j.pain.2006.03.012. [DOI] [PubMed] [Google Scholar]
- 28.MacNeela P, Doyle C, O’Gorman D, Ruane N, McGuire BE. Experiences of chronic low back pain: a meta-ethnography of qualitative research. Health Psychol Rev. 2015;9(1):63–82. doi: 10.1080/17437199.2013.840951. [DOI] [PubMed] [Google Scholar]
- 29.Honeyman PT, Jacobs EA. Effects of culture on back pain in Australian aboriginals. Spine. 1996;21(7):841–843. doi: 10.1097/00007632-199604010-00013. [DOI] [PubMed] [Google Scholar]
- 30.Uritani D, Kasza J, Campbell PK, Metcalf B, Egerton T. Psychological difference between Japanese and Australian patients with knee osteoarthritis. Osteoarthr Cartil. 2020;28:S383–4. 10.1016/j.joca.2020.02.598..
- 31.Obelieniene D, Schrader H, Bovim G, Miseviciene I, Sand T. Pain after whiplash: a prospective controlled inception cohort study. J Neurol Neurosurg Psychiatry. 1999;66(3):279–283. doi: 10.1136/jnnp.66.3.279. [DOI] [PMC free article] [PubMed] [Google Scholar]
- 32.Rodrigues-de-Souza DP, Palacios-Ceña D, Moro-Gutiérrez L, Camargo PR, Salvini TF, Alburquerque-Sendín F. Socio-cultural factors and experience of chronic low back pain: a Spanish and Brazilian Patients’ Perspective. A Qualitative Study. PLoS One. 2016;11(7):e0159554. 10.1371/journal.pone.0159554. [DOI] [PMC free article] [PubMed]
- 33.Cano A, Gestoso M, Kovacs F, Hale C, Mufraggi N, Abraira V. The perceptions of people with low back pain treated in the Spanish National Health, and their experience while undergoing a new evidence-based treatment. A focus group study. Disabil Rehabil. 2014;36(20):1713–22. 10.3109/09638288.2013.869625.. [DOI] [PubMed]
- 34.Fuentes A, Ackermann RR, Athreya S, et al. AAPA statement on race and racism. Am J Phys Anthropol. 2019;169(3):400–402. doi: 10.1002/ajpa.23882. [DOI] [PubMed] [Google Scholar]
- 35.Chiao JY, Blizinsky KD. Culture-gene coevolution of individualism-collectivism and the serotonin transporter gene. Proc Biol Sci. 2010;277(1681):529–537. doi: 10.1098/rspb.2009.1650. [DOI] [PMC free article] [PubMed] [Google Scholar]
- 36.Nakamura T, Muramatsu T, Ono Y, et al. Serotonin transporter gene regulatory region polymorphism and anxiety-related traits in the Japanese. Am J Med Genet. 1997;74(5):544–545. doi: 10.1002/(sici)1096-8628(19970919)74:5<544::aid-ajmg18>3.0.co;2-c. [DOI] [PubMed] [Google Scholar]
- 37.Murakami F, Shimomura T, Kotani K, Ikawa S, Nanba E, Adachi K. Anxiety traits associated with a polymorphism in the serotonin transporter gene regulatory region in the Japanese. J Hum Genet. 1999;44(1):15–17. doi: 10.1007/s100380050098. [DOI] [PubMed] [Google Scholar]
- 38.Caspi A, Sugden K, Moffitt TE, Taylor A, Craig IW, Harrington H, et al. Influence of life stress on depression: moderation by a polymorphism in the 5-HTT gene. Science. 2003;301(5631):386–389. doi: 10.1126/science.1083968. [DOI] [PubMed] [Google Scholar]
- 39.Sen S, Burmeister M, Ghosh D. Meta-analysis of the association between a serotonin transporter promoter polymorphism (5-HTTLPR) and anxiety-related personality traits. Am J Med Genet B Neuropsychiatr Genet. 2004;127B(1):85–89. doi: 10.1002/ajmg.b.20158. [DOI] [PubMed] [Google Scholar]
- 40.Frodl T, Koutsouleris N, Bottlender R, et al. Reduced gray matter brain volumes are associated with variants of the serotonin transporter gene in major depression. Mol Psychiatry. 2008;13(12):1093–1101. doi: 10.1038/mp.2008.62. [DOI] [PubMed] [Google Scholar]
- 41.Blankstein U, Chen J, Diamant NE, Davis KD. Altered brain structure in irritable bowel syndrome: potential contributions of pre-existing and disease-driven factors. Gastroenterology. 2010;138(5):1783–1789. doi: 10.1053/j.gastro.2009.12.043. [DOI] [PubMed] [Google Scholar]
- 42.Nicholas M, Vlaeyen JWS, Rief W, Barke A, Aziz Q, Benoliel R, et al. The IASP classification of chronic pain for ICD-11: chronic primary pain. Pain. 2019;160(1):28–37. doi: 10.1097/j.pain.0000000000001390. [DOI] [PubMed] [Google Scholar]
- 43.Kosek E, Cohen M, Baron R, Gebhart GF, Mico J-A, Rice ASC, et al. Do we need a third mechanistic descriptor for chronic pain states? Pain [Internet] 2016;157(7):1382–1386. doi: 10.1097/j.pain.0000000000000507. [DOI] [PubMed] [Google Scholar]
- 44.Korwisi B, Hay G, Attal N, et al. Classification algorithm for the International Classification of Diseases-11 chronic pain classification: development and results from a preliminary pilot evaluation. Pain. 2021;162(7):2087–2096. doi: 10.1097/j.pain.0000000000002208. [DOI] [PubMed] [Google Scholar]
Associated Data
This section collects any data citations, data availability statements, or supplementary materials included in this article.
Supplementary Materials
Data Availability Statement
All available data (xlsx file format) can be downloaded as a supplement file.