Abstract
In nature, simple organisms evolved mechanisms to form intricate biosilica nanostructures, far exceeding current synthetic manufacturing. Based on the properties of extracted biomacromolecules, polycation–polyanion pairs were suggested as moderators of biosilica formation. However, the chemical principles of this polymer‐induced silicification remain unclear. Here, we used a biomimetic polycation–polyanion system to study polymer‐induced silicification. We demonstrate that it is the polymer phase separation process, rather than silica–polymer interactions, which controls silica precipitation. Since ionic strength controls this electrostatic phase separation, it can be used to tune the morphology and structure of the precipitates. In situ cryo electron microscopy highlights the pivotal role of the hydrated polymer condensates in this process. These results pave the road for developing nanoscale morphologies of bioinspired silica based on the chemistry of liquid‐liquid phase separation.
Keywords: Bioinspired Materials, Complex Coacervation, Diatoms, Liquid–Liquid Phase Separation, Nanostructured Silica
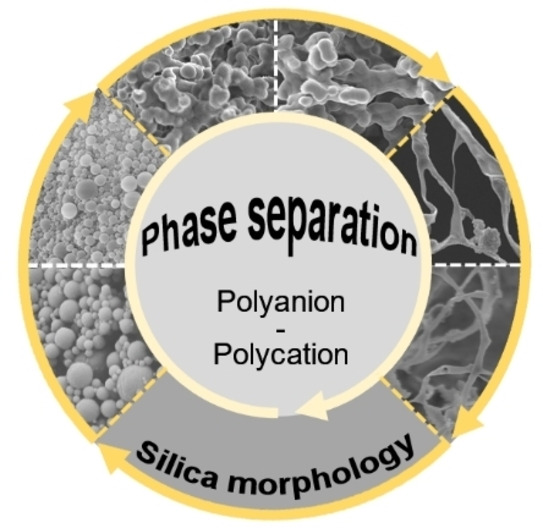
A bioinspired silicification process is reported, which is triggered by the phase separation of oppositely charged polymers. Since ionic strength is controlling the electrostatic phase separation process, it can be used to tune the morphology and structure of the silica precipitates.
Introduction
Nanostructured silica is a widely used material, with applications in food industries, paints, catalysis, and biomedical materials. [1] This is due to its high chemical stability, negligible cytotoxicity, and good biocompatibility. To meet the production requirements, a large number of synthetic techniques have been developed in recent decades. For instance, fumed silica is widely used in industry, but the harsh reaction conditions and high energy requirements restrict its applications in the current energy and environmentally conscious society. [2] The classical aqueous approaches, e.g. the Stöber sol–gel method, use toxic alkoxysilanes (Si(OR)4) as silica precursors and require organic solvents under highly basic conditions. [3] In addition, the available synthetic techniques have only limited control over the morphologies and\or composition of the silica products, which further limits their practical applications. [4]
In contrast, organisms synthesize silica under mild conditions, which provides inspiration for new routes for silica production. [5] Among the bio‐silicifying organisms, diatoms attract the most attention due to their sophisticated silica cell‐walls with 3D geometrical patterns.[ 6 , 7 , 8 ] Studies on diatom biosilica led to the discovery of silaffins (proteins with high silica affinity) which can trigger the precipitation of silica in vitro and control their morphologies. [9] In the silaffin sequences, the hydroxyl amino acids and serine residues are phosphorylated, and the lysine residues are modified with long‐chain polyamine (LCPAs) moieties. [10] The silica‐precipitating activity of silaffins crucially depends on these post‐translational modifications as dephosphorylated silaffins are unable to induce silica precipitation in vitro.[ 10 , 11 ] In addition, silaffins without LCPAs, such as the native silaffin‐2 (a negatively charged phosphoprotein), completely lose their silica‐precipitating activity. [12] Only addition of the polycations (e.g. native silaffin‐1A or LCPAs) induces silica precipitation.[ 10 , 12 ] These findings highlight the importance of both polycationic (LCPAs) and polyanionic (phosphoproteins) moieties in diatom biosilicification processes.
Inspired by the various macromolecules found in diatom silica, many synthetic polymers were used in numerous attempts to synthesize bioinspired silica. [13] The conceptual framework to understand the role of the polymers in these reactions varied from a role for the positively charged groups along the polymer chain in bringing silicon monomers close enough for further condensation to the formation of nanoscopic hybrid particles that are made of silica and polymers.[ 10 , 11 , 13 , 14 ] Importantly, the physical phenomenon of phase separation was invoked several times as a possible regulator of biological and bioinspired silicification.[ 15 , 16 , 17 , 18 , 19 , 20 ] It was suggested both as a morphogenesis process to yield the delicate nano‐patterning of diatom silica, and as a chemical process that drives the system into reactive chemical phases. However, without a clear understanding of the players and conditions that cause phase separation, these ideas are too vague to establish a practical working scheme. In parallel scientific disciplines, liquid‐liquid phase separation (or coacervation) processes have been shown to play important roles in biology and chemistry. During biological processes, liquid‐liquid phase separation have been shown as a strategy to compartmentalize chemical reactions and protect cellular materials.[ 21 , 22 , 23 ] In chemical syntheses, coacervate‐directed crystallization was achieved.[ 24 , 25 , 26 , 27 , 28 ]
In this work, we used synthetic polycations and polyanions, as well as an aqueous silica source, to investigate bioinspired polymer‐induced silicification under mild conditions. We show that each polymer alone stabilizes soluble silicon, whereas polymer mixtures induce silica precipitation. The formation of distinct silica morphologies could be achieved by controlling the process of polycation–polyanion phase separation. These results suggest that polycation–polyanion phase separation functions as the initial step in the silicification process, and that the sensitivity of the dense phase to ionic strength further affects the nanoscale morphologies of bioinspired silica.
Results and Discussion
We chose two widely used polymers, poly (allylamine hydrochloride) (PAH, Mw≈50 kDa) and poly (acrylic acid) (PAA, Mw≈15 kDa), to serve as model polycation and polyanion (Figure S1). The silicon source, soluble silicic acid (Si(OH)4), was obtained through dilution and acidification of a sodium silicate ((NaOH) x (Na2SiO3)y⋅z H2O) solution. This silicon source can better represent natural silicon sources than the widely used alkoxysilanes that catalytically break into soluble silicon and organic solvents. The experiments were conducted at pH 5.0 since it is estimated to be the physiological pH during biosilicification. [29]
Aggregation of the polymers was evaluated by dynamic light scattering (DLS) before studying polymer‐induced silicification. No particles were detected in 5 mM PAH or PAA (Figure 1a), that is, the soluble polymers do not significantly scatter light. Under low Si concentration (10 mM, σ=0.71 with respect to amorphous silica, σ is the supersaturation index, Table S1), a 4‐day induction period was needed for the formation of growing silica colloids in the absence of the polymers. On the other hand, the presence of either polymer led to the immediate formation of stable nanometer size clusters that do not coalesce to form a gel (Figure 1b). At a higher Si concentration (100 mM, σ=1.73), silica gelation occurred within few hours in the absence of the polymers (Figure 1c). The addition of the polymers slowed down the process, with PAH showing a relatively higher stabilizing effect of the silica sol, compared to PAA (Figure 1d). Nevertheless, after 48 hours, silica hydrogel formed in all of these samples (Figure 1e). In contrast to the concentration‐dependent interactions between each polymer and silicon, when both PAH and PAA were added to the soluble silicon solution, the result always was the immediate formation of stable colloids (Figure 1a–c). Irrespective of Si concentration, the colloids that formed in the presence of the two polymers had distinct macroscopic texture (Figure 1d), and microscopic particulate morphology (Figure 1e), suggesting that the single PAH or PAA function as inhibitors of the sol–gel process, but the presence of both of them together diverted the sol‐gel process into a different chemical pathway.
Figure 1.
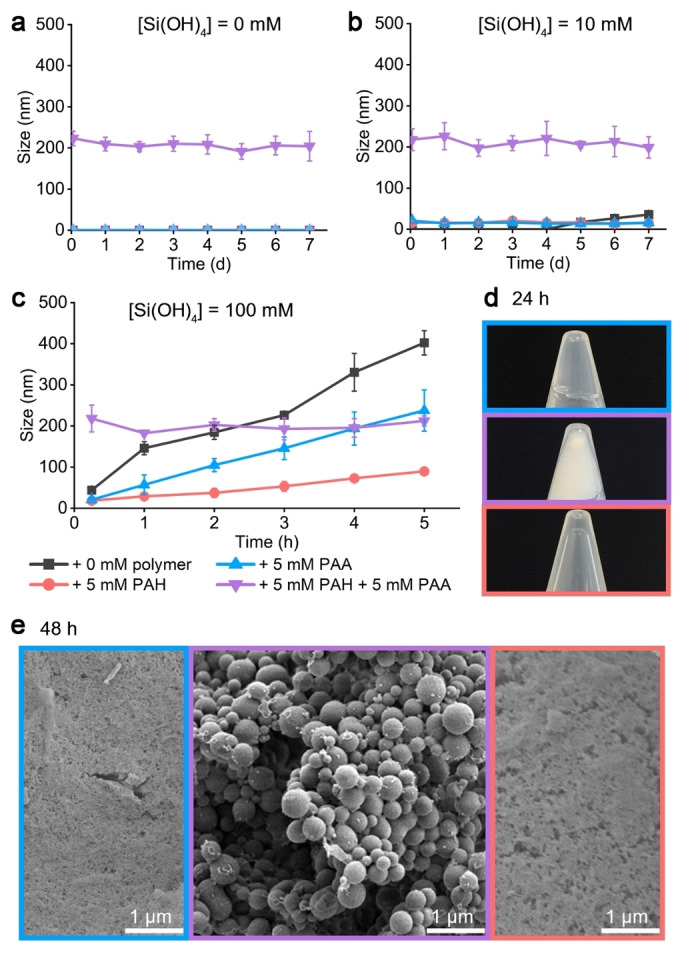
a)–c) Kinetics of polymer–silica and polymer–polymer precipitation detected by DLS measurements in solutions containing the indicated concentrations of polymers and Si. See Figure S2 for raw DLS data. d) Images of samples corresponding to panel (c) after 24 h, showing the formation of silica‐gel (5 mM PAA, blue), silica‐precipitate (5 mM PAH+5 mM PAA, purple), and a solution in a stabilized silica‐sol (5 mM PAH, red). e) SEM images of lyophilized precipitates of the same samples after 48 h, showing a granular texture for the dried silica gels (single polymer), and spherical particles in the presence of both PAH‐PAA.
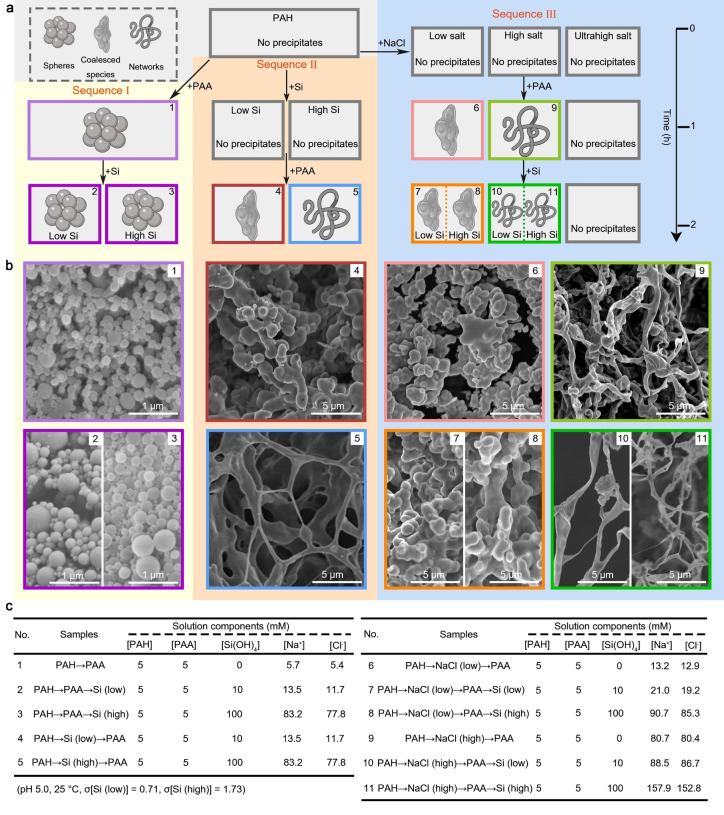
The particles that formed in the presence of the two polymers and Si are dense, and better represent biosilica than the single‐polymer silica gels. [9] Additionally, a previous study of a similar system suggested that phase separation of Si and the polycation molecules results in different morphologies of the final silica products. [16] To study this notion in detail, we divided the reaction sequence of the two‐polymer silicification into two: Sequence I—PAH→PAA→Si (allowing PAH to react with PAA first and then adding soluble Si), and Sequence II—PAH→Si→PAA (mixing PAH with soluble silicon and then adding PAA) (Figure 2a). Examining the precipitates of all stages of Sequence I with a scanning electron microscope (SEM) showed spherical particles, irrespective of the silicic acid concentration, which is in agreement with the DLS results (Figures 1b, c). This suggests that the morphologies of Sequence I precipitates are independent of Si concentrations. In contrast to Sequence I, Sequence II yielded precipitates only after adding PAA (the PAH−Si colloids were stable from aggregation, Figure 1c), and Si concentrations changed the morphologies of the precipitated silica from coalescent agglomerates at the low Si concentration, to networks at the high Si concentration (Figure 2b). It is important to note that we did not observe a clear hexagonal pattern as was previously proposed for similar sequence pair. [16] Altogether, these results confirm that the reaction sequence affects the morphologies of the final precipitates.
Figure 2.
a) A scheme illustrating the reaction sequences. Each step that yields visible precipitates has a numerical label that is used throughout this manuscript. b) SEM images showing the morphologies of collected samples after centrifugation and lyophilization. c) Nominal concentrations of the components under each experimental reaction. Note that Na and Cl ions originate from the polymer and silicon stock solutions, as well as from the addition of NaCl and pH adjustment.
A possibly overlooked difference between Sequence I and II is the conditions at which liquid‐liquid phase separation of the two polymers occurs. In Sequence I, the polymers interact at low ionic strength, whereas in Sequence II, because of the added silicic acid solution, the polymers interact at a much higher ionic strength. We investigated the effect of ionic strength on the morphology of the final precipitates by creating Sequence III—PAH→NaCl→PAA→Si. In Sequence III, different concentrations of NaCl are added to the PAH solution, yielding various ionic strength conditions under which PAH reacts with PAA. We added “low” (7.5 mM) and “high” (75 mM) NaCl concentrations, corresponding to the ionic strength of the two Si concentrations that were used in Sequence II (Figure 2c). Surprisingly, even though silicic acid was added at the end, as in Sequence I, the morphology of the precipitates of Sequence III was very similar to Sequence II. Importantly, the coalescent agglomerates and networks were observed once the polymers phase separated to form dense phases, even before silica addition (Figure 2b). Adding soluble silicon for silicification after phase separation did not influence their morphologies (Figure 2b). We surmise that it is the PAH‐PAA phase separation rather than silicification that determines the final morphologies of the precipitated silica. This notion is further supported by the fact that increasing the [NaCl] to 3 M, a concentration that allows complete mixing of the polymers, so phase separation is inhibited (Figure S3), no silica precipitation was observed within the 2 h of the experiment (Figure 2a). This observation suggests that phase separation is a prerequisite for the silica‐precipitating function of the polymers.
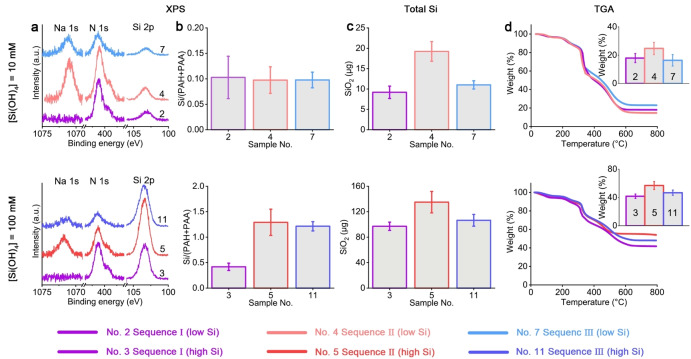
We used X‐ray photoelectron spectroscopy (XPS) to quantify the elemental compositions on the surface of the dried silica precipitates. All samples consist of C, O, N, Si, Cl, and usually Na (Figure 3a, Table S2). Intensities of nitrogen and carboxylic carbon peaks were used to quantify the concentrations of PAH and PAA, respectively, and then the mole ratio of Si to total polymer (PAH+PAA) (Figure 3b). At the low Si concentration, this ratio is ≈0.1 and similar between all Sequences, indicating a dominant organic fraction in the dense phase. At the high Si concentration, Sequence II and III are more silicified than Sequence I, reaching a molar fraction of about 1 : 1 between Si and organic functional groups. This suggests that both higher Si concentration and phase separation that occurs under high ionic strength results in more efficient silica precipitation.
Figure 3.
Chemical composition of the Si‐containing precipitates. a) High‐resolution XPS spectra of the Si 2p, N 1s, and Na 1s regions collected from samples with 10 mM and 100 mM Si. b) Si to total polymer (PAH+PAA) mole ratios derived from XPS data. See Table S2 for detailed elemental compositions. c), d) Bulk composition analyses of total extracted Si (c) and TGA (d, inserts show the inorganics weight fraction). Reaction conditions can be found in Figure 2c according to the sample labels.
We complemented the XPS analysis that shows surface content with two bulk analyses. First, the total amount of precipitated silica was quantified by measuring Si concentration after complete dissolution of the precipitates. This showed that higher Si concentrations in the medium are roughly linearly correlated to higher silicification efficiency (Figure 3c). We further performed thermogravimetric analysis (TGA) that can relate the ratio between the organic and inorganic fractions of the precipitates (Figure 3d). These analyses confirmed that Si content is varying between 20 % and 50 %, in agreement with the XPS results. These results suggest that in contrast to the morphology that is mostly affected by the polymer phase separation, the composition of the dried precipitates is primarily dictated by Si concentration. In addition, allowing PAH to react with soluble silicon first (Sequence II) results in the highest efficiency of precipitating silica.
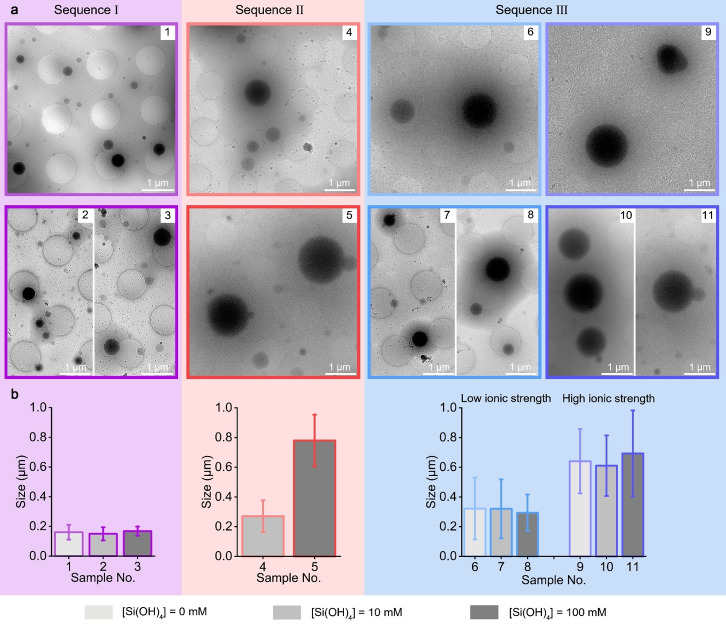
Investigating dried reaction products with imaging and analytical techniques is the most straightforward approach to study aqueous silicification. Nevertheless, the similar morphologies that were observed even without any added Si (Figure 2), prompted us to hypothesize that drying might affect the observed morphologies. In order to investigate the native‐state structure in situ, the reaction solution was vitrified on a transmission electron microscope (TEM) grid and observed using cryo‐TEM (Figure 4a). Surprisingly, the images show that the primary structure of all precipitates is of dense spherical particles within a dilute matrix. The difference between the various Sequences is in particle size, where high ionic strength leads to the formation of larger particles irrespective of the stage at which Si is introduced (Figures 4b and S4).
Figure 4.
a) Cryo‐TEM images revealing the native‐state of the polymer and silica precipitates. Reaction conditions are identical to Figure 2 (using the same color code and numerical labels). b) Particle sizes obtained from the TEM images analyses (N=100 for each sample).
The influence of hydration level and composition on the differences between the Sequences is manifested by the behavior of the dense particles under the electron beam. After 120 s of irradiation at cryo conditions, Sequence I particles were stable under the beam, whereas at the same irradiation conditions pores formed inside the Sequence III particles (Figure 5). We relate this difference to higher hydration level of Sequence III particles, which sublime into porous structures. Our reasoning is further validated by images of ex situ dried samples (similar to the SEM imaging). These room temperature TEM images show that dried Sequence I particles are still in the form of dense spheres, whereas dried Sequence III particles show net‐like mesostructures (Figure 5). We conclude that the morphological differences between the native structure (cryo‐TEM, Figures 4, 5) and dried structure (SEM and TEM, Figures 2, 5) is due to the drying procedure that involves centrifugation and lyophilization.
Figure 5.
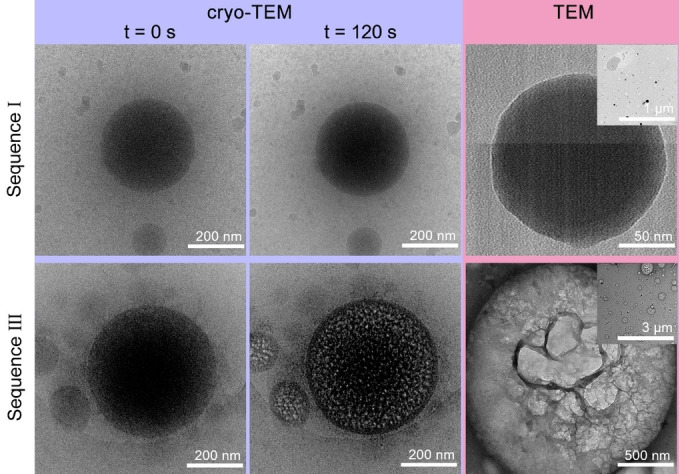
Morphological changes upon dehydration of the polymer dense phases. The effect of irradiation at cryo‐TEM on the polymer dense phases of Sequence I (No. 1) and III (No. 9) (left and middle panels) showing that Sequence III particles dry into porous structures. Conventional TEM images of the corresponding air‐dried samples (right panels) confirm that Sequence III particles have net‐like mesostructures. Note that in contrast to SEM samples, the TEM samples were not centrifuged and washed, thus condensation and particle fusion were inhibited, leading to smaller and distinct particles.
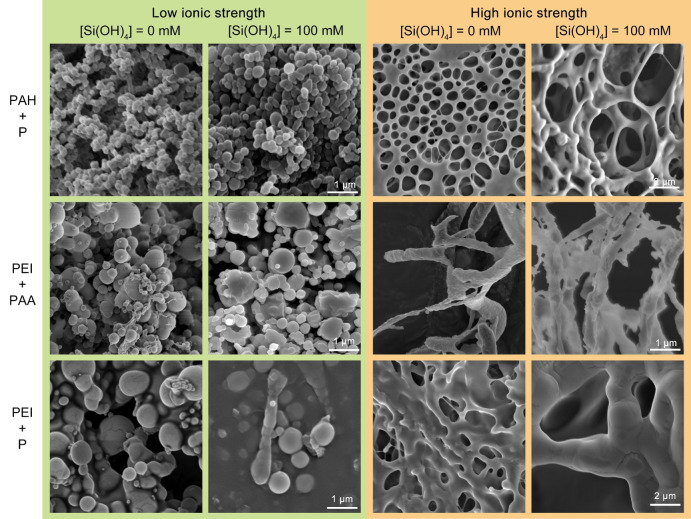
To test whether the influence of polymer phase separation on silicification is a universal phenomenon, we replaced PAA and PAH with phosphate ions and branched polyethyleneimine (PEI, Mw≈750 kDa, Figure S1), yielding three new pairs of oppositely charged molecules: PAH‐phosphate, PEI‐PAA, and PEI‐phosphate. Similar silicification experiments were conducted and morphologies of dried precipitates were examined. All different pairs show a similar behavior to the initial PAH‐PAA pair: at low ionic strength the precipitates are spherical particles and at high ionic strength they are networks, regardless of the extent of silicification (Figure 6). Even though the trend is similar, each pair required a calibration of the ionic strength conditions that result in each morphology (concentrations used in the experimental reactions are shown in Tables S3 and S4). For the PAH‐phosphate pair, higher NaCl concentration is needed for inducing the change from silica spheres to networks, whereas a lower NaCl concentration is needed in the PEI‐PAA system, necessitating “salting out” of the polymers with dialysis (see Experimental Section). These differences in ionic strength values can be explained by the stronger electrostatic interactions of phosphate\PAH compared to PAA\PEI (see charged species distribution, Figure S5), requiring more salt to weaken the reactions between PAH and phosphate. In other words, charge attraction between PEI and PAA is the weakest, leading to the formation of spherical coacervates at the lowest ionic strength, and interactions between PAH and phosphate are the strongest, requiring the highest ionic strength to produce networks. Thus, the stronger electrostatic attractions between polycations and polyanions lead to the formation of spheres and the weaker binding contributes to the formation of the networks.
Figure 6.
SEM images of the precipitates induced by various polymer pairs under low and high ionic strength conditions, with and without the presence of Si. Spheres and networks formed at the low and high ionic strengths irrespective of the presence of silica sources.
Nanopatterning of inorganic materials is a challenging nanotechnological goal, and the ability of organisms to sculpt such materials with species‐specific fidelity has been a rewarding inspiration source. [30] In the case of silica patterning, both in vivo and in vitro, liquid‐liquid phase separation has been proposed to play crucial roles.[ 10 , 15 ] However, the scientific attention was focused on the interactions between the Si precursors and polymers.[ 11 , 15 , 16 , 20 , 31 ] Here, we show that an initial phase separation of oppositely charged polymers followed by subsequent silicification is the mechanism underlying the mineralization process. This is evidenced by the similar morphologies of polymer precipitates with and without silica (Figure 2), demonstrating that the polymer dense phase serves as a facilitator of silicification. Furthermore, in situ characterization by cryo‐TEM shows the primary structure of these dense phases and their sensitivity to ionic strength (Figures 4 and 5). Altogether, we propose a new working hypothesis for silicification control that is regulated by properties of polymer dense phases during liquid‐liquid phase separation.
Ionic strength, in addition to other chemical and physical properties, is a key parameter in liquid–liquid phase separation of oppositely charged polymers.[ 25 , 32 , 33 , 34 ] High ionic strength leads to charge screening and weakening of the electrostatic interactions, giving rise to more hydrated and less dense polymer condensates. [35] Therefore, different morphologies of dried silicification products that were observed earlier [16] and in this study, reflect foremost the effect of drying a highly hydrated hybrid structure, rather than differential interactions of silica precursor with the different polymers. The more hydrated the dense phase is in solution, the higher the tendency of its native spherical shape to transform into networks upon drying (Figure 5). Besides the morphological regulation, phase separation that occurs under different ionic strength conditions affects silica content and composition. Sequence II yields the highest Si content (Figure 3).
Mineralization based on polymer phase separation could be a general approach for material synthesis, as the liquid‐like polymer dense phases have the potential to adopt engineered morphologies and compositions.[ 24 , 36 , 37 ] However, the degree of mineralization can be the most challenging aspect of this approach. In our crude model system, we produced hybrid materials with a maximum of ≈50 % silica content. It is possible that tailored reaction conditions and other polymers will be able to enhance silicification degree to around 90 %, which is similar to biosilica. [38] In this context it is interesting to note that previous bioinspired silicification products reported in the literature were rarely characterized for their silica fraction, and for the reported data silica content varied from 20 % to 80 %.[ 39 , 40 ]
Our findings also suggest a fresh view on the mechanism underlying the biological silicification of diatoms. Diatoms take up and accumulate stabilized intracellular Si in the range of hundreds of mM, [41] strongly exceeding silica saturation in dilute solution ([Si(OH)4] ≈2 mM), and control its polymerization inside dedicated organelles. [6] In our in vitro experimental system, PAH stabilized similar concentration of Si from gelation (even though for time periods of only days, Figure 1c), and the polymer dense phase serves as a host for silicification in a way that can be analogous to the silicifying organelle. In a wider perspective, it is possible that the widespread correlation between polycationic polymers and biosilica formation is related to the need to concentrate and stabilize Si, and the role of the negatively charged proteins is to transform the polycation‐stabilized Si into a polymer dense phase that facilitates silica polymerization. Another dominant example are sponges, a group of silicifying organisms, in which LCPAs are present. Nevertheless, sponge silicification may fundamentally differ as silicateins, enzymes that catalytically condense silica, are pivotal.[ 42 , 43 ]
Conclusion
Inspired by the zwitterionic macromolecules found in diatom biosilica, we established a biomimetic polycation–polyanion–soluble silicon system for studying polymer‐induced silicification. The results show that it is the ionic strength during polymer phase separation that controls the morphology and composition of the silica products. Therefore, polymer phase separation functions as an initial step‐promoting silicification, and the properties of the polymer dense phase can be used to control the nanoscale morphologies and compositions of bioinspired silica. In the future, it will be important to elucidate the chemical mechanism that enables the transition from the soluble silicon to the inorganic mineral phase within polymer dense phases.
Conflict of interest
The authors declare no conflict of interest.
1.
Supporting information
As a service to our authors and readers, this journal provides supporting information supplied by the authors. Such materials are peer reviewed and may be re‐organized for online delivery, but are not copy‐edited or typeset. Technical support issues arising from supporting information (other than missing files) should be addressed to the authors.
Supporting Information
Acknowledgements
We thank Dr. Haim Weissman for his help with cryo‐TEM measurements. This project has received funding from the European Research Council (ERC) under the European Union's Horizon 2020 research and innovation programme (grant agreement no. 848339).
H. Zhai, T. Bendikov, A. Gal, Angew. Chem. Int. Ed. 2022, 61, e202115930; Angew. Chem. 2022, 134, e202115930.
Data Availability Statement
The data that support the findings of this study are available in the Supporting Information of this article.
References
- 1. Patwardhan S. V., Chem. Commun. 2011, 47, 7567–7582. [DOI] [PubMed] [Google Scholar]
- 2. Hyde E. D. E. R., Seyfaee A., Neville F., Moreno-Atanasio R., Ind. Eng. Chem. Res. 2016, 55, 8891–8913. [Google Scholar]
- 3. Stöber W., Fink A., Bohn E., J. Colloid Interface Sci. 1968, 26, 62–69. [Google Scholar]
- 4. Curley R., Holmes J. D., Flynn E. J., Appl. Nanosci. 2021, 11, 1777–1804. [Google Scholar]
- 5. Nassif N., Livage J., Chem. Soc. Rev. 2011, 40, 849–859. [DOI] [PubMed] [Google Scholar]
- 6. Kröger N., Poulsen N., Annu. Rev. Genet. 2008, 42, 83–107. [DOI] [PubMed] [Google Scholar]
- 7. Sumper M., Brunner E., Adv. Funct. Mater. 2006, 16, 17–26. [Google Scholar]
- 8. Hildebrand M., Chem. Rev. 2008, 108, 4855–4874. [DOI] [PubMed] [Google Scholar]
- 9. Kröger N., Deutzmann R., Sumper M., Science 1999, 286, 1129–1132. [DOI] [PubMed] [Google Scholar]
- 10. Kröger N., Lorenz S., Brunner E., Sumper M., Science 2002, 298, 584–586. [DOI] [PubMed] [Google Scholar]
- 11. Sumper M., Kröger N., J. Mater. Chem. 2004, 14, 2059–2065. [Google Scholar]
- 12. Poulsen N., Sumper M., Kröger N., Proc. Natl. Acad. Sci. USA 2003, 100, 12075–12080. [DOI] [PMC free article] [PubMed] [Google Scholar]
- 13. Annenkov V. V., Danilovtseva E. N., Pal'shin V. A., Verkhozina O. N., Zelinskiy S. N., Krishnan U. M., RSC Adv. 2017, 7, 20995–21027. [Google Scholar]
- 14. Annenkov V. V., Danilovtseva E. N., Pal'shin V. A., Aseyev V. O., Petrov A. K., Kozlov A. S., Patwardhan S. V., Perry C. C., Biomacromolecules 2011, 12, 1772–1780. [DOI] [PubMed] [Google Scholar]
- 15. Sumper M., Science 2002, 295, 2430–2433. [DOI] [PubMed] [Google Scholar]
- 16. Sumper M., Angew. Chem. Int. Ed. 2004, 43, 2251–2254; [DOI] [PubMed] [Google Scholar]; Angew. Chem. 2004, 116, 2301–2304. [Google Scholar]
- 17. Triantafillidis C., Elsaesser M. S., Hüsing N., Chem. Soc. Rev. 2013, 42, 3833–3846. [DOI] [PubMed] [Google Scholar]
- 18. Gordon R., Drum R. W., Int. Rev. Cytol. 1994, 150, 243–372. [DOI] [PubMed] [Google Scholar]
- 19. Brunner E., Lutz K., Sumper M., Phys. Chem. Chem. Phys. 2004, 6, 854–857. [Google Scholar]
- 20. Nakanishi K., Soga N., J. Non-Cryst. Solids 1992, 139, 1–13. [Google Scholar]
- 21. Brangwynne C. P., Eckmann C. R., Courson D. S., Rybarska A., Hoege C., Gharakhani J., Jülicher F., Hyman A. A., Science 2009, 324, 1729–1732. [DOI] [PubMed] [Google Scholar]
- 22. Hyman A. A., Weber C. A., Jülicher F., Annu. Rev. Cell Dev. Biol. 2014, 30, 39–58. [DOI] [PubMed] [Google Scholar]
- 23. Franzmann T. M., Jahnel M., Pozniakovsky A., Mahamid J., Holehouse A. S., Nüske E., Richter D., Baumeister W., Grill S. W., Pappu R. V., Hyman A. A., Alberti S., Science 2018, 359, eaao5654. [DOI] [PubMed] [Google Scholar]
- 24. Xu S., Zhang H., Qiao B., Wang Y., Cryst. Growth Des. 2021, 21, 7306–7325. [Google Scholar]
- 25. Sing C. E., Perry S. L., Soft Matter 2020, 16, 2885–2914. [DOI] [PubMed] [Google Scholar]
- 26. Keating C. D., Acc. Chem. Res. 2012, 45, 2114–2124. [DOI] [PMC free article] [PubMed] [Google Scholar]
- 27. Kuhrts L., Prévost S., Chevrier D. M., Pekker P., Spaeker O., Egglseder M., Baumgartner J., Pósfai M., Faivre D., J. Am. Chem. Soc. 2021, 143, 10963–10969. [DOI] [PMC free article] [PubMed] [Google Scholar]
- 28. Niu L. N., Jiao K., Qi Y. P., Yiu C. K. Y., Ryou H., Arola D. D., Chen J. H., Breschi L., Pashley D. H., Tay F. R., Angew. Chem. Int. Ed. 2011, 50, 11688–11691; [DOI] [PMC free article] [PubMed] [Google Scholar]; Angew. Chem. 2011, 123, 11892–11895. [Google Scholar]
- 29. Vrieling E. G., Gieskes W. W. C., Beelen T. P. M., J. Phycol. 1999, 35, 548–559. [Google Scholar]
- 30. Meldrum F. C., Cölfen H., Chem. Rev. 2008, 108, 4332–4432. [DOI] [PubMed] [Google Scholar]
- 31. Shi J. Y., Yao Q. Z., Li X. M., Zhou G. T., Fu S. Q., PLoS One 2013, 8, e61164. [DOI] [PMC free article] [PubMed] [Google Scholar]
- 32. Huang K. Y., Yoo H. Y., Jho Y., Han S., Hwang D. S., ACS Nano 2016, 10, 5051–5062. [DOI] [PubMed] [Google Scholar]
- 33. Li L., Srivastava S., Andreev M., Marciel A. B., De Pablo J. J., Tirrell M. V., Macromolecules 2018, 51, 2988–2995. [Google Scholar]
- 34. Tian Y., Tirrell M., Davis C., Wesson J. A., PLoS One 2021, 16, e0257515. [DOI] [PMC free article] [PubMed] [Google Scholar]
- 35. Priftis D., Tirrell M., Soft Matter 2012, 8, 9396–9405. [Google Scholar]
- 36. Gower L. B., Chem. Rev. 2008, 108, 4551–4627. [DOI] [PMC free article] [PubMed] [Google Scholar]
- 37. Rowland A. T., Cacace D. N., Pulati N., Gulley M. L., Keating C. D., Chem. Mater. 2019, 31, 10243–10255. [Google Scholar]
- 38. Volcani B. E. in Silicon and Siliceous Structures in Biological Systemsin (Ed.: Simpson T. L., Volcani B. E.), Springer, New York, 1981, pp. 157–200. [Google Scholar]
- 39. Li X., Yang T., Gao Q., Yuan J., Cheng S., J. Colloid Interface Sci. 2009, 338, 99–104. [DOI] [PubMed] [Google Scholar]
- 40. Patel P. A., Eckart J., Advincula M. C., Goldberg A. J., Mather P. T., Polymer 2009, 50, 1214–1222. [Google Scholar]
- 41. Kumar S., Rechav K., Kaplan-Ashiri I., Gal A., Sci. Adv. 2020, 6, eaaz7554. [DOI] [PMC free article] [PubMed] [Google Scholar]
- 42. Matsunaga S., Sakai R., Jimbo M., Kamiya H., ChemBioChem 2007, 8, 1729–1735. [DOI] [PubMed] [Google Scholar]
- 43. Brutchey R. L., Morse D. E., Chem. Rev. 2008, 108, 4915–4934. [DOI] [PubMed] [Google Scholar]
Associated Data
This section collects any data citations, data availability statements, or supplementary materials included in this article.
Supplementary Materials
As a service to our authors and readers, this journal provides supporting information supplied by the authors. Such materials are peer reviewed and may be re‐organized for online delivery, but are not copy‐edited or typeset. Technical support issues arising from supporting information (other than missing files) should be addressed to the authors.
Supporting Information
Data Availability Statement
The data that support the findings of this study are available in the Supporting Information of this article.


