

Abstract
Background and Purpose
The availability of cone‐beam CT perfusion (CBCTP) in angiography suites may improve large‐vessel occlusion (LVO) triage and reduce reperfusion times for patients presenting during extended time window. We aim to evaluate the perfusion maps correlation and agreement between multidetector CT perfusion (MDCTP) and CBCTP when obtained sequentially in patients undergoing endovascular therapy.
Methods
This is a prospective, pilot, single‐arm interventional cohort study of consecutive patients with anterior circulation LVO. All patients underwent MDCTP and CBCTP prior to endovascular therapy, generating cerebral blood flow (CBF), cerebral blood volume (CBV), mean transit time (MTT), and time‐to‐maximum/time to peak contrast concentration maps. We compared the two imaging modalities using three different methods: (1) six regions of interest (ROIs) placed in the anterior circulation territory; (2) ROIs placed in all 10 Alberta Stroke Program Early CT Score regions; and (3) ROI drawn around the entire ischemic area. ROI ratios (unaffected/affected area) were compared for all sequences in each method. We used the intraclass correlation coefficient to calculate the correlation between the studies. Bland‐Altman plots were also created to measure the degree of agreement. Finally, a sensitivity analysis was done comparing both modalities in patients with low infarct growth rate.
Results
Fourteen patients were included (median age 81 years [74‐87], 50% males, median National Institutes of Health Stroke Scale 19 [14‐22]). Median time between studies was 42 minutes (interquartile range 29‐61). Independently of the method used, we found moderate to excellent correlation in CBF, CBV, and MTT between modalities. CBF correlation further improved in patients with low infarct growth.
Conclusion
These results demonstrate promising accuracy of CBCTP in evaluating ischemic tissue in patients presenting with LVO ischemic stroke.
Keywords: cerebral perfusion imaging, cone‐beam computed tomography, endovascular therapy, multidetector computed tomography
INTRODUCTION
Endovascular thrombectomy (EVT) reduces mortality and improves functional outcomes in patients with acute ischemic stroke (AIS) due to anterior circulation large‐vessel occlusion (LVO). For late window (6‐24 hours from last known well) patients, multidetector CT perfusion (MDCTP) imaging is recommended for EVT selection. 1 , 2
Reperfusion delays lead to reduced rates of good outcome, making door‐to‐reperfusion time one of the most important predictors of functional outcomes. 3 , 4 , 5 , 6 Strategies to shorten workflow times, such as direct transfer to angiosuite, have been shown to significantly decrease door‐to‐reperfusion times and improve neurological recovery. 7 , 8 , 9 , 10 Advanced imaging availability in the angiography suite might further expedite triage for a patient presenting in the late treatment window by bypassing the conventional CT scanner.
Previous studies have reported the utility of CT and CT angiography (CTA) obtained by a cone‐beam CT in the angiosuite for identification of intracranial hemorrhage and LVO in stroke patients. 11 , 12 Using qualitative measurements, cone‐beam CT perfusion (CBCTP) was comparable to magnetic resonance perfusion and MDCTP in stroke patients. 13 , 14 Moreover, cerebral blood volume maps obtained by a cone‐beam CT were comparable to multidetector CT in a quantitative analysis. 15 However, the ability to quantitatively estimate cerebral blood flow (CBF) using a cone‐beam CT in the angiography suite is lacking.
In the present study, we evaluate the image acquisition correlation and agreement between CBCTP and MDCTP maps among LVO patients selected for EVT, using a new propriety dynamic perfusion software, generating the maps in a very short time period and estimating CBF. Finally, we used three different comparison methodologies to evaluate the brain areas that correlate better between MDCTP and CBCTP.
METHODS
Patient selection
This prospective, single‐arm interventional cohort study was conducted at a comprehensive stroke center after approval from the Institutional Review Board (ID 201710850) between December 2018 and April 2019. Inclusion criteria were age ≥18 years, AIS due to anterior circulation LVO (distal intracranial carotid and proximal horizontal segment of the middle cerebral artery) presenting within 24 hours after last known well (LKW), National Institutes of Health Stroke Scale (NIHSS) >5 at admission, and premorbid modified Rankin Scale <2. Exclusion criteria were patients with severe renal disease or a glomerular filtration rate less than 60 mg/dl at presentation, previous history of renal transplant, pregnant women, spontaneous recanalization, initial CTA at outside hospital, and migration of clot to a distal location at initial digital subtraction acquisition.
All patients received a unified pre‐EVT imaging protocol with a noncontrast CT, CTA, and MDCTP. All patients receiving intravenous (IV) tissue plasminogen activator had a persistent LVO at the time of imaging in the similar vessel location on multidetector CTA and first digital angiography acquisition run. Acute stroke management was delivered according to the then‐current American Heart Association guidelines. 16 Consent was obtained from the legally authorized representative while patients were taken to the angiography suite to avoid any delays in clinical care. If consent was obtained, a CBCTP was done during the EVT preparation process to prevent any arterial puncture delays.
Imaging protocols
Data acquisition
MDCTP images in the emergency department were acquired on either a 128 (SOMATOM Definition AS; Siemens AG, Forchheim, Germany) or a 192 slice (SOMATOM Force, Siemens AG) scanner. All scans were done with 40 ml of nonionic iodinated contrast (Isovue‐370) followed by 50 ml of saline. CTP protocol included a rapid sequential scanning, with four scans each 3 seconds apart, followed by 15 scans 1.5 seconds apart and another nine scans 3 seconds apart, totaling 28 scans over approximately 60 seconds. 17
CBCTP images in the operating room were acquired on a clinical biplane angiography system (Artis Zee, Siemens Healthineers, Forchheim, Germany) using a prototype acquisition mode enabling 10 consecutive C‐Arm rotations with data acquisition in forward and backward rotation (0.8 deg/frame, 248 projection images per rotation, 200 degrees angular extend of rotation). Contrast injection (60 ml of Isovue‐300 contrast layered with 60 ml of saline) and multi‐sweep acquisition were triggered simultaneously. The temporal resolution was approximately one sample every 5 seconds. Total scan acquisition time was 50 seconds, covering the arterial inflow, parenchymal phase, and venous outflow.
Image postprocessing
Acquired MDCTP projection datasets were reconstructed on a commercial software platform (Syngo.via, Siemens Healthineers, Forchheim, Germany). The following parameters were measured: CBF (measured in ml/100g/min), cerebral blood volume (CBV) (measured in ml/100g), mean transit time (MTT) (measured in seconds), and time‐to‐maximum (Tmax) (measured in seconds). Motion correction, segmentation, and vessel definition were applied to enhance a better temporal resolution. The in‐plane voxel resolution of the multidetector CT was 0.4 × 0.4 mm, and the slice thickness was 10 mm.
Subsequently, acquired CBCTP projection datasets were reconstructed on a prototype workstation (Siemens Healthcare, Erlangen, Germany) into CBF, CBV, MTT, and time‐to‐peak contrast concentration (TTP) (measured in seconds). Due to technical limitations, we could not obtain Tmax maps from our cone‐beam CT so that we used TTP as a Tmax surrogate. 18 Final volume was calculated as 512 × 512 × 394 voxels, and voxel size was 0.47 mm side length. An intensity value‐dependent filtering algorithm was applied to the underlying cone‐beam C‐arm CT images to reduce the influence of image noise. Care was taken to place the arterial input function in nearly identical locations for MDCTP and CBCTP map calculations. Stroke and neurointerventional teams were both blinded to any CBCTP information for the duration of the study (Figure 1).
FIGURE 1.
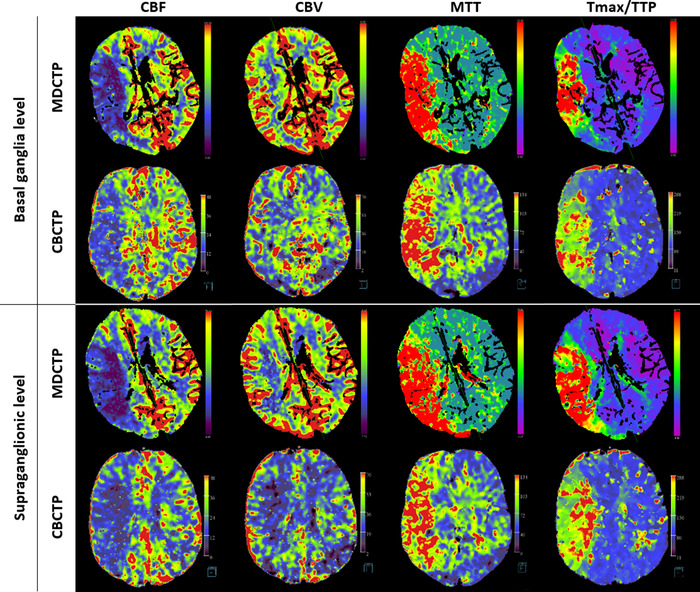
CT perfusion images from a patient with a right middle cerebral artery stroke. Multidetector CT and cone‐beam CT perfusion maps were reconstructed on a commercial software platform (Syngo.via, Siemens Healthineers, Forchheim, Germany) and on a prototype workstation (Siemens Healthcare, Erlangen, Germany), respectively. MTT, mean transit time; CBV, cerebral blood volume; CBF, cerebral blood flow; Tmax, time‐to‐maximum; TTP, time to peak contrast concentration
Image analysis
All the images were reviewed by an independent neurologist (DQO, with 6 years of experience in stroke imaging analysis), blinded to the clinical information except that of the affected sides. We co‐registered the perfusion maps from MDCT and CBCT to achieve similar region of interest (ROI) locations. To obtain CT perfusion parameters, ROIs were first placed on the affected side followed by mirror ROIs on the contralateral nonaffected side, thereby obtaining a similar size and location. ROI ratio values (ROI from the affected side/ ROI from the nonaffected side) from each perfusion map were compared between modalities. 19 We used three different sets of ROI measurement methods to compare both studies (Figure 2).
FIGURE 2.
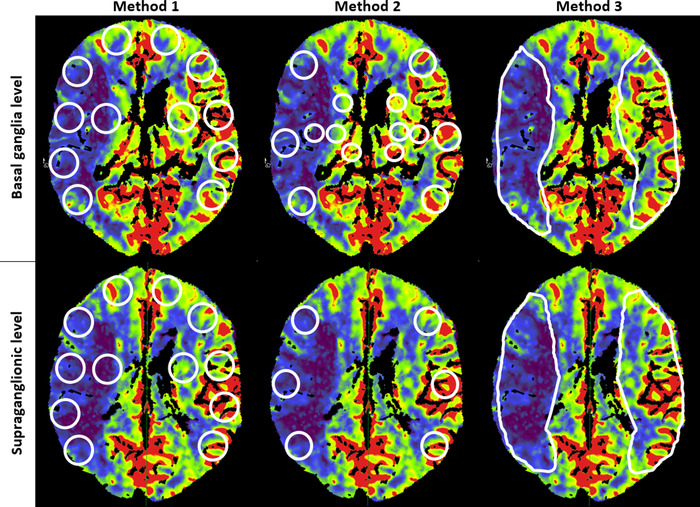
Sets of regions of interest measurement methods in a cerebral blood flow map from a patient with right middle cerebral artery stroke
Method 1 was based on topographic territories perfused by the anterior circulation. Six circular ROIs (each 400 mm2) per side were placed in the ganglionic region (orbitofrontal, anterior temporal, middle temporal, posterior temporal, temporooccipital, and internal capsule area) and supraganglionic levels (frontopolar, prefrontal, precentral, central, parietal, and corona radiata). A total of 168 matched ROI ratio values were compared between MDCTP and the corresponding CBCTP images. In method 2, circular ROIs were placed in the 10 areas of the middle cerebral artery vascular territory corresponding to the Alberta Stroke Program Early CT Score (ASPECTS) (cortical: 300 mm2, subcortical: 200 mm2). A total of 140 matched ROI ratio values were compared between MDCTP and the corresponding CBCTP images. In method 3, an ROI was manually drawn on the visually abnormal area of the perfusion maps followed by a mirror ROI on the nonaffected side at the basal ganglia and supraganglionic levels. For this measurement analysis, we excluded 1 patient due to limitations in drawing an ROI in the affected area. Thus, we compared 26 matched ROI ratio values between MDCTP and the corresponding CBCTP.
For infarct growth rate (IGR) calculation purposes only, we used an independent workstation to get the MDCTP RAPID software (iSchemaView, Menlo Park, CA) output to obtain the ischemic core (relative CBF <30%). We calculated the IGR by dividing CBF by last known well to MDCTP times. Then, we defined slow and fast progressors as an IGR <10 ml/hour and ≥10 ml/hour, respectively. 20 RAPID was not available for CBCTP; therefore, we did not use RAPID software calculations for comparing MDCTP to CBCTP.
Statistical analysis
Baseline characteristics were summarized using medians and interquartile ranges (IQR) for skewed continuous variables and by numbers and percentages for categorical variables. ROI values were compared between MDCTP and CBCTP for all the map sequences. Intraclass correlation coefficient (ICC) was calculated using average unit, consistency, two‐way random‐effects model. ICC values <0.5, 0.5‐0.75, 0.75‐0.9, and >0.9 indicate poor, moderate, good, and excellent correlation, respectively. 21 Agreement was also assessed by creating Bland‐Altman plots. Bland‐Altman analysis plots the difference between two parameters (MDCTP and CBCTP ROI ratios in each method) against the mean of these two parameters. A small variance indicates good inter‐measurement agreement, and a small mean difference shows a small measurement bias. 22
Finally, using the ROI ratios from method 1, we did a sensitivity analysis in slow progressors to evaluate the ICC in CBF to account for the potential variability of perfusion maps due to the interval infarct growth between scans. Statistical significance was set at p < .05. All the statistical analyses were performed using R version 3.3.0.
RESULTS
A total of 20 patients were consented to, and 14 were included in the study. Of the 6 excluded patients, 1 had a spontaneous recanalization, 1 had a clot migration into a distal vessel, 3 had poor image acquisitions, and 1 had a posterior circulation stroke despite the presentation suggestive of an anterior circulation stroke and without significant CTA findings.
Patient characteristics
The median age of the cohort was 81 years (IQR 74‐87) with seven (50%) males. The median NIHSS at admission was 19 (IQR 14‐22) and baseline ASPECTS was 7 (IQR 5‐7). Moreover, the median time from LKW to MDCTP was 258 minutes (IQR 204‐565) and MDCTP to CBCTP was 42 minutes (IQR 29‐61). Patient characteristics are summarized in Table 1.
TABLE 1.
Patient characteristics
| Clinical characteristics (N = 14) | |
|---|---|
| Age (years), median (IQR) | 81 (74‐87) |
| Male gender (%) | 7 (50) |
| Hypertension (%) | 13 (93) |
| Diabetes mellitus (%) | 3 (21) |
| Hyperlipidemia (%) | 6 (43) |
| Atrial fibrillation (%) | 7 (50) |
| Coronary artery disease (%) | 2 (14) |
| Congestive heart failure (%) | 2 (14) |
| Smoking (%) | 6 (43) |
| NIHSS at admission, median (IQR) | 19 (14‐22) |
| IV t‐PA (%) | 6 (43) |
| Radiological characteristics | |
| ASPECTS at baseline, median (IQR) | 7 (5‐7) |
| Occlusion site (%) | |
| Extracranial ICA | 0 |
| Intracranial ICA | 4 (31) |
| M1 MCA | 10 (77) |
| Procedural characteristics | |
| Successful reperfusion a (%) | 11 (79) |
| LKW to admission (minutes), median (IQR) | 243 (182‐544) |
| LKW to MDCTP (minutes), median (IQR) | 258 (204‐565) |
| MDCTP to CBCTP (minutes), median (IQR) | 42 (29‐61) |
| Outcomes | |
| mRS at 3 months (N = 11), median (IQR) | 4 (2‐6) |
| sICH b (%) | 0 |
Abbreviations: ASPECTS, Alberta Stroke Program Early CT Score; CBCTP, cone beam CT perfusion; ICA, internal carotid artery; IQR, interquartile range; IV t‐PA, intravenous tissue plasminogen activator; LKW, last known well; MCA, middle cerebral artery; MDCTP, multidetector CT perfusion; mRS, modified Rankin Score; mTICI, modified Treatment in Cerebral Ischemia; N, total number of patients; NIHSS, National Institutes of Health Stroke Scale; sICH, symptomatic intracerebral hemorrhage.
Successful reperfusion defined as mTICI 2b‐3.
sICH defined as any ICH causing neurologic deterioration (increase of ≥4 points in the NIHSS).
Perfusion maps comparison
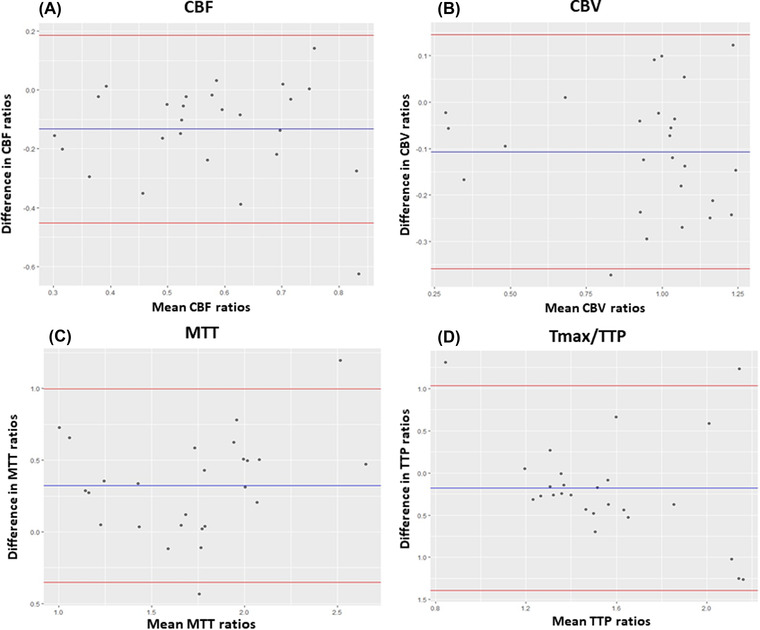
For method 1, we observed a moderate degree of correlation for CBF (ICC: 0.58, confidence interval [CI]: 0.42‐0.69), CBV (ICC: 0.65, CI: 0.53‐0.74), and Tmax/TTP (ICC: 0.52, CI: 0.35‐0.65) and a good degree of correlation for the MTT (ICC:0.77, CI: 0.68‐0.83). Bland‐Altman plots showed a good agreement and small variances with the mean difference of ROI ratios (bias) lying close to zero. Also, higher differences were observed with higher ROI mean ratios (Figure 3).
FIGURE 3.
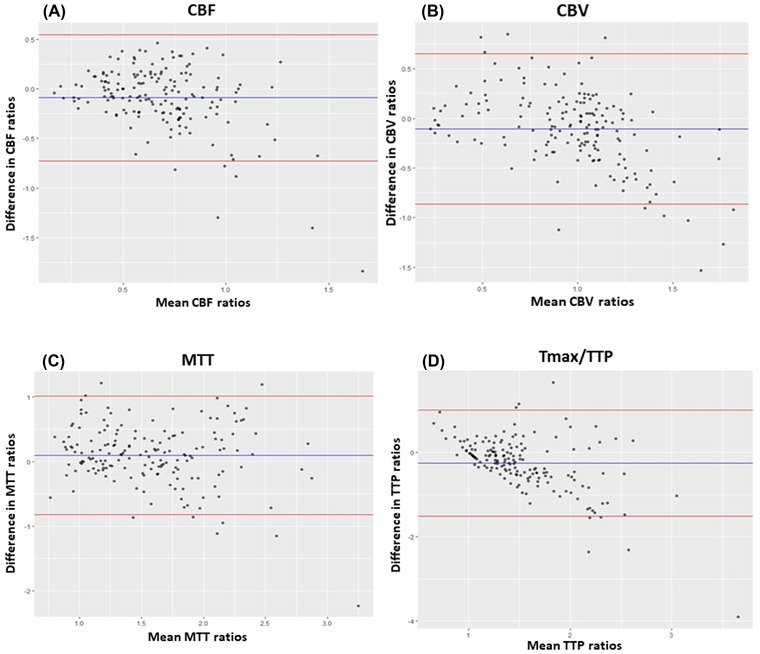
Bland‐Altman plots of CBF (A), CBV (B), MTT (C), and Tmax/TTP (D) between MDCTP and CBCTP using ROI ratios from method 1. The bias (blue line) and 95% confidence interval (red lines) are presented. CBCTP, cone‐beam CT perfusion; CBF, cerebral blood flow; CBV, cerebral blood volume; MDCTP, multidetector CT perfusion; MTT, mean transit time; Tmax, time‐to‐maximum; TTP, time to peak contrast concentration
For method 2, we found a moderate degree of correlation for CBF (ICC: 0.51, CI:0.32‐0.65), CBV (ICC: 0.57, CI: 0.4‐0.69), and MTT (ICC: 0.62, CI: 0.47‐0.73) and a poor correlation for Tmax/TTP (ICC: 0.32, CI: 0.05‐0.51). Bland‐Altman plots showed a good agreement with the mean of the ROI ratio differences close to zero and higher differences with higher ROI mean ratios (Figure 4). Finally, using the method 3, we found a moderate, good, and excellent degree of correlation in CBF (ICC: 0.7, CI: 0.34‐0.87), MTT (ICC: 0.83, CI: 0.62‐0.9), and CBV (ICC: 0.95, CI: 0.88‐0.98), respectively. However, there was a poor correlation for the Tmax/TTP (ICC: 0.15, CI: 0.79‐0.61). Bland‐Altman plots showed good agreement, although there was a higher range of variance but with outliers closer to the 2 standard deviation (Figure 5).
FIGURE 4.
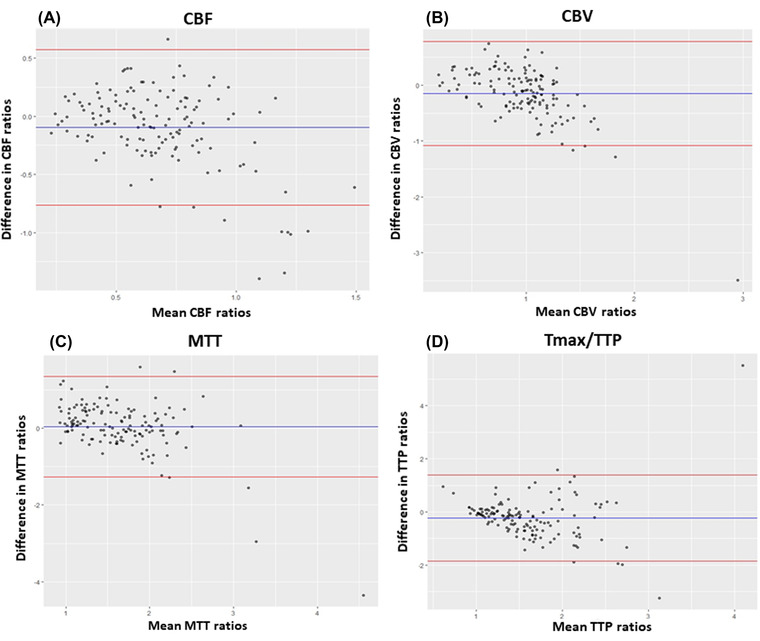
Bland‐Altman plots of CBF (A), CBV (B), MTT (C), and Tmax/TTP (D) between MDCTP and CBCTP using ROI ratios from method 2. The bias (blue line) and 95% confidence interval (red lines) are presented. CBCTP, cone‐beam CT perfusion; CBF, cerebral blood flow; CBV, cerebral blood volume; MDCTP, multidetector CT perfusion; MTT, mean transit time; Tmax, time‐to‐maximum; TTP, time to peak contrast concentration
FIGURE 5.
Bland‐Altman plots of CBF (A), CBV (B), MTT (C), and TTP (D) between MDCTP and CBCTP using ROI ratios from method 3. The bias (blue line) and 95% confidence interval (red lines) are presented. CBCTP, cone beam CT perfusion; CBF, cerebral blood flow; CBV, cerebral blood volume; MDCTP, multidetector CT perfusion; MTT, mean transit time; Tmax, time‐to‐maximum; TTP, time to peak contrast concentration
Sensitivity analysis in slow progressors
We identified nine (64%) slow progressors (IGR < 10 ml/hour). Slow progressors had a better correlation in CBF (ICC: 0.7, 95% CI: 0.56‐0.79) in comparison to the overall population (ICC: 0.58, CI: 0.42‐0.69) (Table 2).
TABLE 2.
Intraclass correlation coefficient between MDCTP and CBCTP evaluating CBF in slow and fast progressors
| ICC | CI | Correlation | ||
|---|---|---|---|---|
| Fast progressors | CBF | 0.56 | 0.26‐0.74 | Moderate |
| Slow progressors | CBF | 0.70 | 0.56‐0.79 | Moderate |
Abbreviations: CBCTP, cone‐beam CT perfusion; CBF, cerebral blood flow; CI, confidence interval; ICC: intraclass correlation coefficient; MDCTP, multidetector CT perfusion.
DISCUSSION
In this study, we demonstrated that the perfusion maps derived from multidetector CT (in the emergency department) and cone‐beam CT (in the angiography suite) among AIS patients with LVO are quantitatively equivalent with an overall moderate correlation and agreement using a new proprietary dynamic perfusion software to generate the maps and three different methods for comparisons. The software demonstrates promising accuracy to estimate CBF, a critical parameter to estimate ischemic tissue and triage LVO patients during the extended time window.
Semiquantitative values, such as the ROI ratios used in this study, have been considered more reliable than the absolute ROI values because they can reduce variations related to the technique (time of acquisition after contrast injection, time of contrast clearance after MDCTP) or image processing among software. 19 Core underestimation may be seen in patients receiving IV contrast prior to CTP imaging 23 ; however, Dorn et al. showed that prior IV contrast administration did not influence on the CTP parameters. 24 Moreover, the contrast dose received in CBCTP after MDCTP was relatively low since in our stroke triage CTA imaging protocol is derived from MDCTP and no additional bolus is given for CTA acquisition. 17
Overall, we obtained moderate to excellent correlations between MDCTP and CBCTP in our three types of methods. Using circular ROIs, method 1 had better correlations as it predominantly evaluates cortical areas having better collateral circulation. In contrast, method 2 that evaluated the ASPECTS regions had a lower correlation that is attributed to the subcortical ROIs providing a suboptimal differentiation of basal ganglia in perfusion maps. TTP has been reported as a suitable substitute for Tmax 18 ; however, we observed a poor correlation in Tmax/TTP maps in both methods 2 and 3. This disagreement is expectable from the different nature of the calculations. Where, TTP provides the absolute time between the completion of the second mask acquisition and peak contrast concentration for a given voxel, while Tmax is the maximum value of residue function that occurs after deconvolution. A compounding factor is that TTP for CBCTP maps is derived at a discrete interval, and due to the comparably low sampling rate and the high sampling rate of multidetector CT, an error of half the cone‐beam C‐arm CT acquisition time (∼2.5 seconds) can be expected.
The time interval between MDCTP and CBCTP was relatively short (median 42 minutes, IQR 29‐61), but some patients could have experienced a high IGR resulting in different perfusion volumes between studies. Because of this dynamic infarct progression, we hypothesized that slow progressors would have better ICCs in CBF than all subjects. To test it, we used the method 1 as it evaluates more cortical ROIs placed in affected and unaffected portions of the affected side and it could detect more perfusion changes between studies. Interestingly, we obtained a higher ICC for CBF in slow progressors that supports our findings that MDCTP and CBCTP are quantitatively comparable.
A previous study reported the high quality of CTA images derived from CBCTP acquisitions for identifying LVOs. 12 In addition, perfusion maps from the cone‐beam C‐arm CT were judged noninferior in making endovascular treatment decisions to MDCTP maps in ischemic stroke patients. 14 Moreover, a recent study using flat panel noncontrast CT in AIS‐LVO early window patients observed reduced reperfusion times and improved functional outcomes. 10 With the ability to obtain perfusion images in the angiography suite, potential AIS‐LVO late window patients may bypass the multidetector CT, thereby decreasing the workflow times of hospital arrival to recanalization. 7 , 8 , 9 , 25 In our previous study, we showed that direct admission to angiosuite for early window patients transferred to our center can reduce reperfusion times by a median of 73 minutes in comparison to patients directly admitted to the emergency department. 26 These results in conjunction to the shorter acquisition times (less than a minute), and postprocessing software to estimate accurate perfusion volumes on CBCTP 27 makes the direct admission to angiosuite in the late window a suitable alternative to stroke work flow to potentially improve the clinical outcomes.
Finally, recently it has been shown that more simplified method to triage late window patients for EVT can be as accurate as advance imaging. 28 While this might be true, the availability of a CBCTP in the angiosuite can tremendously assist interventionalists. CBCTP can potentially be used to triage patients with new indications for EVT such as middle or distal vessel occlusions, evaluate the hypoperfused tissue volume after achieving modified Treatment in Cerebral Ischemia 2b and then determine if after several passes it is worth pursuing further passes, or evaluate real‐time response pharmacological and endovascular therapies in delay cerebral ischemia. 29
Limitations
Our study has several limitations. First, it was performed at a single institute and the perfusion images were reviewed by only one investigator, limitation that was mitigated selecting the ROI in similar regions with similar areas. Second, our sample size was also small, and the results were obtained in research setting workstation; therefore, the real‐time effect magnitude was not measurable. Moreover, we worked with LKW times instead of last seen well to classify fast and slow progressors. Large multicenter studies with considerable sample size to detect changes in the current stroke workflow are required to validate the reliability of CBCTP and reproducibility of our results. Third, the employed angiography system was equipped with a 14‐bit detector, compared to 24 bit or higher detectors employed in multidetector CT systems. The comparable low bit‐depth results in a lower system capability of detecting small Hounsfield unit changes, as they are common in ischemic stroke imaging. Newer systems conventionally employ 16‐bit detector, overcoming this issue.
Cone‐beam C‐arm CT imaging is affected by a variety of detrimental factors on image quality such as photon scatter, beam hardening, and cone‐beam artifact. The influence of these in the context of perfusion map derivation has not been evaluated and can be a potential factor in our measurements. Hardware and software with improvements in motion correction, segmentation, and vessel definition could mitigate these effects.
In conclusion, our study showed that the degree of correlation and agreement between CBCTP and MDCTP for AIS patients with LVOs was overall moderate in most of the perfusion maps. Direct transfer to angiosuite with perfusion imaging for late window patients might significantly reduce reperfusion times and optimize patients’ functional clinical outcomes. Moreover, further validation of this technology will open potential opportunities to include real‐time perfusion information in EVT.
ACKNOWLEDGMENT AND DISCLOSURE
We sincerely thank Professor Emeritus Dr Charles Strother, MD for his guidance for the manuscript.Santiago Ortega‐Gutierrez is consultant for Medtronic and Stryker Neurovascular: modest. Colin P. Derdeyn is consultant for Penumbra, Nono, Genae (all DSMB for trials), Pulse Therapeutics, Equity (stock options). Sebastian Schafer is employee of Siemens Healthineers. Rest of authors declare no financial interests.
Ortega‐Gutierrez S, Quispe‐Orozco D, Schafer S, Farooqui M, Zevallos CB, Dandapat S, et al. Angiography suite cone‐beam CT perfusion for selection of thrombectomy patients: A pilot study. J Neuroimaging. 2022;32:493–501. 10.1111/jon.12988
Santiago Ortega‐Gutierrez and Darko Quispe‐Orozco contributed equally to this work.
Funding information
This work is supported by funding from the Siemens Medical Solutions USA, Inc through an investigator‐initiated grant mechanism. Siemens personnel were not involved in the design or execution of the study.
REFERENCES
- 1. Nogueira RG, Jadhav AP, Haussen DC, et al. Thrombectomy 6 to 24 hours after stroke with a mismatch between deficit and infarct. N Engl J Med 2018;378:11‐21. [DOI] [PubMed] [Google Scholar]
- 2. Albers GW, Marks MP, Kemp S, et al. Thrombectomy for stroke at 6 to 16 hours with selection by perfusion imaging. N Engl J Med 2018;378:708‐18. [DOI] [PMC free article] [PubMed] [Google Scholar]
- 3. Khatri P, Yeatts SD, Mazighi M, et al. Time to angiographic reperfusion and clinical outcome after acute ischaemic stroke: an analysis of data from the Interventional Management of Stroke (IMS III) phase 3 trial. Lancet Neurol 2014;13:567‐74. [DOI] [PMC free article] [PubMed] [Google Scholar]
- 4. Menon BK, Almekhlafi MA, Pereira VM, et al. Optimal workflow and process‐based performance measures for endovascular therapy in acute ischemic stroke: analysis of the Solitaire FR thrombectomy for acute revascularization study. Stroke 2014;45:2024‐9. [DOI] [PubMed] [Google Scholar]
- 5. Meretoja A, Weir L, Ugalde M, et al. Helsinki model cut stroke thrombolysis delays to 25 minutes in Melbourne in only 4 months. Neurology 2013;81:1071‐6. [DOI] [PubMed] [Google Scholar]
- 6. Mikulik R, Kadlecova P, Czlonkowska A, et al. Factors influencing in‐hospital delay in treatment with intravenous thrombolysis. Stroke 2012;43:1578‐83. https://www.ahajournals.org/doi/full/10.1161/STROKEAHA.111.644120. [DOI] [PubMed] [Google Scholar]
- 7. Psychogios MN, Behme D, Schregel K, et al. One‐stop management of acute stroke patients: minimizing door‐to‐reperfusion times. Stroke 2017;48:3152‐5. [DOI] [PubMed] [Google Scholar]
- 8. Ribo M, Boned S, Rubiera M, et al. Direct transfer to angiosuite to reduce door‐to‐puncture time in thrombectomy for acute stroke. J Neurointerv Surg 2018;10:221‐4. [DOI] [PubMed] [Google Scholar]
- 9. Jadhav AP, Kenmuir CL, Aghaebrahim A, et al. Interfacility transfer directly to the neuroangiography suite in acute ischemic stroke patients undergoing thrombectomy. Stroke 2017;48:1884‐9. [DOI] [PubMed] [Google Scholar]
- 10. Requena MMMA & García‐Tornel A. Direct to angiography suite without stopping for computed tomography imaging for patients with acute stroke a randomized clinical trial. Presented at the International Stroke Conference; March 17‐19, 2021; Denver. https://jamanetwork.com/journals/jamaneurology/article-abstract/2782751. [DOI] [PMC free article] [PubMed]
- 11. Payabvash S, Khan AA, Qureshi MH, et al. Detection of intraparenchymal hemorrhage after endovascular therapy in patients with acute ischemic stroke using immediate postprocedural flat‐panel computed tomography scan. J Neuroimaging 2016;26:213‐8. [DOI] [PubMed] [Google Scholar]
- 12. Yang P, Niu K, Wu Y, et al. Time‐resolved C‐Arm computed tomographic angiography derived from computed tomographic perfusion acquisition: new capability for one‐stop‐shop acute ischemic stroke treatment in the angiosuite. Stroke 2015;46:3383‐9. [DOI] [PubMed] [Google Scholar]
- 13. Struffert T, Deuerling‐Zheng Y, Kloska S, et al. Dynamic angiography and perfusion imaging using flat detector CT in the angiography suite: a pilot study in patients with acute middle cerebral artery occlusions. AJNR Am J Neuroradiol 2015;36:1964‐70. [DOI] [PMC free article] [PubMed] [Google Scholar]
- 14. Niu K, Yang P, Wu Y, et al. C‐Arm conebeam CT perfusion imaging in the angiographic suite: a comparison with multidetector CT perfusion imaging. AJNR Am J Neuroradiol 2016;37:1303‐9. [DOI] [PMC free article] [PubMed] [Google Scholar]
- 15. Struffert T, Deuerling‐Zheng Y, Kloska S, et al. Cerebral blood volume imaging by flat detector computed tomography in comparison to conventional multislice perfusion CT. Eur Radiol 2011;21:882‐9. [DOI] [PubMed] [Google Scholar]
- 16. Powers WJ, Rabinstein AA, Ackerson T, et al. 2018 Guidelines for the early management of patients with acute ischemic stroke: a guideline for healthcare professionals from the American Heart Association/American Stroke Association. Stroke 2018;49:e46‐e110. [DOI] [PubMed] [Google Scholar]
- 17. Limaye K, Bryant A, Bathla G, et al. Computed tomography angiogram derived from computed tomography perfusion done with low iodine volume protocol preserves diagnostic yield for middle cerebral artery‐M2 occlusions. J Stroke Cerebrovasc Dis 2019;28:104458. [DOI] [PubMed] [Google Scholar]
- 18. Wouters A, Christensen S, Straka M, et al. A comparison of relative time to peak and Tmax for mismatch‐based patient selection. Front Neurol 2017;8:539. [DOI] [PMC free article] [PubMed] [Google Scholar]
- 19. Kudo K, Sasaki M, Yamada K, et al. Differences in CT perfusion maps generated by different commercial software: quantitative analysis by using identical source data of acute stroke patients. Radiology 2010;254:200‐9. [DOI] [PubMed] [Google Scholar]
- 20. Sarraj A, Hassan AE, Grotta J, et al. Early infarct growth rate correlation with endovascular thrombectomy clinical outcomes: analysis from the SELECT study. Stroke 2021;52:57‐69. [DOI] [PubMed] [Google Scholar]
- 21. Koo TK, Li MY. A guideline of selecting and reporting intraclass correlation coefficients for reliability research. J Chiropr Med 2016;15:155‐63. [DOI] [PMC free article] [PubMed] [Google Scholar]
- 22. Bland JM, Altman DG. Statistical methods for assessing agreement between two methods of clinical measurement. Lancet 1986;1:307‐10. [PubMed] [Google Scholar]
- 23. Copelan AZ, Smith ER, Drocton GT, et al. Recent administration of iodinated contrast renders core infarct estimation inaccurate using RAPID software. AJNR Am J Neuroradiol 2020;41:2235‐42. [DOI] [PMC free article] [PubMed] [Google Scholar]
- 24. Dorn F, Liebig T, Muenzel D, et al. Order of CT stroke protocol (CTA before or after CTP): impact on image quality. Neuroradiology 2012;54:105‐12. [DOI] [PubMed] [Google Scholar]
- 25. Mendez B, Requena M, Aires A, et al. Direct transfer to angiosuite triage strategy for patients undergoing mechanical thrombectomy in a rural setting. Stroke 2018;49:2723‐7. https://www.ahajournals.org/doi/full/10.1161/SVIN.121.000124.30355182 [Google Scholar]
- 26. Mendez AA, Farooqui M, Dajles A, et al. Direct transfer to angiosuite triage strategy for patients undergoing mechanical thrombectomy in a rural setting. Stroke 2021;1:e000124. https://www.ahajournals.org/doi/full/10.1161/SVIN.121.000124 [Google Scholar]
- 27. Quispe‐Orozco D, Farooqui M, Zevallos C, et al. Angiography suite cone‐beam computed tomography perfusion imaging in large‐vessel occlusion patients using RAPID software: a pilot study. Stroke 2021;52:e542‐e4. [DOI] [PubMed] [Google Scholar]
- 28. Nguyen TN, Abdalkader M, Nagel S, et al. Noncontrast computed tomography vs computed tomography perfusion or magnetic resonance imaging selection in late presentation of stroke with large‐vessel occlusion. JAMA Neurol 2022;79:22‐31. https://jamanetwork.com/journals/jamaneurology/article-abstract/2785854. [DOI] [PMC free article] [PubMed] [Google Scholar]
- 29. Tsogkas I, Malinova V, Schregel K, et al. Angioplasty with the scepter C dual lumen balloon catheter and postprocedural result evaluation in patients with subarachnoid hemorrhage related vasospasms. BMC Neurol 2020;20:1‐8. [DOI] [PMC free article] [PubMed] [Google Scholar]