

Abstract
Objectives
Buccal bone augmentation in the esthetic zone is routinely used to achieve optimal clinical outcomes. Nonetheless, long‐term data are sparse, and it is unknown how baseline buccal bone volume affects the retention of the augmented volume over time.
Material and methods
This is a long‐term follow‐up retrospective case series. After a preoperative computed tomography scan, implants were placed in the anterior maxilla following guided bone regeneration, autogenous block grafting, or both. At the follow‐up, patients received a computed tomography scan and a clinical examination. Buccal bone volume was the primary outcome. Buccal bone thickness, peri‐implant, and esthetic parameters were secondary outcomes.
Results
After a median follow‐up of 6.7 years (interquartile range: 4.9–9.4), 28 implants in 19 patients (median age at augmentation: 43.3 years, interquartile range: 34.4–56.7, 53% female) were followed up. Preoperative buccal bone volume at baseline (V0) showed a moderate correlation to final buccal bone volume (Vt, rs = .43) but a strong correlation to the absolute volumetric change (ΔV = Vt–V0, rs = −.80). A linear mixed model for Vt had a large intercept of 91.39 (p < .001) and a rather small slope of .11 for V0 (p = .11). Observed differences between treatments were not statistically significant in the mixed model. V0 above 105 mm3 predicted a negative volume change (ΔV < 0) with a specificity of 100% and a sensitivity of 96%.
Conclusions
The results suggest higher gains in sites with lower V0 and point to a cutoff V0 above which the augmented volume is not retained long‐term.
Keywords: autogenous block, bone augmentation, buccal bone, guided bone regeneration, long‐term clinical study
1. INTRODUCTION
Bone augmentation is routinely used to overcome dimensional deficiencies of the alveolar ridge and achieve optimal clinical outcomes in dental implant therapy (Jepsen et al., 2019). Success criteria of dental implants have been expanded to include the patient's satisfaction with the appearance (Papaspyridakos et al., 2012). This importance of esthetic outcomes is especially relevant in the anterior maxilla (Cosyn et al., 2017). Interestingly, both clinicians and patients are more critical toward the esthetic outcomes of the soft tissue (i.e., pink esthetics) than of the prosthetics (i.e., white esthetics) (Meijndert et al., 2007). For satisfactory soft tissue outcomes, the buccal aspect of the alveolar ridge is of particular interest. It is assumed that a lack of buccal bone can cause labial recession of the soft tissue, compromising esthetic outcomes. Therefore, the high esthetic expectations in the anterior maxilla often prompt quasi‐prophylactic buccal overcontouring at sites that might be prone to future resorption. Resorption of the buccal bone begins shortly after extraction (Araújo & Lindhe, 2005). Moreover, remodeling of the alveolar bone continues even after augmentation (Araújo et al., 2015). Thus, to maintain satisfactory clinical outcomes, long‐term assessment of buccal bone stability is highly important.
Long‐term data on buccal bone stability are sparse (Lutz et al., 2015). Until now, previous research has concentrated on linear radiographic measurements of the buccal bone (Benic et al., 2012; Buser et al., 2013; Jung et al., 2015). These one‐dimensional measurements, routinely performed using a single sagittal tomography slice, might not accurately represent volumetric conditions and can be biased by several factors, including the abutment material (Liedke et al., 2017) and the thickness of the measured buccal bone itself (Domic et al., 2021). Further, the effect of preoperative bone dimensions on long‐term graft retention remains elusive. Preoperative bone width is inversely correlated with linear bone gain following augmentation (Naenni et al., 2019). Consequently, it is reasonable to assume a similar correlation between preoperative bone volume and the long‐term volumetric stability of the augmentation. Nevertheless, long‐term volumetric outcomes after buccal bone augmentation remain to be investigated. It is therefore unknown how baseline buccal bone volume affects the retention of the augmented volume over time.
Understanding long‐term volumetric outcomes following bone augmentation, specifically as a function of preoperative bone volume, is of high relevance for dental implant research and clinical practice alike. Previous work has already used volumetric measurements to evaluate short‐term outcomes (i.e., up to 1 year of follow‐up) after sinus floor elevation (Kirmeier et al., 2008; Kwon et al., 2019) and after ridge preservation (Avila‐Ortiz et al., 2020). There are further short‐term volumetric data on autogenous block grafting. However, these are largely contentious, with reported resorption after 1 year ranging from 13% (Kloss et al., 2018) to 44% (Stricker et al., 2021). In contrast to previous work, this study used three‐dimensional radiographic measurements to assess long‐term outcomes in the anterior maxilla. The specific aim was to assess whether baseline buccal bone volume predicts long‐term retention of the augmented volume. In addition to the volumetric measurements, linear radiographic measurements were performed, and clinical as well as esthetic parameters were assessed.
2. MATERIAL AND METHODS
2.1. Study design and participants
This long‐term retrospective consecutive case series was designed and conducted in accordance with the Declaration of Helsinki and its subsequent revisions (World Medical Association, 2013). The Ethics Committee of the Medical University of Vienna approved the study protocol (No 1562/2017). To be considered for this study, patients had to receive at least one dental implant (details shown in Table S1) in the anterior maxilla (in the region from canine to canine) with buccal bone augmentation according to one of three protocols: guided bone regeneration, autogenous block augmentation, or a combination of both techniques. For guided bone regeneration, autogenous cortical bone was mixed 1:1 with deproteinized bovine bone matrix (Bio‐Oss®, Geistlich, Wolhusen, Switzerland) and the graft was covered by a resorbable collagen membrane (Bio‐Gide®, Geistlich, Wolhusen, Switzerland ); the implant was placed in the same surgery. For block augmentation, autogenous blocks were harvested from either the mandibular retromolar area or the iliac crest and fixed in place using fixation screws; the implant was placed after 6 months of healing. Implants were allowed submucosal healing for 4 months. Surgeries took place between 2007 and 2016 at the Department of Oral Surgery of the Medical University of Vienna, University Clinic of Dentistry. Patients with edentulous jaws as well as patients with either treatment for a peri‐implant disease or implant loss were not considered. To be included in this study, patients had to have complete baseline three‐dimensional radiographic data available and participate in the long‐term follow‐up examination, to which all eligible patients were invited. All patients involved had provided their informed consent prior to inclusion in the study. Results are reported in accordance with STROBE criteria (von Elm et al., 2008).
2.2. Data acquisition and measurements
Preoperative CT scans of all patients were performed (Somatom Sensation 4, Siemens) at 120 kV and 80 mAs with a slice thickness of 0.5 mm to serve as baseline (i.e., before augmentation) measurements. Approximately 7 years later, as part of this study, a follow‐up CT scan was performed of all patients using the same settings, followed by a full clinical examination. Prior to analysis, all recorded data were pseudonymized by consecutive numbering of the specimens. The primary outcome of this study was buccal bone volume, measured in cubic millimeters. Prior to radiographic analysis, pseudonymized CT scans were exported as DICOM files. The DICOM files were then transferred to a workstation running Windows 10 using Java Runtime Environment 1.8.0_172 (64 bit) and checked for possible misalignments or other errors.
For the volumetric measurements, the region containing the implant was contained in a three‐dimensional side view 22 mm in width, 40 mm in height, and 5.9 mm in depth. This side view enclosed 59 sagittal slices resulting in a slice thickness of 100 μm. The bony contours, the implant axis, as well as the normal line to the implant axis were first marked up in the sagittal slice crossing the implant center (Figure 1a). Next, the region of interest (ROI) was defined by including 15 slices each in mesial and distal directions. Approximately every fifth slice was then annotated as described, resulting in a mean distance of 500 μm between annotated slices. Markups were interpolated for the slices between two annotated slices. Next, the area bound by the bony contours, the implant axis, and the normal line to the implant axis was measured in all 30 slices. Finally, the buccal bone volume in the ROI was calculated as the sum of the measured areas multiplied by the slice thickness.
FIGURE 1.
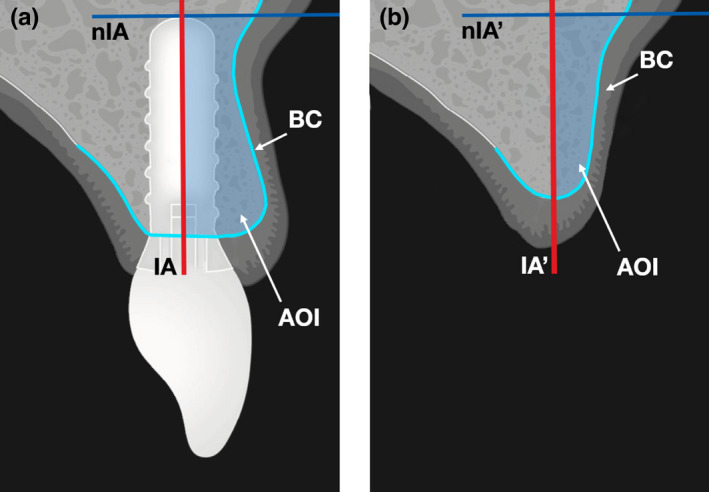
Radiographic measurements. (a) First, the slice crossing the implant center was identified on the follow‐up radiograph. Then, the bony contour (light blue line) was marked up. Finally, the implant axis (red line) was determined along with the normal line to the implant axis (dark blue line), the implant apex being the point of tangency. The region of interest was defined by including 15 slices each in mesial and distal directions. Approximately every fifth slice was then annotated as described, the markup was interpolated between two annotated slices. Finally, the area of interest (light blue area), defined between bony contour, implant axis, and normal line, was measured in all slices. Buccal volume was calculated as the sum of the measured areas multiplied by the slice thickness. AOI, area of interest; BC, bony contour; IA, implant axis; nIA, normal line to implant axis. (b) The buccal bony contour was marked up on the preoperative radiographs. The implant axis and the normal line were transposed to the preoperative radiographs. Buccal bone area was measured analogously to the postoperative radiographs. AOI, area of interest; BC, bony contour; IA′, transposed implant axis; nIA′, transposed normal line to implant axis
Next, post‐ and preoperative scans were registered to enable baseline buccal bone volume measurement. First, a line was drawn parallel to the buccal bone surface at the implant site with the center of the line in the center of the implant. This line was rotated by 90° and the stack resliced using an isotropic resolution of 100 µm px−1 parallel to this line with the center of the implant at the center of this new stack. For each patient, two landmarks were manually identified which could be located on all scans and the stacks were rotated and translated so that these landmarks are as closely aligned as possible. To further improve the alignment, a region was manually selected which did not exhibit major changes between time points and aligned using the Correct 3D Drift tool. This region included part of the sinus floor and the bone buccal of the sinus, cranial of the implant. The implant axis and the normal line to the implant axis were transposed from the post‐ to the preoperative scans and the bony contour was marked up as described (Figure 1b). Next, the area bound by the bony contours, the transposed implant axis, and the transposed normal line to the implant axis was measured in all 30 slices. As in the postoperative scans, the buccal bone volume in the ROI was calculated as the sum of the measured areas multiplied by the slice thickness. All measurements were performed using Fiji (Schindelin et al., 2012). The workflow of volumetric measurements is shown in Figure S1.
The secondary outcomes of this study were linear radiographic, periodontal, and esthetic parameters. For the linear radiographic measurements, the sagittal slices in the middle of the implant diameter were used. Buccal bone thickness was measured at distances of 2, 4 and 6 mm from the implant shoulder, perpendicular to the implant axis. Periodontal parameters included probing pocket depth, clinical attachment loss, as well as width of attached gingiva, and were assessed at the clinical examination using a CP12 periodontal probe. Esthetic parameters included the Pink Esthetic Score (Fürhauser et al., 2005) as well as the Papilla Presence Index (Jemt, 1997), and were assessed using standardized photographs (exposure time: 1/200 s, aperture: f/22, focal length: 100 mm) taken at the clinical examination (Canon EOS 5D Mark III with EF 100 mm f/2.8 L Macro IS USM and Macro Ring Lite MR‐14EX II, all Canon).
2.3. Statistical analysis
The sample included every eligible patient that participated in the study. Data were first collected in a spreadsheet (Excel 16.54 for Mac, Microsoft Corporation) and checked for possible errors. Consequently, the dataset was analyzed using Prism (Version 9.2.0, GraphPad Software) as well as the R statistical computing environment (Version 4.1.2, R Core Team). All recorded parameters were assessed in a descriptive manner. The relationship between baseline and final buccal bone volumes was analyzed using the Spearman correlation. The Spearman correlation was also used to analyze the relationship between final buccal bone volume and thickness. A linear mixed model was fitted for the final buccal bone volume using the baseline buccal bone volume as well as treatment groups as fixed effects (scored dichotomously for both guided bone regeneration and autologous block augmentation) and the patient as a random effect. The level of significance was set at ɑ = 0.05. The mixed model suggested to consider a cutoff score for buccal bone volume at baseline to predict long‐term retention of the augmented volume. Specificity and sensitivity were calculated with respect to increase or decrease of buccal bone volume.
3. RESULTS
3.1. Subject characteristics
After a median follow‐up of 6.7 years (interquartile range: 4.9–9.4), a total of 28 implants in 19 patients (median age at augmentation: 43.3 years, interquartile range: 34.4–56.7, 53% female) were included in this study. Of all patients, 12 (63%) indicated to be non‐smokers, compared to 7 (37%) smokers with a median of 7.9 pack years. Regarding comorbidities, 4 patients (21%) reported cardiovascular disease, 1 patient (5%) reported an antiresorptive agent following oncological treatment, and 1 patient (5%) reported psychotropic medication.
Of all implants, 5 (18%) were placed following guided bone regeneration, 12 (43%) were placed following autogenous block grafting, and 11 (39%) were placed following a combination of both techniques. Regarding prosthetics, 26 (93%) implants were restored with single crowns and 2 (7%) with a bridge. Of all prosthetic restorations, 26 (93%) positions were screw‐retained and 2 (7%) were cemented. All 28 implants (100%) survived through follow‐up. All 19 patients (100%) had sufficient molar support on both sides. A total of 9 (32%) crowns were in infraocclusion. Subject and implant characteristics are discussed in Table 1.
TABLE 1.
Subject and implant characteristics
| Patient parameters | Patients, n (%) | Implants, n (%) |
|---|---|---|
| Sex | ||
| Female | 10 (53) | 14 (50) |
| Male | 9 (47) | 14 (50) |
| Smoking | ||
| Non‐smoker | 12 (63) | 17 (61) |
| Smoker | 7 (37) | 11 (39) |
| Comorbidity & medication | ||
| Cardiovascular disease | 4 (21) | 6 (21) |
| Antiresorptive treatment | 1 (5) | 2 (7) |
| Psychotropic medication | 1 (5) | 1 (4) |
| Implant parameters | Implants, n (%) | |
|---|---|---|
| Augmentation technique | ||
| Guided bone regeneration | 5 (18) | |
| Autogenous block grafting | 12 (43) | |
| Both | 11 (39) | |
| Prosthetic restoration | ||
| Single crown | 26 (93) | |
| Bridge | 2 (7) | |
| Retention | ||
| Screw‐retained | 26 (93) | |
| Cemented | 2 (7) | |
| Occlusion | ||
| Normal occlusion | 19 (68) | |
| Infraocclusion | 9 (32) | |
3.2. Radiographic parameters
To assess long‐term changes in buccal bone volume, quantitative CT measurements were compared between baseline and follow‐up. Baseline and final buccal bone volumes showed a moderate positive correlation (rs = .43). Baseline buccal bone volume further showed a strong negative correlation to the change in volume, defined as the difference of the two measured volumes (rs = −.80; Figure 2). These descriptive observations are reflected in the results from the mixed model analysis, where the estimated intercept was 91.39 (p < .001) was rather large, whereas the increase of final buccal bone volume with increasing baseline buccal bone volume gave a fairly moderate slope of .11 (p = .11).
FIGURE 2.
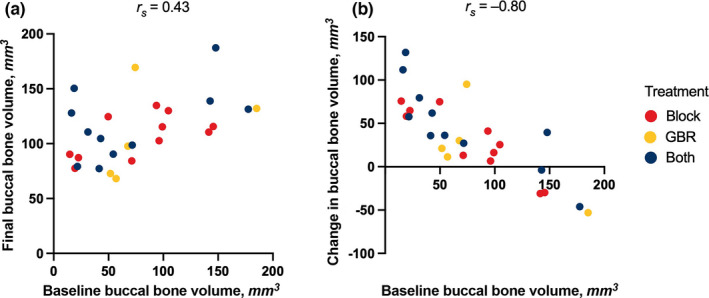
Changes in buccal bone volume. (a) Buccal bone volume showed a moderate correlation between baseline (i.e., before augmentation) and follow‐up after a median of 6.7 years (rs = .43). (b) Buccal bone volume further showed a strong correlation to the volumetric change to follow‐up (i.e., the difference of the two volumes, rs = –.80). Both appeared to be independent of the treatment allocation. All r‐values using the Spearman correlation. GBR, guided bone regeneration
The mean change in buccal bone volume was 20.9 ± 52.8 mm3 following guided bone regeneration, 35.9 ± 44.0 mm3 following autogenous block grafting, and 48.2 ± 49.7 mm3 following a combination of both (Figure S2). In the mixed model, the differences between methods of augmentation were not statistically significant, though this might be due to a lack of power given the rather small sample size. A combination of both treatments yielded on average 7.6 mm3 more volume than guided bone regeneration alone (p = .68) and 15.1 mm3 more than autologous block augmentation alone (p = .33).
There was further a strong correlation between final buccal bone volume and thickness at the 6 mm (rs = .64) distance, a medium correlation at the 4 mm distance (rs = .56), as well as a weak correlation at the 2 mm distance (rs = .32) measured from the implant shoulder (Figure S3). All measured correlations appeared to be independent of augmentation technique.
Finally, the mixed model suggested that for patients with larger baseline buccal bone volume no further improvement from the treatment can be expected. The exact cutoff will depend on the treatment and an estimator will not be particularly reliable given the rather small sample size. However, for the purpose of illustration we consider a cutoff point of 105 mm3, which corresponds to the point where in the mixed model no improvement is observed for the reference group (for different treatments the cutoff point would then become somewhat larger). Sites were categorized based on net loss (i.e., lower final volume than baseline volume). Mean baseline buccal bone volume was 158 ± 21 mm3 in the five sites with and 58 ± 35 mm3 in the 23 sites without net loss. Using baseline buccal bone volume above 105 mm3 to predict net loss results in a specificity of 100% and a sensitivity of 96% (Figure 3).
FIGURE 3.
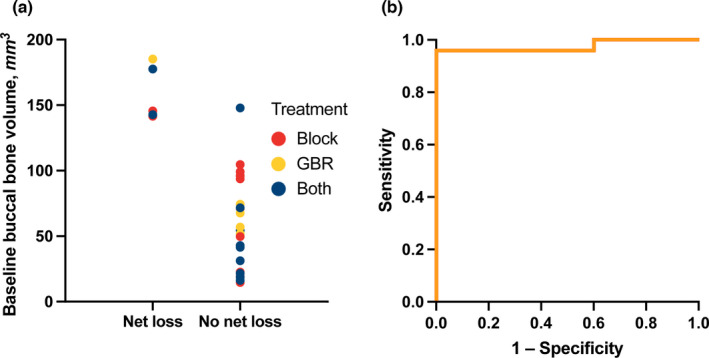
Estimation of cutoff baseline buccal bone volume. (a) Mean baseline buccal bone volume was 158 ± 21 mm3 (standard deviation) in the five sites with and 58 ± 35 mm3 in the 23 sites without net loss to follow‐up (i.e., lower volume at follow‐up than at baseline). The estimated cutoff baseline buccal bone volume for long‐term retention was 105 mm3. (b) Receiver operating characteristics curve. In sites with a baseline buccal bone volume above 105 mm3, the augmented volume was not retained long‐term with a specificity of 100% and a sensitivity of 96%. GBR, guided bone regeneration
In summary, there was a correlation between baseline and final buccal bone volumes. Further, a cutoff was estimated above which the augmented volume was not retained long‐term. This finding was corroborated by the linear mixed model.
3.3. Peri‐implant and esthetic parameters
To further assess long‐term outcomes after buccal bone augmentation in the esthetic zone, a clinical examination was performed at follow‐up. Parameters recorded at the clinical examination were analyzed in a descriptive manner. Peri‐implant parameters are reported as means and standard deviations. At follow‐up, patients showed a full‐mouth plaque score of 7% ± 7% and a full‐mouth bleeding score of 5% ± 9%. Probing pocket depth, measured at six sites per implant, was 2.6 ± 0.4 mm following guided bone regeneration, 3.4 ± 0.6 mm following autogenous block grafting, and 2.9 ± 0.8 mm following a combination of both. Clinical attachment loss, measured at six sites per implant, was 3.4 ± 1.1 mm following guided bone regeneration, 4.7 ± 1.4 mm following autogenous block grafting, and 4.0 ± 2.0 mm following a combination of both. Width of keratinized gingiva, measured at three sites per implant, was 5.7 ± 1.3 mm following guided bone regeneration, 4.7 ± 3.5 mm following autogenous block grafting, and 5.0 ± 1.6 mm following a combination of both (Figure 4).
FIGURE 4.
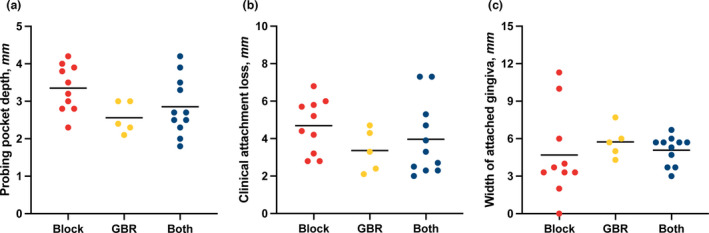
Peri‐implant parameters at follow‐up. (a) Probing pocket depth, measured at six sites per implant. (b) Clinical attachment loss, measured at six sites per implant. (c) Width of attached gingiva, measured at three sites per implant. Bars show means. GBR, guided bone regeneration
Esthetic parameters are reported as medians and interquartile ranges. The Pink Esthetic Score was 12.5 (4.3–13.5) following guided bone regeneration, 10.0 (8.8–11.5) following autogenous block grafting, and 8.0 (2.9–11.6) following a combination of both. The Papilla Presence Index was 2.3 (0.9–2.8) following guided bone regeneration, 2.0 (1.4–2.5) following autogenous block grafting, and 1.7 (0.4–2.5) following a combination of both (Figure 5).
FIGURE 5.
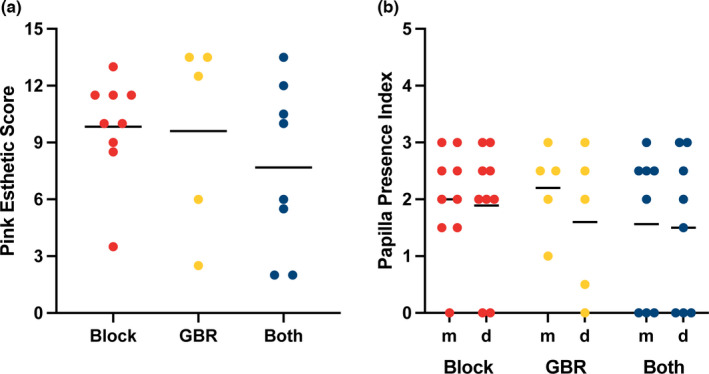
Esthetic parameters at follow‐up. (a) Pink Esthetic Score. (b) Papilla Presence Index at the mesial and distal aspects, respectively. Bars show medians. GBR, guided bone regeneration
4. DISCUSSION
The focus of this study was set on how baseline buccal bone volume affects long‐term retention of the augmented volume over time. The main finding is that after a median of 6.7 years, preoperative buccal bone volume correlated negatively with the volumetric change to follow‐up. That means with increasing buccal bone volume at baseline, the volumetric gains of augmentation decreased. Further, some sites with high baseline buccal bone volume even showed a lower volume at follow‐up than at baseline. A linear mixed model quantified this relationship and was used to motivate a cutoff of 105 mm3 for baseline buccal bone volume. After categorizing sites based on net loss, one could observe that augmenting sites above this cutoff baseline buccal bone volume did not result in any improvement (specificity = 100%), whereas for sites below this threshold there was only one without improvement (sensitivity = 96%). Taken together, the findings point to a higher therapeutic potential of augmentation in sites with lower baseline buccal bone volume.
The volumetric findings of this study relate to previous work showing long‐term linear stability of augmented buccal bone (Buser et al., 2013; Jung et al., 2015). The negative correlation between baseline bone volume and volumetric gain also supports previous work showing a similar negative correlation between baseline thickness and linear gain (Naenni et al., 2019). In this study, there was further a moderate correlation between baseline and final buccal bone volumes. It should be noted that two‐dimensional radiographic measurements are prone to inaccuracy if the thickness of the buccal bone is less than 1 mm (Domic et al., 2021). In our sample, this primarily affected the linear measurements 2 mm apically from the implant shoulder (Figure S3a). No intergroup analyses between different techniques were performed in this study; the current state of knowledge suggests that radiographic, peri‐implant, and esthetic parameters are largely comparable among different augmentation techniques (Jepsen et al., 2019).
The clinical relevance of these findings is twofold. First, the data support for the first time not only linear, but volumetric long‐term graft retention following buccal bone augmentation. In particular, the data suggest a high potential for augmentation in sites with low preoperative buccal bone volume (Figure 2b). Second, the data point to a threshold in preoperative buccal bone volume above which a net loss of volume to follow‐up could be measured. This cutoff value of 105 mm3 suggests that overcontouring more than clinically reasonable might be redundant as the augmented volume is not retained long‐term. Importantly, this finding should be interpreted with caution based on the low number of sites that showed net loss to follow‐up (Figure 3a). In addition, it should be noted that the exact number figure of the cutoff volume is a function of how the ROI is defined. Thus, it is not the value of 105 mm3 but the existence of a cutoff volume per se that is clinically relevant. In sum, the findings of this long‐term study largely support the clinical success of current bone augmentation practices in the esthetic zone.
The strength of this study lies in the quality of the dataset based on three‐dimensional radiographic measurements as well as the high median follow‐up of 6.7 years. The main limitation of this study is its relatively small sample size, which is nevertheless comparable to previous studies (Lutz et al., 2015; Stricker et al., 2021). The sample size also rendered the study underpowered to perform intergroup analyses between different augmentation techniques. Further, the augmented volume was not standardized because of the retrospective design of this study. Beside the baseline and long‐term follow‐up measurements, some of the patients had CT scans approximately 1 year after augmentation. Only 17 of the 28 implants have this data. As only complete data were used for this study, results from these CT scans were not included in the analysis. Nevertheless, a mean gain of 88.3 ± 52.3 mm3 between the baseline and 1‐year measurements suggests a similar augmented volume for the cohort. In addition, while the esthetic zone is of high subjective relevance to patients, this study did not assess patient‐reported outcomes. These limitations also identify opportunities for future research. Ideally, a prospective clinical study with a large sample size and equal distribution of patients between various treatments should be performed to further assess long‐term outcomes after bone augmentation in the esthetic zone. Further, while all CT scans in this study were performed with a low‐dose protocol with an effective dose of approximately 120 μSv (Laky et al., 2013), future research into this area should consider using cone beam CT to further reduce radiation exposure.
5. CONCLUSION
Within the limitations of this study, the results suggest higher long‐term gains in sites with a lower baseline buccal bone volume and point to a cutoff above which the augmented volume is not retained long‐term.
CONFLICT OF INTEREST
The authors have no conflict of interest to disclose.
AUTHOR CONTRIBUTIONS
Balazs Feher: Conceptualization (equal); Data curation (equal); Formal analysis (equal); Investigation (supporting); Methodology (supporting); Project administration (supporting); Visualization (lead); Writing – original draft (lead). Florian Frommlet: Data curation (equal); Formal analysis (equal); Methodology (lead); Visualization (supporting). Christian Ulm: Project administration (supporting); Supervision (equal); Writing – review & editing (equal). Reinhard Gruber: Data curation (equal); Investigation (supporting); Methodology (supporting); Project administration (supporting); Writing – original draft (lead). Ulrike Kuchler: Conceptualization (equal); Formal analysis; Investigation (lead); Project administration (lead); Writing – review & editing (supporting).
Supporting information
Fig S1
Fig S2
Fig S3
Table S1
Supplementary Material
Supplementary Material
ACKNOWLEDGEMENTS
The content is solely the responsibility of the authors and does not necessarily represent the official views of the Medical University of Vienna. The authors declare no conflicts of interest with respect to the authorship and/or publication of this article. The authors thank Drs. Sarah Metzker and Maximilian Neumayer as well as Mr. Patrick Heimel for their help with the radiographic analyses. The authors further thank Ms. Nadine Krier for taking the clinical photographs. The present study did not receive any funding.
Feher, B. , Frommlet, F. , Ulm, C. , Gruber, R. , & Kuchler, U. (2022). Preoperative buccal bone volume predicts long‐term graft retention following augmentation in the esthetic zone: A retrospective case series. Clinical Oral Implants Research, 33, 492–500. 10.1111/clr.13909
DATA AVAILABILITY STATEMENT
The source data that support the findings of this study are available from the corresponding author upon reasonable request.
REFERENCES
- Araújo, M. G. , da Silva, J. C. C. , de Mendonça, A. F. , & Lindhe, J. (2015). Ridge alterations following grafting of fresh extraction sockets in man. A randomized clinical trial. Clinical Oral Implants Research, 26(4), 407–412. 10.1111/clr.12366 [DOI] [PubMed] [Google Scholar]
- Araújo, M. G. , & Lindhe, J. (2005). Dimensional ridge alterations following tooth extraction. An experimental study in the dog. Journal of Clinical Periodontology, 32(2), 212–218. 10.1111/j.1600-051X.2005.00642.x [DOI] [PubMed] [Google Scholar]
- Avila‐Ortiz, G. , Gubler, M. , Romero‐Bustillos, M. , Nicholas, C. L. , Zimmerman, M. B. , & Barwacz, C. A. (2020). Efficacy of alveolar ridge preservation: A randomized controlled trial. Journal of Dental Research, 99(4), 402–409. 10.1177/0022034520905660 [DOI] [PubMed] [Google Scholar]
- Benic, G. I. , Mokti, M. , Chen, C. J. , Weber, H. P. , Hämmerle, C. H. , & Gallucci, G. O. (2012). Dimensions of buccal bone and mucosa at immediately placed implants after 7 years: A clinical and cone beam computed tomography study. Clinical Oral Implants Research, 23(5), 560–566. 10.1111/j.1600-0501.2011.02253.x [DOI] [PubMed] [Google Scholar]
- Buser, D. , Chappuis, V. , Bornstein, M. M. , Wittneben, J. G. , Frei, M. , & Belser, U. C. (2013). Long‐term stability of contour augmentation with early implant placement following single tooth extraction in the esthetic zone: A prospective, cross‐sectional study in 41 patients with a 5‐ to 9‐year follow‐up. Journal of Periodontology, 84(11), 1517–1527. 10.1902/jop.2013.120635 [DOI] [PubMed] [Google Scholar]
- Cosyn, J. , Thoma, D. S. , Hämmerle, C. H. , & De Bruyn, H. (2017). Esthetic assessments in implant dentistry: Objective and subjective criteria for clinicians and patients. Periodontology 2000, 73(1), 193‐202. 10.1111/prd.12163 [DOI] [PubMed] [Google Scholar]
- Domic, D. , Bertl, K. , Ahmad, S. , Schropp, L. , Hellén‐Halme, K. , & Stavropoulos, A. (2021). Accuracy of cone‐beam computed tomography is limited at implant sites with a thin buccal bone: A laboratory study. Journal of Periodontology, 92(4), 592–601. 10.1002/jper.20-0222 [DOI] [PMC free article] [PubMed] [Google Scholar]
- Fürhauser, R. , Florescu, D. , Benesch, T. , Haas, R. , Mailath, G. , & Watzek, G. (2005). Evaluation of soft tissue around single‐tooth implant crowns: The pink esthetic score. Clinical Oral Implants Research, 16(6), 639–644. 10.1111/j.1600-0501.2005.01193.x [DOI] [PubMed] [Google Scholar]
- Jemt, T. (1997). Regeneration of gingival papillae after single‐implant treatment. International Journal of Periodontics and Restorative Dentistry, 17(4), 326–333. [PubMed] [Google Scholar]
- Jepsen, S. , Schwarz, F. , Cordaro, L. , Derks, J. , Hämmerle, C. H. F. , Heitz‐Mayfield, L. J. , Hernández‐Alfaro, F. , Meijer, H. J. A. , Naenni, N. , Ortiz‐Vigón, A. , Pjetursson, B. , Raghoebar, G. M. , Renvert, S. , Rocchietta, I. , Roccuzzo, M. , Sanz‐Sánchez, I. , Simion, M. , Tomasi, C. , Trombelli, L. & Urban, I. (2019). Regeneration of alveolar ridge defects. Consensus report of group 4 of the 15th European workshop on periodontology on bone regeneration. Journal of Clinical Periodontology, 46(S21), 277–286. 10.1111/jcpe.13121 [DOI] [PubMed] [Google Scholar]
- Jung, R. E. , Benic, G. I. , Scherrer, D. , & Hämmerle, C. H. (2015). Cone beam computed tomography evaluation of regenerated buccal bone 5 years after simultaneous implant placement and guided bone regeneration procedures–a randomized, controlled clinical trial. Clinical Oral Implants Research, 26(1), 28–34. 10.1111/clr.12296 [DOI] [PubMed] [Google Scholar]
- Kirmeier, R. , Payer, M. , Wehrschuetz, M. , Jakse, N. , Platzer, S. , & Lorenzoni, M. (2008). Evaluation of three‐dimensional changes after sinus floor augmentation with different grafting materials. Clinical Oral Implants Research, 19(4), 366–372. 10.1111/j.1600-0501.2007.01487.x [DOI] [PubMed] [Google Scholar]
- Kloss, F. R. , Offermanns, V. , & Kloss‐Brandstätter, A. (2018). Comparison of allogeneic and autogenous bone grafts for augmentation of alveolar ridge defects‐A 12‐month retrospective radiographic evaluation. Clinical Oral Implants Research, 29(11), 1163–1175. 10.1111/clr.13380 [DOI] [PMC free article] [PubMed] [Google Scholar]
- Kwon, J.‐J. , Hwang, J. , Kim, Y.‐D. , Shin, S.‐H. , Cho, B.‐H. , & Lee, J.‐Y. (2019). Automatic three‐dimensional analysis of bone volume and quality change after maxillary sinus augmentation. Clinical Implant Dentistry and Related Research, 21(6), 1148–1155. 10.1111/cid.12853 [DOI] [PubMed] [Google Scholar]
- Laky, M. , Majdalani, S. , Kapferer, I. , Frantal, S. , Gahleitner, A. , Moritz, A. , & Ulm, C. (2013). Periodontal probing of dental furcations compared with diagnosis by low‐dose computed tomography: A case series. Journal of Periodontology, 84(12), 1740–1746. 10.1902/jop.2013.120698 [DOI] [PubMed] [Google Scholar]
- Liedke, G. S. , Spin‐Neto, R. , da Silveira, H. E. D. , Schropp, L. , Stavropoulos, A. , & Wenzel, A. (2017). Factors affecting the possibility to detect buccal bone condition around dental implants using cone beam computed tomography. Clinical Oral Implants Research, 28(9), 1082–1088. 10.1111/clr.12921 [DOI] [PubMed] [Google Scholar]
- Lutz, R. , Neukam, F. W. , Simion, M. , & Schmitt, C. M. (2015). Long‐term outcomes of bone augmentation on soft and hard‐tissue stability: A systematic review. Clinical Oral Implants Research, 26(Suppl 11), 103–122. 10.1111/clr.12635 [DOI] [PubMed] [Google Scholar]
- Meijndert, L. , Meijer, H. J. , Stellingsma, K. , Stegenga, B. , & Raghoebar, G. M. (2007). Evaluation of aesthetics of implant‐supported single‐tooth replacements using different bone augmentation procedures: A prospective randomized clinical study. Clinical Oral Implants Research, 18(6), 715–719. 10.1111/j.1600-0501.2007.01415.x [DOI] [PubMed] [Google Scholar]
- Naenni, N. , Lim, H. C. , Papageorgiou, S. N. , & Hämmerle, C. H. F. (2019). Efficacy of lateral bone augmentation prior to implant placement: A systematic review and meta‐analysis. Journal of Clinical Periodontology, 46(Suppl 21), 287–306. 10.1111/jcpe.13052 [DOI] [PubMed] [Google Scholar]
- Papaspyridakos, P. , Chen, C. J. , Singh, M. , Weber, H. P. , & Gallucci, G. O. (2012). Success criteria in implant dentistry: A systematic review. Journal of Dental Research, 91(3), 242–248. 10.1177/0022034511431252 [DOI] [PubMed] [Google Scholar]
- Schindelin, J. , Arganda‐Carreras, I. , Frise, E. , Kaynig, V. , Longair, M. , Pietzsch, T. , Preibisch, S. , Rueden, C. , Saalfeld, S. , Schmid, B. , Tinevez, J.‐Y. , White, D. J. , Hartenstein, V. , Eliceiri, K. , Tomancak, P. , & Cardona, A. (2012). Fiji: An open‐source platform for biological‐image analysis. Nature Methods, 9(7), 676–682. 10.1038/nmeth.2019 [DOI] [PMC free article] [PubMed] [Google Scholar]
- Stricker, A. , Jacobs, R. , Maes, F. , Fluegge, T. , Vach, K. , & Fleiner, J. (2021). Resorption of retromolar bone grafts after alveolar ridge augmentation‐volumetric changes after 12 months assessed by CBCT analysis. International Journal of Implant Dentistry, 7(1), 7. 10.1186/s40729-020-00285-9 [DOI] [PMC free article] [PubMed] [Google Scholar]
- von Elm, E. , Altman, D. G. , Egger, M. , Pocock, S. J. , Gøtzsche, P. C. , & Vandenbroucke, J. P. (2008). The strengthening the reporting of observational studies in epidemiology (STROBE) statement: Guidelines for reporting observational studies. Journal of Clinical Epidemiology, 61(4), 344–349. 10.1016/j.jclinepi.2007.11.008 [DOI] [PubMed] [Google Scholar]
- World Medical Association (2013). Declaration of Helsinki: Ethical principles for medical research involving human subjects. Journal of the American Medical Association, 310(20), 2191–2194. 10.1001/jama.2013.281053 [DOI] [PubMed] [Google Scholar]
Associated Data
This section collects any data citations, data availability statements, or supplementary materials included in this article.
Supplementary Materials
Fig S1
Fig S2
Fig S3
Table S1
Supplementary Material
Supplementary Material
Data Availability Statement
The source data that support the findings of this study are available from the corresponding author upon reasonable request.