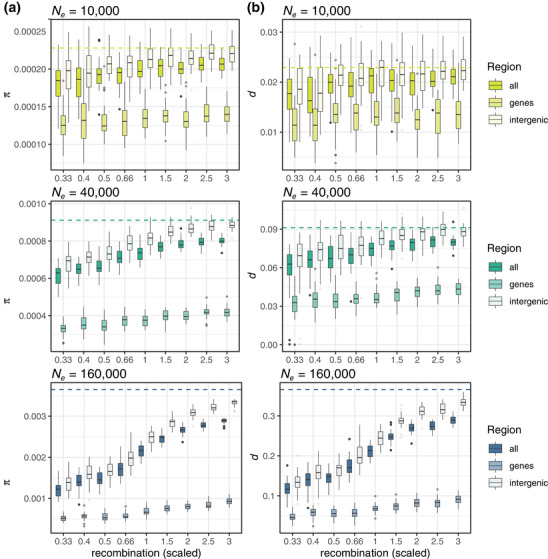
Figure 2.

Boxplots summarizing results from evolutionary simulations on the relationship between recombination rate and π after 20Ne generations in the ancestral population (panel A on the left) and d one generation after the split after a mild bottleneck (0.5 of ancestral Ne ) between the two daughter populations (panel B on the right) in each of three simulated ancestral Ne . Boxplots refer to the results from the models with selection, and the dashed line shows the results from the neutral models. Here are the results with models without gene conversion, as no significant differences were found between models with and without gene conversion.
