

Abstract
CD8 T cell-mediated autoimmune diseases result from the breakdown of self-tolerance mechanisms in autoreactive CD8 T cells1. How autoimmune T cell populations arise and are sustained, and the molecular programmes defining the autoimmune T cell state, are unknown. In type 1 diabetes, β-cell-specific CD8 T cells destroy insulin-producing β-cells. Here we followed the fate of β-cell-specific CD8 T cells in non-obese diabetic mice throughout the course of type 1 diabetes. We identified a stem-like autoimmune progenitor population in the pancreatic draining lymph node (pLN), which self-renews and gives rise to pLN autoimmune mediators. pLN autoimmune mediators migrate to the pancreas, where they differentiate further and destroy β-cells. Whereas transplantation of as few as 20 autoimmune progenitors induced type 1 diabetes, as many as 100,000 pancreatic autoimmune mediators did not. Pancreatic autoimmune mediators are short-lived, and stem-like autoimmune progenitors must continuously seed the pancreas to sustain β-cell destruction. Single-cell RNA sequencing and clonal analysis revealed that autoimmune CD8 T cells represent unique T cell differentiation states and identified features driving the transition from autoimmune progenitor to autoimmune mediator. Strategies aimed at targeting the stem-like autoimmune progenitor pool could emerge as novel and powerful immunotherapeutic interventions for type 1 diabetes.
CD8 T cell differentiation is a tightly regulated process. In acute infections, antigen-specific CD8 T cells differentiate into functional cytotoxic effector and memory T cells2. In cancers or chronic viral infections, contexts in which T cells encounter persistent antigen, T cells enter a hyporesponsive state generally referred to as T cell exhaustion or dysfunction3. In autoimmunity, self-reactive T cells acquire cytotoxic effector functions and cause destruction of self1. Despite presumed chronic self-antigen exposure on normal tissues, autoimmune T cells do not become dysfunctional, but retain effector functions and progressively destroy the tissue.
Type 1 diabetes (T1D) is a progressive T cell-mediated autoimmune disease. The pathogenesis of T1D is complex and involves immune cell infiltration of the pancreas: β-cell-specific CD8 T cells destroy insulin-producing β-cells in the pancreatic islets of Langerhans, leading to insulin deficiency and loss of glucose homeostasis4. T1D becomes clinically evident when the majority (over 80%) of β-cells have been destroyed, requiring a prolonged latent period of β-cell killing over time (months to years in humans)5.
The non-obese diabetic (NOD) mouse model is a clinically relevant model of T1D6,7 and shares many features with the human disease, including spontaneous CD4 and CD8 T cell responses to many of the same β-cell antigens6–9. CD8 T cells recognizing the β-cell protein islet-specific glucose-6-phosphatase catalytic subunit-related protein (IGRP) represent a major pathogenic population in mice and humans6,8,10. β-cell-specific CD8 T cells in NOD mice are primed in the pancreatic draining lymph node (pLN) before they infiltrate the pancreas6,11. Although CD4 T cells initiate pancreatic infiltration and provide help to CD8 T cells, the CD8 T cells primarily responsible for β-cell destruction8 (Extended Data Fig. 1a).
Phenotype of IGRP-specific CD8 T cells
To investigate the development of the diabetogenic CD8 T cell response as it unfolds, we followed the fate of endogenous β-cell-specific CD8 T cell populations in NOD mice over the entire course of T1D (from 5 to 30 weeks of age). We focused on CD8 T cells specific for the IGRP206–214 epitope, which can be identified using tetramers containing a high-affinity mimotope12 (NRP-V7) (Fig. 1a). IGRP-specific CD8 T cells (hereafter referred to as IGRP T cells) can be found in the pLN and pancreas as early as 5 weeks of age, and their frequency increases over time, peaking at around 0.3% and 20% of CD8 T cells in the pLN and pancreas by 15–20 weeks, respectively, by which time approximately 80% of NOD mice in our colony have developed T1D (Extended Data Fig. 1b). IGRP T cells in the pLN and pancreas were antigen-experienced as shown by their CD44hi phenotype (Fig. 1b) and expressed several inhibitory markers, including PD1, CD38, CD39, LAG3 and TIGIT (Fig. 1b, Extended Data Fig. 1c). Despite the expression of these inhibitory markers, IGRP T cells were highly functional and produced high levels of IFNγ and TNF upon ex vivo stimulation (Fig. 1c).
Fig. 1 |. Phenotype, function and heterogeneity of IGRP-specific CD8 T cells.
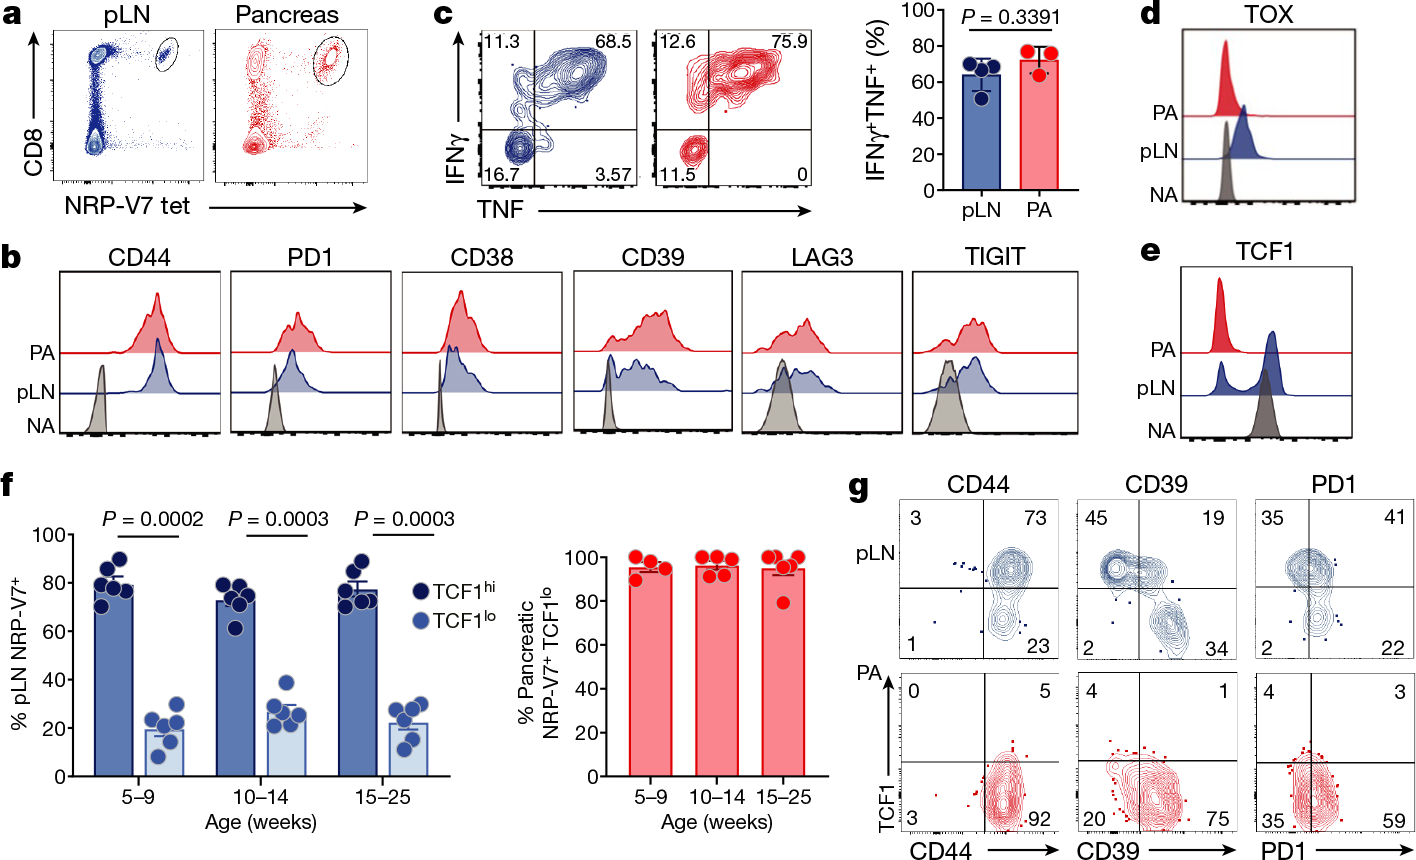
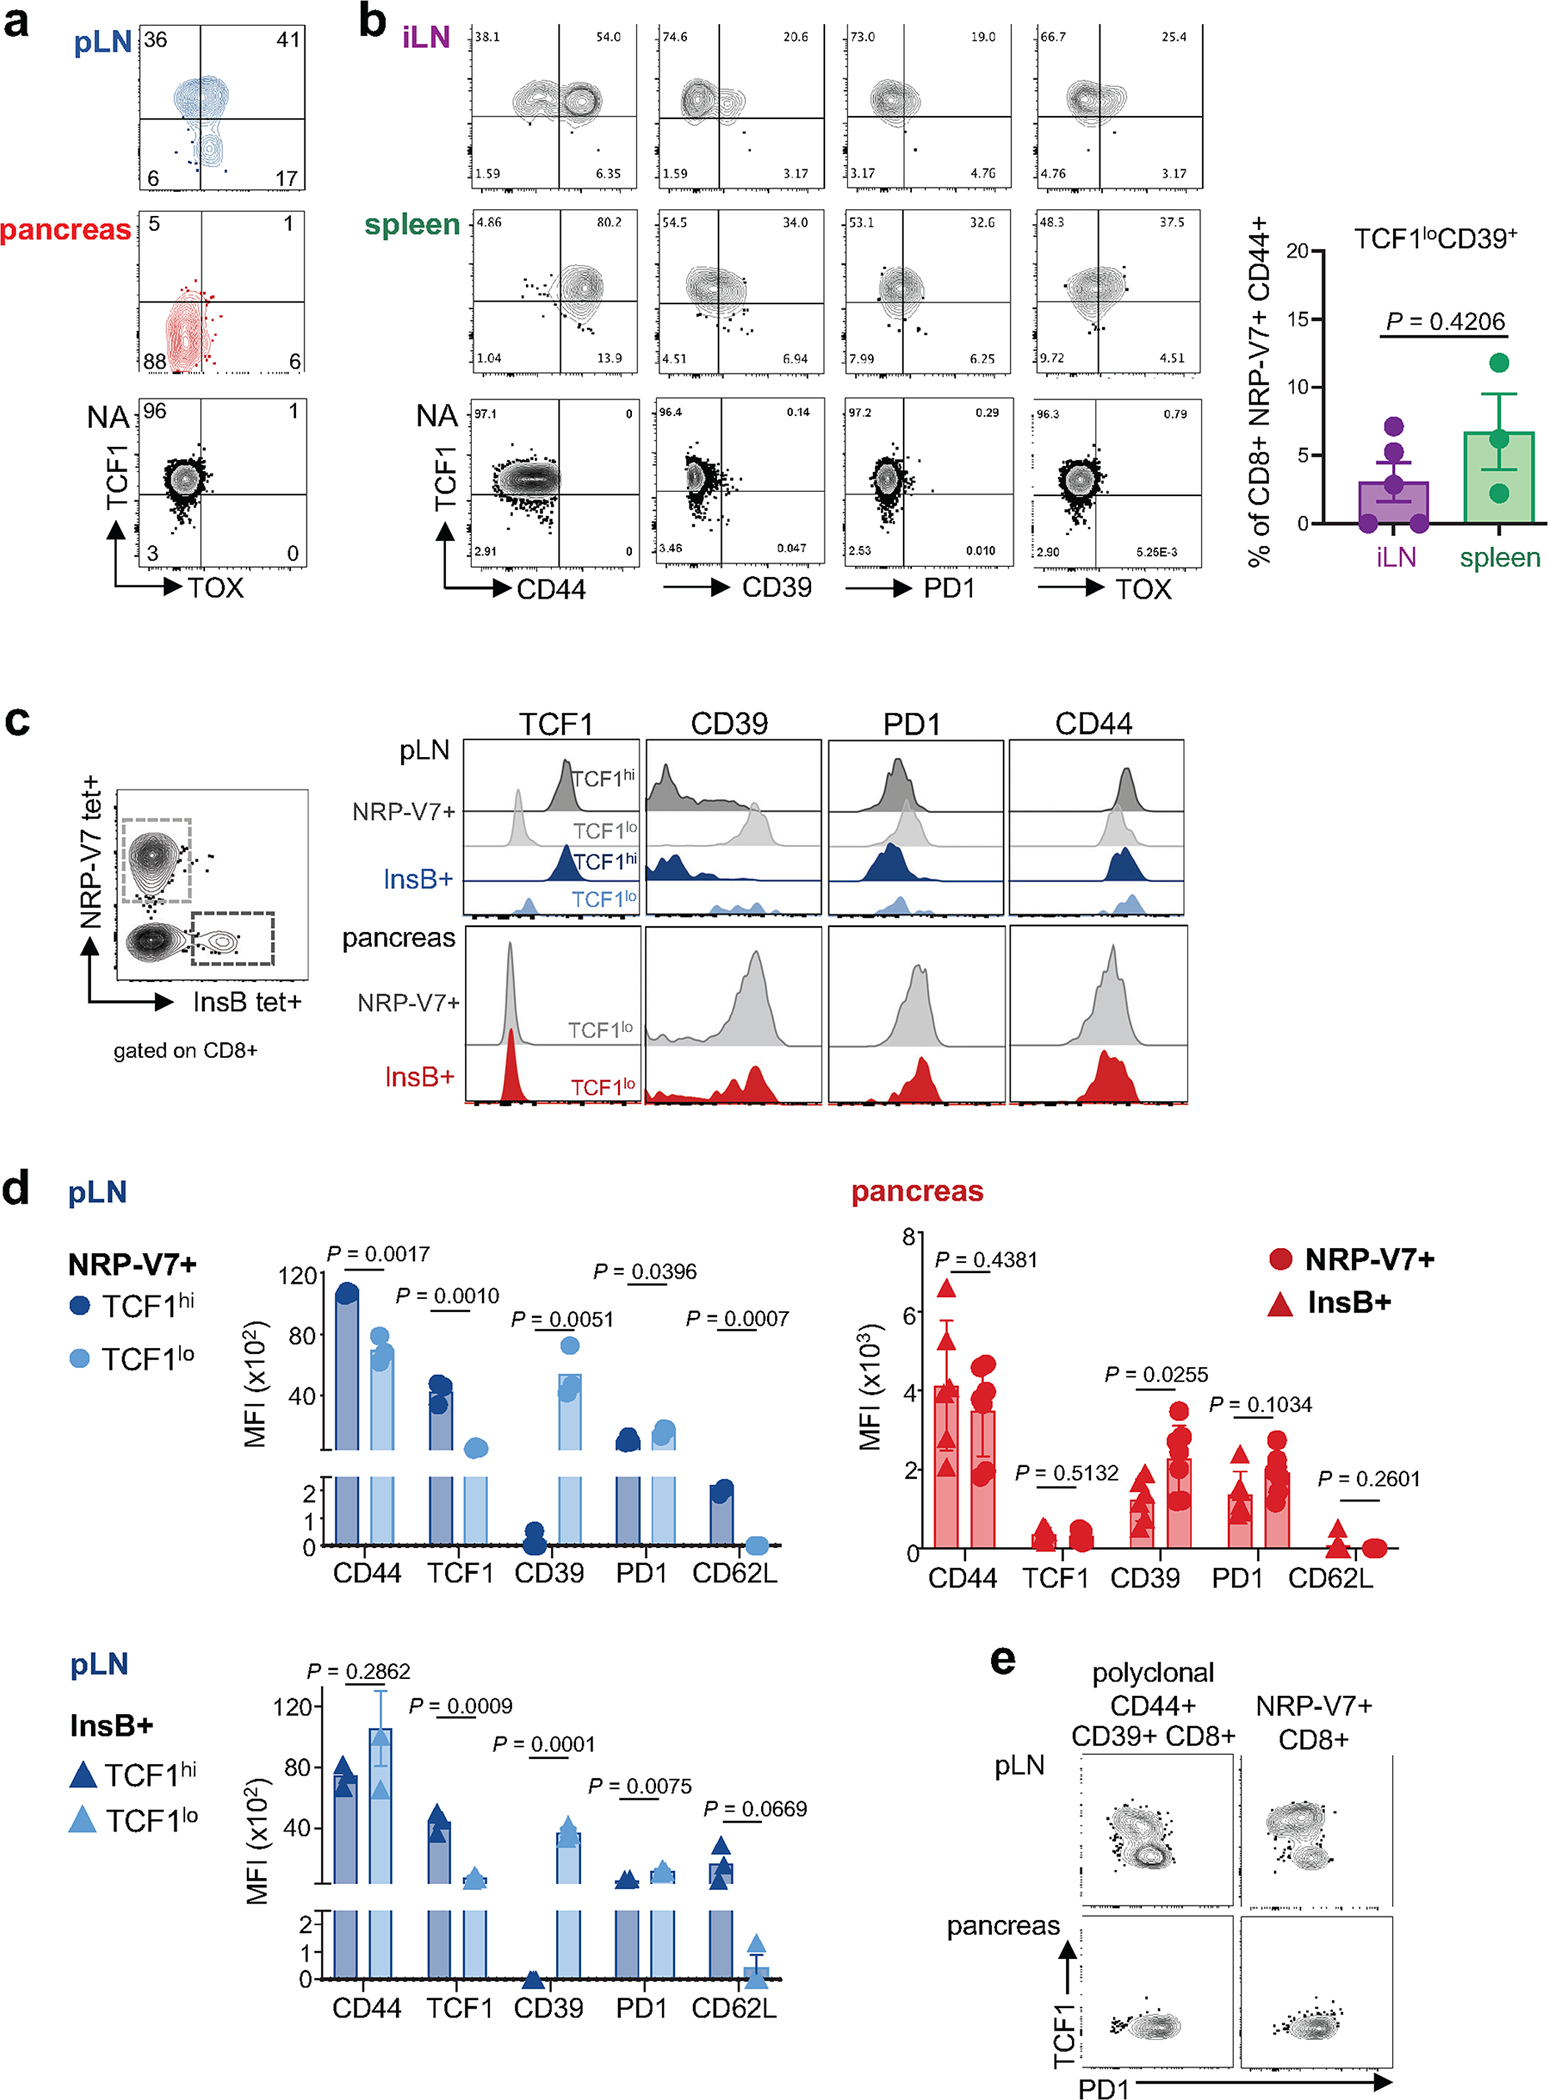
a, Flow cytometric analysis of IGRP-specific CD8+ T cells from pLN (blue) and pancreas (red) using Kd/NRP-V7 tetramer (gated on live CD45+ cells) (Kd, H2-Kd). Results are representative of at least five independent experiments. b, Expression of CD44, PD1, CD38, CD39, LAG3 and TIGIT in IGRP-specific CD8+ T cells from pLN (blue) and pancreas (PA) (red). Naive T cells (NA) (NRP-V7−CD44−CD8+ NOD splenocytes) are shown as controls (grey). Representative of 2 or 3 independent experiments; n = 4 or 5. MFI, mean fluorescence intensity. c, IFNγ and TNF production by IGRP-specific CD8+ T cells ex vivo. pLN, n = 4; pancreas, n = 3. Representative of five independent experiments. d, e, TOX (d) and TCF1 (e) expression in IGRP-specific CD8+ T cells from pLN and pancreas. f, Frequency of TCF1hi and/or TCF1lo IGRP-specific CD8+ cells from pLN and pancreas in NOD mice at indicated ages. pLN, n = 6 per time point; pancreas, n = 4 (5–9 weeks); n = 5 (10–14 weeks); n = 6 (15–25 weeks); data pooled from 6 representative experiments. g, Expression of TCF1 versus CD44, CD39 and PD1 in IGRP-specific CD8+ T cells from pLN and pancreas. Data are representative of 2 or 3 independent experiments; n = 3–6. In c, f, each symbol represents an individual mouse. Data are mean ± s.e.m. Paired two-tailed Student’s t-test (c, f).
We then analysed the expression of several canonical transcription factors critical for T cell differentiation and function, including EOMES, TBET, TOX and TCF1 (Fig. 1d–f, Extended Data Fig. 1d). TOX has been described as a key driver of CD8 T cell exhaustion in tumours and chronic infections, settings of persistent antigen encounter3. pLN IGRP T cells expressed moderate levels of TOX and pancreatic IGRP T cells expressed minimal levels of TOX, in contrast to exhausted and dysfunctional T cells in chronic viral infections and tumours (Fig. 1d, Extended Data Fig. 1d).
Bifurcation into TCF1hi and TCF1lo cells
TCF1 is a transcription factor critical for T cell memory, longevity and self-renewal13. IGRP T cells in the pLN segregated into two distinct populations based on TCF1 expression (Fig. 1e). TCF1hi and TCF1lo cells, comprising approximately 80% and 20% of the IGRP-specific population, respectively, could be identified in the pLN as early as 5 weeks of age, and persisted throughout disease progression and mouse lifespan (25 to 30 weeks). IGRP T cells in the pancreas expressed low levels of TCF1 (Fig. 1f). TCF1hi and TCF1lo cells revealed distinct expression patterns of inhibitory molecules (including CD39 and PD1) (Fig. 1g, Extended Data Fig. 2a). The phenotypic bifurcation into TCF1hi and TCF1lo populations was unique to IGRP T cells in the pLN, as those in the inguinal LN and spleen expressed high levels of TCF1 and lacked a distinct TCF1loCD39hi population (Extended Data Fig. 2b).
To determine whether similar phenotypic bifurcation can be found in β-cell-specific CD8 T cell populations with other specificities, we analysed CD8 T cells specific for the insulin B chain 15–23 epitope8. Insulin B-chain-specific CD8 T cells also bifurcated into distinct TCF1hiCD39loPD1lo and TCF1loCD39hiPD1hi populations in the pLN and displayed a consistently TCF1loCD39hiPD1hi phenotype in the pancreas (Extended Data Fig. 2c, d). Moreover, we found the same expression pattern for TCF1 in polyclonal CD44+CD39+ CD8 T cells in the pLN and pancreas (Extended Data Fig. 2e). Thus, phenotypic bifurcation in the pLN appears be a key feature of the β-cell-specific CD8 T cell repertoire.
Transcriptome of autoimmune T cells
To identify the molecular signatures defining the distinct pLN TCF1hi and TCF1lo populations, we performed RNA-sequencing (RNA-seq) analysis. We used Ly108, a well-established surrogate for TCF1, and sorted NRP-V7+CD44+Ly108hi (TCF1hi) and Ly108lo (TCF1lo) CD8+ T cells from the pLN (Fig. 2a). We identified 1,410 differentially expressed genes (DEGs) between the pLN TCF1hi and TCF1lo populations, including genes encoding key transcription factors, cytokine receptors, and effector and inhibitory molecules (Fig. 2b, Extended Data Fig. 3a). TCF1 is one of the targets of canonical Wnt signalling, which maintains stemness in adult tissue stem cells, tumours, and peripheral T cells14,15. Indeed, pLN TCF1hi cells expressed numerous Wnt target genes regulating self-renewal and stemness, including Myc, Prickle1 and Axin2 (Fig. 2b). By contrast, pLN TCF1lo cells displayed increased expression of genes associated with terminal differentiation and effector function (for example, Prdm1, Id2, Fasl, Ifng, Entpd1, Cd38, Tigit and Cish) (Fig. 2b). Gene set enrichment analyses (GSEA) and gene ontology classification showed that pLN TCF1hi cells were enriched for pathways involved in MYC and E2F signalling and DNA replication, whereas pLN TCF1lo cells were enriched for pathways associated with T cell activation, cytotoxicity and apoptosis (Extended Data Fig. 3b, c).
Fig. 2 |. Genome-wide transcriptome analysis of IGRP-specific CD8 T cell populations from pancreatic lymph node and pancreas.
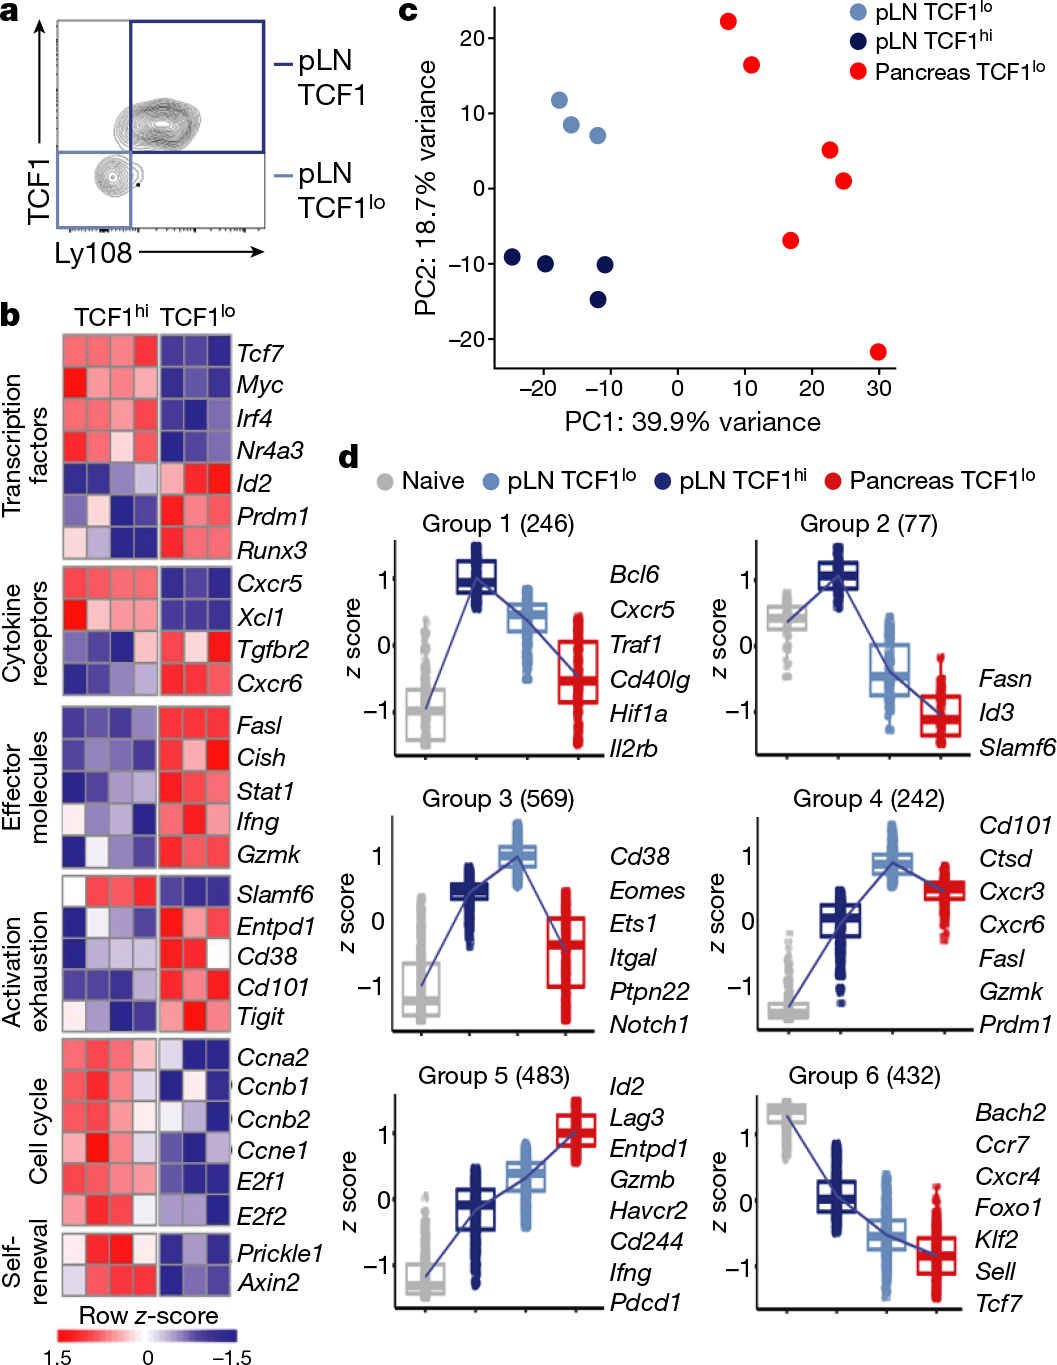
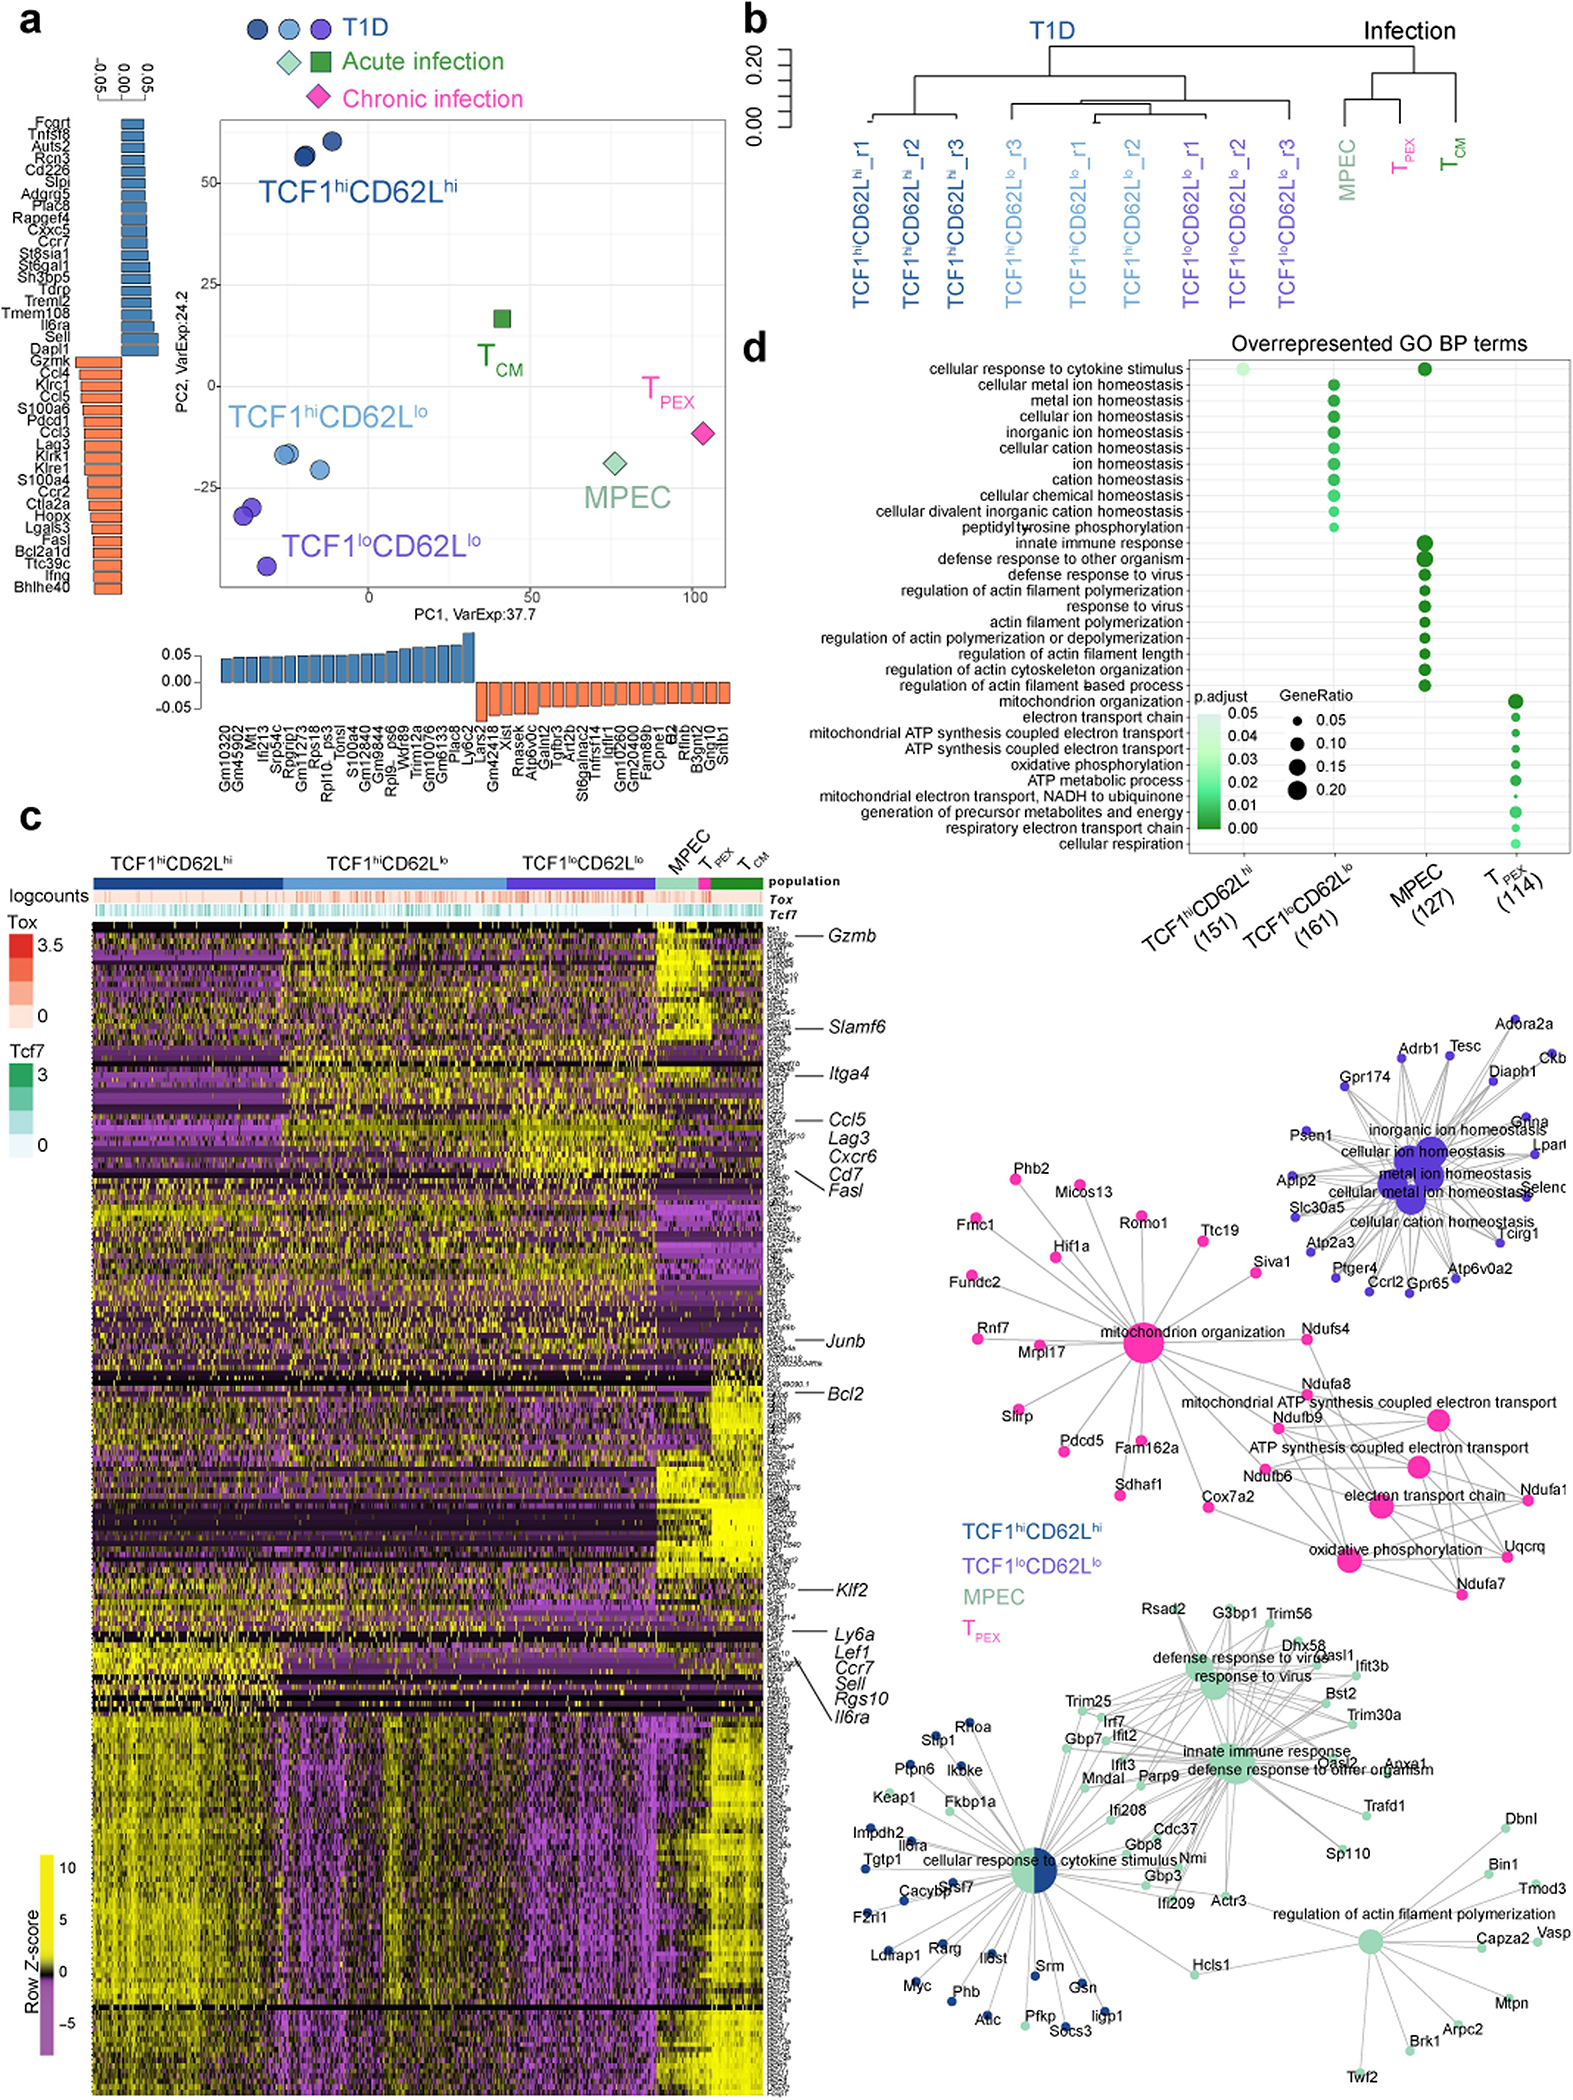
a, TCF1 and Ly108 expression profiles of IGRP-specific CD8+ T cells from pLN. Boxed quadrants indicate TCF1hiLy108+ and TCF1loLy108− populations sorted for RNA-seq. Representative of at least 5 independent experiments. b, Heat map of DEGs in pLN (row-normalized log2(counts per million); false discovery rate (FDR) < 0.10). c, Principal component analysis of pLN and pancreas RNA-seq data. pLN TCF1hi cells, n = 4; pLN TCF1lo cells, n = 3; pancreatic TCF1lo cells, n = 6. d, Cluster analysis identifying groups of DEGs with shared expression patterns between polyclonal naive CD8 T cells (grey), pLN TCF1hi (dark blue), pLN TCF1lo (light blue) and pancreatic (red) TCF1lo IGRP-specific CD8 T cells. In box plots, centre indicates median, lower and upper hinges indicate 25th and 75th percentiles, respectively, and whiskers extend up to 1.5×interquartile range from the smallest or highest values.
To understand whether autoimmune programming is imprinted in the pLN, or whether pLN TCF1lo cells undergo further differentiation once they infiltrate the pancreas, we performed RNA-seq analysis of NRP-V7+CD44+Ly108lo (TCF1lo) CD8+ T cells from the pancreas. Pancreatic TCF1lo cells were transcriptionally distinct from pLN TCF1lo cells (4,263 DEGs), indicating that pLN TCF1lo cells continue to differentiate in the pancreas (Fig. 2c). Thus, the IGRP-specific autoimmune T cell population comprises three distinct T cell subsets: pLN TCF1hi, pLN TCF1lo and pancreatic TCF1lo cells. Genes that were uniquely expressed in pLN TCF1hi and progressively lost in pLN and pancreatic TCF1lo populations included genes associated with T cell survival, proliferation and self-renewal (groups 1 and 2; Fig. 2d). Genes that became progressively upregulated from pLN TCF1hi to pLN TCF1lo to pancreatic TCF1lo cells included Entpd1, Gzmb, Id2, Ifng, Lag3 and Pdcd1 (group 5; Fig. 2d). Effector genes associated with terminal differentiation and apoptosis were shared by TCF1lo populations (Fig. 2d, Extended Data Fig. 3d).
T cells in T1D versus infection
Next, we assessed how similar these populations are to well-defined CD8 T cell differentiation states, including cytolytic effector and memory CD8 T cells generated during acute infections2, or whether autoimmune CD8 T cells represent unique T cell differentiation states. We engineered a Listeria monocytogenes strain to express the IGRP mimotope NRP-V7 (Lm-NRP-V7) (Extended Data Fig. 4a) and compared the phenotypes of endogenous IGRP CD8 T cells responding to Lm-NRP-V7 with diabetogenic IGRP CD8 T cells in NOD pLN and pancreas. Seven days after infection, we found canonical KLRG1+CD127−TBET+ short-lived effector cells (SLEC) as well as KLRG1−CD127+TBET− memory precursor effector cells2 (MPEC) in spleen and pancreas (Extended Data Fig. 4b, c). By contrast, autoimmune NOD pancreatic IGRP T cells did not express KLRG1, CD127 or TBET (Extended Data Fig. 4b, d). At the memory timepoint (3–4 weeks after infection), IGRP T cells displayed a central memory (TCM) phenotype2 (characteristically defined as CD127+KLRG1−CD62L+T CF1+CD122+CXCR3+). By contrast, NOD pLN TCF1hi cells did not exhibit a TCM-like phenotype; GSEA found a significant negative enrichment of CD8 TCM genes (Extended Data Fig. 4e, f). Thus, autoimmune IGRP CD8 T cells are distinct from IGRP CD8 T cells generated during infections.
pLN TCF1hi cells have stem-like functions
An essential feature of stem and progenitor cell populations is their capacity to self-renew and produce differentiated progeny16. To understand whether pLN TCF1hi cells function as a stem-like population that is able to self-renew and give rise to TCF1lo cells, we adapted an established adoptive transfer model in which TCR transgenic CD8 T cells induce T1D upon transfer into NOD/SCID mice17. CD8 T cells from the TCR transgenic mouse strain 8.3/NOD (8.3 cells) recognize the same IGRP206–214 epitope as endogenous IGRP CD8 T cells12,18 (Extended Data Fig. 5a). We adoptively transferred congenically marked (CD45.2+) naive CD44loTCF1hi 8.3 cells into CD45.1+ NOD/SCID host mice (Fig. 3a). Donor 8.3 cells bifurcated into TCF1hiCD39lo and TCF1loCD39hi populations in the pLN, whereas only TCF1loCD39hi T cells emerged in the pancreas, recapitulating the same phenotypes of endogenous IGRP CD8 T cells in wild-type NOD mice (Extended Data Fig. 5b–d). We isolated pLN TCF1hi and pancreatic TCF1lo cells (using Ly108 and CD39 as surrogate markers) and transferred each population into second NOD/SCID hosts (Fig. 3a). NOD/SCID hosts that received pLN TCF1hi cells became diabetic whereas hosts that received TCF1lo cells did not (Fig. 3b, Extended Data Fig. 6a). Even as few as 100 TCF1hi cells were sufficient to induce T1D, whereas as many as 100,000 TCF1lo cells were not (Fig. 3b). Donor TCF1hi cells could be found in all tissues evaluated (Fig. 3c, Extended Data Fig. 6b, c) and gave rise to all three populations (pLN TCF1hi, pLN TCF1lo and pancreatic TCF1lo) (Fig. 3d), demonstrating that pLN TCF1hi cells can both self-renew and produce differentiated progeny. By contrast, donor TCF1lo cells could not be detected in any tissue (Fig. 3c, Extended Data Fig. 6b, c). Pancreatic TCF1lo cells expressed significantly more activated caspases 3 and 7 than the pLN populations, suggesting that donor TCF1lo cells probably undergo apoptosis after transfer into new hosts (Extended Data Fig. 6d). We performed similar transfer experiments in non-lymphopenic wild-type NOD hosts and found that the development and phenotype of stem-like pLN TCF1hi cells, as well as their abilities to self-renew, produce differentiated TCF1lo cells and induce T1D, were independent of lymphopenia-induced homeostatic proliferation (Extended Data Fig. 7).
Fig. 3 |. IGRP-specific pLN TCF1hi CD8 T cells represent a stem-like progenitor population that self-renews and gives rise to short-lived AM in the pancreas.
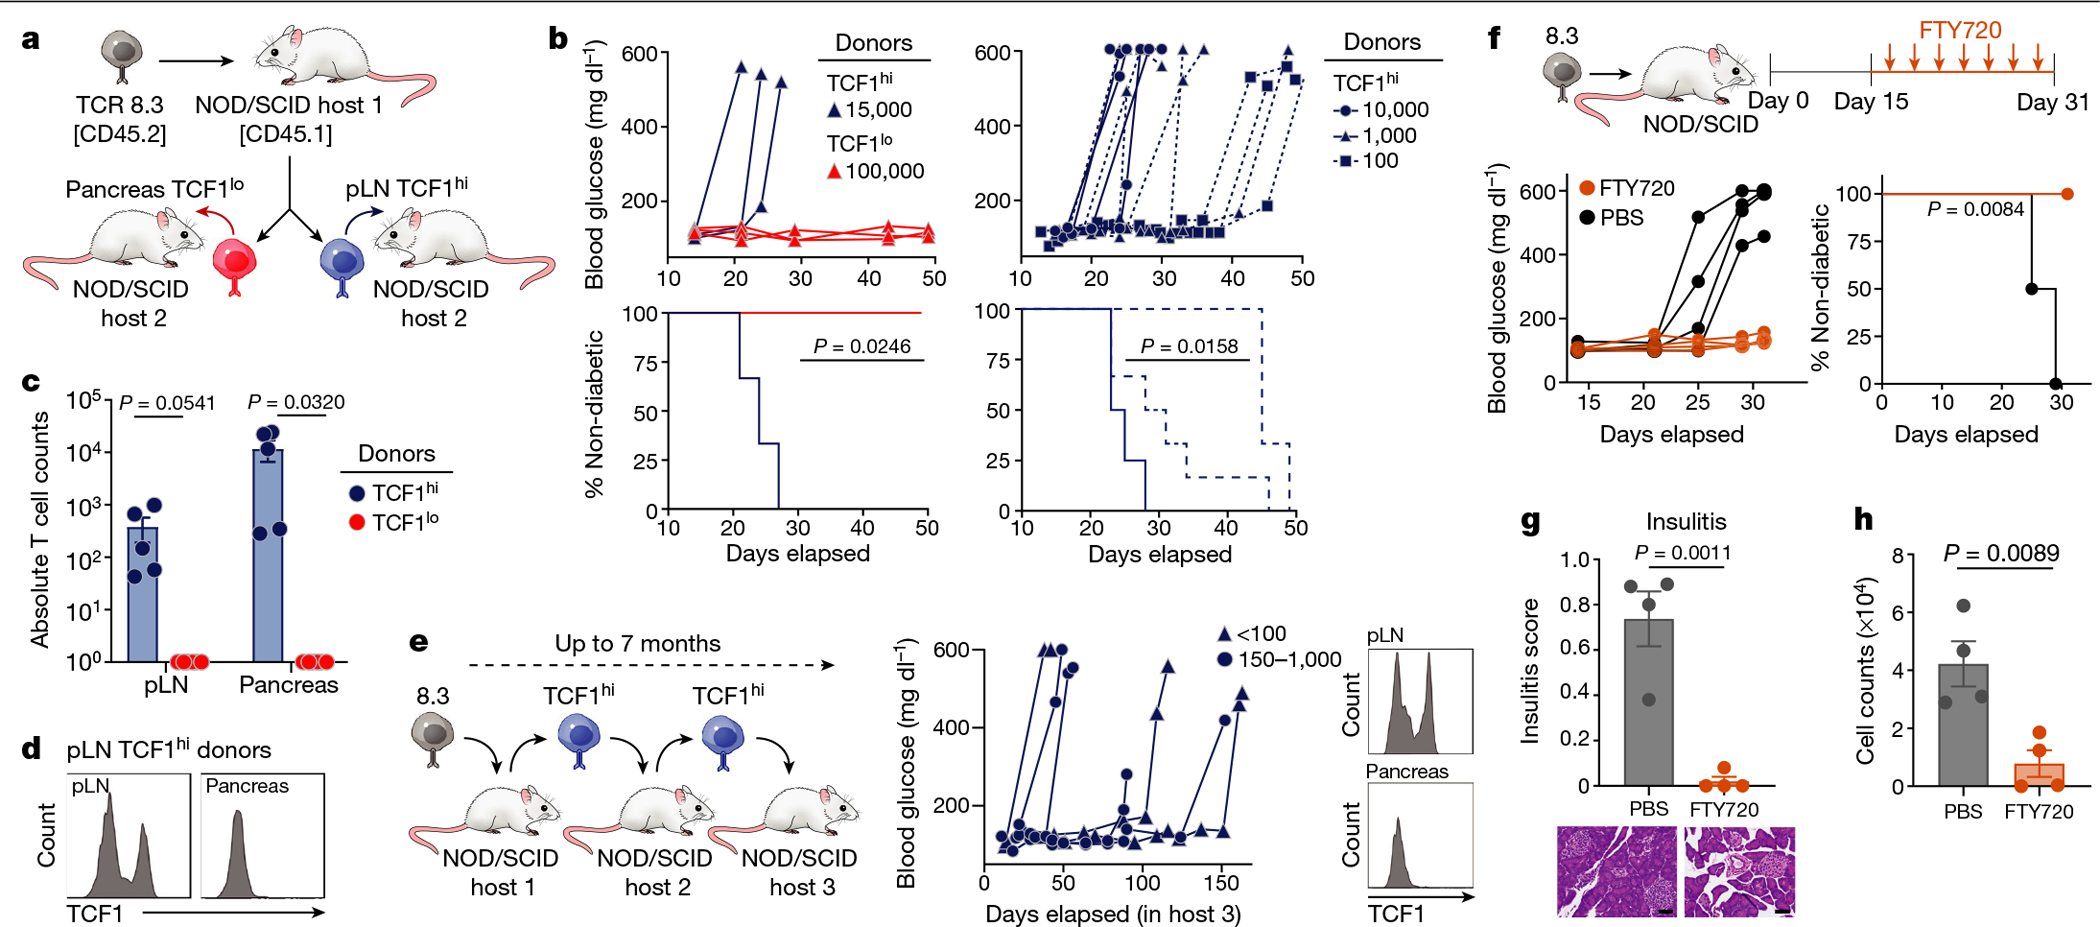
a, Experimental scheme of 8.3–NOD/SCID adoptive transfer model. b, Blood glucose curves (top) and percentage of non-diabetic mice (bottom) of second hosts receiving indicated numbers of pLN TCF1hi or pancreatic TCF1lo 8.3 T cells. n = 3–6 mice per group. c, Donor T cells found in pLN or per 100 mg pancreas of second hosts (19–21 days after transfer of 5,000 cells). Data pooled from two independent experiments; n = 5 (TCF1hi) or n = 6 (TCF1lo). d, TCF1 expression in donor TCF1hi T cells isolated from pLN and pancreas (21 days after transfer). Representative of five independent experiments; n = 5. e, Left, experimental scheme for serial transplantation studies. Middle, blood glucose curves for third hosts receiving 150–1,000 TCF1hi (n = 4) and 20–100 TCF1hi (n = 3) cells. Right, TCF1 expression in TCF1hi cells isolated from third hosts 90 days after transfer. f–h, FTY720 treatment studies. f, Top, experimental scheme. Blood glucose curves (left) and percentage of non-diabetic mice (right) among hosts (FTY720, n = 4; PBS, n = 4). g, Insulitis score (with representative images) of pancreatic islets (scale bar, 50 μm). h, Donor 8.3 cell count per 100 mg pancreas. b, e, f, Each line or symbol represents an individual mouse. c, g, h, Data are mean ± s.e.m.; unpaired two-tailed Student’s t-test. b, f, Two-sided log-rank (Mantel–Cox) test.
The gold-standard assay to evaluate stem cell functions remains serial transplantation in animal models. Haematopoietic19, somatic14 and cancer stem cells20 in mice and humans have been identified via serial transplantation of limiting cell numbers into immunodeficient mice. We adopted serial transplantations (over a total of seven months) to assess long-term self-renewal capacity and stemness of pLN TCF1hi cells. pLN TCF1hi cells were sorted from diabetic NOD/SCID first hosts, transferred into second hosts, and when the second hosts became diabetic, pLN TCF1hi cells were re-isolated and transferred into third hosts (Fig. 3e). All third hosts became diabetic, even with as few as 20 cells. Notably, with each transplant, TCF1hi cells gave rise to stable TCF1hi and TCF1lo populations that persisted for at least five months (Fig. 3e).
To assess whether the pancreatic TCF1lo population could persist without influx from the pLN. we treated NOD mice with FTY720, a sphingosine-1-phosphate receptor agonist that blocks lymph node egress and has been shown to protect NOD mice from T1D21,22 (Fig. 3f). Mice treated with FTY720 were completely protected from T1D and had significantly reduced insulitis compared with control mice (Fig. 3f, g). FTY720-treated mice lost half of the initial pancreatic CD8 T cell population, whereas control mice had significantly more CD8 T cells in the pancreas compared with the beginning of treatment (Fig. 3h, Extended Data Fig. 6e–g). Thus, pancreatic TCF1lo cells cannot persist in the pancreas without continual replenishment by pLN TCF1hi cells.
Single-cell transcriptome and clonal analyses
To understand how pLN TCF1hi cells differentiate into TCF1lo cells, we performed single-cell RNA-seq (scRNA-seq) in combination with cellular indexing of transcriptomes and epitopes (CITE-seq) of pLN IGRP-specific (NRP-V7+) CD8 T cells. Clustering and trajectory analyses revealed that cells with high and low expression of Tcf7 were at opposite ends of the trajectory; Tcf7hi cells displayed a stem-like transcriptional program, whereas Tcf7lo cells harboured a terminally differentiated and cytotoxic program (Fig. 4a, b, Extended Data Fig. 8a–d). We identified intermediate cell states along the trajectory, which retained Tcf7 expression but lost some stemness-associated genes and upregulated genes associated with the Tcf7lo cluster (Fig. 4a, b, Extended Data Fig. 8b–f). High Sell (which encodes CD62L) and Entpd1 (which encodes CD39) RNA transcript and protein expression marked the opposite ends of the differentiation trajectory, while intermediate cell states did not express Sell (or CD62L) or Entpd1 (or CD39). Many of the genes exhibiting the largest changes in expression were associated with migration, suggesting that changes in trafficking and spatial orientation within the pLN might be associated with the transition from TCF1hi to TCF1lo cells (Extended Data Fig. 8d).
Fig. 4 |. Single-cell transcriptomic and T cell receptor analyses of IGRP-specific CD8 T cell populations.
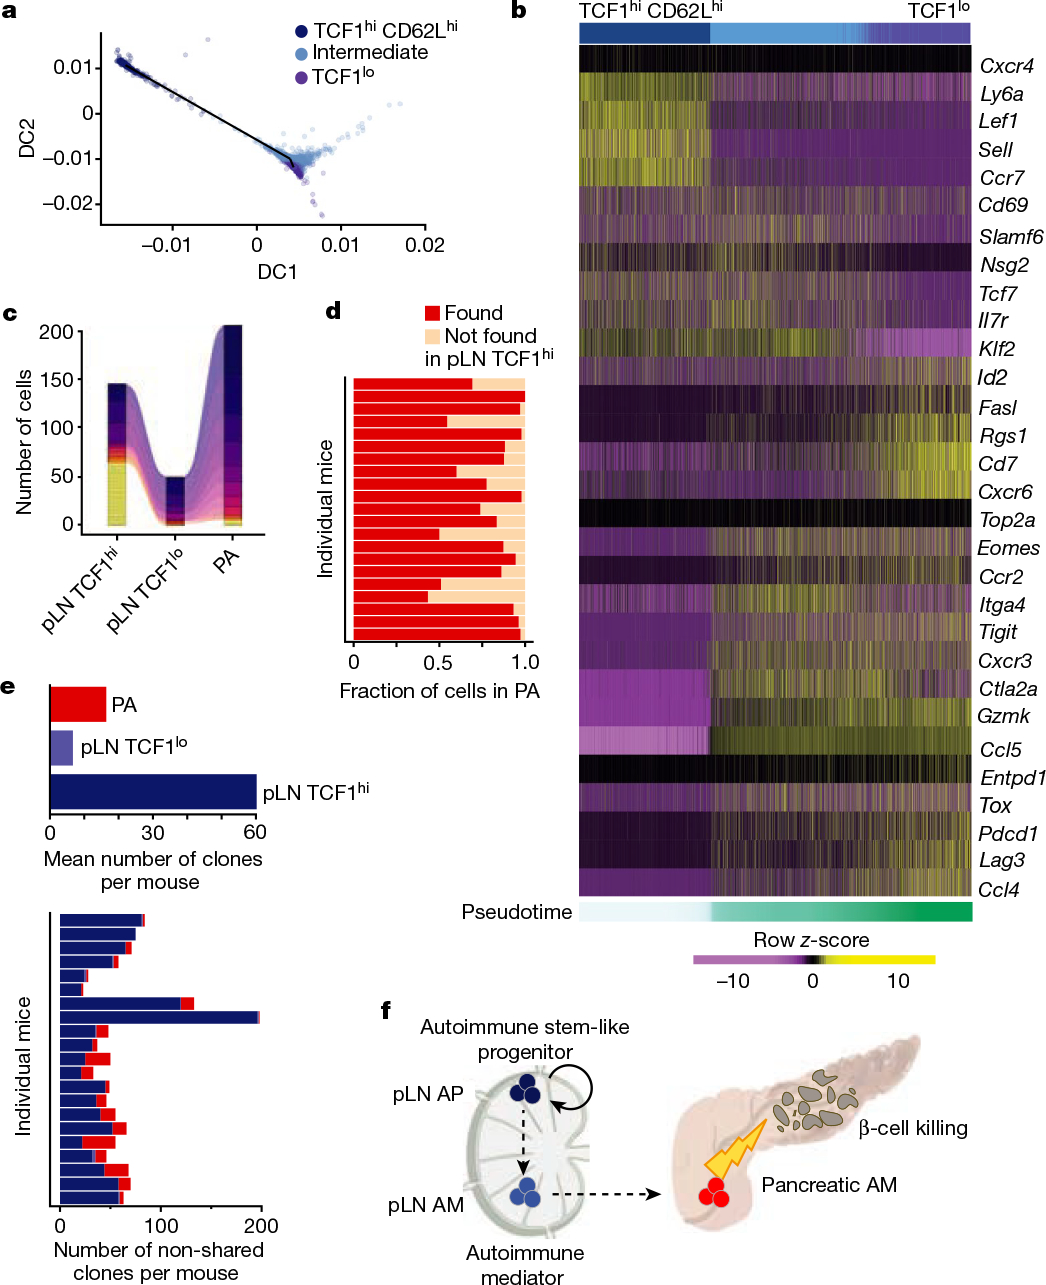
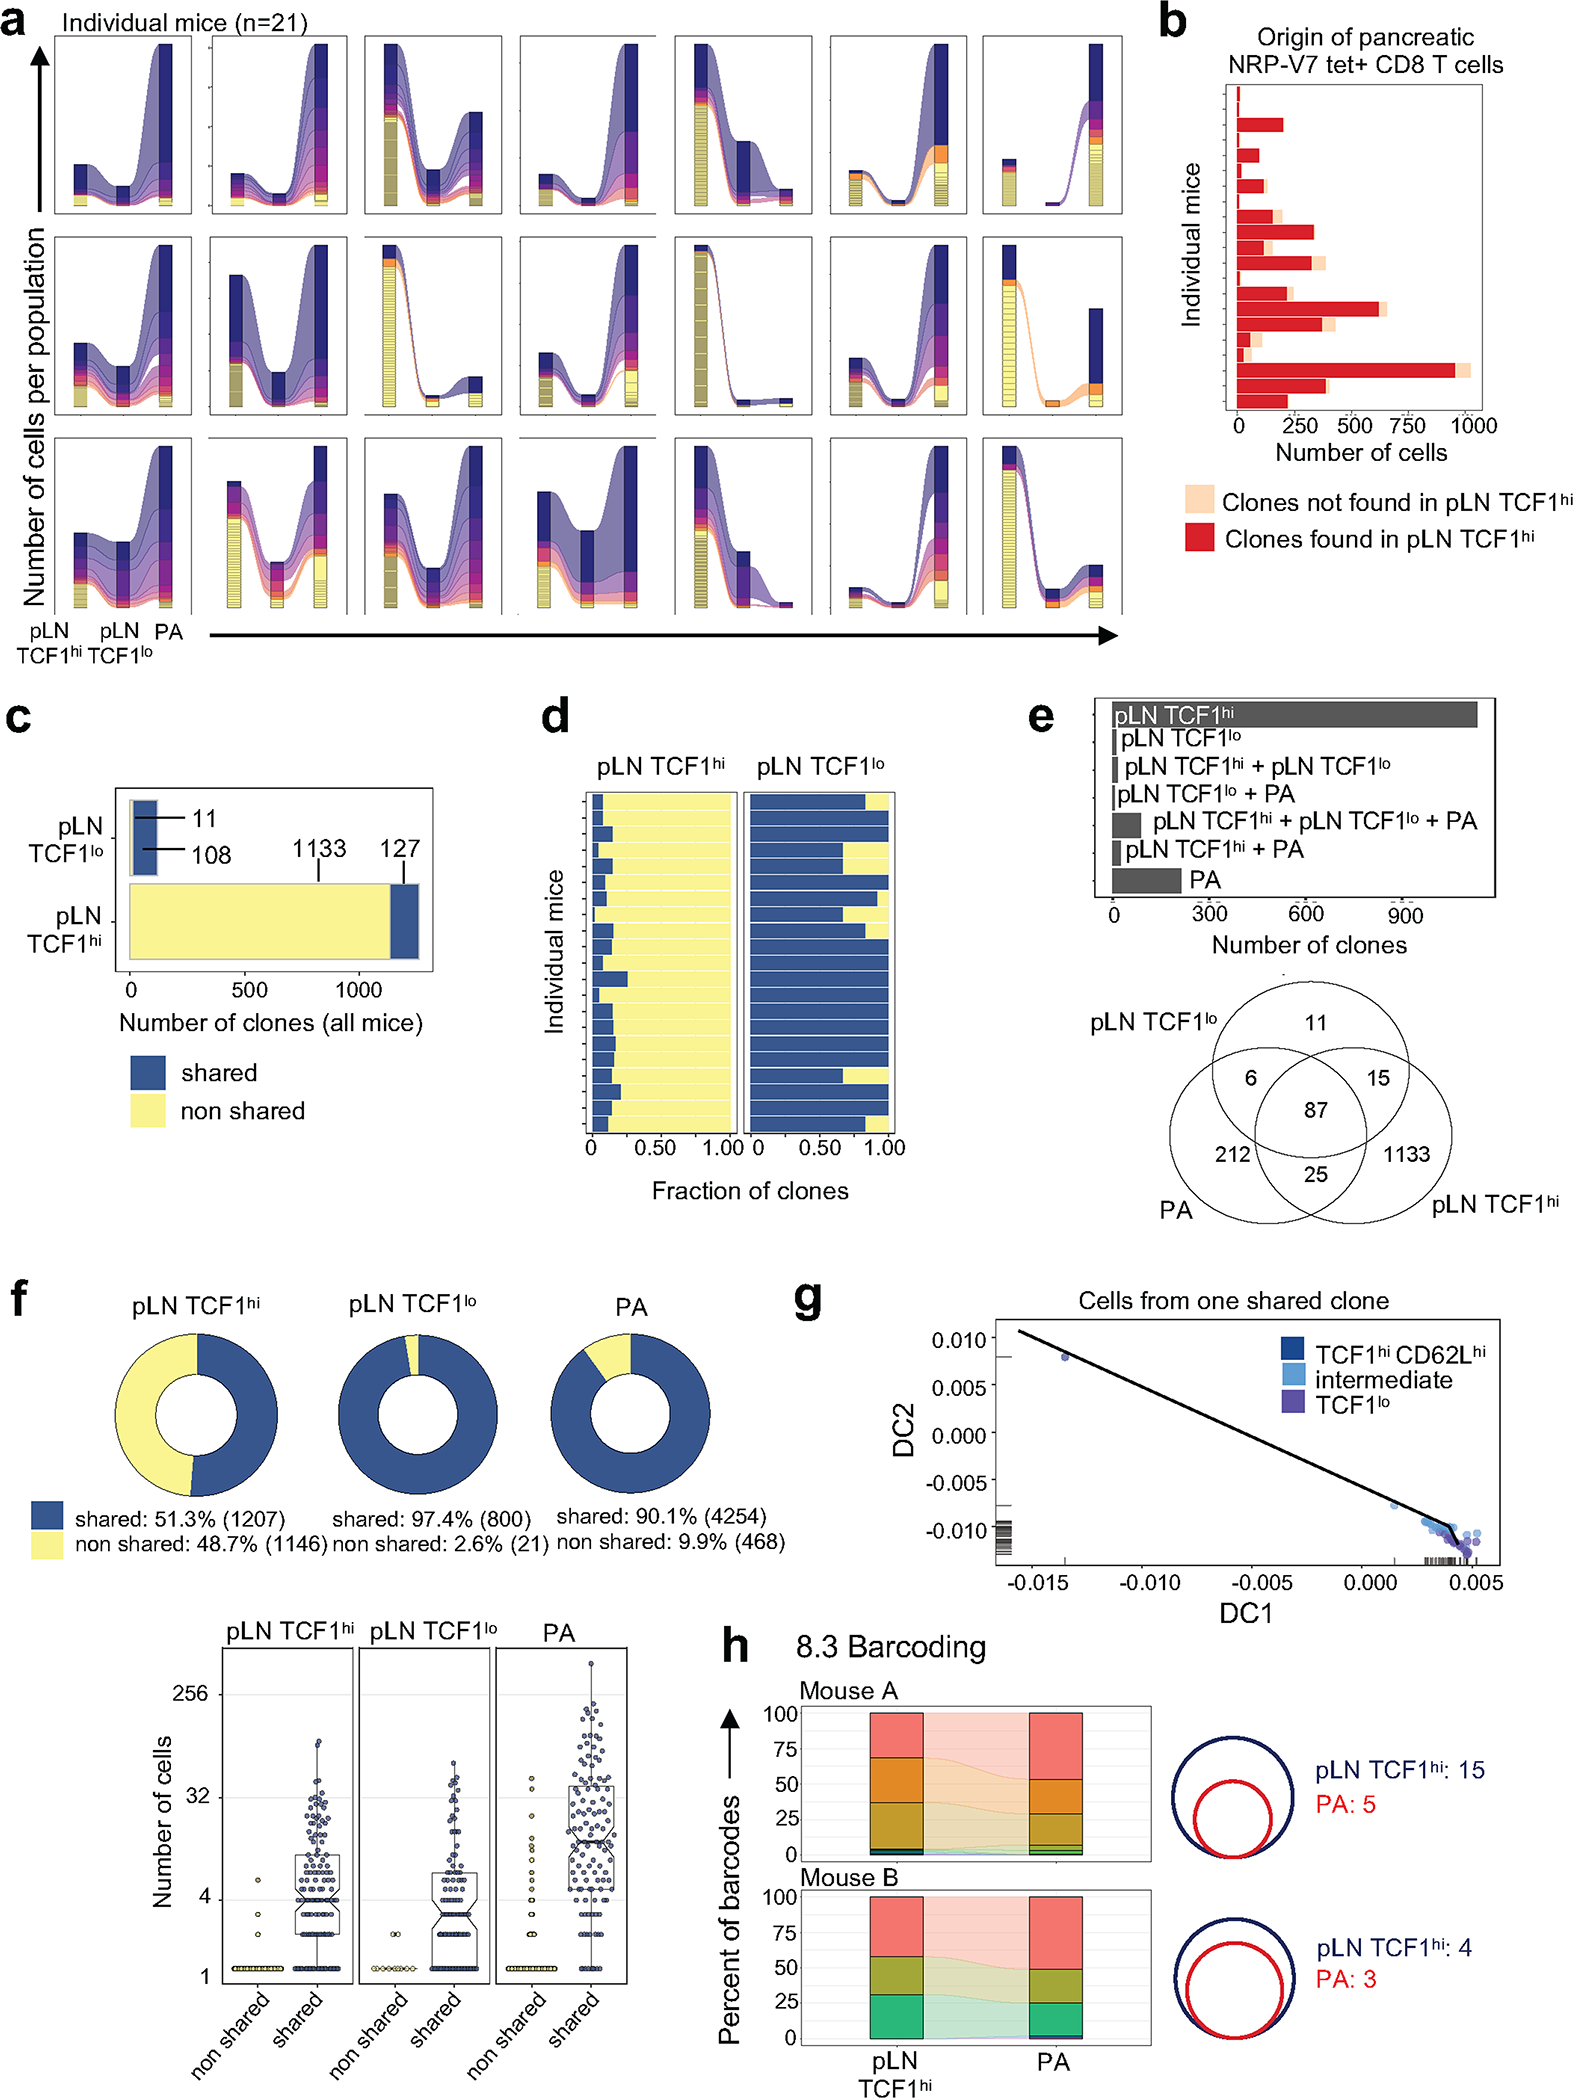
a, b, scRNA-seq of pLN NRP-V7+ CD8 T cells. a, Diffusion map based on gene-expression data coloured by clusters. DC, diffusion component. b, Heat map of pLN scRNA-seq expression (row-based z-score of normalized log counts) for selected cluster marker genes (FDR < 5%). Cells are ordered on the basis of pseudotime. c–e, scTCR-seq of pLN and pancreatic NRP-V7+ CD8 T cells. c, Representative alluvial plot tracking the size of non-shared (yellow) and shared clones in pLN TCF1hi, pLN TCF1lo and pancreas (PA) populations (n = 21). Every non-yellow stratum represents a clone found across multiple populations. d, Fraction of clones in pancreas (PA) found or not found in pLN TCF1hi cells. e, Top, mean number of total clones per mouse in pLN TCF1hi, pLN TCF1lo and pancreas. Bottom, number of clones in each population that are not shared with other populations in individual mice. Each row represents data from one mouse. f, Proposed model. Autoimmune stem-like TCF1hi T cells in the pLN (pLN AP) self-renew and give rise to short-lived pLN TCF1lo AM (pLN AM), which migrate to the pancreas (pancreatic AM) and kill β-cells; pLN AP must continuously seed the pancreas with new AM for sustained β-cell destruction and induction of T1D.
To understand the precise lineage relationships between pLN TCF1hi and pancreatic TCF1lo cells, we performed single-cell T-cell-receptor sequencing (scTCR-seq) of IGRP CD8 T cells from matched NOD pLN and pancreas. In almost all mice, the vast majority of pLN and pancreatic TCF1lo cells harboured clonotypes that were shared with the pLN TCF1hi population, demonstrating that TCF1lo cells are derived from the reservoir of pLN TCF1hi cells (Fig. 4c, d, Extended Data Fig. 9a, b). The pLN TCF1hi population was highly clonally diverse compared with the pLN and pancreas TCF1lo populations and contained an abundance of rare, unexpanded clones that were exclusive to the pLN TCF1hi pool (Fig. 4e, Extended Data Fig. 9c–e). The select clones that were shared between the pLN TCF1hi and other populations expanded significantly in size upon downregulation of TCF1; consequently, the majority of clonotypes found in TCF1lo cells were shared with the TCF1hi population (Extended Data Fig. 9f). Crucially, when we analysed the expression-based trajectory of a single shared clone in the pLN, we found clonal expansion along a similar differentiation path from TCF1hi to TCF1lo as described in Fig. 4a (Extended Data Fig. 9g). Thus, a subset of clones from the diverse pLN TCF1hi repertoire give rise to the majority of pathogenic T cells in the pancreas.
We also conducted genetic fate-mapping experiments with the 8.3 cell–NOD/SCID adoptive transfer model, using a retroviral barcode library. All barcodes that expanded in the pancreas were found in the pLN TCF1hi population (Extended Data Fig. 9h).
In conclusion, pLN TCF1hi cells represent a stem-like autoimmune progenitor (AP) population that self-renews long-term and gives rise to terminally differentiated pancreatic TCF1lo autoimmune mediators (AM) that destroy β-cells (Fig. 4f). AP are necessary to generate and replenish the pool of pancreatic AM, which are short-lived and thus unable to independently sustain the prolonged β-cell destruction that causes T1D. β-cell-specific CD8 T cell responses have notable longevity, which has been shown by the T cell-mediated destruction of islet transplantations in patients with longstanding T1D23. Our results offer an explanation for this phenomenon by revealing the long-term self-renewal capacity of β-cell-specific stem-like CD8 T cells in pLN. We propose that the induction and maintenance of diabetogenic T cell responses requires two functionally distinct populations: short-lived pancreatic AM to destroy β-cells and self-renewing pLN AP to replenish the AM population, thereby enabling sustained β-cell damage that culminates in T1D. Moreover, our results resolve the paradoxical observation that despite presumed chronic self-antigen exposure, pancreatic autoimmune T cells do not display a transcriptional or phenotypic TOX-driven exhaustion program and retain effector function, unlike T cells in tumours or chronic viral infections3—pancreatic AM are short-lived and are constantly replenished by pLN AP instead of undergoing chronic antigen stimulation.
TCF1hi progenitor CD8 T cells that give rise to TCF1lo differentiated progeny have been described in chronic viral infections and cancers3 and our study reveals that a similar model applies to T1D. However, based on comparisons of single-cell transcriptomes, pLN TCF1hi AP in T1D have globally distinct gene-expression patterns compared with TCF1hi progenitor exhausted CD8 T cells in chronic viral infection24 (Extended Data Fig. 10). Notably, the progeny of TCF1hi progenitors in chronic viral infection (TOX+KLRG1+ exhausted cells) and TCF1hi AP in T1D (TOX−KLRG1− cytotoxic AM) are phenotypically, transcriptionally and functionally distinct. TCF1hi AP are also distinct from MPEC and TCM generated during acute infections25 (Extended Data Figs. 4, 10). Thus, our work reveals that autoimmune CD8 T cells in T1D represent unique T cell differentiation states distinct from previously described CD8 T cell populations in infections and cancer. In support of our findings, a recent study found that circulating β-cell–specific CD8 T cells in T1D patients are epigenetically distinct from TCM, effector memory T (TEM) cells and exhausted CD8 T cells in chronic infection26 (for example, in HIV). Given that circulating T cells may not accurately reflect the phenotypes of those infiltrating the pancreas27, future studies should address whether progenitor CD8 T cells are present in human pLN.
Our study also suggests new avenues for T1D treatment, including targeting stem-like AP to eliminate the source of pathogenic AM and preventing the generation and/or influx of AM into the pancreas. For example, FTY720 (fingolimod), a US Food and Drug Administration-approved treatment for multiple sclerosis28, might be an effective therapeutic strategy for patients with T1D. Moreover, anti-CD3 treatment (teplizumab) has been shown to induce long-term protection (currently up to six years) from T1D in at-risk individuals, but the mechanisms responsible for this long-term protection remain incompletely understood29,30; our data suggest that this could be due to the targeting of progenitor populations, either through depletion, tolerance induction or other cell-intrinsic modulation.
In sum, our work reveals how fate diversification of stem-like CD8 T cells initiates and sustains T1D. Strategies that target the stem-like AP pool could emerge as powerful immunotherapeutic interventions for T1D.
Online content
Any methods, additional references, Nature Research reporting summaries, source data, extended data, supplementary information, acknowledgements, peer review information; details of author contributions and competing interests; and statements of data and code availability are available at https://doi.org/10.1038/s41586-021-04248-x.
Methods
Mice
NOD/ShiLtJ (WT NOD), NOD.Cg-Tg(TcraTcrbNY8.3)1Pesa/DvsJ (TCR 8.3-NOD or 8.3), NOD.B6-Ptprcb/6908MrkTacJ (NOD-CD45.2), NOD. CB17-Prkdcscid/J (NOD/SCID) and Balb/cJ mice were purchased from The Jackson Laboratory. 8.3 and NOD-CD45.2 mice were crossed to generate 8.3 45.1/2 and 8.3 45.2 progeny. Female and male NOD mice between 15 and 25 weeks old (or ages specified) were used for phenotypic characterizations. Female and male Balb/cJ mice between 6 and 8 weeks old were used. Adoptive transfer experiments with 8.3 and NOD/SCID mice were performed with female mice between 6 and 12 weeks old. All mice were bred and maintained in the animal facility at Memorial Sloan Kettering Cancer Center (MSKCC). Experiments were performed in compliance with the MSKCC Institutional Animal Care and Use Committee (IACUC) regulations. The holding room was maintained on a 12:12-h light:dark cycle with room temperature of 22.2 ± 0.5 °C and relative humidity ranging from 30% to 70%.
Antibodies and reagents
Fluorochrome-conjugated antibodies were purchased from BD Biosciences, eBioscience, Cell Signaling Technology, and Biolegend. H-2Kd/NRP-V7 (KYNKANVFL) and H-2Kd/Insulin-B 15–23 (LYLVCGER [G→L]) tetramers were obtained from the NIH Tetramer Core Facility and included in cell surface staining for 30 min at 4 °C.
T cell isolation
Mice were euthanized by cervical dislocation. Lymph nodes and spleens were mechanically disrupted with the back of a 3-ml syringe, filtered through a 100-μm strainer, and red blood cells (RBC) were lysed with ammonium chloride potassium buffer. Cells were washed twice with cold PBS supplemented with 3% fetal bovine serum (FBS). Pancreas digestion was adapted from existing protocols31. In brief, the pancreas was resected and perfused with 2 ml of collagenase XI (0.4 mg ml−1) and DNaseI (10 U ml−1) and minced. Pancreas was incubated with another 3 ml of collagenase/DNaseI solution in a water bath at 37 °C for 18 min, followed by vigorous shaking of tubes for 30 s. Tissue was strained through a 100-μm filter and washed with 30 ml serum-free RPMI, then centrifuged at 400g for 5 min. Pellet was resuspended in 20 ml of PBS + 3% FCS, inverted several times, and centrifuged again. Finally, cells were resuspended in PBS + 3% FCS and aliquoted for antibody staining.
Intracellular cytokine and transcription factor staining
Intracellular cytokine staining was performed using the Foxp3/Transcription Factor Staining Buffer Set (eBioscience) following the manufacturer’s protocol. In brief, T cells isolated from lymph nodes, spleens, and pancreas were incubated with PMA (20 ng ml−1) and ionomycin (1 μg ml−1) for 4h at 37 °C in the presence of GolgiPlug (BD Biosciences). After staining for cell-surface markers, cells were fixed, permeabilized, and stained with antibodies against IFNγ (XMG1.2) and TNF (MP6-XT22). Intracellular transcription factor staining was performed using the Foxp3/Transcription Factor Staining Buffer Set (eBioscience) per the manufacturer’s instructions.
Flow cytometric analysis
Flow cytometric analysis was performed using Fortessa X20 and FACSDiva 8.0. Cells were sorted using BD FACS Aria (BD Biosciences) at the MSKCC Flow Core Facility. Flow data were analysed with FlowJo v.10 software (Tree Star). For calculation of absolute cell numbers, 123count eBeads Counting Beads (Invitrogen 01-1234-42) were added to samples for flow cytometric analysis.
Apoptosis assays
For the flow cytometric analysis of active caspases 3 and 7, cells were incubated with 500 nM CellEvent Caspase 3/7 Green Detection Reagent (Invitrogen; C10423) for 30 min at 37 °C. Alternatively, apoptosis was measured by incubating cells with 800 nM Apotracker Detection Reagent (Biolegend; catalogue (cat.) no. 427403) for 15 min at room temperature.
Adoptive T cell transfer
For transfer into first NOD/SCID hosts, 100,000–750,000 naive congenically marked 8.3 CD45.1/2+ or CD45.2+ splenocytes were enriched for CD8+ T cells using MACS EasySep negative selection kits (StemCell) and adoptively transferred into NOD/SCID mice (CD45.1+). Approximately three weeks after transfer when hosts were diabetic, live CD45.2+CD8+ Ly108+CD39− T cells were sorted from the pLN and live CD45.2+CD8+Ly108−CD39+ T cells were sorted from the pancreas and transferred into NOD/SCID hosts. Consistent with established protocols17,32, all 8.3 transfers (to first, second or third hosts) were co-transferred intravenously with 1 × 10⁶ polyclonal CD4+ splenocytes from WT NOD mice (CD45.1), which were enriched using MACS EasySep negative selection kits (StemCell).
Listeria infection
The L. monocytogenes (Lm) ΔactA ΔinlB strain expressing the NRP-V7 epitope (KYNKANVFL) as an ActA-NRP-V7-OVA fusion was constructed as previously described33. Experimental vaccination stocks were prepared by growing bacteria to early stationary phase, washing in PBS, formulated at approximately 1 × 10¹⁰ CFU ml−1, and stored at −80 °C. Mice were infected intraperitoneally with 1 × 10⁷ CFU of Lm NRP-V7.
FTY720 treatment
The 8.3 CD8 splenocytes were transferred into NOD/SCID mice as described above. At 1 or 2 weeks after transfer, n = 3 or 4 mice were collected to assess pancreatic infiltration and treatment was initiated with FTY720 (10 mg kg−1 intraperitoneally every 48 h) or PBS. Mice were monitored for diabetes twice a week and FTY720 treatment was continued until all mice in PBS group were diabetic.
Assessment of diabetes
Mice were monitored for diabetes at least weekly using urine glucose strips (Roche Urinalysis ChemStrips) or a Roche Accuchek blood glucose monitor. Mice were considered diabetic after two consecutive blood glucose measurements of >250 mg dl−1.
Insulitis scoring
Scoring of insulitis was done as previously described34. A portion of the resected pancreas was placed in formalin, processed and embedded in paraffin, and sectioned at 3 levels with 100 μm between levels. Scoring was as follows: 0, no infiltrate; 1, peri-islet infiltrate (25% islet destruction); 2, intra-islet infiltrate (50% islet destruction); 3, intra-islet infiltrate (50–75% islet destruction); 4, complete islet destruction. The insulitis score is calculated as follows: ((0.25 × number of grade-1 islets) + (0.5 × number of grade-2 islets) + (0.75 × number of grade-3 islets) + number of grade 4 islets)/total number of estimated islets.
In vivo CD8 T cell depletion
Twelve-week-old NOD female mice were treated twice per week with CD8α-depleting antibody (clone 53–6.7, 250 μg per mouse) intraperitoneally for 4 months. After two doses the absence of CD8 T cells in the blood was confirmed by flow cytometric analysis. Blood glucose levels were monitored weekly.
Sample preparation for RNA-seq
For pLN and pancreas samples, NOD mice aged 14–20 weeks were used. Samples were isolated as follows: samples were stained with NRP-V7 tetramer, Live/dead Zombie dye, and antibodies against CD8α, CD45.1, CD44 and Ly108. For the pancreas, samples were enriched for islets using methods adapted from published protocols35. In brief, the pancreas was resected and perfused with collagenase XI (1 mg ml−1), digested in a water bath at 37 °C for 15 min, and shaken by hand for 1 min. Samples were washed twice with HBSS, centrifuged at 400g for 2 min, and supernatant removed. Cells were filtered over 70-μm strainers and washed again with HBSS, and the enriched islet fraction was rinsed off the strainer with RPMI + 3% FCS. Islets were dissociated in 1 ml TrypLE for 5 min at 37 °C, washed with HBSS, filtered through a 100-μm strainer, and washed again in HBSS before resuspending in staining cocktail. 1,000–2,000 cells were sorted into FCS, washed with PBS, and resuspended in TRIzol LS reagent (Invitrogen, cat. no. 10296010) and stored at −80 °C. For pLN samples, 500–3,000 cells were sorted directly into TRIzol LS reagent. For naive pLN controls, NOD mice aged 6 weeks were used and cells were stained with CD8a, NRP-V7 tetramer, CD45.1, Live/dead Zombie dye, and CD44. 5,000–10,000 cells were sorted directly intro TRIzol LS reagent.
RNA extraction
Phase separation in cells lysed in TRIzol LS reagent was induced with chloroform. RNA was precipitated with isopropanol and linear acrylamide and washed with 75% ethanol. The samples were resuspended in RNase-free water.
Transcriptome sequencing
After RiboGreen quantification and quality control by Agilent BioAnalyzer, 0.1–1 ng total RNA with RNA integrity numbers ranging from undetectable to 10 underwent amplification using the SMART-Seq v4 Ultra Low Input RNA Kit (Clonetech, cat. no. 63488), with 12 cycles of amplification. Subsequently, 0.7–3 ng of amplified cDNA was used to prepare libraries with the KAPA Hyper Prep Kit (Kapa Biosystems KK8504) using 8 cycles of PCR. Samples were barcoded and run on a HiSeq 4000 in a 50bp/50bp paired end run, using the HiSeq 3000/4000 SBS Kit (Illumina). An average of 59 million paired reads were generated per sample and the percent of mRNA bases per sample ranged from 63% to 86%.
Transcriptome data analysis
Sequencing reads were mapped with STAR v.2.6.0c with default parameters to the mouse reference genome36 (GRCm38.p6). Fragments per gene were counted with featureCounts v1.6.2 with respect to Gencode vM17 comprehensive gene annotations37,38.
Differentially expressed genes
DEGs between pairwise comparisons were identified by Wald tests using DESeq2 v.1.26.039, and only Benjamini–Hochberg corrected P values < 0.10 were considered statistically significant40.
Cluster analysis
Likelihood ratio tests (LRT) were used to determine genes which vary between the four conditions in any way (adjusted P < 0.01). Genes identified by the LRT method were clustered based on their changes in expression across the four conditions with the degPatterns function from the DEGreport v.1.22.0 R package41.
Heat maps
log2-transformed counts per million (CPM) values were used for heat map plots of bulk RNA-seq data, which were centred and scaled by row.
Pathway and GO term enrichment analyses
For gene set enrichment analysis, the fgseaMultilevel function from the R-package fgsea v.1.12.0 was run in pre-ranked mode42 (genes were ranked based on DESeq2’s Wald statistic). Gene ontology over representation analysis was performed for biological processes ontology domain, using the Bioconductor package clusterProfiler v.3.14.343.
Sample preparation for scRNA-seq, scTCR-seq and CITE-seq
Female NOD mice aged 13–20 weeks were used. Samples were prepared as described above for RNA-seq, except before pooling samples were incubated with hashtags (Biolegend Total-Seq C0301–10, cat. no. 155861) to e,nable multiplexing. Samples were stained with NRP-V7 tetramer, Live/dead Zombie dye and antibodies against CD8α and CD45.1; in addition, Biolegend feature barcoding antibodies against CD44, CD62L, CD127, CD73, PD1, CD38 and CD39 were added for CITE-seq analysis. 2,000–16,000 cells were sorted into PBS + 0.04% BSA, immediately analysed for viability and processed.
scRNA-seq and TCR-seq analyses
VDJ and single-cell RNA-seq including hash-tagged oligos (HTO), and antibody-derived tags (ADT) data were processed following the recommendations by ref. 44 (https://bioconductor.org/books/release/OSCA/; version 13 November 2020). In brief, raw sequencing read files were processed and aligned using the CellRanger pipeline (cellranger-5.0.0 with refdata-gex-mm10-2020-A for annotation supplied by 10X Genomics: https://support.10xgenomics.com/single-cell-gene-expression/software/downloads/latest). Read counts representing gene expression were used for removing barcodes representing empty droplets or droplets with high amounts of mitochondrially encoded gene products: using the isOutlier() function of the scater package45, all cells whose fractions of mitochondrial reads were higher than 3× median absolute deviation (MAD) were flagged and removed as well as cells with fewer than 102.5 detected genes. Following the first round of filtering, HTO demultiplexing to identify the donor mouse for each droplet and doublet detection were done with CiteFuse46. After removal of low-quality droplets and barcodes associated with HTO-inferred doublets, ADT values were normalized using DropletUtils::inferAmbience() and scuttle::medianSizeFactors(). Finally, droplets for which less than 50% of the ADT were detected compared to other droplets were removed and only genes that were expressed in at least 5 cells per sample were kept for downstream analyses. VDJ sequencing data were imported into R using the import_vdj() function of the djvdj package (https://rnabioco.github.io/djvdj/) which was adjusted to work with SingleCellExperiment objects (https://github.com/friedue/SCEdjvdj). Size-factor normalized logcounts were obtained via scran::computeSumFactors and scater::logNormCounts45,47. Cells from the three different technical replicates were integrated with batchelor::fastMNN() using the top 2,500 most variable genes48 with minimum mean normalized expression of 0.001. Clustering was performed with igraph::cluster_louvain(). Marker genes were determined with scran::findMarkers() and dimensionality reductions were done with the batch-corrected values and destiny::diffu sionMap()49,50. The TSCAN package51 (v.1.28.0) was used to calculate pseudotime values and trajectories as well as genes associated with the pseudotime gradients. GO term enrichments were calculated with the clusterProfiler package’s functions compareCluster() and enrichGO() after excluding ribosomal genes from the gene lists of interest. All plots were generated using ggplot2 packages; heat maps were generated with the pheatmap package.
scRNA-seq integration with public datasets
Gene count matrices for day 7 CD8 T cells from acute and chronic infection were obtained from GEO (GSE119940); using cell labels provided by C. Yao24, we extracted the data for barcodes corresponding to memory precursor and progenitor-like cells as described24. scRNA-seq data for TCM25 were downloaded from the Gene Expression Omnibus (GSE130130; day 129 following acute infection: GSM3732587). scRNA-seq of TCM, MPEC and progenitor exhausted T cells (TPEX) were subsequently integrated with the pLN dataset using batchelor::multiBatchNorm() and batchelor::fastMNN() as described above. For global comparisons of the different populations of T cells, we created pseudo-bulk samples by aggregating the read counts per gene across cells of the same population. These were then cpm-normalized via edgeR::calcNormFactors52 and subsequently analysed and visualized via PCA and hierarchical clustering using base R functions as well as pcaExplorer::hi_loadings() and the dendextend package53,54. All other analyses were done with the same principles and packages as described above. For details, see the code at https://github.com/abcwcm/GeartySchietinger.
Genetic fate mapping sample preparation
Bone marrow from TCR 8.3 NOD mice was collected and enriched for cKit+ cells using Miltenyi positive selection kit (cat. no. 130-091-224) and cultured with IL-3, IL-6 and stem cell factor. After an overnight rest, the cells were transduced with a pMIUR retroviral vector containing 2,664 unique barcodes fused to red fluorescence protein (RFP) (see for details below). 24 h after transduction, RFP+ bone marrow cells were sorted, and 100,000–250,000 cells were injected intravenously into NOD or NOD/SCID mice that were irradiated with 900 or 300 cGy 2–6 h beforehand. After bone marrow reconstitution at 8 weeks, naive barcoded RFP+CD8+ splenocytes were sorted and 100,000 cells were transferred to NOD/SCID mice. One-hundred-thousand sorted splenocytes from each mouse were reserved for input controls. When NOD/SCID mice became diabetic (3–4 weeks after transfer), barcoded RFP+CD8+Ly108+CD39− (TCF1hi) cells were sorted from the pLN and barcoded RFP+CD8+Ly108−CD39+ (TCF1lo) cells were sorted from the pancreas. Genomic DNA was isolated using the Qiagen QIAamp DNA Micro kit, after which the barcode adapters were amplified and the barcodes were sequenced.
pMIUR generation
A 1.142-kb fragment encoding turbo RFP in the 5′ to 3′ orientation and an inverted U6-gRNA-scaffold cassette in the 3′ to 5′ orientation was obtained from IDT and cloned into pMIG (Addgene, cat. no. 9044) using standard restriction enzyme-based methods. In brief, the fragment was amplified using primers that add EcoRI and SalI restriction sites on the 5′ and 3′ regions, respectively, and subsequently digested and cloned into linearized pMIG backbone harbouring EcoRI and SalI cloning overhangs. All constructs were sequence-verified using Sanger sequencing.
Barcode cloning
A total of 2,664 20-bp barcodes (repurposed from a focused sgRNA library) were cloned into the pMIUR retroviral backbone using a modified version of the previously published protocol55, ensuring a library representation of >10,000×. In brief, each sub-pool (about 463 barcodes per pool) was selectively amplified using barcoded forward and reverse primers that append cloning adapters at the 5′ and 3′ ends of the sgRNA insert, purified using the QIAquick PCR Purification Kit (Qiagen), and ligated into BbsI-digested and dephosphorylated pMIUR vector using high-concentration T4 DNA ligase (NEB). A minimum of 1.2 μg of ligated pMIUR plasmid DNA per sub-pool was electroporated into Endura electrocompetent cells (Lucigen), recovered for 1 h at 37 °C, plated across four 15cm LB-Carbenicillin plates (Teknova), and incubated at 37 °C for 16 h. The total number of bacterial colonies per sub-pool was quantified using serial dilution plates to ensure a library representation of >10,000×. The next morning, bacterial colonies were scraped and briefly expanded for 4 h at 37 °C in 500 ml of LB-carbenicillin. Plasmid DNA was isolated using the Plasmid Plus Maxi Kit (Qiagen).
Barcode sequencing
To assess sgRNA distribution in each of the sub-pools, as well as the master pool (composed of equimolar amounts of plasmid DNA from each individual sub-pool), we amplified the barcode region using primers that append Illumina sequencing adapters on the 5′ and 3′ ends of the amplicon, as well as a random nucleotide stagger and unique demultiplexing barcode on the 5′ end. Library amplicons were size-selected on a 2.5% agarose gel, purified using the QIAquick Gel Extraction Kit (Qiagen), and sequenced on an Illumina NextSeq instrument (75-nt single end reads).
Genetic fate mapping raw data processing and library counts
A custom Unix shell script was used to process the FASTQ data files to extract and count the sgRNA sequences for each library. To filter for high-quality sequences the script first looked for an exact match of the adapter filtering out those that failed to match. We then extracted the 20-bp sequence corresponding to the sgRNA. The tags were counted and joined into a matrix of counts per library.
Genetic fate mapping data analysis
The raw count matrix was then processed using a script written in R. The data were first normalized by the total number of counts in each library. We then computed the percentage of total coverage for each sequence. For each library we took the top N sequences by percentage where N was determined to reach 99% of the full library. For each mouse we combined the sequences in the 99% set and then plotted the percentage in each tissue component using the R package ggalluvial. Code for the analysis is available at https://github.com/soccin/ScreenSEQ/tree/feature/simpleScripts.
Data reporting
No statistical methods were used to pre-determine sample size. The investigators were not blinded to allocation during experiments and outcome assessment.
Statistical analyses
Statistical analyses were performed using two-tailed Student’s t-tests (Prism 9.2.0, Graphpad Software) unless otherwise indicated. A P value of <0.05 was considered statistically significant.
Reporting summary
Further information on research design is available in the Nature Research Reporting Summary linked to this paper.
Data availability
The RNA-seq data have been deposited in the Gene Expression Omnibus under accession GSE151652. Comparisons to publicly available published data used the following datasets: GSE11994324, GSE13013025 and GSE7081356. Additional information and materials will be made available upon request. Source data are provided with this paper.
Code availability
All custom scripts used in this study are deposited at https://github.com/abcwcm/GeartySchietinger and https://github.com/soccin/ScreenSEQ/tree/feature/simpleScripts.
Extended Data
Extended Data Fig. 1 |. Phenotypic characterization of IGRP-specific CD8 T cells in NOD mice.
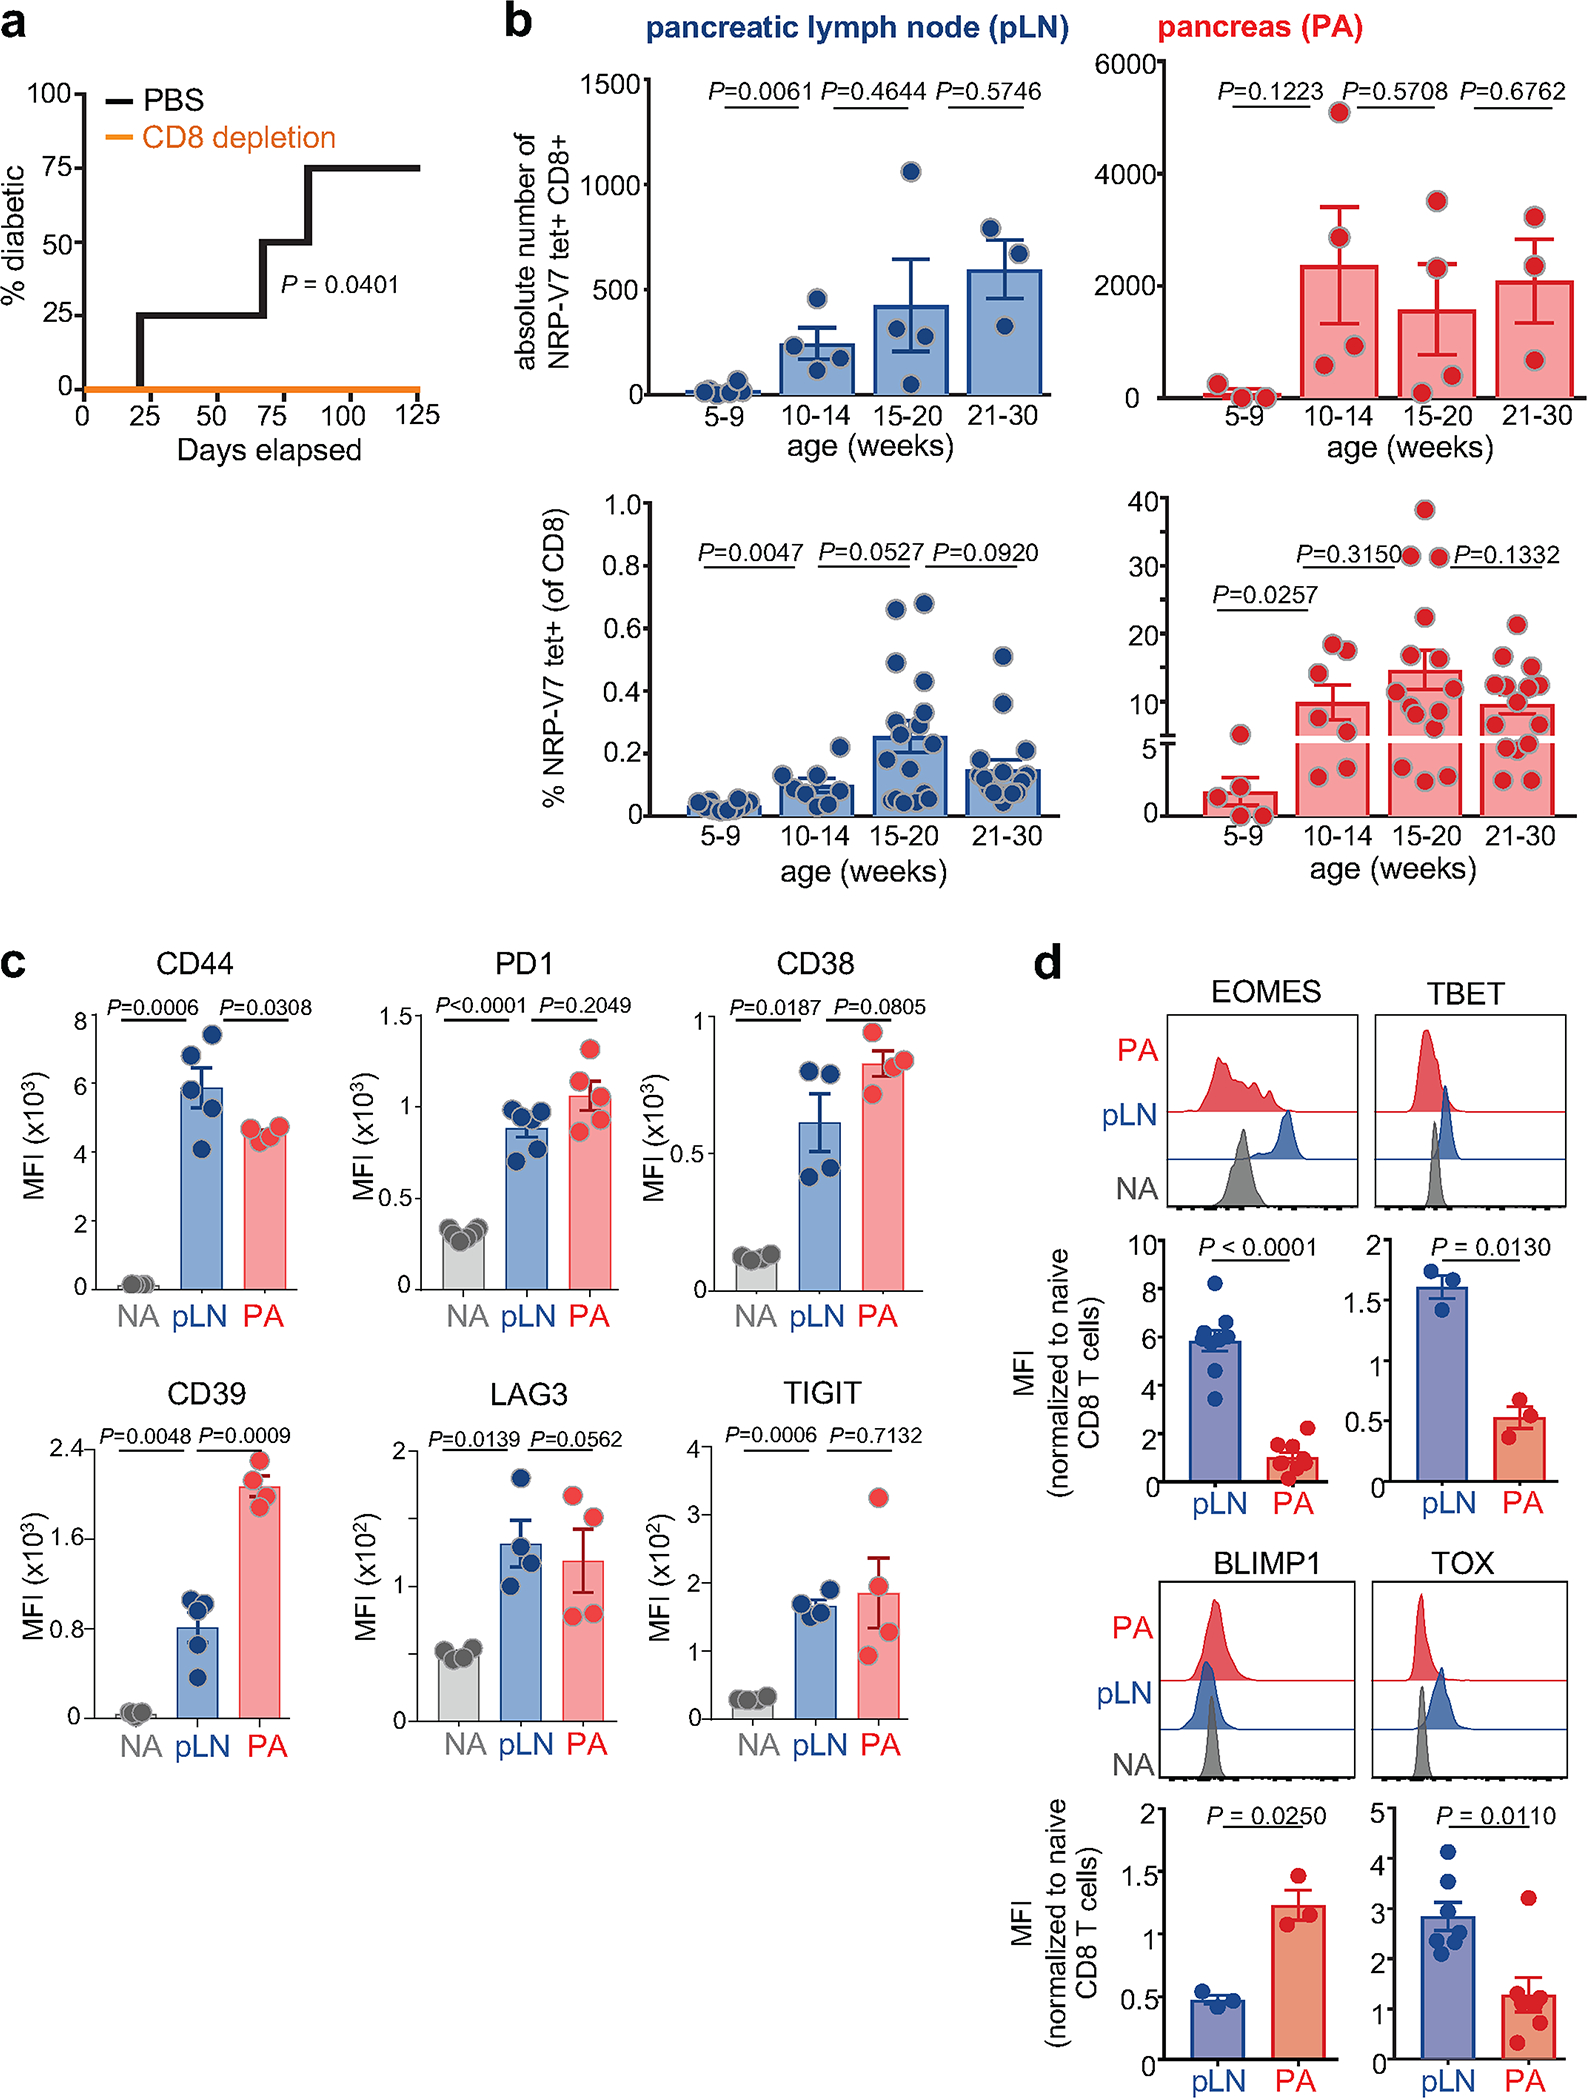
a, Depletion of CD8 T cells prevents T1D. 12-week-old female WT NOD mice were treated with anti-CD8α depleting antibody (clone 53–6.7, 250ug/mouse intraperitoneally (i.p.) twice weekly) for 4 months. Control mice received PBS i.p. n = 4 per group. Statistical testing was conducted via log-rank (Mantel-Cox) test. b, Absolute numbers (top) or frequency (bottom) of IGRP-specific (NRP-V7 tetramer+) CD8+ T cells in pancreatic lymph node (pLN; blue) and pancreas (red) at 5–9, 10–14, 15–20, and 21–30 week-old NOD mice, respectively. For absolute numbers: pLN: n = 6 (5–9wk), n = 4 (10–14wk), n = 4 (15–20wk), n = 3 (21–30wk). pancreas: n = 3 (5–9wk), n = 4 (10–14wk), n = 4 (15–20wk), n = 3 (21–30wk). For frequencies: pLN: n = 10 (5–9wk), n = 8 (10–14wk), n = 17 (15–20wk), n = 16 (21–30wk). Pancreas: n = 5 (5–9wk), n = 7 (10–14wk), n = 15 (15–20wk), n = 15 (21–30wk). Each symbol represents an individual mouse. Data are mean ± SEM. Statistical testing via unpaired two-tailed Student’s t-test. ns, not significant. c, Expression of CD44, PD1, CD38, CD39, LAG3, and TIGIT of IGRP-specific CD8+ T cells from pLN (blue) and pancreas (PA; red). Naïve T cells (NA; NRP-V7-CD44-CD8+ NOD splenocytes from the same mouse) are shown as controls (grey); for CD38: NRP-V7 CD8+ NOD splenocytes. Representative of 2–3 independent experiments, n=4–5. d, Expression of transcription factors EOMES, TBET, BLIMP1 and TOX in IGRP-specific CD8+ (NRP-V7 tet+) T cells isolated from pLN (blue) and pancreas (PA; red); Naïve T cells (NA; NRP-V7 tet− CD44- CD8+ splenocytes) are shown as controls (grey). Data are normalized to NA mean fluorescence intensity (MFI). EOMES and TOX, pooled data from 2 independent experiments, n = 9 (EOMES) and n = 7 (TOX). TBET and BLIMP1, data representative of 2 independent experiments, n=3. Statistical testing via paired two-tailed Student’s t-test. Data are mean ± SEM.
Extended Data Fig. 2 |. Phenotypic characterization of IGRP-specific and Insulin B (InsB)-specific CD8+ T cells in various tissues of NOD mice.
a, Expression of TCF1 versus TOX in IGRP-specific CD8+ T cells from pancreatic lymph node (pLN) and pancreas; Naïve (NA) T cells are shown as controls. Inset numbers show percentage of cells per gate. Data is representative of 2–3 independent experiments, n = 3–6. b, Bifurcation of IGRP-specific CD8 T cells into TCF1hi and TCF1lo T cell populations is not found iLN or spleen. Expression profiles of TCF1, CD44, CD39, PD1, and TOX of IGRP-specific CD8 T cells isolated from inguinal LN (iLN; purple) and spleen (green) of NOD mice; naïve T cells are shown as controls (NA). Inset numbers show percentage for each gate. Right panel, percentage of TCF1loCD39+ cells of NRP-V7 tet+ CD44+ CD8+ T cells in iLN and spleen (iLN, n=5; spleen, n = 3). Statistical testing via unpaired two-tailed Student’s t-test. Data are mean ± SEM. Representative of 2 (iLN) and 5 (spleen) independent experiments. c, IGRP-specific and Insulin B (InsB)-specific CD8 T cells bifurcate into phenotypically similar populations in the pancreatic lymph node. Left, NRP-V7+ and InsB+ CD8 T cell populations in pancreas; FACS plot is gated on live CD8+ T cells. Right, expression of TCF1, CD39, PD1, and CD44 in pLN TCF1hi and TCF1lo NRP-V7+ (grey) and InsB+ (blue) CD8 T cells in pancreatic lymph node (top), and NRP-V7+ (grey) and InsB+ (red) CD8 T cells in pancreas (bottom). pLN cells pooled from multiple mice. Representative of 2–3 independent experiments with n = 3–14 (pLN) and n = 6–9 (pancreas). d, Expression levels of CD44, TCF1, CD39, PD1, and CD62L of TCF1hi and TCF1lo IGRP-specific (NRP-V7 tet+) and Insulin B (InsB tet+) CD8 T cells from pLN and pancreas. For pLN, each symbol represents 3 pooled mice; for pancreas, each symbol represents one individual mouse. Data are mean ± SEM. Statistical testing conducted via unpaired two-tailed Student’s t-test. e, TCF1 and PD1 expression profiles of NRP-V7+ and polyclonal CD44+CD39+CD8+ T cells from pLN and pancreas. pLN cells pooled from multiple mice.
Extended Data Fig. 3 |. Transcriptome analysis of IGRP-specific CD8 T cells from pancreatic lymph node and pancreas.
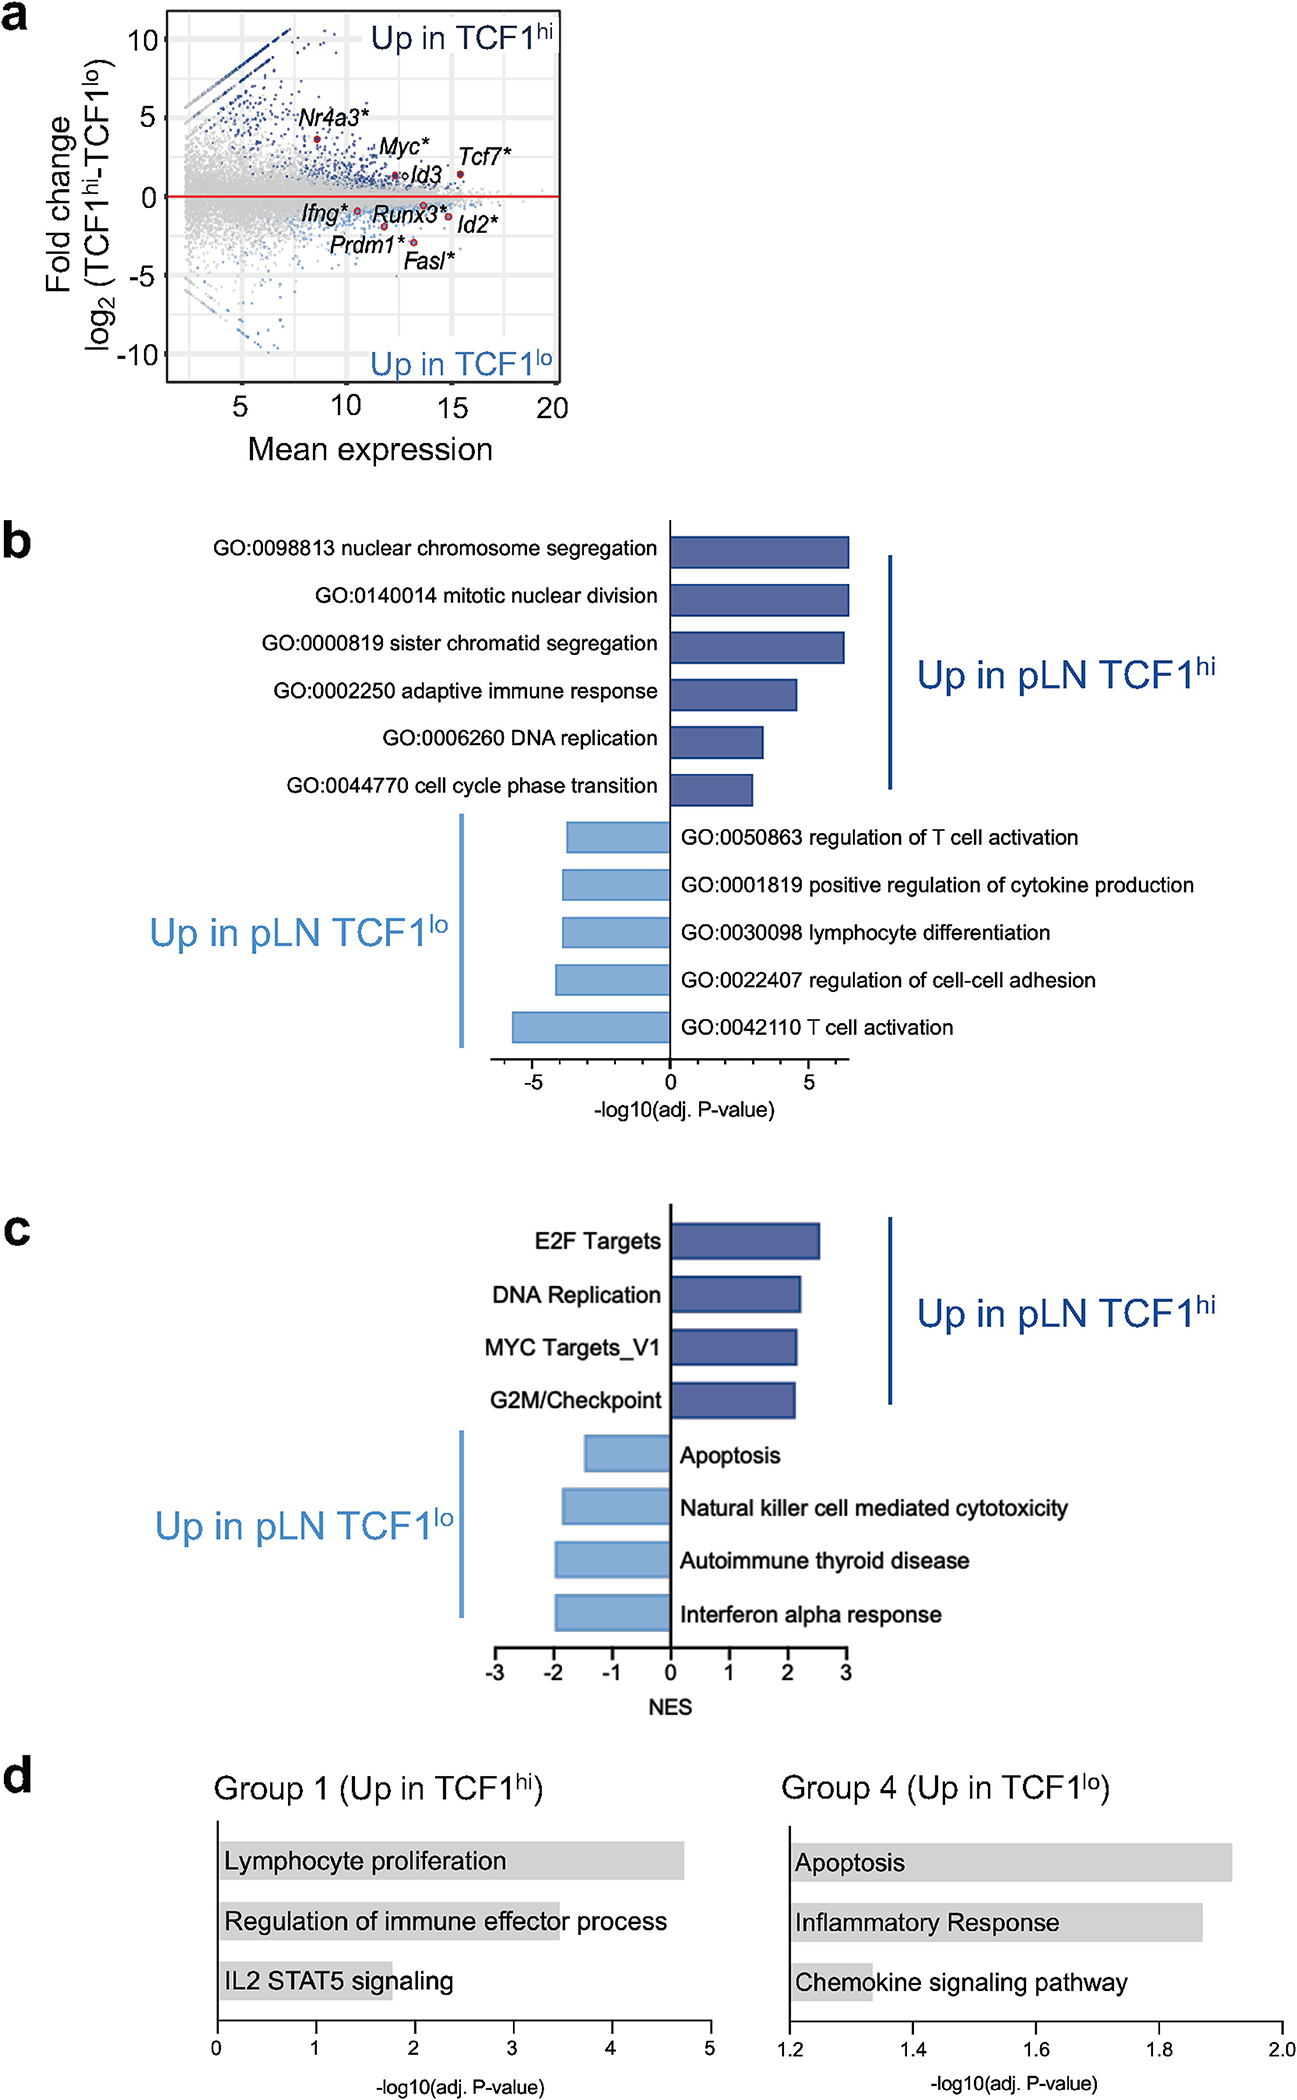
a, MA plot of RNA-seq of pLN TCF1hi and pLN TCF1lo IGRP-specific CD8 T cells. Significantly differentially expressed genes are colored in light or dark blue and labeled with *. Selected genes are highlighted. b, Gene ontology (GO) term analysis of differentially expressed genes in pLN RNA-seq data set. GeneRatio>20/X. P-adj<0.01. Statistical testing conducted via hypergeometric test with Benjamini-Hochberg correction. c, GSEA of pLN TCF1hi and pLN TCF1lo cells including Hallmark and KEGG gene sets. d, Over-representation of KEGG and Hallmark pathways and GO terms in groups 1 and 4. P-adj<0.05.
Extended Data Fig. 4 |. IGRP-specific autoimmune CD8 T cell populations are phenotypically and transcriptionally distinct from IGRP-specific effector and memory CD8 T cells generated during acute infections.
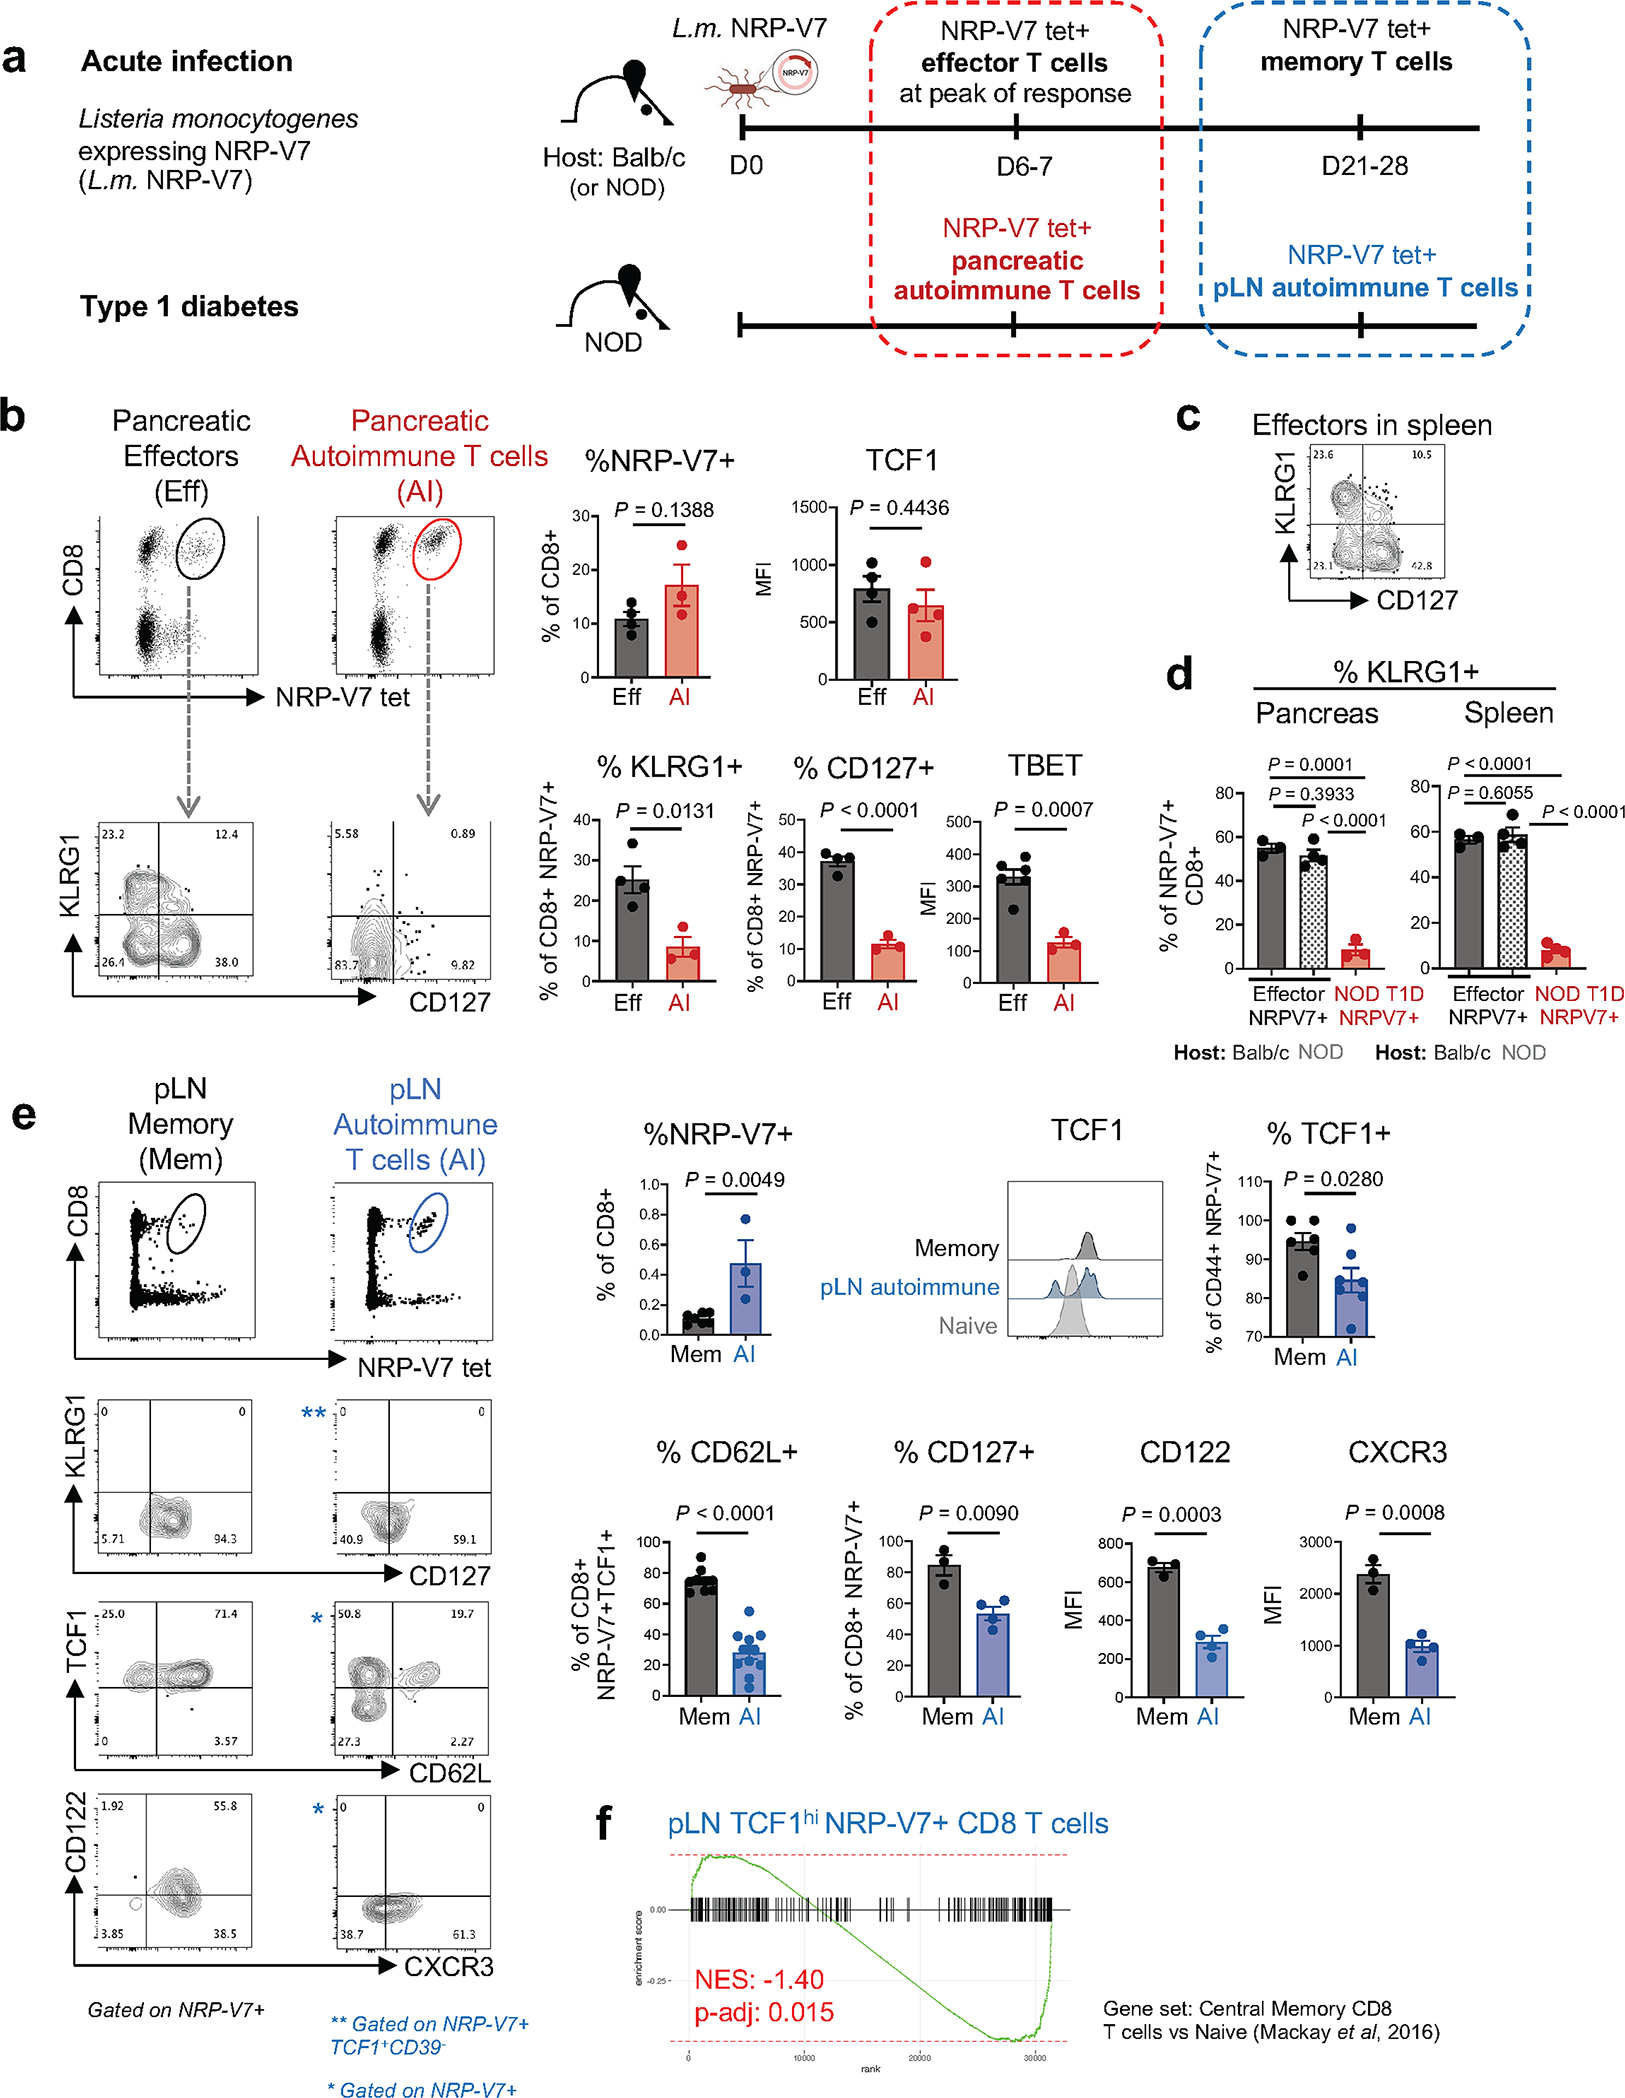
a, Experimental scheme showing generation of NRP-V7 tet+ effector and memory CD8 T cells during an acute Listeria infection in comparison to NRP-V7 tet+ autoimmune CD8 T cells in NOD mice. A Listeria monocytogenes strain was generated expressing the NRP-V7 mimotope (L.m. NRP-V7); host mice (Balb/c or NOD) were infected with L.m. NRP-V7 and effector and memory T cells from indicated tissues were analyzed at indicated time points using NRP-V7 tetramer. Effector and memory T cells were compared with NRP-V7+ autoimmune T cell populations from NOD mice and tissues as indicated. b, Top, identification of NRP-V7+ CD8 T cells in pancreas (effectors (Eff); black) at day 6–7 post infection of Balb/c mice or autoimmune NRP-V7+ CD8 T cells in pancreas of uninfected NOD mice (AI; red). Right, frequency of NRP-V7+ of CD8 T cells. Expression levels of KLRG1, CD127, TBET, and TCF1 in Eff and AI NRP-V7+ CD8 T cells from pancreas of Balb/c and NOD, respectively, are shown and quantified. Eff, n=4 (%NRP-V7+, %KLRG1+, %CD127+, TCF1 MFI) or n = 6 (TBET MFI); AI, n=3 (%NRP-V7+, %KLRG1+, %CD127+, TBET MFI) or n = 4 (TCF1 MFI). c, Expression of KLRG1 and CD127 of NRP-V7+ effectors from spleens of L.m.-infected Balb/c mice. b, c, Representative of 3 independent experiments. d, Frequency of KLRG1+ of NRP-V7+ CD8 T cells from pancreas (left) and spleen (right) of L.m.-infected Balb/c and NOD mice at day 6 post L.m. NRP-V7 infection compared to autoimmune (AI) NRP-V7+ CD8 T cells from NOD mice. Eff, n=3; NOD Eff, n = 4; NOD, n = 3 (pancreas), n=4 (spleen). Representative of 1 experiment. e, Top, identification of NRP-V7+ CD8 T cells in pancreatic lymph node (pLN) (memory (Mem); black) at day 21–28 post infection and autoimmune (AI) NRP-V7+ CD8 T cells in pLN of uninfected NOD mice (blue). Frequency of NRP-V7+ of CD8 T cells quantified on right. Expression profiles and frequencies of KLRG1, CD127, TCF1, CD62L, CD122, and CXCR3 of Mem and AI NRP-V7+ CD8 T cells from pLN of Balb/c and NOD, respectively. Mem, n = 7 (%NRP-V7+), n=6 (%TCF1+CD44+), n = 9 (%CD62L+), n = 3 (%CD127+, CD122 MFI, CXCR3 MFI); AI, n = 3 (NRP-V7+), n=7 (%TCF1+CD44+), n = 11 (%CD62L+), n=4 (%CD127+, CD122 MFI, CXCR3 MFI), n = 3 (%NRP-V7+). Representative of 3 independent experiments; %CD62L+ shows 3 combined experiments. Statistical testing conducted by Student’s two-tailed unpaired t-test. Data are mean ± SEM. f, Gene set enrichment analysis of RNA-seq data from IGRP-specific pLN TCF1hi CD8 T cells (see Fig. 2) compared to central memory CD8 T cells generated during acute LCMV infection; dataset from Mackay et al, 2016, GSE70813. NES, normalized enrichment score.
Extended Data Fig. 5 |. Longitudinal analysis of IGRP-specific 8.3 CD8 T cells post transfer into NOD Scid mice.
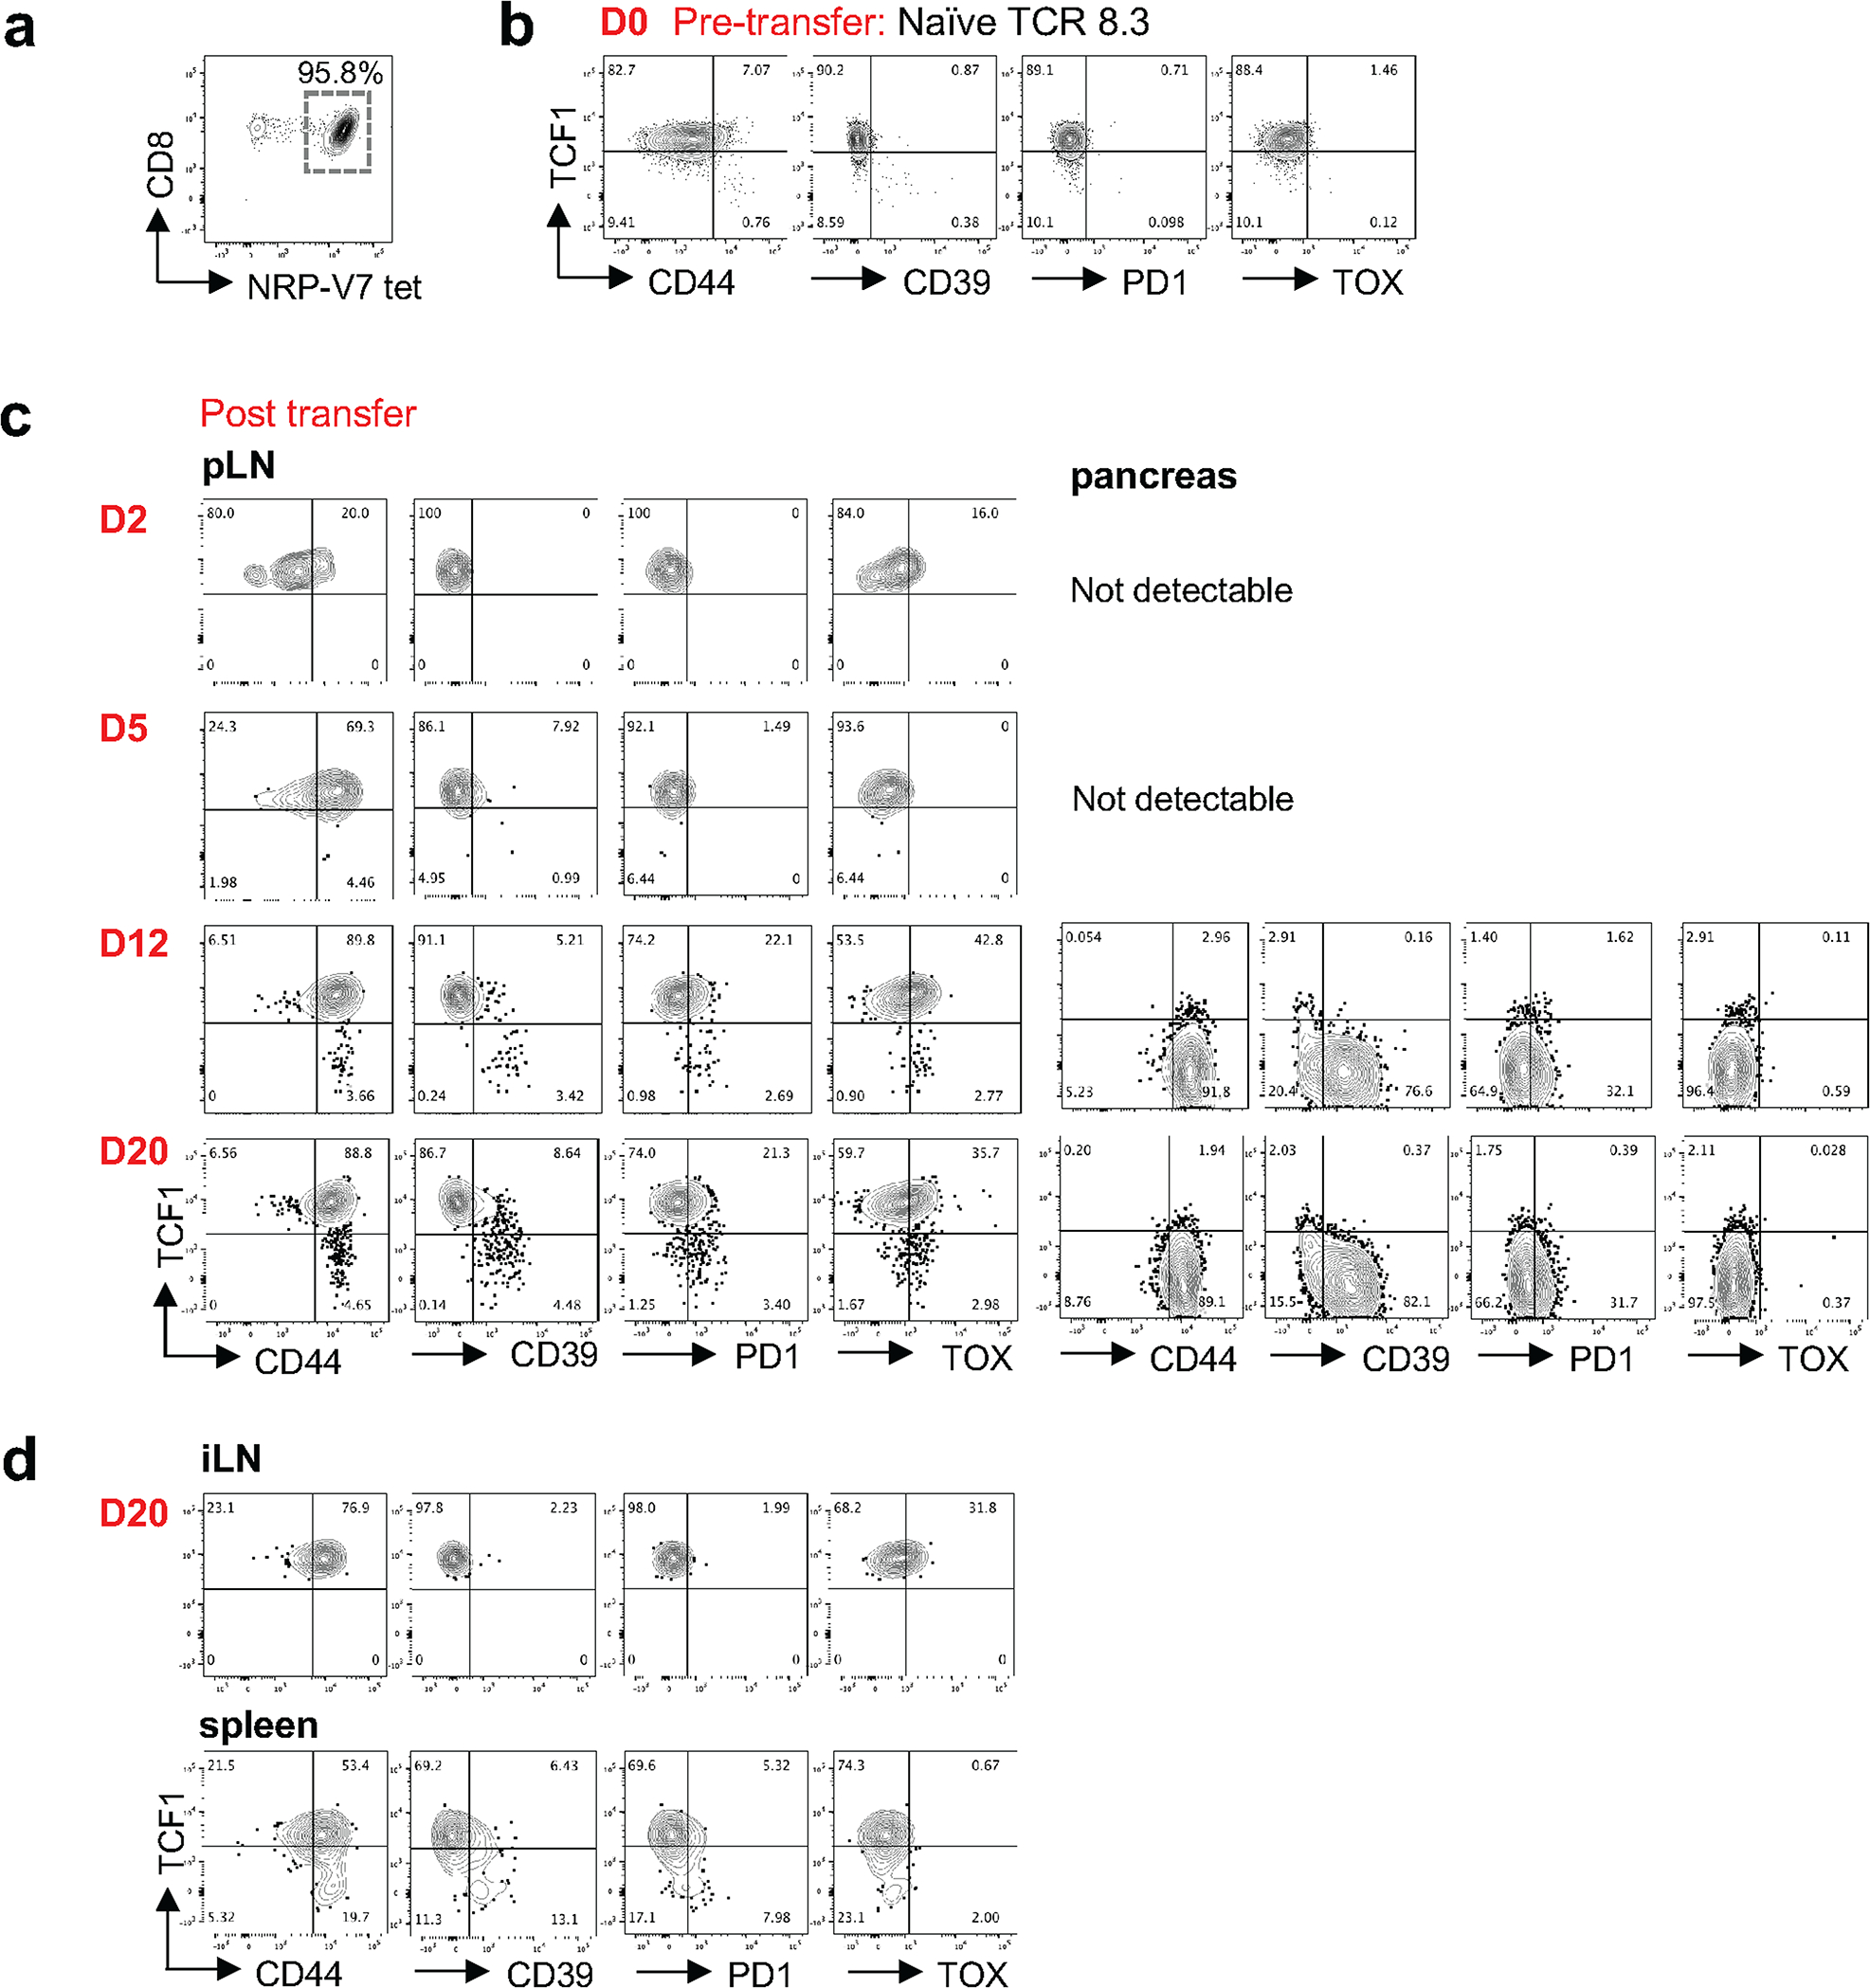
a, NRP-V7+ tetramer staining of CD8+ splenocytes from 8.3 TCR transgenic mouse. Representative of at least 3 independent experiments, n = 2. b, Expression of TCF1, CD44, CD39, PD1, and TOX of naïve 8.3 CD8 T cells pre-transfer (Day 0). c, Expression of indicated molecules in pLN and pancreas of NOD Scid hosts at day 2, 5, 12, and 20 post transfer (note: transferred donor T cells were not detected in pancreas before day 12). b, c, Representative of 2 (day 2, day 5, and 12) or 3 (day 20) independent experiments with n=2 (day 2, day 5, and 12) or n = 6 (day 20) replicates. d, Expression of indicated molecules in inguinal lymph nodes (iLN) and spleens of NOD Scid hosts at day 20 post transfer. Representative of 2 independent experiments with n=2 replicates.
Extended Data Fig. 6 |. Analysis of transferred TCF1hi or TCF1lo CD8 T cells in 2nd NOD Scid hosts.
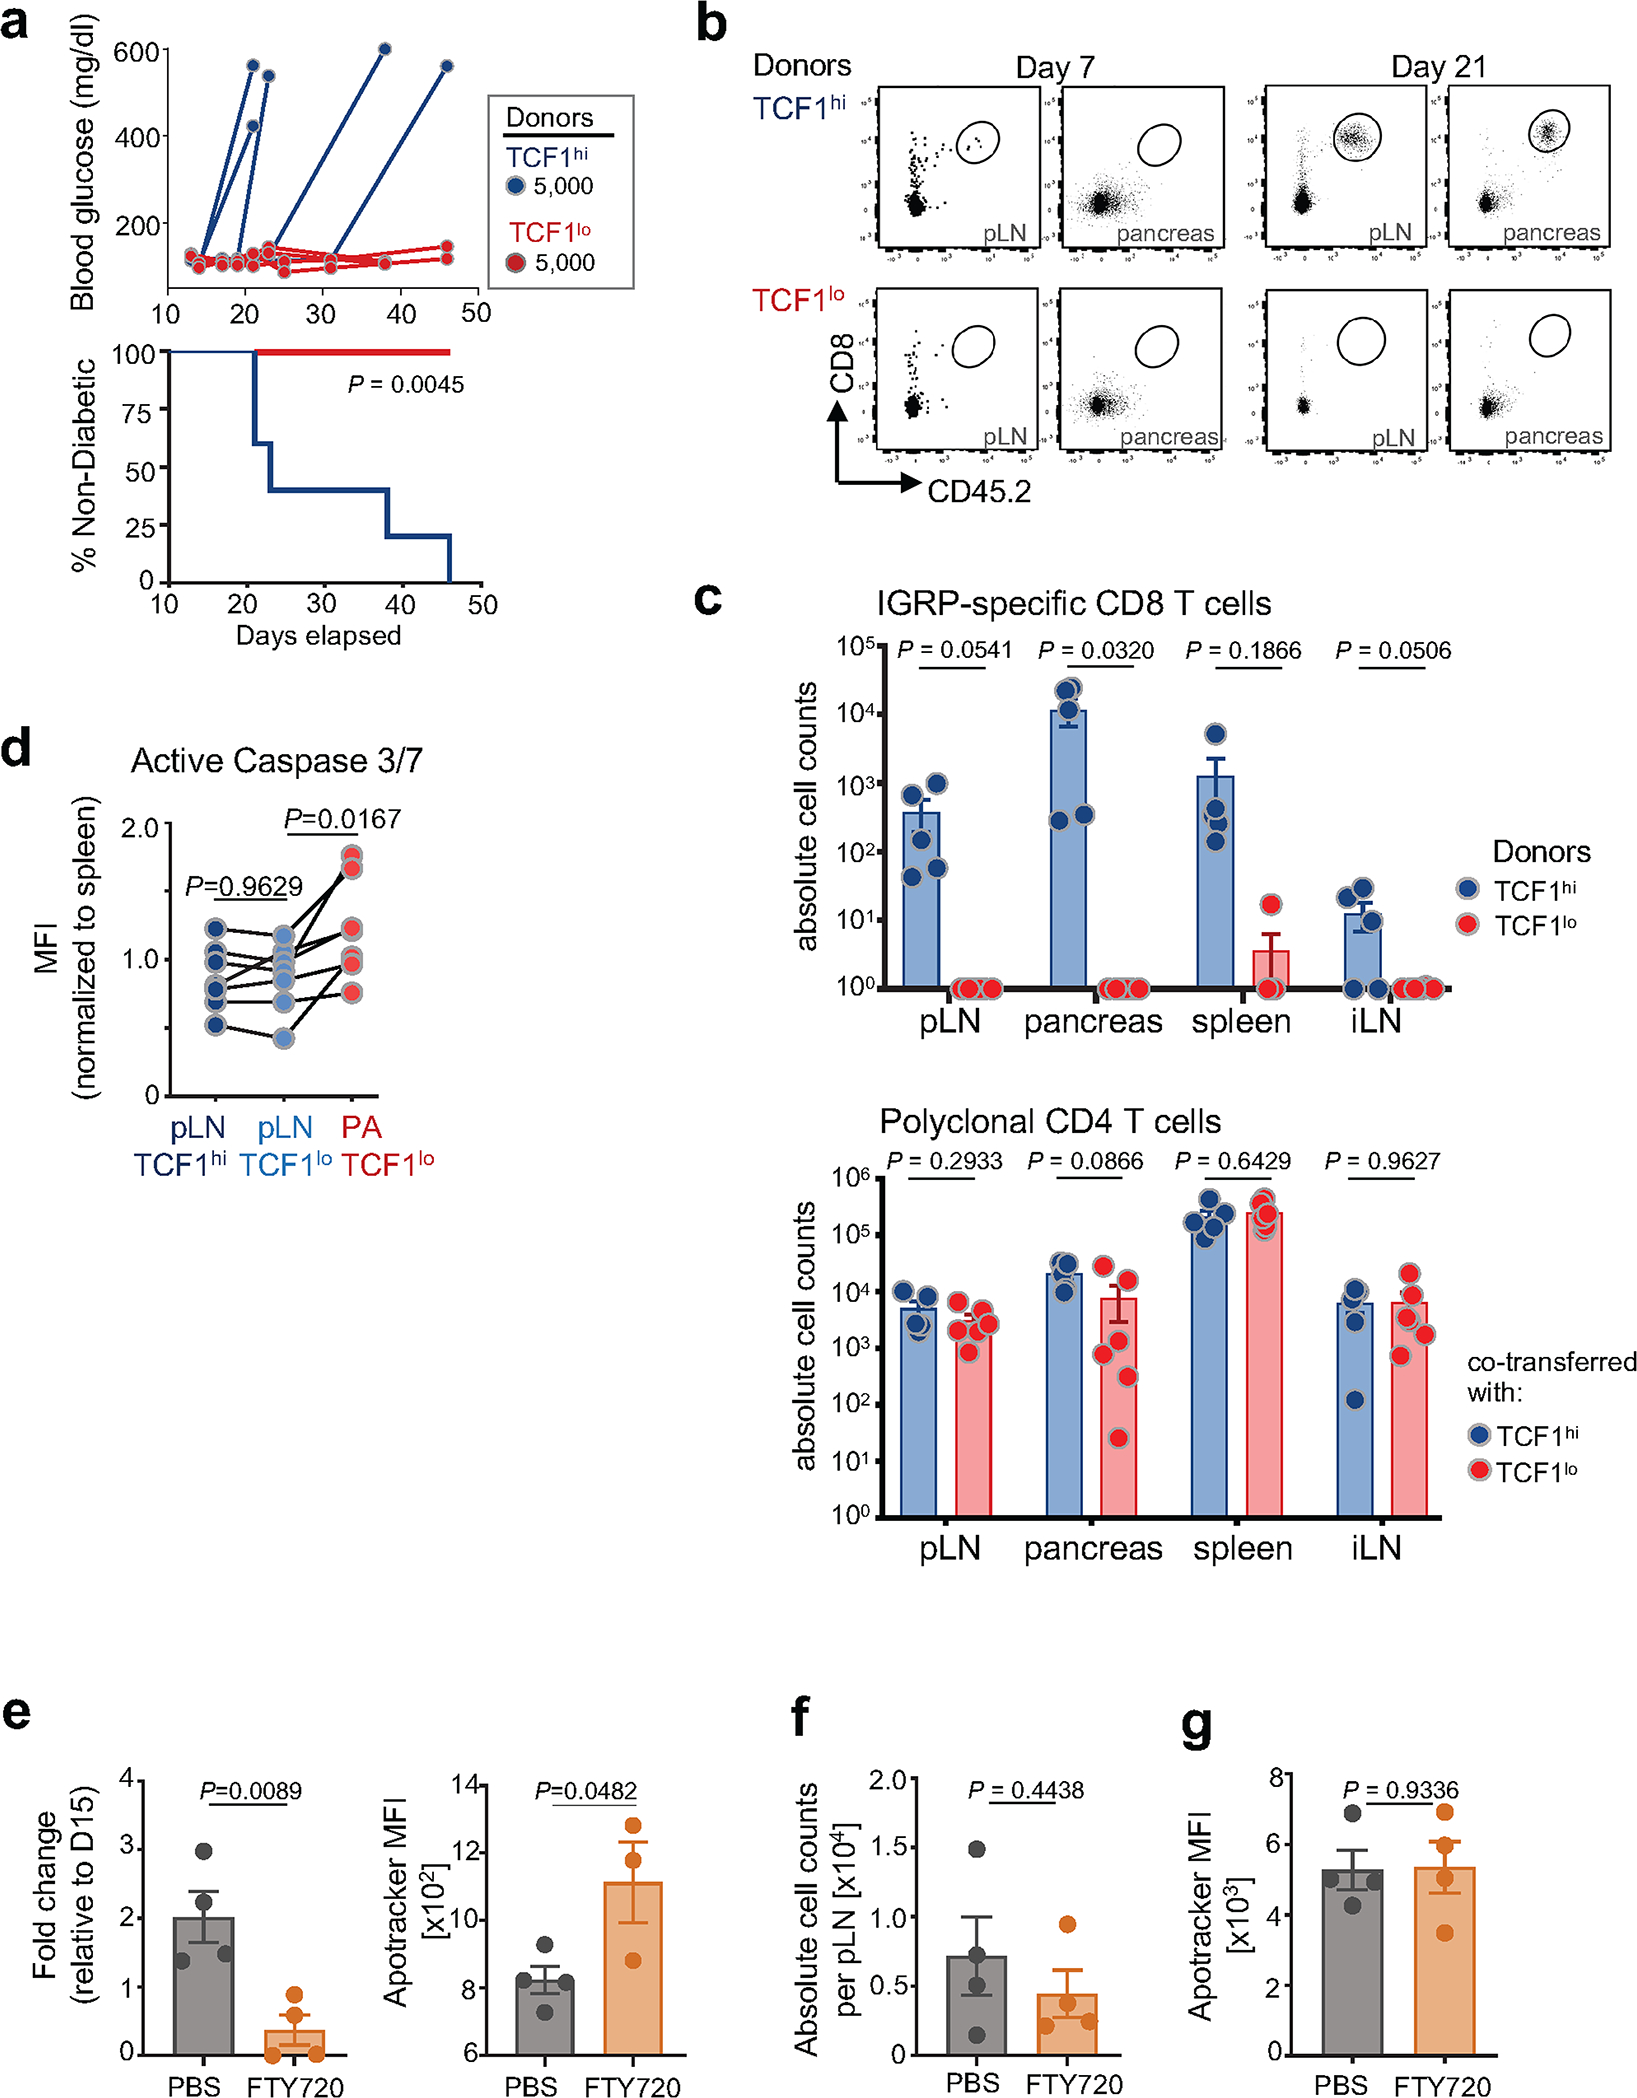
a–c, 5,000 pLN TCF1hi or 5,000 pancreatic TCF1lo 8.3 CD45.2+ CD8 T cells (isolated from 1st NOD Scid hosts) were transferred to 2nd NOD Scid hosts. a, Top, blood glucose curve of 2nd NOD Scid hosts receiving 5,000 pLN TCF1hi (blue, n = 5) or pancreatic TCF1lo (red, n = 4) 8.3 CD8 T cells. Each line represents an individual mouse. Bottom, percentage of non-diabetic mice over time in indicated cohorts. Statistical testing conducted via two-sided log-rank (Mantel-Cox) test. Representative of at least three independent experiments with n = 3–6 mice per group; mice were monitored for 50 days post transfer. b, FACS plots show donor TCF1hi or TCF1lo 8.3 found in pLN and pancreas 7 days (TCF1hi, n = 2; TCF1lo, n = 3) and 19–21 days (TCF1hi, n = 5; TCF1lo, n = 6) post transfer into NOD Scid 2nd hosts. c, Absolute numbers of donor T cells recovered in indicated tissues of 2nd NOD Scid hosts 19–21 days post transfer. Top, recovery of 5,000 8.3 TCF1hi (blue) or TCF1lo (red) donor CD8 T cells. Bottom, recovery of 1×10⁶ polyclonal CD4 T cells co-transferred with 5,000 TCF1hi or TCF1lo CD8 T cells. Total donor T cells per spleen, pair of pLN or inguinal LN (iLN), or per 100mg pancreas. Data are mean ± SEM. Statistical testing conducted via unpaired two-tailed Student’s t-test. d, Flow cytometric analysis of active caspases 3 and 7 in IGRP-specific CD8+ T cells isolated from pLN and pancreas. Shown is mean fluorescence intensity (MFI) normalized to MFI of naïve splenocytes. Each symbol represents an individual mouse, lines indicate populations from the same mouse. Pooled data from 2 independent experiments, n = 7 total. Statistical testing conducted by paired Student’s two-tailed t-test. e–g (related to Fig. 3f–h), analysis at day 31 post FTY720 treatment. e, number of 8.3 cells per 100mg pancreas relative to the average number of cells per 100mg pancreas at day 15 (left); flow cytometric analysis of apoptosis using apotracker detection reagent (see Methods) (PBS, n=4; FTY720, n = 3) (right); f, Absolute cell counts per pLN. g, Flow cytometric analysis of apoptosis of 8.3 donor T cells in spleens using apotracker detection reagent. f and g, n = 4 per group. Representative of 1 (e, g) or 2 (f) independent experiments. Each symbol represents an individual mouse. Statistical testing was conducted by unpaired two-tailed Student’s t-tests. Data are mean ± SEM.
Extended Data Fig. 7 |. Stem-like functionality of pLN TCF1hi CD8 T cells and generation of differentiated TCF1lo CD8 T cells are independent of lymphopenic conditions.
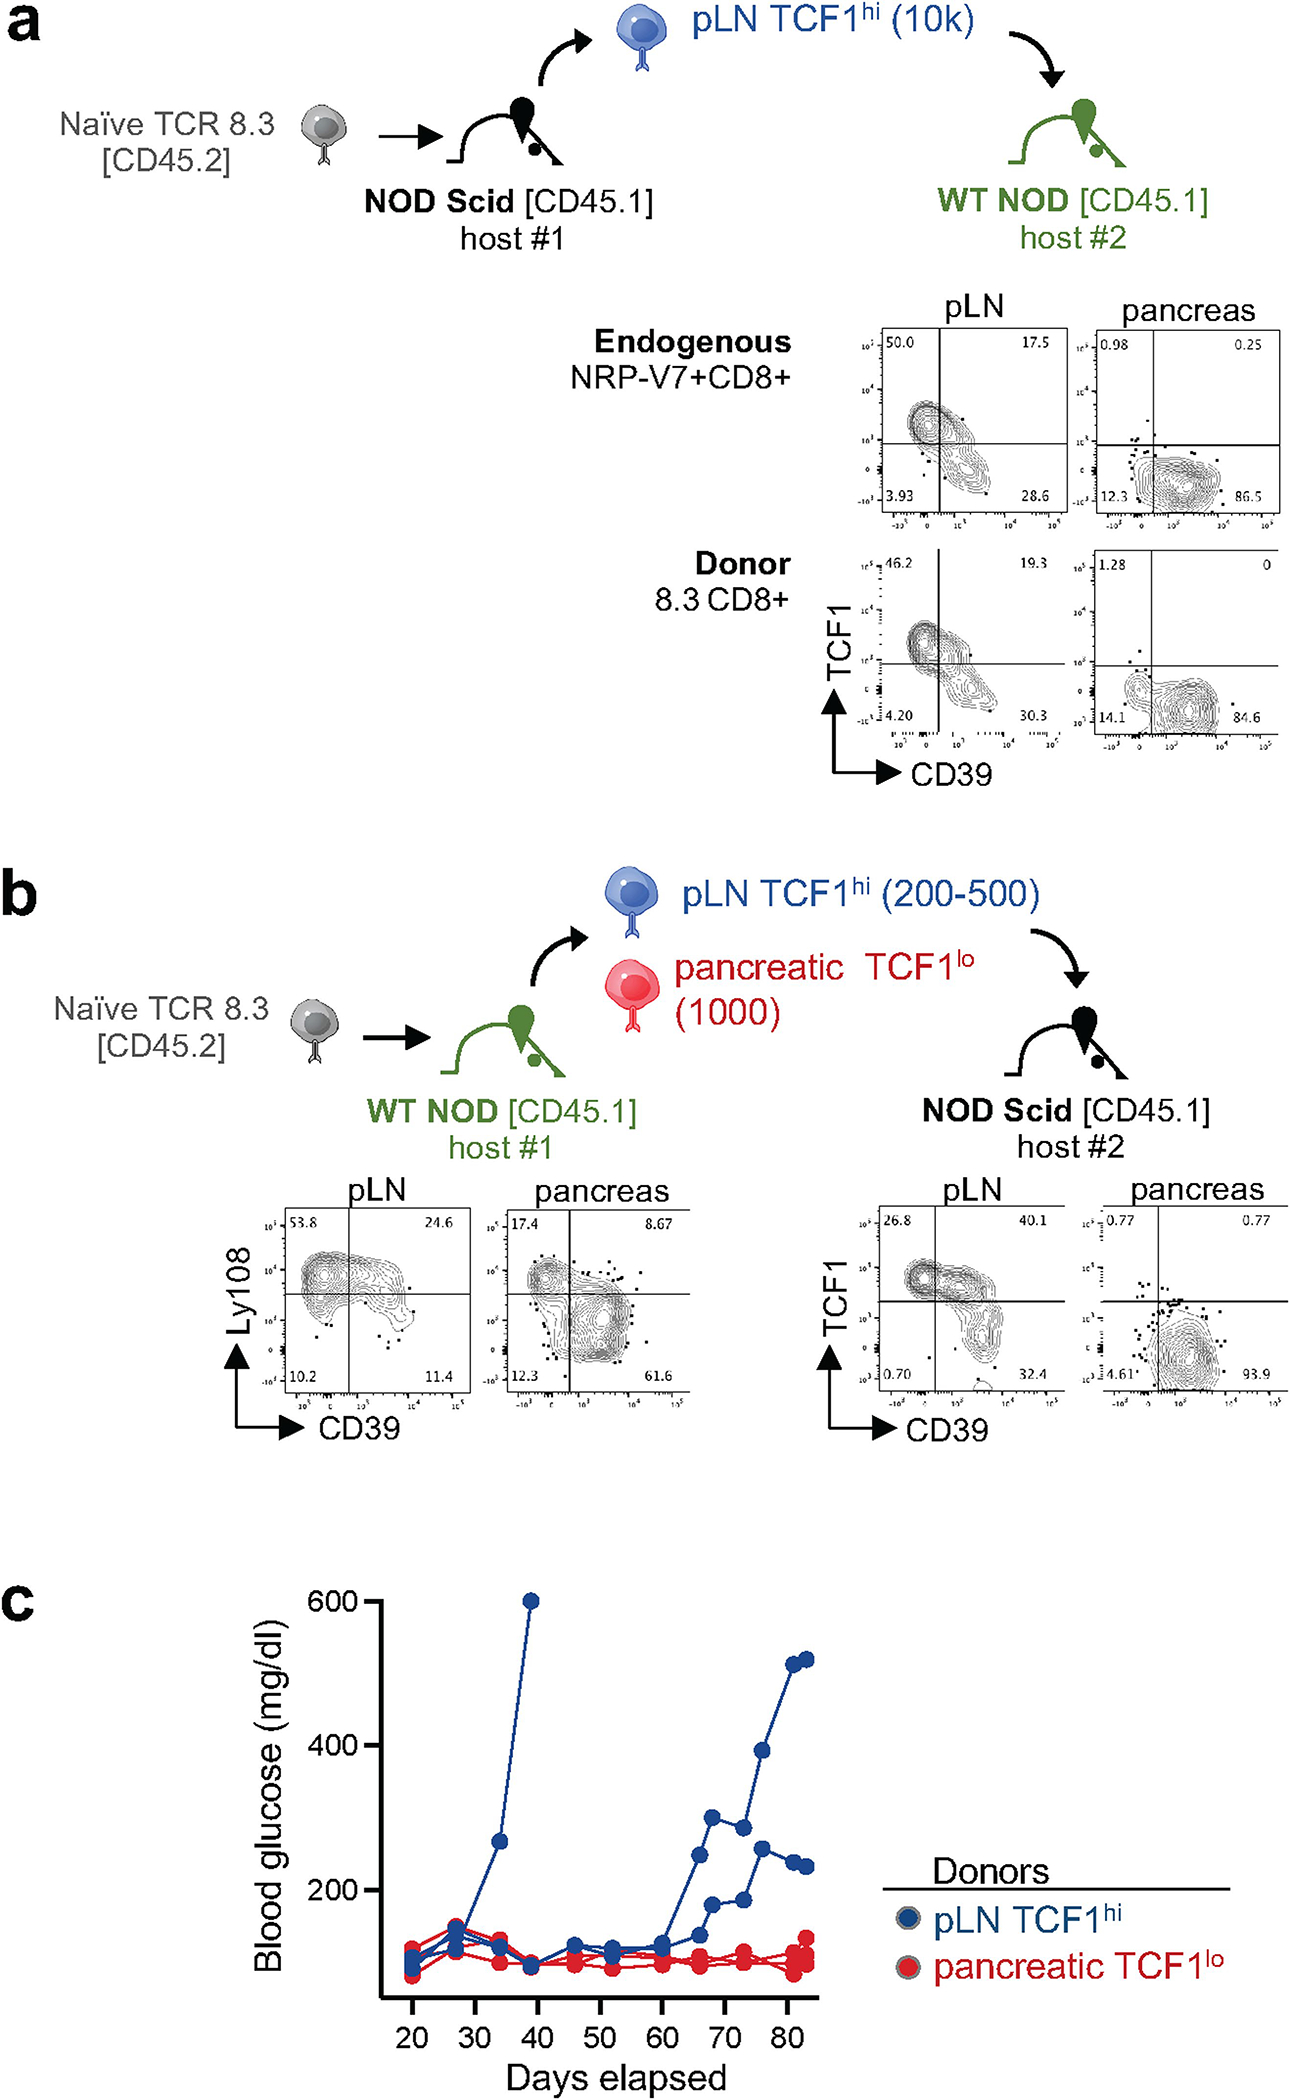
a, Top, experimental scheme of 8.3 adoptive T cell transfer into NOD Scid (1st host) and wild-type (WT) NOD hosts (2nd host). Bottom, TCF1 and CD39 expression profiles of endogenous NRP-V7 tet+ CD8+ T cells (top) or transferred donor pLN TCF1hi 8.3 CD8+ T cells (bottom) isolated from pLN and pancreas from same WT NOD 2nd hosts 35 days post transfer. Flow plots are representative of n=6 mice. b, Top, experimental scheme of 8.3 adoptive T cell transfer into WT NOD (1st host) and NOD Scid hosts (2nd host). Bottom, Ly108 and CD39 expression profiles of donor 8.3 CD8 T cells in WT NOD 1st hosts isolated from pLN and pancreas 29 days post transfer. Representative of 3 independent experiments with n = 10–15 NOD 1st hosts, n = 5–10 pLN pooled for sort. Right, TCF1 and CD39 expression profiles of donor pLN TCF1hi cells isolated from pLN and pancreas of NOD Scid 2nd hosts 41 days post transfer. Representative of 2 independent experiments with n = 3 mice per group. c, Blood glucose curves of NOD Scid 2nd hosts receiving 200–500 pLN TCF1hi (blue) or 1,000 pancreatic TCF1lo (red) 8.3 CD8 T cells. Each line represents an individual mouse. Representative of 2 independent experiments with n = 3 mice per group.
Extended Data Fig. 8 |. Single cell (sc) RNA-seq of pLN IGRP-specific (NRP-V7+) CD8 T cells reveals intermediate cell states during differentiation of pLN TCF1hi to pLN TCF1lo cells.
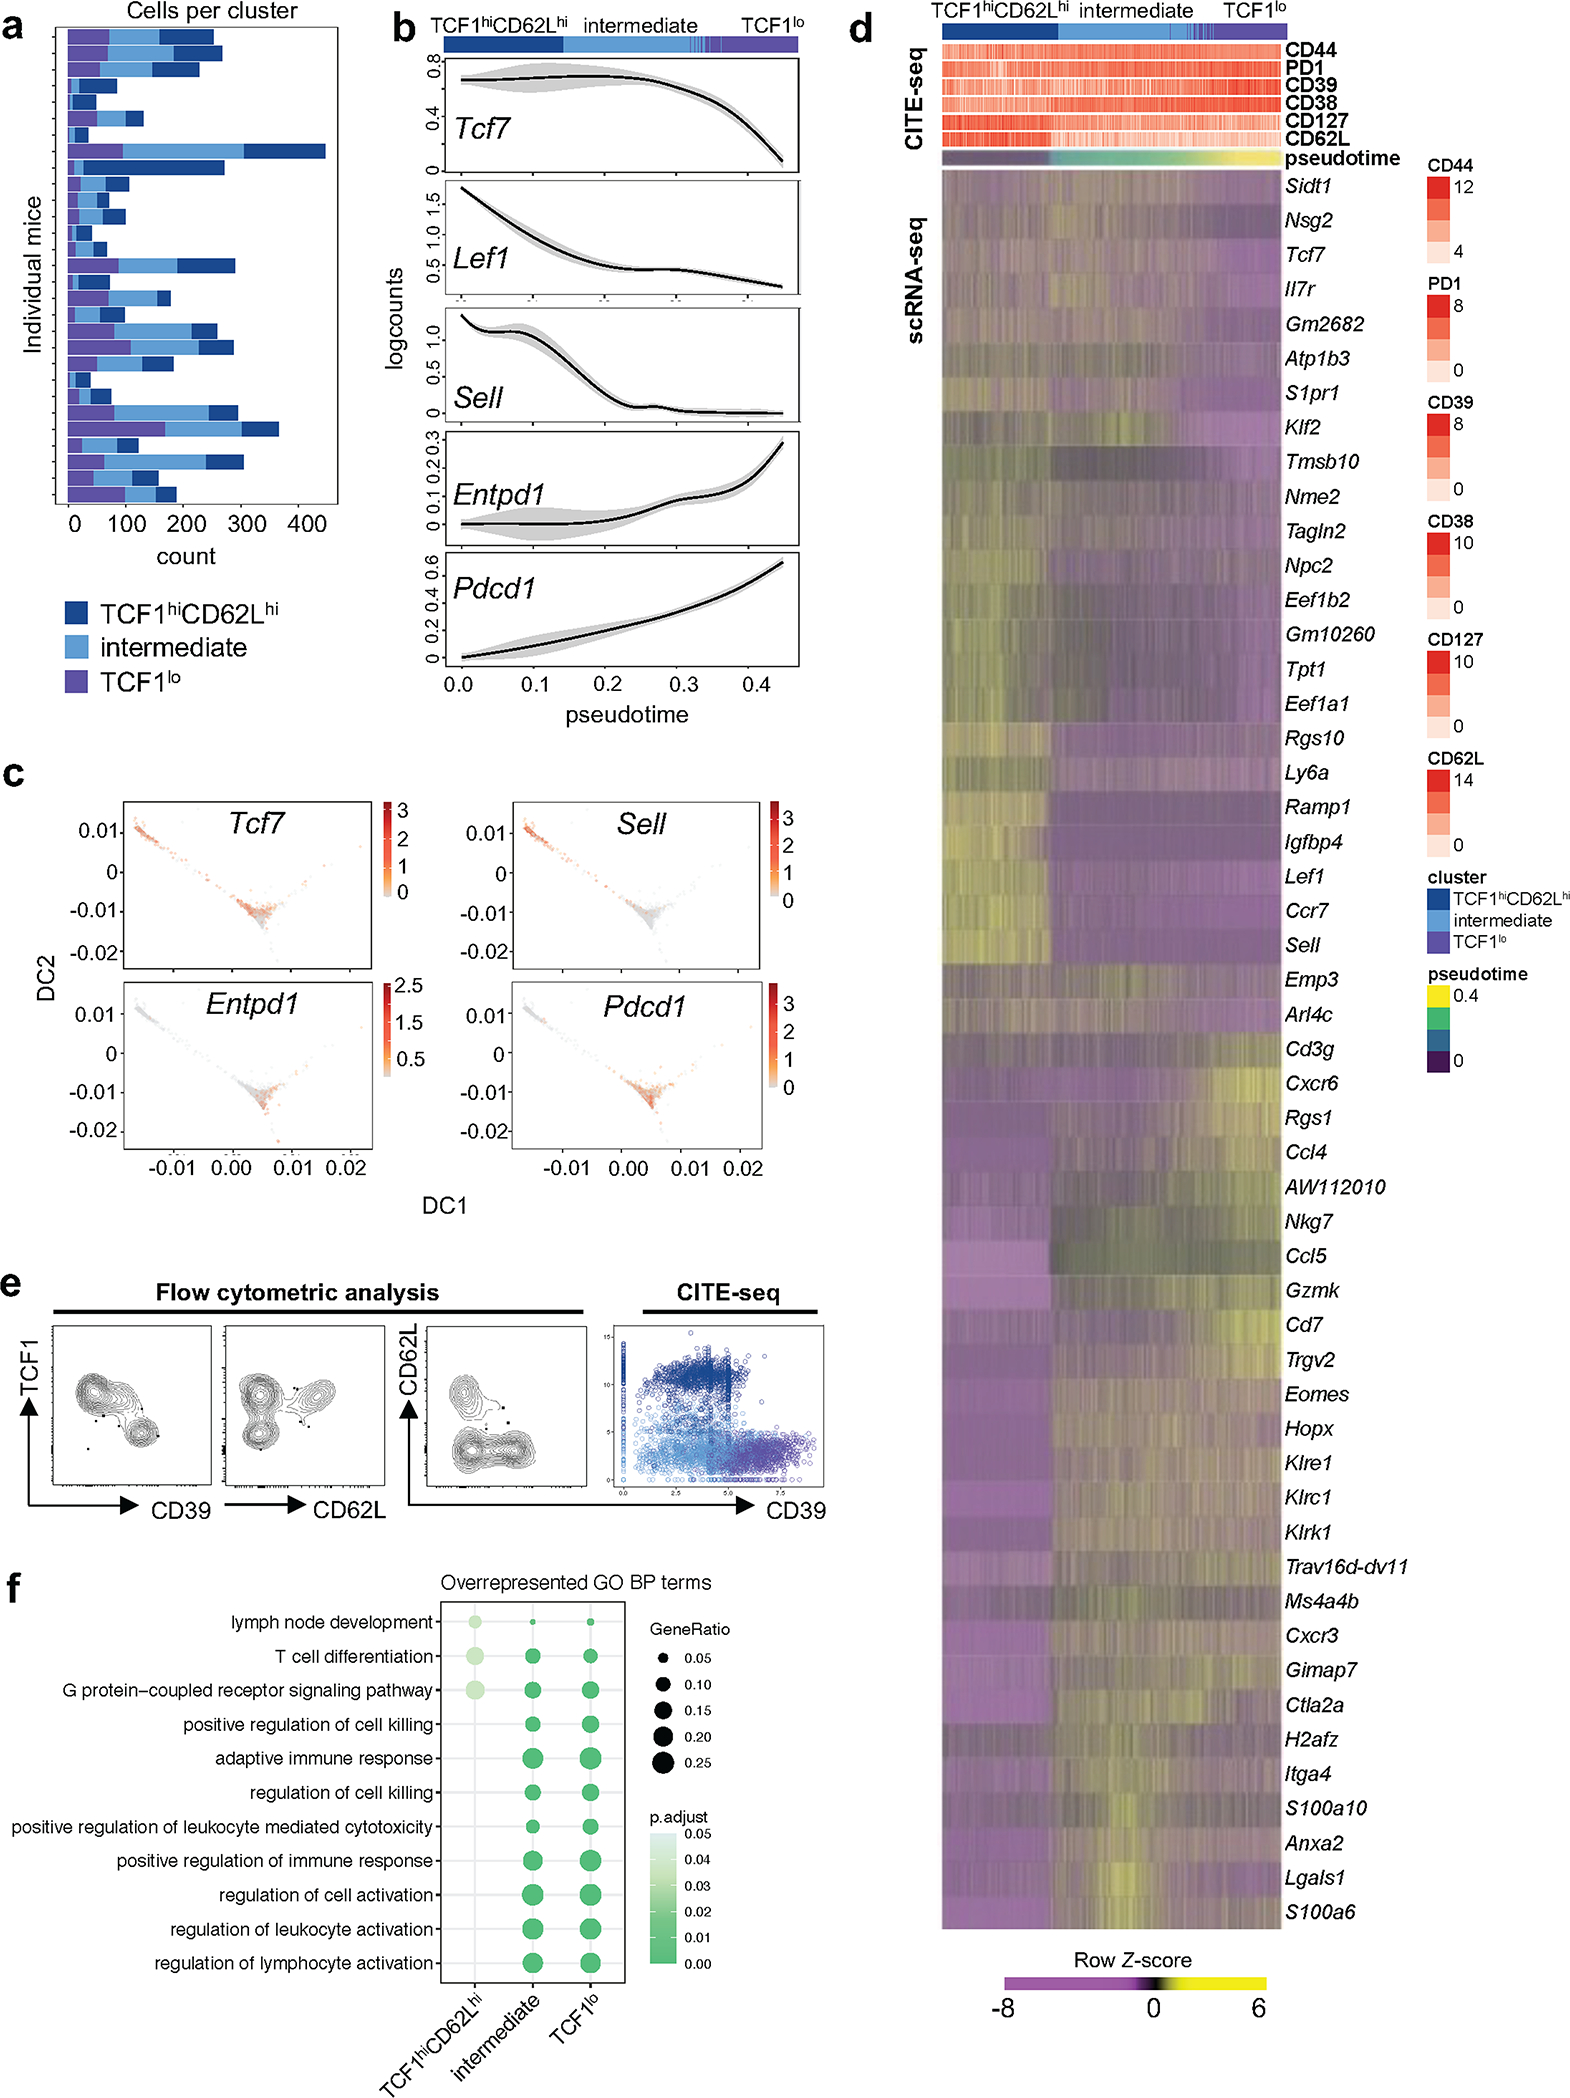
a, Numbers of T cells in each cluster classified as TCF1hiCD62Lhi, TCF1lo, and intermediate cells in pLN based on scRNA-seq data in individual mice (n=29). b, Smoothed conditional means of expression of selected genes across individual cells ordered by pseudotime; gray shading indicates 95% confidence interval and the bar on top represents the cluster color code. c, Diffusion maps colored by normalized expression values of individual genes. d, Heatmap of pLN scRNA-seq expression (row-based z-score of normalized log counts) for cluster marker genes (false discovery rate (FDR) < 5%). Cells were ordered based on pseudotime. Red bars on top indicate normalized protein expression values as determined by CITE-seq. e, Left, Expression profiles of TCF1, CD62L, and CD39 in pLN IGRP-specific CD8 T cells by flow cytometric analysis; Right, expression of CD62L and CD39 via CITE-seq antibody-derived tags. f, Overrepresented Gene Ontology Biological Process terms based on the marker genes of each cluster.
Extended Data Fig. 9 |. scTCR-Seq and genetic barcoding experiments reveal derivation of IGRP-specific pancreatic T cells from pLN TCF1hi population.
a, Alluvial plots tracking the size of non shared (yellow) and shared clonotypes in pLN TCF1hi, pLN TCF1lo, and pancreas (PA) populations from n = 21 mice. Each non-yellow stratum represents a clonotype that is found across multiple populations. b, Number of pancreatic T cells from individual mice that contain clonotypes that were either found in pLN TCF1hi (red) or not found in pLN TCF1hi (orange) population. Each row represents one individual mouse. c, Number of clonotypes across all mice that are shared with at least one other population (blue) or non-shared (yellow) in pLN TCF1hi and pLN TCF1lo populations. d, Fraction of clonotypes in pLN TCF1hi and pLN TCF1lo populations from individual mice that are shared with at least one other population (blue) or non-shared (yellow). Each row represents one mouse. e, Bar plot (top) and Venn diagram (bottom) displaying the different populations from which a given clonotype was recovered. The numbers are based on all clonotypes from all mice for which paired information from pLN and pancreas was available. f, Top, pie charts represent number of cells in each population containing clonotypes from pLN TCF1hi that are shared with at least one other population (n = 127 clonotypes, identified in Extended Data Fig. 9c). Bottom, median number of cells per clonotype in each population split by shared and non shared clonotypes. Each dot represents the cell count from a single mouse. For box plots, center indicates median, lower and upper hinges indicate 25th and 75th percentiles, respectively, and whiskers extend up to 1.5×IQR (interquartile range) from the smallest/highest values; points shown individually fall outside that range. Notches extend 1.58×IQR/sqrt(n), roughly indicating 95% confidence interval for comparing medians. g, Cells from one example shared clonotype are shown within the coordinates of the scRNA-seq based diffusion map. Individual cells are colored according to their cluster membership. h, Left, Alluvial plots from genetic barcoding experiment show barcodes detected in pLN TCF1hi 8.3 and pancreatic 8.3 for n = 2 mice; Right, Venn diagrams show numbers of barcodes detected in pLN TCF1hi 8.3 (to achieve 99% barcode coverage) and expanded in pancreas (>1% of barcodes detected).
Extended Data Fig. 10 |. Autoimmune NOD pLN IGRP-specific CD8 T cells in T1D are distinct from CD8 T cells generated during acute and chronic infections.
scRNA-seq datasets from pLN NRP-V7+ CD8 T cells (Fig. 4) were compared to scRNA-seq datasets of memory precursor effector cells (MPEC) and central memory CD8 T cells (TCM) generated during acute LCMV infection (day 7 and day 129 respectively), as well as to progenitor exhausted CD8 T cells (TPEX) from day 7 during chronic (clone 13) LCMV infection. a, Principal component analysis (PCA) of pseudo-bulk RNA-seq samples representing TCF1hiCD62Lhi, TCF1hiCD62Llo (intermediate), and TCF1loCD62Llo NOD pLN NRP-V7+ CD8 T cells from 3 technical replicates from Gearty et al (Fig. 4; T1D), TCM cells from Schauder et al (PNAS 2021; GSE130130; acute LCMV, day 129) and MPEC as well as TPEX as defined by Yao et al (Nat. Immunology, 2019; GSE119943; acute and chronic LCMV, day 7). The bar charts to the left and on the bottom of the PCA plot represent the genes that are most strongly (anti)correlated with a given principal component (PC). b, Dendrogram representing the results of hierarchical clustering based on the pseudo-bulk RNA-seq samples. c, Heatmap displaying row-normalized expression values of individual cells for genes identified as marker genes when comparing the single cells of the different populations (TCF1hiCD62Lhi, intermediate, and TCF1lo, MPEC, TPEX, TCM) to each other. d, Top, GO terms (biological processes) that are enriched based on genes that are specifically overexpressed in the different populations compared to all others. Bottom, the network-like representations display the genes (small circles) that belong to the respective GO terms (large circles), highlighting genes shared among individual GO terms and upregulated in indicated cell populations.
Supplementary Material
Acknowledgements
We thank the members of the Schietinger laboratory, M. Li (MSKCC) and S. Reiner (Columbia University) for helpful discussions; K. Herold (Yale University) for reviewing data and discussion; H. Appleby and E. Bruno for technical support; S. Miakicheva for help with experiments; the MSKCC Flow Cytometry Core, especially R. Gardner; the Integrated Genomics Operation Core, especially A. Farina; M. Philip (Vanderbilt University) for critical feedback on the manuscript; and S. Monette (Tri-Institutional Laboratory of Comparative Pathology, MSKCC) for pathological evaluation of insulitis. This work was supported by the following funding sources: Medical Scientist Training Programme grant NIH T32GM007739 to the Weill Cornell/Rockefeller/Sloan Kettering Tri-Institutional MD-PhD Program (S.V.G.), NIH NIDDK F30DK122691 (S.V.G.), NIH NCI DP2CA225212 (A.S.), Lloyd Old STAR Award of the Cancer Research Institute (A.S.), Josie Robertson Foundation (A.S), the MSKCC Core Grant P30CA008748, Weill Cornell Medicine Core Laboratories Center (P.Z., F.D. and D.B.), NIH NIAID R01AI123730 (T.P.D.). F.J.S.-R. was partially supported by the MSKCC TROT programme (5T32CA160001), a GMTEC Postdoctoral Researcher Innovation Grant and is a HHMI Hanna Gray Fellow. The MSKCC Integrated Genomics Operation Core was supported by Cycle for Survival and the Marie-Josée and Henry R. Kravis Center for Molecular Oncology.
Footnotes
Competing interests The authors declare no competing interests.
Additional information
Supplementary information The online version contains supplementary material available at https://doi.org/10.1038/s41586-021-04248-x.
References
- 1.Bluestone JA, Bour-Jordan H, Cheng M & Anderson M T cells in the control of organ-specific autoimmunity. J. Clin. Invest. 125, 2250–2260 (2015). [DOI] [PMC free article] [PubMed] [Google Scholar]
- 2.Kaech SM & Cui W Transcriptional control of effector and memory CD8+ T cell differentiation. Nat. Rev. Immunol. 12, 749–761 (2012). [DOI] [PMC free article] [PubMed] [Google Scholar]
- 3.Philip M & Schietinger A CD8+ T cell differentiation and dysfunction in cancer. Nat. Rev. Immunol. 10.1038/s41577-021-00574-3 (2021). [DOI] [PMC free article] [PubMed] [Google Scholar]
- 4.Bluestone JA, Herold K & Eisenbarth G Genetics, pathogenesis and clinical interventions in type 1 diabetes. Nature 464, 1293–1300 (2010). [DOI] [PMC free article] [PubMed] [Google Scholar]
- 5.Herold KC, Vignali DA, Cooke A & Bluestone JA Type 1 diabetes: translating mechanistic observations into effective clinical outcomes. Nat. Rev. Immunol. 13, 243–256 (2013). [DOI] [PMC free article] [PubMed] [Google Scholar]
- 6.Anderson MS & Bluestone JA The NOD mouse: a model of immune dysregulation. Annu. Rev. Immunol. 23, 447–485 (2005). [DOI] [PubMed] [Google Scholar]
- 7.Unanue ER Antigen presentation in the autoimmune diabetes of the NOD mouse. Annu. Rev. Immunol. 32, 579–608 (2014). [DOI] [PubMed] [Google Scholar]
- 8.Tsai S, Shameli A & Santamaria P CD8+ T cells in type 1 diabetes. Adv. Immunol. 100, 79–124 (2008). [DOI] [PubMed] [Google Scholar]
- 9.Zakharov PN, Hu H, Wan X & Unanue ER Single-cell RNA sequencing of murine islets shows high cellular complexity at all stages of autoimmune diabetes. J. Exp. Med. 217, e20192362 (2020). [DOI] [PMC free article] [PubMed] [Google Scholar]
- 10.Coppieters KT et al. Demonstration of islet-autoreactive CD8 T cells in insulitic lesions from recent onset and long-term type 1 diabetes patients. J. Exp. Med. 209, 51–60 (2012). [DOI] [PMC free article] [PubMed] [Google Scholar]
- 11.Ferris ST et al. A minor subset of Batf3-dependent antigen-presenting cells in islets of Langerhans is essential for the development of autoimmune diabetes. Immunity 41, 657–669 (2014). [DOI] [PMC free article] [PubMed] [Google Scholar]
- 12.Lieberman SM et al. Identification of the beta cell antigen targeted by a prevalent population of pathogenic CD8+ T cells in autoimmune diabetes. Proc. Natl Acad. Sci. USA 100, 8384–8388 (2003). [DOI] [PMC free article] [PubMed] [Google Scholar]
- 13.Escobar G, Mangani D & Anderson AC T cell factor 1: a master regulator of the T cell response in disease. Sci Immunol 5, eabb9726 (2020). [DOI] [PMC free article] [PubMed] [Google Scholar]
- 14.van Loosdregt J & Coffer PJ The role of WNT signaling in mature T cells: T cell factor is coming home. J. Immunol. 201, 2193–2200 (2018). [DOI] [PubMed] [Google Scholar]
- 15.Reya T et al. A role for Wnt signalling in self-renewal of haematopoietic stem cells. Nature 423, 409–414 (2003). [DOI] [PubMed] [Google Scholar]
- 16.Weissman IL, Anderson DJ & Gage F Stem and progenitor cells: origins, phenotypes, lineage commitments, and transdifferentiations. Annu. Rev. Cell Dev. Biol. 17, 387–403 (2001). [DOI] [PubMed] [Google Scholar]
- 17.Christianson SW, Shultz LD & Leiter EH Adoptive transfer of diabetes into immunodeficient NOD-scid/scid mice. Relative contributions of CD4+ and CD8+ T-cells from diabetic versus prediabetic NOD.NON-Thy-1a donors. Diabetes 42, 44–55 (1993). [DOI] [PubMed] [Google Scholar]
- 18.Verdaguer J et al. Spontaneous autoimmune diabetes in monoclonal T cell nonobese diabetic mice. J. Exp. Med. 186, 1663–1676 (1997). [DOI] [PMC free article] [PubMed] [Google Scholar]
- 19.Graef P et al. Serial transfer of single-cell-derived immunocompetence reveals stemness of CD8+ central memory T cells. Immunity 41, 116–126 (2014). [DOI] [PubMed] [Google Scholar]
- 20.Lapidot T et al. A cell initiating human acute myeloid leukaemia after transplantation into SCID mice. Nature 367, 645–648 (1994). [DOI] [PubMed] [Google Scholar]
- 21.Maki T, Gottschalk R, Ogawa N & Monaco AP Prevention and cure of autoimmune diabetes in nonobese diabetic mice by continuous administration of FTY720. Transplantation 79, 1051–1055 (2005). [DOI] [PubMed] [Google Scholar]
- 22.Brinkmann V et al. Fingolimod (FTY720): discovery and development of an oral drug to treat multiple sclerosis. Nat. Rev. Drug Discov. 9, 883–897 (2010). [DOI] [PubMed] [Google Scholar]
- 23.Ehlers MR & Rigby MR Targeting memory T cells in type 1 diabetes. Curr. Diab. Rep. 15, 84 (2015). [DOI] [PubMed] [Google Scholar]
- 24.Yao C et al. Single-cell RNA-seq reveals TOX as a key regulator of CD8+ T cell persistence in chronic infection. Nat. Immunol. 20, 890–901 (2019). [DOI] [PMC free article] [PubMed] [Google Scholar]
- 25.Schauder DM et al. E2A-regulated epigenetic landscape promotes memory CD8 T cell differentiation. Proc. Natl Acad. Sci. USA 118, e2013452118 (2021). [DOI] [PMC free article] [PubMed] [Google Scholar]
- 26.Abdelsamed HA et al. Beta cell-specific CD8+ T cells maintain stem cell memory-associated epigenetic programs during type 1 diabetes. Nat. Immunol.21, 578–587 (2020). [DOI] [PMC free article] [PubMed] [Google Scholar]
- 27.Culina S et al. Islet-reactive CD8+ T cell frequencies in the pancreas, but not in blood, distinguish type 1 diabetic patients from healthy donors. Sci Immunol 3, eaao4013 (2018). [DOI] [PMC free article] [PubMed] [Google Scholar]
- 28.Pelletier D & Hafler DA Fingolimod for multiple sclerosis. N. Engl. J. Med. 366, 339–347 (2012). [DOI] [PubMed] [Google Scholar]
- 29.Herold KC et al. An anti-CD3 antibody, teplizumab, in relatives at risk for type 1 diabetes. N. Engl. J. Med. 381, 603–613 (2019). [DOI] [PMC free article] [PubMed] [Google Scholar]
- 30.Sims EK et al. Teplizumab improves and stabilizes beta cell function in antibody-positive high-risk individuals. Sci. Transl. Med. 13, eabc8980 (2021). [DOI] [PMC free article] [PubMed] [Google Scholar]
- 31.Magnuson AM et al. Population dynamics of islet-infiltrating cells in autoimmune diabetes. Proc. Natl Acad. Sci. USA 112, 1511–1516 (2015). [DOI] [PMC free article] [PubMed] [Google Scholar]
- 32.Thivolet C, Bendelac A, Bedossa P, Bach JF & Carnaud C CD8+ T cell homing to the pancreas in the nonobese diabetic mouse is CD4+ T cell-dependent. J. Immunol. 146, 85–88 (1991). [PubMed] [Google Scholar]
- 33.Sinnathamby G et al. Priming and activation of human ovarian and breast cancer-specific CD8+ T cells by polyvalent Listeria monocytogenes-based vaccines. J. Immunother. 32, 856–869 (2009). [DOI] [PubMed] [Google Scholar]
- 34.Chee J et al. Effector-memory T cells develop in islets and report islet pathology in type 1 diabetes. J. Immunol. 192, 572–580 (2014). [DOI] [PubMed] [Google Scholar]
- 35.Li DS, Yuan YH, Tu HJ, Liang QL & Dai LJ A protocol for islet isolation from mouse pancreas. Nat. Protoc. 4, 1649–1652 (2009). [DOI] [PubMed] [Google Scholar]
- 36.Dobin A et al. STAR: ultrafast universal RNA-seq aligner. Bioinformatics 29, 15–21 (2013). [DOI] [PMC free article] [PubMed] [Google Scholar]
- 37.Liao Y, Smyth GK & Shi W featureCounts: an efficient general purpose program for assigning sequence reads to genomic features. Bioinformatics 30, 923–930 (2014). [DOI] [PubMed] [Google Scholar]
- 38.Harrow J et al. GENCODE: the reference human genome annotation for the ENCODE project. Genome Res. 22, 1760–1774 (2012). [DOI] [PMC free article] [PubMed] [Google Scholar]
- 39.Love MI, Huber W & Anders S Moderated estimation of fold change and dispersion for RNA-seq data with DESeq2. Genome Biol. 15, 550 (2014). [DOI] [PMC free article] [PubMed] [Google Scholar]
- 40.Benjamini Y & Hochberg Y Controlling the false discovery rate: a practical and powerful approach to multiple testing. J. R. Stat. Soc. B 57, 289–300 (1995). [Google Scholar]
- 41.DEGreport: Report of DEG analysis (2020).
- 42.Sergushichev A An algorithm for fast preranked gene set enrichment analysis using cumulative statistic calculation. Preprint at 10.1101/060012 (2016). [DOI]
- 43.Yu G, Wang LG, Han Y & He QY clusterProfiler: an R package for comparing biological themes among gene clusters. OMICS 16, 284–287 (2012). [DOI] [PMC free article] [PubMed] [Google Scholar]
- 44.Amezquita RA et al. Orchestrating single-cell analysis with Bioconductor. Nat. Methods 17, 137–145 (2020). [DOI] [PMC free article] [PubMed] [Google Scholar]
- 45.McCarthy DJ, Campbell KR, Lun AT & Wills QF Scater: pre-processing, quality control, normalization and visualization of single-cell RNA-seq data in R. Bioinformatics 33, 1179–1186 (2017). [DOI] [PMC free article] [PubMed] [Google Scholar]
- 46.Kim HJ, Lin Y, Geddes TA, Yang JYH & Yang P CiteFuse enables multi-modal analysis of CITE-seq data. Bioinformatics 36, 4137–4143 (2020). [DOI] [PubMed] [Google Scholar]
- 47.Lun AT, Bach K & Marioni JC Pooling across cells to normalize single-cell RNA sequencing data with many zero counts. Genome Biol. 17, 75 (2016). [DOI] [PMC free article] [PubMed] [Google Scholar]
- 48.Haghverdi L, Lun ATL, Morgan MD & Marioni JC Batch effects in single-cell RNA-sequencing data are corrected by matching mutual nearest neighbors. Nat. Biotechnol. 36, 421–427 (2018). [DOI] [PMC free article] [PubMed] [Google Scholar]
- 49.Lun AT, McCarthy DJ & Marioni JC A step-by-step workflow for low-level analysis of single-cell RNA-seq data with Bioconductor. F1000Res 5, 2122 (2016). [DOI] [PMC free article] [PubMed] [Google Scholar]
- 50.Angerer P et al. destiny: diffusion maps for large-scale single-cell data in R. Bioinformatics 32, 1241–1243 (2016). [DOI] [PubMed] [Google Scholar]
- 51.Ji Z & Ji H TSCAN: Pseudo-time reconstruction and evaluation in single-cell RNA-seq analysis. Nucleic Acids Res. 44, e117 (2016). [DOI] [PMC free article] [PubMed] [Google Scholar]
- 52.Robinson MD & Oshlack A A scaling normalization method for differential expression analysis of RNA-seq data. Genome Biol. 11, R25 (2010). [DOI] [PMC free article] [PubMed] [Google Scholar]
- 53.Marini F & Binder H pcaExplorer: an R/Bioconductor package for interacting with RNA-seq principal components. BMC Bioinf. 20, 331 (2019). [DOI] [PMC free article] [PubMed] [Google Scholar]
- 54.Galili T dendextend: an R package for visualizing, adjusting and comparing trees of hierarchical clustering. Bioinformatics 31, 3718–3720 (2015). [DOI] [PMC free article] [PubMed] [Google Scholar]
- 55.Doench JG et al. Optimized sgRNA design to maximize activity and minimize off-target effects of CRISPR–Cas9. Nat. Biotechnol. 34, 184–191 (2016). [DOI] [PMC free article] [PubMed] [Google Scholar]
- 56.Mackay LK et al. Hobit and Blimp1 instruct a universal transcriptional program of tissue residency in lymphocytes. Science 352, 459–463 (2016). [DOI] [PubMed] [Google Scholar]
Associated Data
This section collects any data citations, data availability statements, or supplementary materials included in this article.
Supplementary Materials
Data Availability Statement
The RNA-seq data have been deposited in the Gene Expression Omnibus under accession GSE151652. Comparisons to publicly available published data used the following datasets: GSE11994324, GSE13013025 and GSE7081356. Additional information and materials will be made available upon request. Source data are provided with this paper.