Abstract
We used cross‐sectional and longitudinal studies to comprehensively compare hepatic steatosis measurements obtained with magnetic resonance imaging–proton density fat fraction (MRI‐PDFF) and controlled attenuated parameter (CAP) in hepatic steatosis in adults with nonalcoholic fatty liver disease (NAFLD). A total of 185 participants with NAFLD and 12 non‐NAFLD controls were recruited. CAP and MRI‐PDFF data were collected at baseline from all participants and from 95 patients included in the longitudinal study after 24 weeks of drug or placebo intervention. Pearson correlation, linear regression, and piecewise linear regression analyses were used to evaluate the relationship between the two modalities. Linear analysis suggested a positive correlation between CAP and MRI‐PDFF (r = 0.577, p < 0.0001); however, piecewise linear regression showed no correlation when CAP was ≥331 dB/m (p = 0.535). In the longitudinal study, both the absolute and relative change measurements were correlated between the two modalities; however, the correlation was stronger for the relative change (relative r = 0.598, absolute r = 0.492; p < 0.0001). Piecewise linear regression analysis revealed no correlation when CAP was reduced by more than 53 dB/m (p = 0.193). Conclusions: We found a correlation between CAP and MRI‐PDFF measurements for grading hepatic steatosis when CAP was <331 dB/m. While the measured absolute change and relative change were correlated, it was stronger for the relative change. These findings have implications for the clinical utility of CAP or MRI‐PDFF in the clinical diagnosis and assessment of NAFLD.
This study assessed the relationship between CAP and MRI‐PDFF using cross‐sectional and longitudinal studies, calculated the optimal CAP threshold for different grades of hepatic steatosis, and assessed the relationship between the two imaging modalities for the longitudinal evaluation of hepatic fat content change in Chinese individuals. The results of this study provide references for future clinical practice or trials that would like to use CAP to assess hepatic fat content or evaluate the therapeutic effect of intervention.
INTRODUCTION
Nonalcoholic fatty acid liver disease (NAFLD) is emerging as the leading chronic liver disease worldwide[ 1 , 2 ] and is estimated to be present in approximately 25% of the world population.[ 3 ] In addition, NAFLD morbidity has reached 29.2% in China, replacing viral hepatitis as the most frequent chronic liver disease.[ 4 ] There is currently a lack of clinically approved effective drugs for the treatment of nonalcoholic steatohepatitis; however, a large number of clinical trials are ongoing.
Liver biopsy is the current gold standard for accurately evaluating the degree of NAFLD. However, due to well‐known limitations, such as invasiveness, poor acceptability, sampling variability, high cost, and (albeit rare) potential to cause life‐threatening complications, the use of liver biopsy in clinical practice or trials is impractical. Considering the many patients with NAFLD worldwide and the growing number of clinical trials, it has become increasingly important to develop noninvasive imaging technology that can quickly and accurately diagnose NAFLD and assess hepatic steatosis. To meet this need, imaging methods, such as magnetic resonance imaging–proton density fat fraction (MRI‐PDFF) and controlled attenuated parameter (CAP) have emerged and have gradually become more commonly used for hepatic steatosis quantification. In MRI‐PDFF, the fat level in the whole liver, as measured using MR technology, is used as a biomarker. While the method has high accuracy, safety, and reproducibility,[ 5 , 6 ] the popularization of MRI‐PDFF in clinical practice has met with resistance due to the relatively high cost, time consumption, and complications with use. Conversely, CAP is a more widespread ultrasound‐based quantitative method for diagnosing liver steatosis,[ 7 ] and its advantages include simple operation, rapid examination, and low cost.[ 8 , 9 ] While CAP correlates significantly with liver histology,[ 6 , 9 , 10 ] it is not as accurate as MRI‐PDFF in evaluating hepatic steatosis.[ 6 , 10 ] Some clinical studies have calculated the optimal CAP threshold for diagnosing NAFLD by comparing CAP and MRI‐PDFF, thereby optimizing the diagnostic efficiency of CAP. Over the past few years, several different such thresholds have been used to diagnose and stage liver steatosis.[ 11 , 12 , 13 , 14 , 15 ] However, most of this research has focused on the cross‐sectional assessment of CAP and MRI‐PDFF, with only a few studies evaluating their correlation longitudinally, especially in the Chinese population.
This study aimed to comprehensively compare CAP and MRI‐PDFF with respect to their ability to determine hepatic steatosis grading and changes in adults with NAFLD through assessing the correlation between the two modalities in a cross‐sectional and longitudinal study. The results could provide a reference for the future rational application of CAP and MRI‐PDFF in China and Asia.
MATERIALS AND METHODS
Study design and participants
Participants were recruited at Shuguang Hospital (affiliated with Shanghai University of Traditional Chinese Medicine) from May 2018 to June 2021 (ChiCTR2000038111, ChiCTR‐IOR‐17013491). A non‐NAFLD control group (n = 12) was also included in this study to obtain more reliable thresholds. A total of 203 subjects were recruited, of which six subjects lacked CAP or MRI‐PDFF results, leading to 197 subjects being included in the cross‐sectional study. Some of these patients were also included in the longitudinal study. Until June 2021, 129 subjects had completed 24 weeks of drug or placebo intervention; 34 subjects who lacked CAP and MRI‐PDFF results at baseline or 24 weeks were excluded, and 95 subjects were included in the statistical analysis of the longitudinal data (Figure 1). Details about the participants' medical history and general conditions were collected. Additionally, fasting serologic examinations as well as CAP and MRI‐PDFF were performed. This study was approved by the institutional review board of Shuguang Hospital affiliated with Shanghai University of Traditional Chinese Medicine (approval no. 2017‐548‐31 and no. 2019‐759‐114‐01), and all subjects signed an informed consent document before participation.
FIGURE 1.
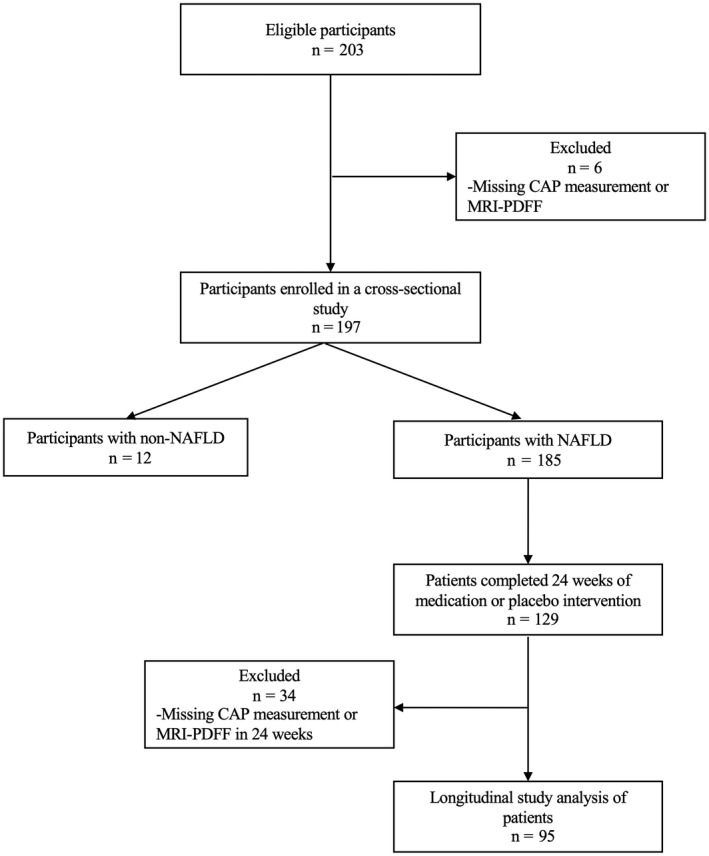
Derivation of the study cohort. Abbreviations: CAP, controlled attenuated parameter; MRI‐PDFF, magnetic resonance imaging–proton density fat fraction; NAFLD, nonalcoholic fatty liver disease
Inclusion and exclusion criteria
In the cross‐sectional study, we enrolled participants between the ages of 18 and 65 years who agreed to be examined. Patients in the longitudinal study were recruited from patients with NAFLD in the cross‐sectional study. These patients met the diagnostic criteria for NAFLD,[ 16 ] with alanine aminotransferase (ALT) levels higher than the normal upper limit (men, >50 IU/L; women, >40 IU/L) and ≤5 times the upper limit of normal.
The exclusion criteria were evidence of using liver‐protecting or enzyme‐lowering drugs in the past 3 months; evidence of alcoholic fatty liver disease (male alcohol intake >20 g/day, female alcohol intake >10 g/day); evidence of liver cirrhosis, hepatitis B, hepatitis C, other liver diseases, or autoimmune liver diseases; evidence of taking drugs that may cause fatty liver; evidence of gastrointestinal bariatric surgery in the past year; evidence of weight loss >10% after taking weight‐loss drugs in the past 3 months; pregnant women or lactating women; and evidence of lung, kidney, hematopoietic system and other primary diseases, malignant tumors, and other major diseases.
Clinical research evaluation
Detailed medical history and anthropometric examinations included age, sex, height, weight, body mass index (BMI), and vital signs, which were collected by a well‐trained clinical researcher. Recent medication history (1 month) was also collected. Serologic tests included ALT, aspartate aminotransferase (AST), gamma‐glutamyl transpeptidase (GGT), total bilirubin, direct bilirubin, indirect bilirubin, hemoglobin A1c (HbA1c), fasting blood glucose (FBG), insulin (INS), triglyceride (TG), total cholesterol, high‐density lipoprotein cholesterol, low‐density lipoprotein cholesterol, platelet count, uric acid (UA), and homeostasis model assessment of insulin resistance (HOMA‐IR). In addition, hepatitis B surface antigen and hepatitis C, anti‐nuclear, anti‐mitochondrial, and anti‐smooth muscle antibodies were checked to rule out other chronic liver diseases.
CAP measurement
Professionally trained clinical researchers (Z.A. and Q.L.) used the iLivTouch FT1000 (Hisky Med, China) to measure CAP. All patients lay supine, with their right arm behind their head and their legs straightened naturally. Intercostal spaces 7–9 were selected from the right anterior axillary line to the mid‐axillary line as the detection point. The CAP value with 10 successful measurements was selected as the effective value, and the median deviation was <30%. All subjects were evaluated using the M probe.
MRI‐PDFF for liver fat quantification
MRI‐PDFF was performed at baseline and at month 6 using a 3.0‐Tesla MRI scanner (MAGNETOM Skyra; Siemens Healthcare, Erlangen, Germany), using a dedicated 18‐channel matrix body coil in combination with a 32‐channel matrix spine coil. To obtain PDFF maps, data were acquired by using a three‐dimensional monopolar readout gradient volumetric interpolated breath‐hold examination sequence. A controlled aliasing in parallel imaging results in higher acceleration (CAIPIRINHA) parallel imaging technique was used to reduce acquisition time. Fatty liver was defined as MRI‐PDFF ≥5%.[ 1 , 17 ] PDFF values were measured using region of interest (ROI) methods. ROIs avoiding large blood vessels and cavities and ranging from 80 to 120 mm2 were independently placed by two radiologists (S.Y. and F.L., with at least 5 years of experience in hepatic MRI) in three slices of the liver, including the first and second hilar and gallbladder fossa levels (each slice four ROIs; Figure 2). Placement was based on our clinical experience and the work of Procter et al.[ 18 ] A total of 12 PDFF values derived from ROIs were measured and averaged in one participant by each radiologist.
FIGURE 2.
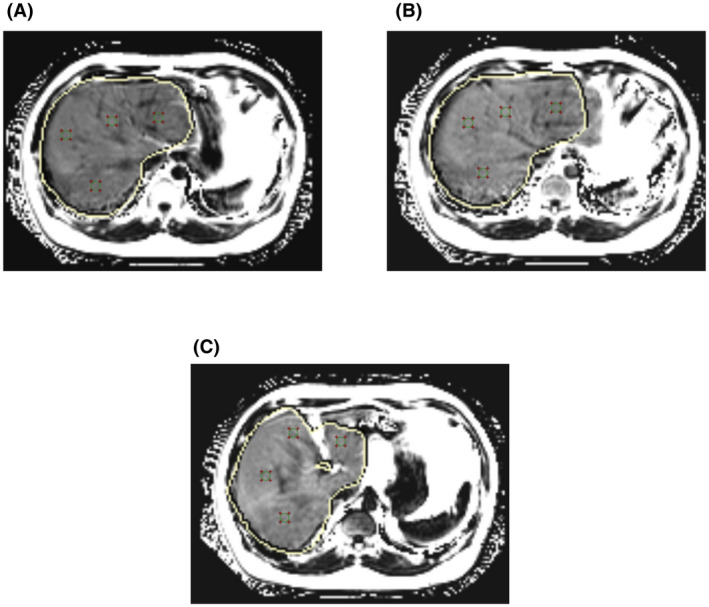
Representative MRI‐PDFF images of the liver of a 32‐year‐old man, with four regions of interest per slice. (A) First and (B) second hilar and (C) gallbladder fossa levels. All region of interest areas are 100 mm2
The interval between MRI‐PDFF and CAP examinations of all subjects was within 14 days. The image analysts were blinded to all clinical and biochemical data.
Statistical analysis
All statistical calculations were performed using SPSS version 26.0 (IBM, Chicago, IL). Demographic, laboratory, and imaging data were expressed as mean ± SD or median and interquartile range (IQR). Analysis of variance and the t test were performed on continuous variables of the normal distribution, and the Kruskal‐Wallis test was performed on the other continuous variables. A χ 2 or Fisher's exact test was performed on categorical variables. Pearson correlation analysis, linear regression, and piecewise linear regression analyses were used to evaluate the correlation between CAP and MRI‐PDFF at baseline. Receiver operating characteristic (ROC) curve analysis was used to evaluate the diagnostic value of CAP for detecting different hepatic steatosis when MRI‐PDFF was ≥5%, ≥10%, and ≥20%. For each ROC analysis, we calculated the area under the ROC curve (AUROC), the optimal threshold, and the following parameters: sensitivity, specificity, positive predictive value (PPV), and negative predictive value (NPV). The Youden index was used to determine the optimal threshold. By calculating the difference between baseline and 24 weeks, the absolute value change and relative change percentage of MRI‐PDFF and CAP were obtained. Pearson correlation analysis, linear regression analysis, and piecewise linear regression analysis were used to evaluate the relationship between the absolute value change of CAP and the absolute value change of MRI‐PDFF and the relationship between the relative change percentage of CAP and the relative change percentage of MRI‐PDFF. The kappa test was used to test the consistency of changes between CAP and MRI‐PDFF. Statistical significance was set at two‐tailed p < 0.05.
RESULTS
Cross‐sectional study
Study participants
A total of 203 subjects were screened in this study; 197 subjects were eventually included in the cross‐sectional study, of which 12 (8.5%) were non‐NAFLD controls. The majority of the subjects were men (n = 169, 85.8%). Mean (± SD) age and BMI were 38 (8.5) years and 28.8 (4.3) kg/m2, respectively. The medians (IQR) of CAP and MRI‐PDFF were 309 (36.5) dB/m and 15.9% (11.3%), respectively. Systolic blood pressure, BMI, waist circumference, ALT, AST, AST/ALT, GGT, FBG, INS, HOMA‐IR, HbA1c, TG, UA, and liver stiffness all showed significant group differences for MRI‐PDFF <5%, 5%–10%, 10%–20%, and ≥20% (p < 0.05; p < 0.01). Moreover, every index increased with increasing hepatic steatosis.
Correlation between CAP and MRI‐PDFF
To compare the assessment of hepatic steatosis between CAP and MRI‐PDFF, we analyzed the results of both at baseline, finding a moderately positive statistically significant association between MRI‐PDFF and CAP (r = 0.577, p < 0.0001; Figure 3A [MRI‐PDFF = CAP × 0.148–28.872]). Further segmented linear regression analysis showed that there was an obvious cut‐off point between CAP and MRI‐PDFF; no correlation was observed between CAP and MRI‐PDFF when CAP was ≥331 dB/m (p = 0.535; Figure 3B; Table S1), with the corresponding value of MRI‐PDFF being 21.4%. The distribution of CAP measurements across different categories of hepatic fat content assessed using MRI‐PDFF is illustrated in Table 1 and Figure 4. For MRI‐PDFF <5%, 5%–10%, 10%–20%, and ≥20%, the medians (IQR) of CAP were 248.5 (44) dB/m, 284.5 (27) dB/m, 312 (27.8) dB/m, and 321 (24.5) dB/m, respectively. All group differences were significant (p < 0.0001; Table 1). Differences between two groups (MRI‐PDFF <5% versus 5%≤ MRI‐PDFF <10%, 5%≤ MRI‐PDFF <10% versus 10%≤ MRI‐PDFF <20%, and 10%≤ MRI‐PDFF <20% versus MRI‐PDFF ≥20%) were also significant (p < 0.01; p < 0.0001; p < 0.05).
FIGURE 3.
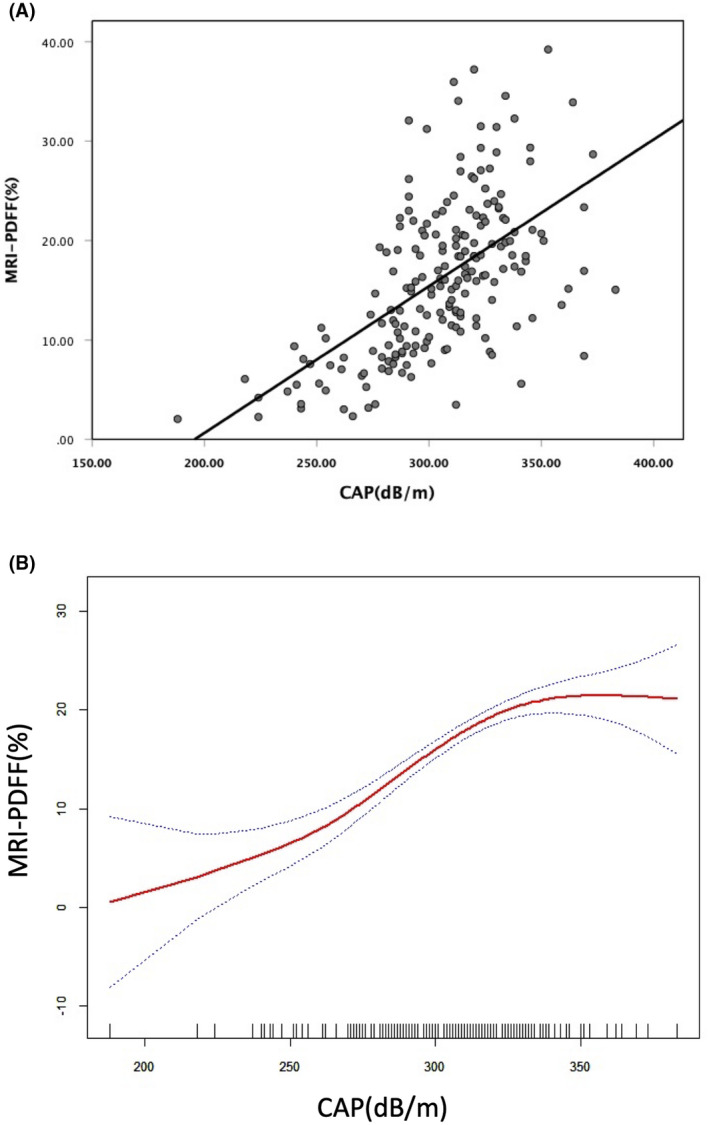
MRI‐PDFF was correlated with CAP to evaluate the liver fat content. The plots of both (A) linear regression analysis and (B) piecewise linear regression analysis were presented. Abbreviations: CAP, controlled attenuated parameter; MRI‐PDFF, magnetic resonance imaging–proton density fat fraction
TABLE 1.
Study characteristics stratified by liver fat
| Characteristics | Total patients (n = 197) | MRI‐PDFF <5% (n = 12) | 5%≤ MRI‐PDFF <10% (n = 38) | 10%≤ MRI‐PDFF <20% (n = 90) | MRI‐PDFF ≥20% (n = 57) | p value a |
|---|---|---|---|---|---|---|
| Demographics | ||||||
| Age, years; mean (SD) | 38 (8.5) | 41.7 (9.3) | 40.1 (9.1) | 37.6 (8.1) | 36.6 (8.1) | 0.157 |
| Male (%) | 169 (85.8) | 9 (75) | 32 (84.2) | 81 (90) | 47 (82.5) | 0.384 |
| SBP, mm Hg; median (IQR) | 124.7 (12) | 121.8 (22) | 122 (11.9) | 124.7 (10) | 127 (13) | 0.01 |
| DBP, mm Hg; median (IQR) | 82.9 (11) | 82.5 (15) | 82.5 (8) | 82.9 (12) | 85 (11) | 0.138 |
| BMI, kg/m2; mean (SD) | 28.8 (4.2) | 25.9 (3.0) | 26.9 (4.2) | 29.5 (4.3) | 29.6 (3.9) | <0.0001 |
| Waist circumference, cm; median (IQR) | 98.5 (12.8) | 89.5 (10.6) | 93.8 (11.2) | 99.2 (11.2) | 101 (13.5) | <0.0001 |
| Biological data | ||||||
| ALT, U/L; median (IQR) | 69 (45.5) | 27 (21) | 47 (37.7) | 72 (36.7) | 85 (45.5) | <0.0001 |
| AST, U/L; median (IQR) | 37 (20) | 25 (10.8) | 27 (19.3) | 37 (18.5) | 46 (22) | <0.0001 |
| AST/ALT, median (IQR) | 0.6 (0.2) | 0.8 (0.3) | 0.7 (0.2) | 0.5 (0.1) | 0.5 (0.2) | <0.0001 |
| GGT, U/L; median (IQR) | 55 (43) | 28 (35.5) | 34 (42.2) | 56.5 (35.2) | 62.8 (42.5) | <0.0001 |
| Total bilirubin, µmol/L; median (IQR) | 15.8 (7.5) | 18.9 (8.8) | 15.2 (7.3) | 15.5 (7.9) | 16 (7.4) | 0.359 |
| Direct bilirubin, µmol/L; median (IQR) | 2.8 (1.4) | 3.1 (1.2) | 2.9 (1.4) | 2.8 (1.5) | 2.9 (1.5) | 0.854 |
| Indirect bilirubin, µmol/L; median (IQR) | 12.8 (6.7) | 16.2 (8.1) | 12.3 (5.6) | 12.7 (6.9) | 13 (6.9) | 0.334 |
| Glucose, mmol/L; median (IQR) | 5.1 (0.7) | 5 (0.7) | 5.1 (1) | 5.1 (0.7) | 5.1 (0.8) | 0.403 |
| Insulin, pmol/L; median (IQR) | 103.6 (67.2) | 74.9 (71.5) | 83.7 (60.1) | 117.5 (79.7) | 117.9 (87.7) | <0.0001 |
| HbA1C, %; median (IQR) | 5.4 (0.5) | 5.2 (0.4) | 5.3 (0.4) | 5.4 (0.5) | 5.4 (0.4) | 0.017 |
| HOMA‐IR, median (IQR) | 24.5 (16.4) | 12.7 (13.4) | 18.4 (16.3) | 26.9 (17) | 26.9 (20.5) | <0.0001 |
| Total cholesterol, mmol/L; median (IQR) | 5.3 (1.2) | 5 (2) | 5.2 (1.4) | 5.3 (1.2) | 5.3 (1.2) | 0.921 |
| HDL‐cholesterol, mmol/L; median (IQR) | 1.1 (0.3) | 1.2 (0.4) | 1.1 (0.3) | 1.1 (0.2) | 1 (0.3) | 0.069 |
| LDL‐cholesterol, mmol/L; median (IQR) | 3.2 (1.1) | 2.9 (1.3) | 3.2 (1.3) | 3.2 (1.1) | 3.2 (1.1) | 0.694 |
| Triglyceride, mmol/L; median (IQR) | 1.8 (1.2) | 1.2 (0.9) | 1.7 (1) | 1.9 (1.1) | 2.1 (1.2) | 0.001 |
| Platelet count, 109; median (IQR) | 249 (79) | 237 (46.6) | 246.5 (77.5) | 250.5 (92.5) | 253 (69) | 0.135 |
| Uric acid, µmol/L; median (IQR) | 432.4 (106) | 376.5 (155.6) | 412 (126.5) | 431.7 (96.3) | 451 (85) | 0.038 |
| Imaging data | ||||||
| MRI‐PDFF, %; median (IQR) | 15.9 (11.3) | 3.3 (1.5) | 8.2 (2.1) | 15.4 (5.6) | 23.9 (6.8) | <0.0001 |
| CAP, dB/m; median (IQR) | 309 (36.5) | 248.5 (44) | 284.5 (27) | 312 (27.8) | 321 (24.5) | <0.0001 |
| LSM, kPa; median (IQR) | 7.6 (3.6) | 5.2 (2.1) | 6.9 (2.6) | 7.5 (3.6) | 8.2 (3.3) | <0.0001 |
Abbreviations: ALT, alanine aminotransferase; AST, aspartate aminotransferase; BMI, body mass index; CAP, controlled attenuation parameter; DBP, diastolic blood pressure; GGT, gamma‐glutamyl transpeptidase; HbA1c, glycated hemoglobin; HDL, high‐density lipoprotein; HOMA‐IR, homeostasis model assessment of insulin resistance; IQR, interquartile range; LDL, low‐density lipoprotein; LSM, liver stiffness measurement; MRI‐PDFF, magnetic resonance imaging–proton‐density fat fraction; SBP, systolic blood pressure.
p value determined by comparing characteristics of patients without NAFLD (MRI‐PDFF <5%) and with NAFLD (MRI‐PDFF ≥5%), 5%≤ MRI‐PDFF <10%, 10%≤ MRI‐PDFF <20%, and MRI‐PDFF ≥20%, using the Kruskal‐Wallis test, analysis of variance, or χ 2 or Fishers exact test, as appropriate. p < 0.05 is considered significant.
FIGURE 4.
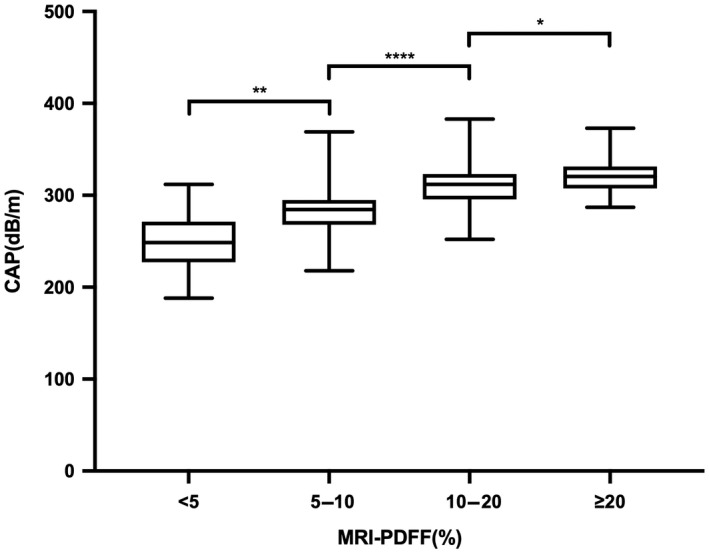
Distribution of CAP measurements by liver fat content on MRI‐PDFF. CAP measurements increase with increasing liver fat content on MRI‐PDFF (t test *p < 0.05, **p < 0.01, ****p < 0.0001). Abbreviations: CAP, controlled attenuated parameter; MRI‐PDFF, magnetic resonance imaging–proton density fat fraction
Optimal threshold of CAP for different grades of hepatic steatosis
The AUROC curve for CAP when hepatic steatosis was ≥5% (MRI‐PDFF ≥5%) was 0.93 (95% confidence interval [CI], 0.84–1.0). The optimal threshold was 277 dB/m (Figure 5A), and the sensitivity, specificity, PPV, and NPV were 90.8%, 91.7%, 99.4%, and 39.3%, respectively. The AUROC curve for detecting hepatic steatosis ≥10% (MRI‐PDFF ≥10%) was 0.86 (95% CI, 0.72–0.93); the optimal threshold value of CAP was 290.5 dB/m (Figure 5B), and the sensitivity, specificity, PPV, and NPV were 87.2%, 74%, 90.8%, and 66.1%, respectively. The AUROC curve for detecting hepatic steatosis ≥20% (MRI‐PDFF ≥20%) was 0.73 (95% CI, 0.66–0.80); the optimal threshold was 310.5 dB/m (Figure 5C), and the sensitivity, specificity, PPV, and NPV were 72.4%, 62.9%, 44.7%, and 85.4%, respectively (Table 2).
FIGURE 5.
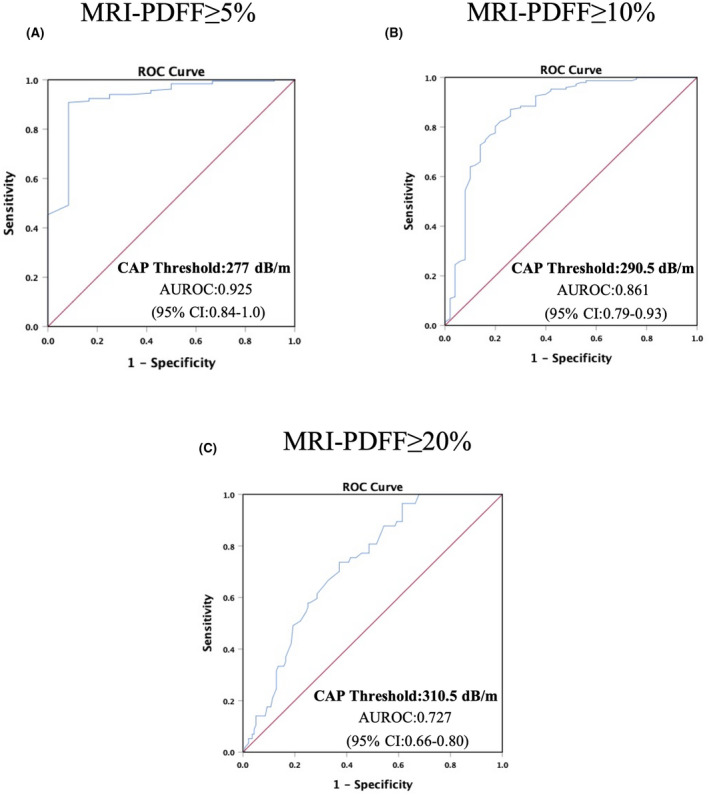
Diagnostic accuracy of CAP for the detection of hepatic steatosis. ROCs and AUROCs for the detection of (A) hepatic steatosis, defined by MRI‐PDFF ≥5%; (B) hepatic fat content ≥10%, defined as MRI‐PDFF ≥10%; and (C) hepatic fat content ≥20%, defined as MRI‐PDFF ≥20%. Abbreviations: AUROC, area under the receiver operating characteristic; CAP, controlled attenuated parameter; MRI‐PDFF, magnetic resonance imaging–proton density fat fraction; ROC, receiver operating characteristic
TABLE 2.
Diagnostic accuracy of CAP for the detection of hepatic steatosis
| AUROC (95% CI) | Cutoff (dB/m) | Sensitivity (%) | Specificity (%) | PPV (%) | NPV (%) | |
|---|---|---|---|---|---|---|
| MRI‐PDFF ≥5% | ||||||
| Optimal threshold | 0.93 (0.84–1.00) | 277 | 90.8 | 91.7 | 99.4 | 39.3 |
| Threshold for 100% sensitivity | 203 | 100 | 8.3 | 94.4 | 100 | |
| Threshold for 100% specificity | 312.5 | 45.2 | 100 | 100 | 10.6 | |
| MRI‐PDFF ≥10% | ||||||
| Optimal threshold | 0.86 (0.79–0.93) | 290.5 | 87.2 | 74 | 90.8 | 66.1 |
| Threshold for 100% sensitivity | 251.5 | 100 | 24 | 79.5 | 100 | |
| Threshold for 100% specificity | 371 | 1.4 | 100 | 100 | 25.6 | |
| MRI‐PDFF ≥20% | ||||||
| Optimal threshold | 0.73 (0.66–0.80) | 310.5 | 72.4 | 62.9 | 44.7 | 85.4 |
| Threshold for 100% sensitivity | 286.5 | 100 | 32.1 | 37.5 | 100 | |
| Threshold for 100% specificity | 384 | 0 | 100 | 0 | 71.1 |
Abbreviations: AUROC, area under the receiver operating characteristic; CAP, controlled attenuation parameter; CI, confidence interval; MRI‐PDFF, magnetic resonance imaging–proton density fat fraction; NPV, negative predictive value; PPV, positive predictive value.
Longitudinal study
Patient data
In the longitudinal study, 95 subjects were included in the final analysis (Figure 1). Mean (± SD) age and BMI at baseline were 38.8 (8.0) years and 28.6 (4.6) kg/m2, and the medians (IQR) of CAP and MRI‐PDFF were 312 (27) dB/m and 19.5% (9.9%), respectively. At 24 weeks, the medians (IQR) of CAP and MRI‐PDFF were 302 (41) dB/m and 12.6% (10.0%), respectively. Medians (IQR) of ALT, AST, and GGT were 75 (39) U/L, 41 (18) U/L, and 56.5 (42.3) U/L at baseline and 49 (39.5) U/L, 28 (15) U/L, and 44 (38) U/L at 24 weeks, respectively. All data are listed in Table 3.
TABLE 3.
Characteristics of patients in the drug intervention group at enrollment and after 24 weeks of intervention
| Characteristics | At enrollment n = 95 | At follow‐up (24 weeks) |
|---|---|---|
| Demographics | ||
| Age, years; mean (SD) | 38.8 (8.0) | |
| Female (%) | 10 (10.5) | |
| Male (%) | 85 (89.5) | |
| SBP, mm Hg; median (IQR) | 125 (15) | 120 (15.3) |
| DBP, mm Hg; median (IQR) | 82 (13) | 81 (11.5) |
| BMI, kg/m2; mean (SD) | 28.6 (4.6) | 27.8 (4.7) |
| Waist circumference, cm; median (IQR) | 99.5 (12.6) | 95 (9.5) |
| Biological data | ||
| ALT, U/L; median (IQR) | 75 (39) | 49 (39.5) |
| AST, U/L; median (IQR) | 41 (18) | 28 (15) |
| AST/ALT, median (IQR) | 0.5 (0.1) | 0.6 (0.3) |
| GGT, U/L; median (IQR) | 56.5 (42.3) | 44 (38) |
| Total bilirubin, µmol/L; median (IQR) | 15.1 (6.8) | 15.9 (8.05) |
| Direct bilirubin, µmol/L; median (IQR) | 2.9 (1.5) | 2.8 (1.15) |
| Indirect bilirubin, µmol/L; median (IQR) | 12.3 (5.3) | 12.7 (6.3) |
| Glucose, mmol/L; median (IQR) | 4.9 (0.8) | 4.9 (0.9) |
| Insulin, pmol/L; median (IQR) | 103.3 (71.6) | 94.3 (63.3) |
| HbA1C, %; median (IQR) | 5.4 (0.5) | 5.3 (0.5) |
| HOMA‐IR, median (IQR) | 22.8 (16.3) | 20.2 (14.2) |
| Total cholesterol, mmol/L; median (IQR) | 5.09 (1.21) | 5.24 (1.3) |
| HDL‐cholesterol, mmol/L; median (IQR) | 1.1 (0.2) | 1.1 (0.2) |
| LDL‐cholesterol, mmol/L; median (IQR) | 3.1 (0.9) | 3.0 (1.1) |
| Triglyceride, mmol/L; median (IQR) | 1.7 (1.2) | 1.7 (1.1) |
| Platelet count, 109; median (IQR) | 241 (86) | 237 (83.8) |
| Uric acid, µmol/L; median (IQR) | 453.5 (113.5) | 435 (120) |
| Imaging data | ||
| MRI‐PDFF, %; median (IQR) | 19.5 (9.9) | 12.6 (10.0) |
| CAP, dB/m; median (IQR) | 312 (27) | 302 (41) |
| LSM, kPa; median (IQR) | 7.4 (3.1) | 6.5 (3) |
Abbreviations: ALT, alanine aminotransferase; AST, aspartate aminotransferase; BMI, body mass index; CAP, controlled attenuation parameter; DBP, diastolic blood pressure; GGT, gamma‐glutamyl transpeptidase; HbA1c, glycated hemoglobin; HDL, high‐density lipoprotein; HOMA‐IR, homeostasis model assessment of insulin resistance; IQR, interquartile range; LDL, low‐density lipoprotein; LSM, liver stiffness measurement; MRI‐PDFF, magnetic resonance imaging–proton‐density fat fraction; SBP, systolic blood pressure.
Consistency between CAP and MRI‐PDFF changes
For most participants, the direction of the changes was the same between CAP and MRI‐PDFF (same direction, n = 73 [73.8%] versus different direction, n = 22 [23.2%]; Table S2). In addition, the consistency analysis found that the overall changes between the two were moderately consistent (kappa = 0.424, p = 0.00011), which might explain why for some patients the direction of the change differed between CAP and MRI‐PDFF.
Correlation between CAP and MRI‐PDFF in longitudinal evaluation
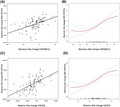
Absolute and relative percentage changes for the CAP and MRI‐PDFF measurements were calculated based on baseline and 24 weeks of intervention. A Pearson correlation analysis and linear regression analysis showed that CAP and MRI‐PDFF measurements for evaluating changes in hepatic steatosis were positively correlated (r = 0.492, p < 0.0001; Figure 6A [△MRI‐PDFF = △CAP × 0.148–2.864]). Further piecewise linear regression analysis showed that CAP and MRI‐PDFF had significant threshold values for the longitudinal evaluation of changes in hepatic steatosis (Figure 6B). When CAP measurements increased or decreased by less than 53 dB/m, they correlated with measurements of MRI‐PDFF (p < 0.001); however, when measurements decreased by more than 53 dB/m, the correlation was significantly weakened (p = 0.193; Table S3). Evaluation of the relative change in the percentage of hepatic steatosis was also positively correlated between the two modalities (r = 0.598, p < 0.0001; Figure 6C [△MRI‐PDFF (%) = △CAP (%) × 2.473–11.85]). However, we found no cut‐off value in the piecewise regression models, meaning that their relative changes were correlated for any range of values (Figure 6D; Table S4).
FIGURE 6.
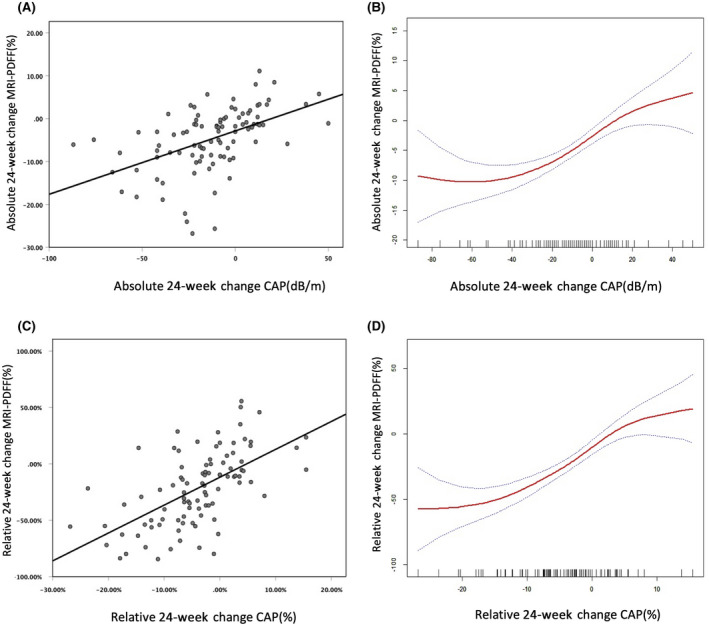
CAP and MRI‐PDFF liver fat assessment results were positively correlated. (A,B) Relationship between absolute changes and (C,D) relationship between relative changes. Abbreviations: CAP, controlled attenuated parameter; MRI‐PDFF, magnetic resonance imaging–proton density fat fraction
DISCUSSION
As a prospective clinical trial conducted with a Chinese cohort, this study demonstrated a correlation between CAP and MRI‐PDFF measurements for grading hepatitis steatosis; however, this correlation disappeared when CAP values were greater than 331 dB/m. For MRI‐PDFF ≥5%, ≥10%, or ≥20%, the optimal CAP thresholds were 277 dB/m, 290.5 dB/m, and 310.5 dB/m, respectively, and the AUROC curves were 0.92 (95% CI, 0.84–1.00), 086 (95% CI, 0.79–0.93), and 0.73 (95% CI, 0.66–0.80), respectively. Longitudinal data revealed that both absolute and relative changes were consistent between CAP and MRI‐PDFF, but the correlation was stronger for the relative change than the absolute change. Further analysis showed that the correlation disappeared when the absolute reduction of CAP values was >53 dB/m. However, the linear and piecewise linear regression did not differ for the relative changes in hepatic steatosis measured by CAP and MRI‐PDFF, meaning that these were correlated for any value range. Therefore, we recommend measuring the relative change using CAP when evaluating hepatic steatosis changes in patients with NAFLD. In addition, we found that the changes in CAP and MRI‐PDFF were moderately consistent (kappa = 0.424). Inconsistent changes in CAP and MRI‐PDFF were found in 23.2% of subjects. This might be attributed to the measurement error of CAP in assessing changes in liver fat content before and after treatment. As is known, some factors, such as the spatial heterogeneity of liver steatosis,[ 19 ] hepatic inflammation, and skin–capsular distance,[ 20 ] might affect CAP measurement.
The results herein provide a reference for the future application of CAP for diagnosing NAFLD and assessing hepatic steatosis. At the same time, the screening failure rate of some clinical trials, such as those with inclusion criteria of MRI‐PDFF ≥8% or ≥10%, can be reduced to save costs. Moreover, CAP may also be used to evaluate relative change in hepatic steatosis in patients with NAFLD.
To date, studies on the correlation between CAP and MRI‐PDFF measurements have focused on cross‐sectional assessment or longitudinal changes in hepatic steatosis. Previous studies have attempted to improve the accuracy of CAP for evaluating hepatic steatosis by determining optimal threshold values for different grades of hepatic steatosis, where fatty liver was defined as MRI‐PDFF ≥5%.[ 1 , 17 ] Caussy et al.[ 13 ] found that the cut‐off value of CAP was 288 dB/m, while Ajmera et al.[ 21 ] found that the optimal CAP threshold was 285 dB/m in patients with human immunodeficiency virus with fatty liver. The results of these two studies were similar and higher than ours. Ferraioli et al.[ 22 ] arrived at threshold values for S0 and S1–3 (MRI‐PDFF ≥5%) of 258 dB/m, while another study with a Korean cohort found that the optimal threshold for CAP was 264 dB/m.[ 17 ] All these results taken together suggests that the optimal threshold for diagnosis of NAFLD using CAP may differ by geographic region, ethnicity, or comorbid disease, and this should be validated in multicenter studies. Furthermore, the CAP machine iLivTouch used in our study was different from the FibroScan, which might have affected the results. We also found that the CAP threshold for diagnosing fatty liver in our study was higher than the reference value of the machine. We suggest the reason might be that the machine's reference value was based on hepatic steatosis caused by various chronic liver diseases, such as alcoholic fatty liver disease and hereditary liver disease. In our study, we mainly targeted patients with NAFLD. They had the higher BMI (mean ± SD, 28 ± 4.2 kg/m2), and this might lead to a higher cut‐off value. Further analysis of AUROC curves were 0.92, 086, and 0.73 when MRI‐PDFF was ≥5%, ≥10%, and ≥20%, respectively. We found that the accuracy of the analysis model with the optimal threshold tended to decrease with increasing liver fat content, which was generally consistent with the results of other studies.[ 13 ]
Currently, only a few studies have assessed the longitudinal changes in hepatic steatosis using CAP and MRI‐PDFF. A longitudinal study by Wang et al.[ 23 ] showed that CAP changed by 25 dB/m with a 1% change in MRI‐PDFF. In contrast to our study, that study had a small sample size and lacked non‐NAFLD control groups. Moreover, not analyzing the direction of change (if it increases or decreases) reduces the reliability of any conclusions drawn.
Our study had several strengths. First, we included both a longitudinal and cross‐sectional study design with a relatively large sample size. Second, a non‐NAFLD control group was included, and all patients underwent systematic screening to exclude other chronic liver diseases. Third, this study used a Chinese population, while most other studies included participants from different regions. Finally, both linear and piecewise regression models were used to analyze the correlation between CAP and MRI‐PDFF.
Our study also had some limitations. First, the size of the non‐NAFLD control group was small. Second, the majority of the participants were men. The main reason for this may be that the prevalence of NAFLD is significantly higher among middle‐aged men than among women.[ 24 , 25 ] Third, the XL probe was not used for CAP measurements, and a recent study showed that results obtained using M and XL probes were inconsistent in the same patient.[ 14 ] The use of both probes in the same study may lead to experimental errors.
Our study assessed the relationship between CAP and MRI‐PDFF using cross‐sectional and longitudinal studies, calculated the optimal CAP threshold for different grades of hepatic steatosis, and assessed the relationship between the two imaging modalities for the longitudinal evaluation of hepatic fat content change in Chinese individuals. The results of this study may provide references for future clinical practice or trials that would like to use CAP to assess hepatic fat content or evaluate the therapeutic effect of intervention.
CONFLICT OF INTEREST
The authors declare that no conflict of interest exists.
AUTHOR CONTRIBUTIONS
Guarantor of the article: Qin Feng. Patient visits, data collection, analysis and interpretation of data, statistical analysis, drafting of the manuscript: Ziming An. Patient visits, data collection, analysis and interpretation of data: Qiaohong Liu. Patient visits, data collection: Wenli Zeng, Yan Wang, Qian Zhang, Huafu Pei, Xin Xin. Imaging analysis, data collection: Shuohui Yang, Fang Lu. Statistical analysis, critical revision of the manuscript: Yu Zhao. Study concept and design, analysis and interpretation of data, obtained funding, study supervision: Yiyang Hu. Study concept and design, analysis and interpretation of data, critical revision of the manuscript, obtained funding, study supervision: Qin Feng. All authors read and approved the final manuscript.
Supporting information
Table S1‐S4
ACKNOWLEDGMENTS
We thank the subjects who participated in this study for providing relevant information. We thank Mei Zubing and Pan Yueqin (Shuguang Hospital Affiliated to Shanghai University of Traditional Chinese Medicine) for providing statistical assistance.
An Z, Liu Q, Zeng W, Wang Y, Zhang Q, Pei H, et al. Relationship between controlled attenuated parameter and magnetic resonance imaging–proton density fat fraction for evaluating hepatic steatosis in patients with NAFLD. Hepatol Commun. 2022;6:1975–1986. 10.1002/hep4.1948
Ziming An and Qiaohong Liu contributed equally to this work.
Funding information
Shanghai Hospital Development Center Clinical Reasearch Plan, Funding/Grant Numbers: SHDC2020CR4051 and SHDC2020CR2049B. Shanghai Science and Technology Development, Funding/Grant Number: 18401933100. National Natural Science Foundation of China, Funding/Grant Numbers: 82174040, 81830119. Graduate Innovation Project of Shanghai University of Traditional Chinese Medicine, Funding/Grant Number: Y2021030
Contributor Information
Yu Zhao, Email: cathy150@139.com.
Yiyang Hu, Email: yyhuliver@163.com.
Qin Feng, Email: fengqin@shutcm.edu.cn.
REFERENCES
- 1. Loomba R, Friedman SL, Shulman GI. Mechanisms and disease consequences of nonalcoholic fatty liver disease. Cell. 2021;184:2537–64. [DOI] [PubMed] [Google Scholar]
- 2. Younossi ZM, Koenig AB, Abdelatif D, Fazel Y, Henry L, Wymer M. Global epidemiology of nonalcoholic fatty liver disease‐meta‐analytic assessment of prevalence, incidence, and outcomes. Hepatology. 2016;64:73–84. [DOI] [PubMed] [Google Scholar]
- 3. Younossi Z, Tacke F, Arrese M, Chander Sharma B, Mostafa I, Bugianesi E, et al. Global perspectives on nonalcoholic fatty liver disease and nonalcoholic steatohepatitis. Hepatology. 2019;69:2672–82. [DOI] [PubMed] [Google Scholar]
- 4. Zhou J, Zhou F, Wang W, Zhang X‐J, Ji Y‐X, Zhang P, et al. Epidemiological features of NAFLD from 1999 to 2018 in China. Hepatology. 2020;71:1851–64. [DOI] [PubMed] [Google Scholar]
- 5. Dulai PS, Sirlin CB, Loomba R. MRI and MRE for non‐invasive quantitative assessment of hepatic steatosis and fibrosis in NAFLD and NASH: clinical trials to clinical practice. J Hepatol. 2016;65:1006–16. [DOI] [PMC free article] [PubMed] [Google Scholar]
- 6. Park CC, Nguyen P, Hernandez C, Bettencourt R, Ramirez K, Fortney L, et al. Magnetic resonance elastography vs transient elastography in detection of fibrosis and noninvasive measurement of steatosis in patients with biopsy‐proven nonalcoholic fatty liver disease. Gastroenterology. 2017;152:598–607.e2. [DOI] [PMC free article] [PubMed] [Google Scholar]
- 7. Ferraioli G, Soares Monteiro LB. Ultrasound‐based techniques for the diagnosis of liver steatosis. World J Gastroenterol. 2019;25:6053–62. [DOI] [PMC free article] [PubMed] [Google Scholar]
- 8. Karlas T, Petroff D, Sasso M, Fan J‐G, Mi Y‐Q, de Lédinghen V, et al. Individual patient data meta‐analysis of controlled attenuation parameter (CAP) technology for assessing steatosis. J Hepatol. 2017;66:1022–30. [DOI] [PubMed] [Google Scholar]
- 9. Sasso M, Miette V, Sandrin L, Beaugrand M. The controlled attenuation parameter (CAP): a novel tool for the non‐invasive evaluation of steatosis using Fibroscan. Clin Res Hepatol Gastroenterol. 2012;36:13–20. [DOI] [PubMed] [Google Scholar]
- 10. Imajo K, Kessoku T, Honda Y, Tomeno W, Ogawa Y, Mawatari H, et al. Magnetic resonance imaging more accurately classifies steatosis and fibrosis in patients with nonalcoholic fatty liver disease than transient elastography. Gastroenterology. 2016;150:626–637.e7. [DOI] [PubMed] [Google Scholar]
- 11. Pu KE, Wang Y, Bai S, Wei H, Zhou Y, Fan J, et al. Diagnostic accuracy of controlled attenuation parameter (CAP) as a non‐invasive test for steatosis in suspected non‐alcoholic fatty liver disease: a systematic review and meta‐analysis. BMC Gastroenterol. 2019;19:51. [DOI] [PMC free article] [PubMed] [Google Scholar]
- 12. Eddowes PJ, Sasso M, Allison M, Tsochatzis E, Anstee QM, Sheridan D, et al. Accuracy of fibroscan controlled attenuation parameter and liver stiffness measurement in assessing steatosis and fibrosis in patients with nonalcoholic fatty liver disease. Gastroenterology. 2019;156:1717–30. [DOI] [PubMed] [Google Scholar]
- 13. Caussy C, Alquiraish MH, Nguyen P, Hernandez C, Cepin S, Fortney LE, et al. Optimal threshold of controlled attenuation parameter with MRI‐PDFF as the gold standard for the detection of hepatic steatosis. Hepatology. 2018;67:1348–59. [DOI] [PMC free article] [PubMed] [Google Scholar]
- 14. Caussy C, Brissot J, Singh S, Bassirian S, Hernandez C, Bettencourt R, et al. Prospective, same‐day, direct comparison of controlled attenuation parameter with the M vs the XL probe in patients with nonalcoholic fatty liver disease, using magnetic resonance imaging‐proton density fat fraction as the standard. Clin Gastroenterol Hepatol. 2020;18:1842–50.e6. [DOI] [PMC free article] [PubMed] [Google Scholar]
- 15. Kozlowska‐Petriczko K, Wunsch E, Milkiewicz P. Controlled attenuation parameter in nonalcoholic fatty liver disease: the thresholds do matter. Clin Gastroenterol Hepatol. 2021;19:1507–8. [DOI] [PubMed] [Google Scholar]
- 16. Jian‐gao F; Chinese Liver Disease Association . Guidelines for management of nonalcoholic fatty liver disease: an updated and revised edition. Zhonghua Gan Zang Bing Za Zhi. 2010;18:163–6. [PubMed] [Google Scholar]
- 17. Choi SJ, Kim SM, Kim YS, Kwon OS, Shin SK, Kim KK, et al. Magnetic resonance‐based assessments better capture pathophysiologic profiles and progression in nonalcoholic fatty liver disease. Diabetes Metab J. 2021;45:739–52. [DOI] [PMC free article] [PubMed] [Google Scholar]
- 18. Procter AJ, Sun JY, Malcolm PN, Toms AP. Measuring liver fat fraction with complex‐based chemical shift MRI: the effect of simplified sampling protocols on accuracy. BMC Med Imaging. 2019;19:14. [DOI] [PMC free article] [PubMed] [Google Scholar]
- 19. Caussy C, Reeder SB, Sirlin CB, Loomba R. Noninvasive, quantitative assessment of liver fat by MRI‐PDFF as an endpoint in NASH trials. Hepatology. 2018;68:763–72. [DOI] [PMC free article] [PubMed] [Google Scholar]
- 20. Kimura S, Tanaka K, Oeda S, Inoue K, Inadomi C, Kubotsu Y, et al. Effect of skin‐capsular distance on controlled attenuation parameter for diagnosing liver steatosis in patients with nonalcoholic fatty liver disease. Sci Rep. 2021;11:15641. [DOI] [PMC free article] [PubMed] [Google Scholar]
- 21. Ajmera VH, Cachay ER, Ramers CB, Bassirian S, Singh S, Bettencourt R, et al. Optimal threshold of controlled attenuation parameter for detection of HIV‐associated NAFLD with magnetic resonance imaging as the reference standard. Clin Infect Dis. 2021;72:2124–31. [DOI] [PMC free article] [PubMed] [Google Scholar]
- 22. Ferraioli G, Maiocchi L, Raciti MV, Tinelli C, De Silvestri A, Nichetti M, et al. Detection of liver steatosis with a novel ultrasound‐based technique: a pilot study using MRI‐derived proton density fat fraction as the gold standard. Clin Transl Gastroenterol. 2019;10:e00081. [DOI] [PMC free article] [PubMed] [Google Scholar]
- 23. Wang JH, Ou HY, Yen YH, Chen CH, Lu SN. Usefulness of controlled attenuation parameter in detecting and monitoring hepatic steatosis with MRI‐PDFF as reference. Dig Dis Sci. 2020;65:1512–9. [DOI] [PubMed] [Google Scholar]
- 24. Jennings J, Faselis C, Yao MD. NAFLD‐NASH: an under‐recognized epidemic. Curr Vasc Pharmacol. 2018;16:209–13. [DOI] [PubMed] [Google Scholar]
- 25. Sorrentino P, Tarantino G, Conca P, Perrella A, Terracciano ML, Vecchione R, et al. Silent non‐alcoholic fatty liver disease‐a clinical‐histological study. J Hepatol. 2004;41:751–7. [DOI] [PubMed] [Google Scholar]
Associated Data
This section collects any data citations, data availability statements, or supplementary materials included in this article.
Supplementary Materials
Table S1‐S4


