Abstract
Objectives
Non-small cell lung adenocarcinoma (NSCLC) is the most common type of lung cancer, which is considered as the most lethal and prevalent cancer worldwide. Recently, molecular changes have been implicated to play a significant role in the cancer progression. Despite of numerous studies, the molecular mechanism of NSCLC pathogenesis in each sub-stage remains unclear. Studying these molecular alterations gives us a chance to design successful therapeutic plans which is aimed in this research.
Materials and Methods
In this bioinformatics study, we compared the expression profile of 7 minor stages of NSCLC adenocarcinoma, including GSE41271, GSE42127, and GSE75037, to clarify the relation of molecular alterations and tumorigenesis. At first, 99 common differentially expressed genes (DEG) were obtained. Then, functional enrichment analysis and protein-protein interaction (PPI) network construction were performed to uncover the association of significant cellular and molecular changes. Finally, gene expression profile interactive analysis (GEPIA) was employed to validate the results by RNA-seq expression data.
Results
Primary analysis showed that BMP4 was downregulated through the tumor progression to the stage IB and GPX2 was upregulated in the course of final tumor development to the stage IV and distant metastasis. Functional enrichment analysis indicated that BMP4 in the TGF-β signaling pathway and GPX2 in the glutathione metabolism pathway may be the key genes for NSCLC adenocarcinoma progression. GEPIA analysis revealed a correlation between BMP4 downregulation and GPX2 upregulation and lung adenocarcinoma (LUAD) progression and lower survival chances in LUAD patients which confirm microarray data.
Conclusion
Taken together, we suggested GPX2 as an oncogene by inhibiting apoptosis, promoting EMT and increasing glucose uptake in the final stages and BMP4 as a tumor suppressor via inducing apoptosis and arresting cell cycle in the early stages through lung adenocarcinoma (ADC) development to make them candidate genes to further cancer therapy investigations.
Keywords: Glutathione Peroxidase, In Silico, Microarray, NSCLC, TGF-β Signaling
Introduction
Lung cancer is the leading cause of cancer-related death worldwide. In 2012, approximately 1.8 million cases were diagnosed, and 1.6 million died from lung cancer (1). Besides, 2,093,876 new cases and 1,761,007 deaths were confirmed in 2018, accounting for 18.4 percent of cancer deaths (2). Two main reasons are considered to contribute to the high incidence and mortality of lung cancer. The smoking habit is believed the first reason, because 80 to 90% of diagnosed patients have been reported with a history of smoking (3, 4). And the second one stems from poor diagnosis. Roughly 70% of patients have been diagnosed with locally advanced or metastatic tumors (5). Except for current smoking, some other risk factors such as passive or second-hand smoking, diet, air pollution, alcohol, physical activity, occupational exposure, and genetic factors have been introduced to have a role in lung cancer progression (5, 6). Lung cancer has two main subtypes: Non-small cell lung cancer (NSCLC) and small cell lung cancer (SCLC) (7). NSCLC makes up approximately 83% of lung cancers (8) and is divided into three main histological subtypes, including squamous cell carcinoma (SCC), large cell carcinoma (LCC), and adenocarcinoma (ADC). NSCLC adenocarcinoma has shown with a higher incidence of NSCLC cases (50%) (9). NSCLC staging, like many cancers, is based on the tumor, nodes and metastasis (TNM) staging system (10) that T stands for the pathological extension of tumor size, N describes the involvement of regional lymph nodes, and M shows distant metastasis (11). Tumor progression, according to the TNM, starts from substage IA (stage I) and end up to stage IV. However, there is a stage 0 called carcinoma in situ (CIS) before sub-stage IA that is usually medicated by an accurate resection. It has been estimated that 5-year survival in NSLCC varies from 73% in stage IA patients to 13% in stage IV patients (12). Selecting a therapeutic method for NSCLC is based on the tumor stage recommending resection for stage I, resection, and adjuvant chemotherapy for stage II, chemotherapy, and radiotherapy for stage III and chemotherapy platinum-based two drugs for stage IV (4, 5). However, recently, targeting molecular events in cancer cells has been implicated as a novel method for cancer therapy (13).
In the process of tumor progression, many genetic alterations can occur, and some researches have been accomplished to elucidate these molecular changes in the NSCLC ADC to treat and prevent cancer progression, but it remains unclear. Genetic alterations, especially expression changes, mediate many biological programs to provide an appropriate statue for malignant cell’s rapid proliferation (14). Conclusively, the identification of molecular signature alterations impacting tumor progression that is aimed in this study could be helpful for more investigations for treatment, prognosis, and diagnosis of NSCLC adenocarcinoma.
High-throughput methods such as microarrays have been used for bioinformatics analysis and provided useful information for monitoring biomarkers and discernment of the pathogenic genes in cancer and other diseases that are fundamental for therapeutic targets (15, 16). In this study, we analyzed microarray expression profiles of 3 cohorts with GEO2R based on the R language. Subsequently, functional annotations analysis was performed to uncover the association between molecular alterations and neoplastic cell proliferation.
Materials and Methods
Microarray data analysis
In this bioinformatics study, gene expression profiles of GSE75037, GSE41271, and GSE42127 were extracted from the GEO (https://www.ncbi.nlm.nih.gov/geo/) containing 179, 132, and 82 chips for adenocarcinoma, and then 28, 25, and 22 chips were selected respectively. Gene expression profiles in these series were examined based on the GPL6884 Platform (Illumina Human WG6V3.0 Expression Bead Chip). ADC samples with the highest similarity in the value distribution in 7 different sub-stages (according to the TNM staging) (11, 12) were divided into six groups in order to screen the molecular alterations in tumor progression (from stage IA to IV) and were subsequently analyzed by GEO2R (Table S1, See Supplementary Online Information at www.celljournal. org). Twelve samples were chosen for stages IIIA, IIB, IB, and IA, and 11, 9, and 7 samples were selected for stage IIA, IIIB, and IV, respectively. Then, comparison of the gene expression profile of stages was performed in 6 groups (Table 1). Using GEO2R, differentially expressed genes (DEGs) were identified in each group with the criterion cut-off P<0.05 and |LogFC| ≥ 1 for statistical significance. Then the DEGs were shared in each group in three data series using the Venn diagram to identify the most predominant molecular alterations. A heatmap was then designed by a web-based tool, Morpheus (https://software.broadinstitute.org/morpheus/), to screen dysregulated genes expression level.
Table 1.
Stages samples in each groups
|
| ||
|---|---|---|
| Groups | Stage comparison | Samples count |
|
| ||
| Group 1 | IA vs. IB | 12 vs. 12 |
| Group 2 | IB vs. IIA | 12 vs. 11 |
| Group 3 | IIA vs. IIB | 11 vs. 12 |
| Group 4 | IIB vs. IIIA | 12 vs. 12 |
| Group 5 | IIIA vs. IIIB | 12 vs. 9 |
| Group 6 | IIIB vs. IV | 9 vs. 7 |
|
| ||
Functional annotation analysis
Gene ontology (GO) and pathway enrichment analysis were performed using GO Resource (GOR, http:// geneontology.org/), Kyoto Encyclopedia of Genes and Genomes (KEGG, https://www.genome.jp/kegg/ pathway.html), Database for Annotation, Visualization and Integrated Discovery (DAVID, https://david.ncifcrf. gov/), Wikipathways (https://wikipathways.org/), Reactome (https://reactome.org/) and BioPlanet (https://tripod.nih. gov/bioplanet/). The statistically significant pathways and GOs were defined by P<0.05 as the cut-off criterion. Then protein-protein interaction (PPI) network was constructed using the Search Tool for the Retrieval of Interacting Genes (STRING, https://string-db.org/) (17) and a combined score >0.4 was used to identify significant interactions. Next, Cytoscape (version 3.8.0) was used with CentiScape2.2 and CytoHubba plugins to discover hub proteins and visualization of the PPI network.
Candidate genes analysis by GEPIA
GEPIA (http://gepia.cancer-pku.cn/) as a newly developed interactive web server for analyzing the RNA sequencing expression data using TCGA (https://www.cancer.gov/ about-nci/organization/ccg/research/structural-genomics/ tcga) and GTEx (https://gtexportal.org/home/) projects was applied for additional analysis of candidate genes in lung adenocarcinoma (LUAD) and comparison with squamous cell carcinoma (LUSC) with the |LogFC| ≥ 1 and P<0.01 as the cut-off criterion. Finally, Kaplan-Meier plot matched to the TCGA data was used to explain the survival rate of patients, according to the expression of candidate genes in GEPIA database.
Results
Identification of differentially expressed genes
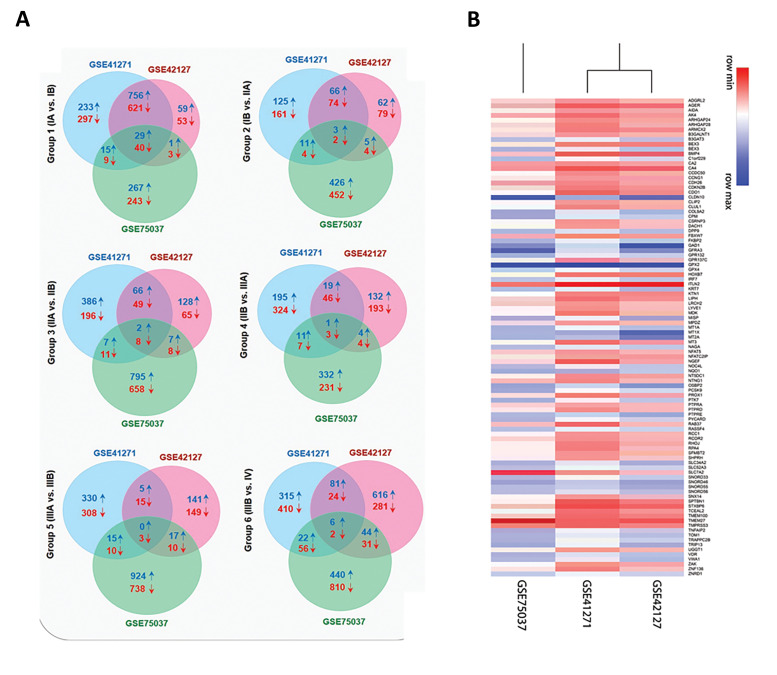
A total of 16786 DEGs was identified in the NSCLC adenocarcinoma expression datasets GSE41271, GSE42127, and GSE75037 using GEO2R. Ninety-nine common DEGs in all groups (Table S2, See Supplementary Online Information at www.celljournal.org), including 58 downregulated and 41 upregulated DEGs, were obtained through the Venn diagram (Fig .1A). The group 1 (stage IA vs. stage IB) included most DEGs with 40 downregulated and 29 upregulated genes, indicating that the most molecular alterations have occurred in the early stages. A heatmap of up (blue) and downregulated (red) genes visualized between three different studies (Fig .1B). Top DEGs |LogFC|≥2 between 6 groups are shown in the Table S3 (See Supplementary Online Information at www.celljournal.org). Eventually, our analysis represented ITLN2, CLDN10, SLC7A2, GFRA3, and GPX2 as the most altered genes in the groups 1 to 6, respectively, and among these genes, GPX2 was the most altered gene with a noticeable 43.56-fold change.
Fig 1.
Intersecting genes of GSE41271, GSE42127, and GSE75037 in each sub-stage using a Venn diagram. A. Overlapping genes in GSE41271, GSE42127, and GSE75037 in group 1 (IA vs. IB), group 2 (IB vs. IIA), group 3 (IIA vs. IIB), group 4 (IIB vs. IIIA), group 5 (IIIA vs. IIIB), and group 6 (IIIB vs. IV) via Venn diagram ↓ indicates downregulated and ↑ indicates upregulated differentially expressed genes (DEG) respectively. Red numbers refer to downregulated common DEGs and blue numbers are related to the upregulated common DEGs. B. A heatmap of differentially expressed genes between three studies. Each row of the heatmap represents a gene that has at least a |LogFC|≥1 between three studies. Red for lower and blue for higher expressions.
Discovering associated gene ontology and pathways
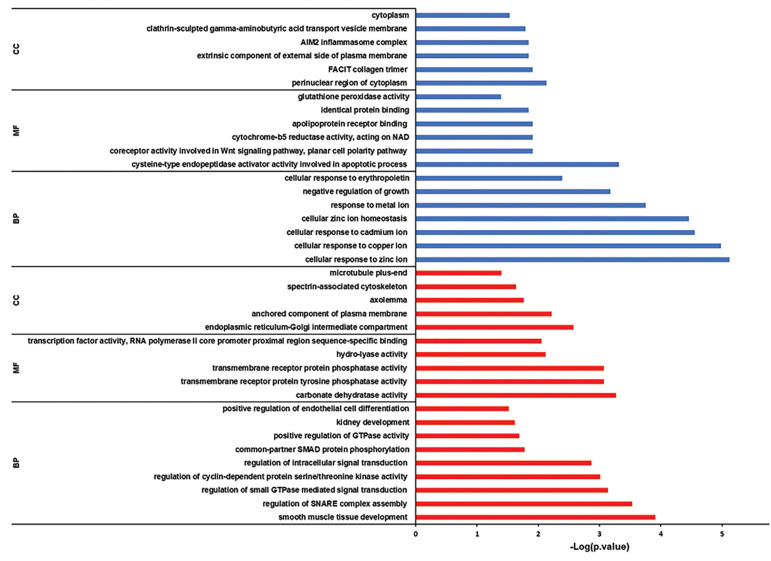
GO was analyzed by Enrichr and DAVID in order to find out enriched BP, MF, and CC. In this manner, for downregulated DEGs smooth muscle tissue development, carbonate dehydratase activity, and endoplasmic reticulum-Golgi intermediate compartment were manifested. Then for upregulated DEGs, cellular response to zinc ion, cysteine-type endopeptidase activator activity involved in the apoptotic process and perinuclear region of cytoplasm were revealed (Fig .2).
Fig 2.
Detecting related gene ontologies. Red and blue columns represent downregulated and upregulated associated. GO, respectively. BP; Biological process, MF; Molecular function, and CC; Cellular component.
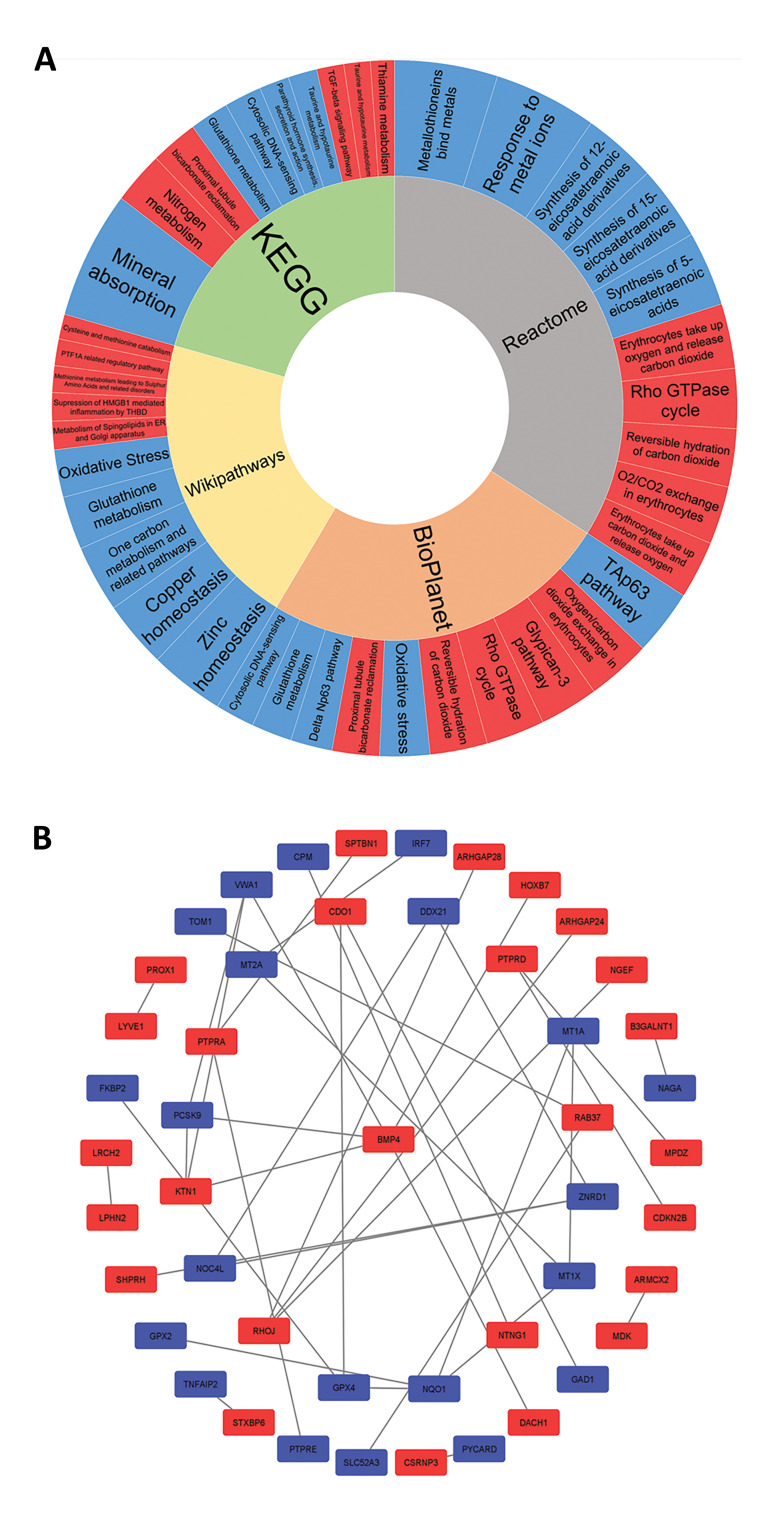
Further screening of biological processes, separately in the three data series, revealed an increased rate of the cell cycle and inhibition of apoptosis during tumor progression. In addition, epithelial cells loss of differentiation was observed in the group 6, which seems to contribute to the epithelial-to-mesenchymal transition (EMT) that eventually leads to metastasis. EMT promoter genes were also observed in the GOR (Table S4, See Supplementary Online Information at www.celljournal.org). Next, pathway enrichment analysis was accomplished and indicated Nitrogen metabolism and Mineral absorption in the KEGG. Also, erythrocytes take up oxygen and release carbon dioxide and response to metal ions in the Reactome, Suppression of HMGB1 mediated inflammation by the THBD and Zinc homeostasis in the Wikipathways and Oxygen/carbon dioxide exchange in the erythrocytes and TAp63 pathway in the BioPlanet, were detected as the most disrupted pathways for downregulated and upregulated DEGs respectively (Fig .3A).
Fig 3.
Pathway and network analysis. A. Pathway enrichment analysis. Red and blue cells represent downregulated and upregulated pathways, respectively. The most important pathways are those that have bigger cells. B. Protein-protein interaction (PPI) network. Red and blue points represent downregulated and upregulated genes.
Disclosing Hub proteins
To identify key proteins with regulatory impacts, the STRING was used for the PPI network construction, and Cytoscape was used for further analysis, which showed that among all common DEGs, 47 proteins were involved in the network via 37 edges (Fig .3B). Considering the degree and betweenness centrality for the nodes indicated BMP4, NQO1, RHOJ, ZNRD1, and GPX4 as the critical proteins (Table S5, See Supplementary Online Information at www.celljournal. org). Analyzing the network with the CentiScape2.2 and CytoHubba plugins demonstrated BMP4 as the most important protein in this PPI network, which is downregulated in group 1 (Fig .S1, See Supplementary Online Information at www.celljournal.org).
Accelerate cell cycle and apoptosis arresting during lung adenocarcinoma progression
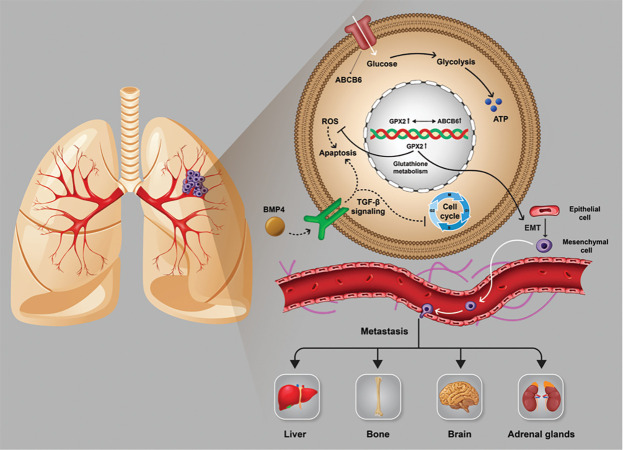
It seems that the downregulation of BMP4 during primary tumor progression to stage IB avoids the induction of apoptosis and arresting cell cycle through TGF-β signaling that is needed for tumor progression. Also, the upregulation of GPX2 through final tumor progression to stage IV (Table S3, See Supplementary Online Information at www.celljournal.org) is correlated with the glutathione metabolism pathway, which maintains the redox balance in the cancer cells against accumulative reactive oxygen species (ROS) and seems to promote EMT, which leads to metastasis. We also found GPX4 in the glutathione metabolism pathway and CDKN2B in the TGF-β signaling that change these pathways in the same way with BMP4 and GPX2. Additionally, screening previous studies on the GPX2 showed a co-expression relation with ABCB6 which is involved in the glucose uptake (Fig . S2, See Supplementary Online Information at www. celljournal.org). Hence, upregulation of GPX2 could result in an increase in the glucose uptake (Fig .4).
Fig 4.
The role of BMP4 in TGF-β signaling and GPX2 in glutathione metabolism in tumor progression.
Verification of GPX2 and BMP4 in GEPIA database
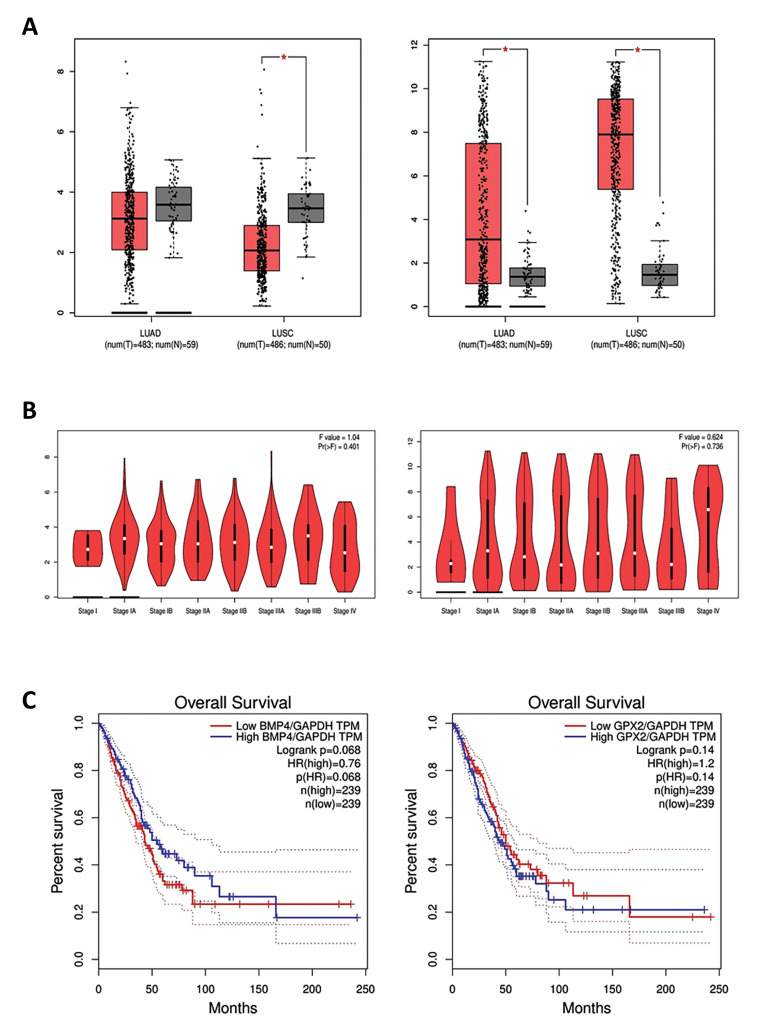
Screening the expression changes of BMP4 according to the normal lung tissue in the TCGA data indicated a significant downregulation in the LUSC and nonsignificant downregulation in the LUAD by |LogFC| ≥ 1 and P<0.01 as the cut-off criteria. Analyzing the TCGA data for the GPX2 showed upregulation in the LUAD and LUSC in comparison with the normal lung tissue (Fig .5A). Monitoring expression alterations of BMP4 and GPX2 in the TCGA samples in each stage manifested the same results of GEO and confirmed that BMP4 was downregulated within a primary tumor progression to stage IB and GPX2 was upregulated throughout stage IIIB to IV progression (Fig .5B). Kaplan-Mayer analysis illustrated a relation between the downregulation of BMP4 and upregulation of GPX2 and the high-risk groups of LUAD patients by considering GAPDH as the normalizer gene. Patients with downregulation of BMP4 approximately between 50-165th month seem to have a lower chance of survival. Contrastingly, upregulation of BMP4 was correlated with the lower survival rate after 165th. Moreover, upregulation of GPX2 during the final development of the tumor is related to the high-risk group of patients among approximately 85th month until the 165th month. However, after this period, there was no meaningful difference between the survival chances of LUAD patients, according to the GPX2 expression (Fig .5C). This information has a predictive potentiality to estimate the life-expectancy of LUAD patients by monitoring their BMP4 and GPX2 expression.
Fig 5.
GEPIA analysis of candidate genes. Boxplot of A. BMP4 (left) and GPX2 (right) in lung adenocarcinoma and lung squamous cell carcinoma. B. Stage plot of BMP4 (left) and GPX2 (right) in lung adenocarcinoma. C. Kaplan-Mayer plotting for survival analysis, divide patients into two groups: high risk and low risk according to BMP4 downregulation (low TPM) (left) and GPX2 upregulation (high TPM) (right) by recruiting GAPDH as the normalizer gene. TPM; Transcription per million.
Discussion
Lung cancer is described as the most common cancer in both women and men worldwide (18), which leads to the death of 84% of patients (2, 4). Among the mentioned subtypes of this cancer, NSCLC adenocarcinoma is the most diagnosed type of lung cancer (19). Recently, molecular alterations have been suggested as a significant factor to be considered for the cancer treatment instead of other invasive therapeutic methods. Hence, identification of molecular alterations in the NSCLC ADC could suggest candidate genes for treatment and diagnosis that is aimed in the present research. Microarray data in GEO provide a platform for analyzing gene expressions useful for considering molecular changes in cancers (20). In the present study, we have analyzed GSE41272, GSE42127, and GSE75037 (based on GPL6884) in 6 groups, and then common DEGs were identified by Venn in each group. Group 1 (stage IA vs. IB) had the highest number of DEGs suggesting that the molecular reprogramming in the LUAD mostly takes place in the early tumorigenesis. Next, pathway enrichment analysis was performed and showed that upregulated DEGs were enriched in mineral absorption, response to metal ions, zinc homeostasis and TAp63 pathway and downregulated DEGs were enriched in nitrogen metabolism, erythrocytes take up oxygen and release carbon dioxide, suppression of HMGB1 mediated inflammation by THBD and Oxygen/ carbon dioxide exchange in erythrocytes using KEGG, Reactome, Wikipathways and BioPlanet databases respectively. Considering involved genes in these pathways suggested that the homeostasis of the metal ions and the metabolism of oxygen and carbon dioxide were important pathways for the NSCLC ADC tumor development. This result is consistent with the observation of carbonate dehydratase activity and cellular response to zinc ion for downregulated and upregulated DEGs via GO analysis by DAVID and Enrichr. By analyzing the biological process in three data series separately, we observed promoted cell proliferation and inhibited apoptosis in all stages of NSCLC ADC, which is in agreement with the tumor progression. Also, the undifferentiation of epithelial cells was observed in the final tumor development to stage IV, which seems to contribute to EMT and distant metastasis.
Subsequently, analyzing of the PPI network by CentiScape2.2 indicated BMP4 as the critical gene in NSCLC ADC tumor development. According to the GEO and TCGA, BMP4 was downregulated during cancer progression to the stage IB. BMP4 has been identified that can act as a tumor suppressor in many cancers through its anti-proliferative, growth inhibitory, metastasis suppressive, and apoptosis-inducing capability (21). Similarly, research on lung cancer demonstrated overexpression of BMP4 leads to premature senescence of cancerous cells via the Smad signaling pathway by inducing BMP4 expression with adriamycin (22). In agreement with this, Wen et al. reported that BMP4 was suppressed in the NSCLC squamous cell carcinoma. It occurs via Sox2 protein that promotes the SCC cell proliferation (21), which is intriguingly consistent with our results.
BMP4 protein is a member of the TGF-β superfamily that has been reported as both tumor suppressor and tumor promoter pathways. In the early stages, TGF-β has been proven to have tumor suppressor activity via cell cycle arrest and inducing apoptosis (23) that is consistent with the Panther and DAVID results for BP. Thus, the downregulation of BMP4 in the TGF-β signaling pathway seems to be essential for primary cancer progressing to the stage IB, which suggests a tumor suppressor activity of BMP4 in the early stages of NSCLC ADC.
Conversely, Mihajlović et al. (24) indicated a promigratory and pro-EMT activity for the BMP4 in the NSCLC within BMP receptor type I SMAD dependent signaling by screening LCLC-103H cells, which is compatible with the tumor promoter activity of TGF-β signaling in the final stages (23).
We also observed GPX2 as the most upregulated gene (Log FC=6.6). A previous study has suggested GPX2 as an oncogene due to its capability of inducing tumor initiation, growth, development, and metastasis (25). Besides, GPX2 overexpression was observed in the breast (26), liver (27), gastric (28), nasopharyngeal (29), and esophageal SCC (30). Although, some other studies have reported a positive correlation between GPX2 expression and cell proliferation in the colorectal cancer and castration-resistant prostate cancer (31, 32) reduced expression of GPX2 was associated with advanced tumor status in the patients with urothelial carcinomas of the upper urinary tract and urinary bladder (33). Furthermore, Li et al. (34) showed that GPX2 expression leads to the MMP2 and MMP9 expression via activating the Wnt pathway, which subsequently induces epithelial transition to mesenchymal, metastasis, and tumor invasion in the pancreatic tumor, that is interestingly consistent with the upregulation of GPX2 during stage IIIB to IV progression, which was attained in our results. A previous study by Naiki-Ito et al. (26) reported that GPX2 played an important role in the mammary carcinogenesis, including humans and rodents. Furthermore, Huang et al. (35) observed that suppression of GPX2 via YAP pathway relieves lung SCC development. Despite that, a study of the NSCLC cell lines reported that the downregulation of GPX2 is necessary for EMT induction (36). Moreno Leon et al. (37) found that GPX2 overexpression increases glucose uptake due to its correlated expression with ABCB6, which was confirmed by GEPIA, suggesting that GPX2 may modulate the metabolic alteration in the LUAD. Evaluated glucose uptake is required for cancer cell metabolism by providing energy via high rated glycolysis (38, 39).
GPX2, which belongs to the family of glutathione peroxidases, is involved in the maintenance of the redox balance in cells, and it can fulfill its function by protecting cancerous cells against ROS that increases in the tumor microenvironment and damages various macromolecules and induces apoptosis, which was approved via Panther (32, 40). ROS reduction is operated via oxidation of glutathione by glutathione peroxidases in the glutathione metabolism pathway (40), which was also observed in our KEGG results. In addition, in previous research, the glutathione metabolism pathway has been implicated to induce EMT in the NSCLC (36) that is compatible with our GO analysis in the Panther and DAVID. Therefore, GPX2, in the final stages of NSCLC ADC, may be considered to be an oncogene due to its role in providing excessive glucose for tumor cells and glutathione metabolism pathway by inducing EMT and inhibiting apoptosis.
Conclusion
By the integration of 3 microarrays with bioinformatics analysis, we suggested BMP4 as a tumor suppressor via inducing apoptosis and arresting cell cycle in the early stages, and GPX2 as an oncogene by inhibiting apoptosis and promoting EMT in advanced stages. They were the two crucial dysregulated genes in the course of tumor development in experimental design, in vitro and in vivo, to explore the role of these altered genes and to employ them for therapeutic approaches.
Supplementary PDF
Acknowledgements
We appreciate our colleagues for their helpful effort and valuable comments on this research. The authors confirm that methods were performed in accordance with relevant guidelines and regulations. This research did not receive any specific grant from funding agencies in the public, commercial, or not-for-profit sectors. The authors have declared that they have no conflict of interest.
Authors’ Contributions
M.H.D.N., A.E.S., A.B.; Designed the project. S.T., A.E.S.; Project supervisor. M.H.D.N., R.A.D., P.Gh.T.; Bioinformatics data analyzer and manuscript writers. A.B., A.A.M., M.H.N., H.M., A.R.; Helper in cancer biology, lung cancer pathology and molecular biology aspects of the research respectively. A.R.; Edits the main text grammatically and revised it. All authors read and approved the final manuscript.
References
- 1.Torre LA, Siegel RL, Jemal A. Lung cancer statistics. Adv Exp Med Biol. 2016;893:1–19. doi: 10.1007/978-3-319-24223-1_1. [DOI] [PubMed] [Google Scholar]
- 2.Bray F, Ferlay J, Soerjomataram I, Siegel RL, Torre LA, Jemal A. Global cancer statistics 2018: GLOBOCAN estimates of incidence and mortality worldwide for 36 cancers in 185 countries. CA Cancer J Clin. 2018;68(6):394–424. doi: 10.3322/caac.21492. [DOI] [PubMed] [Google Scholar]
- 3.Collins LG, Haines C, Perkel R, Enck RE. Lung cancer: diagnosis and management. Am Fam Physician. 2007;75(1):56–63. [PubMed] [Google Scholar]
- 4.Nasim F, Sabath BF, Eapen GA. Lung cancer. Med Clin North Am. 2019;103(3):463–473. doi: 10.1016/j.mcna.2018.12.006. [DOI] [PubMed] [Google Scholar]
- 5.Molina JR, Yang P, Cassivi SD, Schild SE, Adjei AA. Non-small cell lung cancer: epidemiology, risk factors, treatment, and survivorship. Mayo Clin Proc. 2008;83(5):584–594. doi: 10.4065/83.5.584. [DOI] [PMC free article] [PubMed] [Google Scholar]
- 6.Ginsberg MS, Grewal RK, Heelan RT. Lung cancer. Radiol Clin North Am. 2007;45(1):21–43. doi: 10.1016/j.rcl.2006.10.004. [DOI] [PubMed] [Google Scholar]
- 7.de Groot P, Munden RF. Lung cancer epidemiology, risk factors, and prevention. Radiol Clin North Am. 2012;50(5):863–876. doi: 10.1016/j.rcl.2012.06.006. [DOI] [PubMed] [Google Scholar]
- 8.Rodriguez-Canales J, Parra-Cuentas E, Wistuba II. Diagnosis and molecular classification of lung cancer. Cancer Treat Res. 2016;170:25–46. doi: 10.1007/978-3-319-40389-2_2. [DOI] [PubMed] [Google Scholar]
- 9.Zheng M. Classification and pathology of lung cancer. Surg Oncol Clin N Am. 2016;25(3):447–468. doi: 10.1016/j.soc.2016.02.003. [DOI] [PubMed] [Google Scholar]
- 10.Tsim S, O’Dowd CA, Milroy R, Davidson S. Staging of non-small cell lung cancer (NSCLC): a review. Respir Med. 2010;104(12):1767–1774. doi: 10.1016/j.rmed.2010.08.005. [DOI] [PubMed] [Google Scholar]
- 11.Detterbeck FC, Boffa DJ, Tanoue LT. The new lung cancer staging system. Chest. 2009;136(1):260–271. doi: 10.1378/chest.08-0978. [DOI] [PubMed] [Google Scholar]
- 12.Woodard GA, Jones KD, Jablons DM. Lung cancer staging and prognosis. Cancer Treat Res. 2016;170:47–75. doi: 10.1007/978-3-319-40389-2_3. [DOI] [PubMed] [Google Scholar]
- 13.Dachs GU, Dougherty GJ, Stratford IJ, Chaplin DJ. Targeting gene therapy to cancer: a review. Oncol Res. 1997;9(6-7):313–325. [PubMed] [Google Scholar]
- 14.Garnis C, Buys TP, Lam WL. Genetic alteration and gene expression modulation during cancer progression. Mol Cancer. 2004;3:9–9. doi: 10.1186/1476-4598-3-9. [DOI] [PMC free article] [PubMed] [Google Scholar]
- 15.Anisimov SV. Application of DNA microarray technology to gerontological studies. Methods Mol Biol. 2007;371:249–265. doi: 10.1007/978-1-59745-361-5_19. [DOI] [PubMed] [Google Scholar]
- 16.Hanai T, Hamada H, Okamoto M. Application of bioinformatics for DNA microarray data to bioscience, bioengineering and medical fields. J Biosci Bioeng. 2006;101(5):377–384. doi: 10.1263/jbb.101.377. [DOI] [PubMed] [Google Scholar]
- 17.Szklarczyk D, Gable AL, Lyon D, Junge A, Wyder S, Huerta-Cepas J, et al. STRING v11: protein-protein association networks with increased coverage, supporting functional discovery in genome-wide experimental datasets. Nucleic Acids Res. 2019;47(D1):D607–D613. doi: 10.1093/nar/gky1131. [DOI] [PMC free article] [PubMed] [Google Scholar]
- 18.Romaszko AM, Doboszyńska A. Multiple primary lung cancer: a literature review. Adv Clin Exp Med. 2018;27(5):725–730. doi: 10.17219/acem/68631. [DOI] [PubMed] [Google Scholar]
- 19.Cersosimo RJ. Lung cancer: a review. Am J Health Syst Pharm. 2002;59(7):611–642. doi: 10.1093/ajhp/59.7.611. [DOI] [PubMed] [Google Scholar]
- 20.Virtanen C, Woodgett J. Clinical uses of microarrays in cancer research. Methods Mol Med. 2008;141:87–113. doi: 10.1007/978-1-60327-148-6_6. [DOI] [PMC free article] [PubMed] [Google Scholar]
- 21.Fang WT, Fan CC, Li SM, Jang TH, Lin HP, Shih NY, et al. Downregulation of a putative tumor suppressor BMP4 by SOX2 promotes growth of lung squamous cell carcinoma. Int J Cancer. 2014;135(4):809–819. doi: 10.1002/ijc.28734. [DOI] [PubMed] [Google Scholar]
- 22.Su D, Zhu S, Han X, Feng Y, Huang H, Ren G, et al. BMP4-Smad signaling pathway mediates adriamycin-induced premature senescence in lung cancer cells. J Biol Chem. 2009;284(18):12153–12164. doi: 10.1074/jbc.M807930200. [DOI] [PMC free article] [PubMed] [Google Scholar]
- 23.Colak S, Ten Dijke P. Targeting TGF-β signaling in cancer. Trends Cancer. 2017;3(1):56–71. doi: 10.1016/j.trecan.2016.11.008. [DOI] [PubMed] [Google Scholar]
- 24.Mihajlović J, Diehl LAM, Hochhaus A, Clement JH. Inhibition of bone morphogenetic protein signaling reduces viability, growth and migratory potential of non-small cell lung carcinoma cells. J Cancer Res Clin Oncol. 2019;145(11):2675–2687. doi: 10.1007/s00432-019-03026-7. [DOI] [PubMed] [Google Scholar]
- 25.Du H, Chen B, Jiao NL, Liu YH, Sun SY, Zhang YW. Elevated glutathione peroxidase 2 expression promotes cisplatin resistance in lung adenocarcinoma. Oxid Med Cell Longev. 2020;2020:7370157–7370157. doi: 10.1155/2020/7370157. [DOI] [PMC free article] [PubMed] [Google Scholar]
- 26.Naiki-Ito A, Asamoto M, Hokaiwado N, Takahashi S, Yamashita H, Tsuda H, et al. Gpx2 is an overexpressed gene in rat breast cancers induced by three different chemical carcinogens. Cancer Res. 2007;67(23):11353–11358. doi: 10.1158/0008-5472.CAN-07-2226. [DOI] [PubMed] [Google Scholar]
- 27.Liu D, Sun L, Tong J, Chen X, Li H, Zhang Q. Prognostic significance of glutathione peroxidase 2 in gastric carcinoma. Tumour Biol. 2017;39(6):1010428317701443–1010428317701443. doi: 10.1177/1010428317701443. [DOI] [PubMed] [Google Scholar]
- 28.Liu T, Kan XF, Ma C, Chen LL, Cheng TT, Zou ZW, et al. GPX2 overexpression indicates poor prognosis in patients with hepatocellular carcinoma. Tumour Biol. 2017;39(6):1010428317700410–1010428317700410. doi: 10.1177/1010428317700410. [DOI] [PubMed] [Google Scholar]
- 29.Liu C, He X, Wu X, Wang Z, Zuo W, Hu G. Clinicopathological and prognostic significance of GPx2 protein expression in nasopharyngeal carcinoma. Cancer Biomark. 2017;19(3):335–340. doi: 10.3233/CBM-160542. [DOI] [PubMed] [Google Scholar]
- 30.Lei Z, Tian D, Zhang C, Zhao S, Su M. Clinicopathological and prognostic significance of GPX2 protein expression in esophageal squamous cell carcinoma. BMC Cancer. 2016;16:410–410. doi: 10.1186/s12885-016-2462-3. [DOI] [PMC free article] [PubMed] [Google Scholar]
- 31.Emmink BL, Laoukili J, Kipp AP, Koster J, Govaert KM, Fatrai S, et al. GPx2 suppression of H2O2 stress links the formation of differentiated tumor mass to metastatic capacity in colorectal cancer. Cancer Res. 2014;74(22):6717–6730. doi: 10.1158/0008-5472.CAN-14-1645. [DOI] [PubMed] [Google Scholar]
- 32.Naiki T, Naiki-Ito A, Asamoto M, Kawai N, Tozawa K, Etani T, et al. GPX2 overexpression is involved in cell proliferation and prognosis of castration-resistant prostate cancer. Carcinogenesis. 2014;35(9):1962–1967. doi: 10.1093/carcin/bgu048. [DOI] [PubMed] [Google Scholar]
- 33.Chang IW, Lin VC, Hung CH, Wang HP, Lin YY, Wu WJ, et al. GPX2 underexpression indicates poor prognosis in patients with urothelial carcinomas of the upper urinary tract and urinary bladder. World J Urol. 2015;33(11):1777–1789. doi: 10.1007/s00345-015-1522-7. [DOI] [PubMed] [Google Scholar]
- 34.Li F, Dai L, Niu J. GPX2 silencing relieves epithelial-mesenchymal transition, invasion, and metastasis in pancreatic cancer by downregulating Wnt pathway. J Cell Physiol. 2020;235(11):7780–7790. doi: 10.1002/jcp.29391. [DOI] [PubMed] [Google Scholar]
- 35.Huang H, Zhang W, Pan Y, Gao Y, Deng L, Li F, et al. YAP suppresses lung squamous cell carcinoma progression via deregulation of the DNp63-GPX2 axis and ROS accumulation. Cancer Res. 2017;77(21):5769–5781. doi: 10.1158/0008-5472.CAN-17-0449. [DOI] [PubMed] [Google Scholar]
- 36.Matadamas-Guzman M, Zazueta C, Rojas E, Resendis-Antonio O. Analysis of epithelial-mesenchymal transition metabolism identifies possible cancer biomarkers useful in diverse genetic backgrounds. Front Oncol. 2020;10:1309–1309. doi: 10.3389/fonc.2020.01309. [DOI] [PMC free article] [PubMed] [Google Scholar]
- 37.Moreno Leon L, Gautier M, Allan R, Ilié M, Nottet N, Pons N, et al. The nuclear hypoxia-regulated NLUCAT1 long non-coding RNA contributes to an aggressive phenotype in lung adenocarcinoma through regulation of oxidative stress. Oncogene. 2019;38(46):7146–7165. doi: 10.1038/s41388-019-0935-y. [DOI] [PubMed] [Google Scholar]
- 38.Vanhove K, Graulus GJ, Mesotten L, Thomeer M, Derveaux E, Noben JP, et al. The metabolic landscape of lung cancer: new insights in a disturbed glucose metabolism. Front Oncol. 2019;9:1215–1215. doi: 10.3389/fonc.2019.01215. [DOI] [PMC free article] [PubMed] [Google Scholar]
- 39.Wang Y, Xia Y, Lu Z. Metabolic features of cancer cells. Cancer Commun (Lond) 2018;38(1):65–65. doi: 10.1186/s40880-018-0335-7. [DOI] [PMC free article] [PubMed] [Google Scholar]
- 40.Bansal A, Simon MC. Glutathione metabolism in cancer progression and treatment resistance. J Cell Biol. 2018;217(7):2291–2298. doi: 10.1083/jcb.201804161. [DOI] [PMC free article] [PubMed] [Google Scholar]
Associated Data
This section collects any data citations, data availability statements, or supplementary materials included in this article.


