Abstract
Given a spherical set of points, we consider the detection of cocircular subsets of the data. We distinguish great circles from small circles, and develop algorithms for detecting cocircularities of both types. The suggested approach is an extension of the Hough transform. We address the unique parameter-space quantization issues arising due to the spherical geometry, present quantization schemes, and evaluate the quantization-induced errors. We demonstrate the proposed algorithms by detecting cocircular cities and airports on Earth’s spherical surface. These results facilitate the detection of great and small circles in spherical images.
Keywords: hough transform, spherical point set, circle detection, great circle, small circle
1. Introduction
Given a spherical set of points, consider the problem of detecting the largest subset of cocircular points, i.e., the largest subset of points lying on the same circle on the sphere. One brute-force solution, related to RANSAC [1], is to examine all possible triplets of points in the point set. Note that each triplet (if not colinear) defines a plane, the intersection of the plane with the sphere defines a circle, and each point in the triplet clearly lies on the circle. The point set can then be searched for additional points lying on that circle. This procedure, where N is the cardinality of the point set, is prohibitive for sizable point sets.
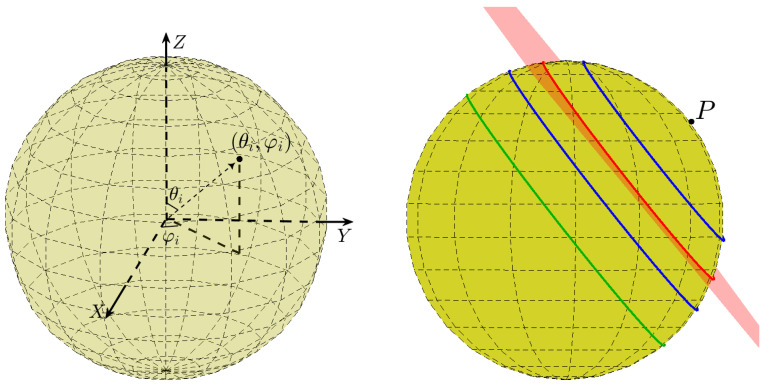
A cocircular subset of a spherical set of points is obviously coplanar. In special cases, the plane passes through the center of the sphere. In such cases, the intersection of the plane and the sphere is referred to as a great circle; see the green circle in Figure 1 (right). In the general case, when the plane does not pass through the center of the sphere, the intersection of the plane and the sphere is referred to as a small circle; see the blue and red circles in Figure 1 (right).
Figure 1.
(Left) The angular coordinates and of a point. (Right) The intersection of the sphere with a plane associated with the primary point P is a circle. The intersection of the sphere with each of the associated parallel planes is a different circle with a different radius. For example, the red plane of which the normal direction is determined by point P intersects the sphere at the red circle. The parallel plane that passes through the origin of the sphere is a great circle (green).
In the classical Hough transform [2], the problem of finding colinear points in the plane is replaced by the dual problem of finding concurrent lines or curves in a parameter space, often referred to as the Hough space. In practice, the parameter space is quantized and represented by an accumulator array, a voting process takes place, and finding the intersection of lines or curves in the parameter space is implemented as a search for the maximum. The Hough transform is fundamentally robust with respect to outliers, and has been formally associated with the M-estimation methodology for robust regression [3]. The Hough transform has also been related to conformal geometric algebra [4]. The time-complexity of the classical Hough transform is linear in the cardinality N of the dataset. Thus, when looking for the largest co-linear subset in a planar set of points, the Hough transform reduces the computational load from (the cost of checking each possible pair of points in the data; determining the line that connects the pair; and, for each other data-point, testing whether it lies on that line) to .
The suggested approach to finding the largest subset of cocircular points in a spherical set of points is inspired by the Hough transform. Specifically, we characterize the circles (on the sphere) passing through a given point in the spherical set. The characterization is in the form of an equation constraining the parameters of the circles. We then search for the largest intersection of such equations, i.e., for the parameters specifying the circle passing through the largest possible number of points in the set.
As in the classical Hough transform, once the best-supported circle, i.e., the circle passing through the largest possible number of points, has been determined, finding the second-best-supported circle is straightforward. This can be reliably accomplished by identifying the data-points supporting the best circle, removing them from the dataset, and eliminating their contribution to the accumulator array (“unvoting”) [5,6,7]. Circle detection and unvoting can be iterated until all circles are found.
The precise function of the Hough transform is the detection of a geometric primitive, such as a straight line or circle, common to the largest possible subset of points in the dataset. Identifying the relevant points themselves can then be easily accomplished [5], but is not always necessary. Note that it is commonly said that the Hough transform detects geometric primitives in a digital image, but accomplishing this task in an actual image requires edge detection as a preprocessing step.
Images acquired using omnidirectional cameras can be represented as spherical images. Straight line segments in the scene are then transformed to great circle arcs in the spherical image. This has led to some interest in the detection of great circles in spherical images. With this motivation, Vasseur and Mouaddib [8] and Torii and Imiya [9] outlined a Hough algorithm and a randomized Hough algorithm, respectively, for great-circle detection on a sphere. These ideas have modern applications, such as road-line detection in driver-assistance systems [10].
In the detection of vanishing points, the search for convergence points in the image plane can be usefully replaced by the intersection of great circles on the Gaussian sphere [11]. This important task has been addressed using specialized Hough algorithms, leading to developments in spherical tessellation and discretization schemes [12,13] that are also useful in great-circle detection [14,15].
In geophysics, interest in great and small circle fitting arises in the context of volcano distribution analysis [16,17]. In these studies, specialized map projections transform great circles into an exact (gonomonic projection [17]) or approximate (UTM [16]) straight lines, allowing the use of the straight-line Hough transform [2] for great-circle detection. In the context of plate tectonics, Wessel [18] outlined the principles of a Hough transform for great-circle detection in the true spherical domain and sketched its generalization to small-circle detection. Wessel’s insightful concepts [18] have so far received surprisingly little attention.
In this paper, we present comprehensive solutions for the detection of cocircular subsets of a spherical set of points. We describe a geometric framework that supports both great- and small-circle detection and provide algorithms for both cases. We address the unique parameter-space quantization issues arising due to the spherical geometry, present quantization schemes, and evaluate the quantization-induced errors. We demonstrate the proposed algorithms by detecting cocircular cities and airports on Earth’s spherical surface.
2. Fundamentals
In this article, given a set of co-spherical points, we present a way to detect the circle that passes through the largest possible number of points in the set. It is easy to show that the circle itself necessarily lies on the sphere.
A point in 3D space can be defined by its spherical coordinates, consisting of the radial distance R from the origin, the polar angle , and the azimuthal angle ; see Figure 1 (left). Assuming co-spherical points, point i is determined by the angular coordinates and alone.
Given an anchor point in 3D space and a normal direction, one can determine a plane that passes through the anchor point and fits the normal direction. By itself, a normal direction defines a set of parallel planes.
Viewing the angular coordinates of a (primary) point on the sphere as a normal direction therefore associates a set of parallel planes with that point. The intersection of each such plane with the sphere is a (primary) circle, as shown in Figure 1 (right).
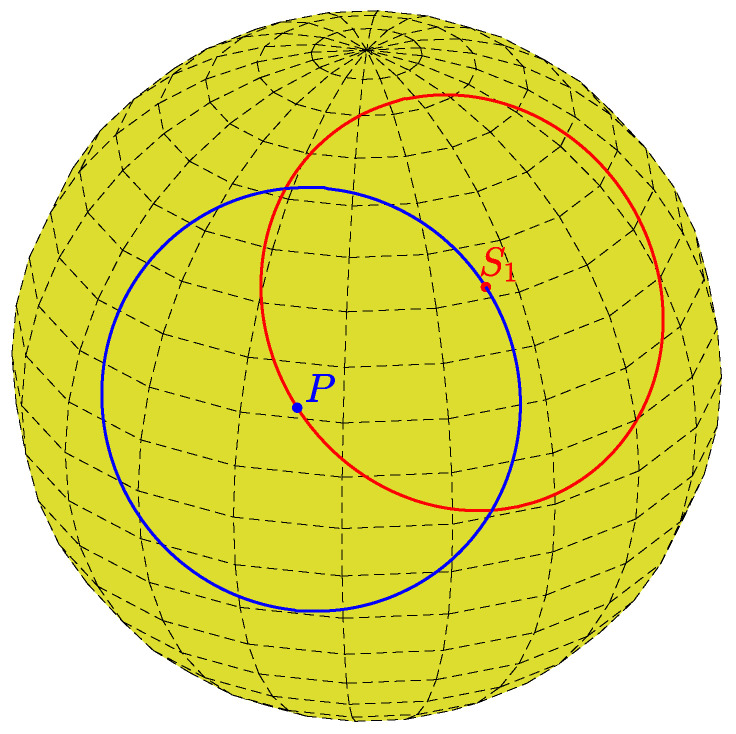
Any (secondary) point on a primary circle of radius r (point in Figure 2), viewed as a normal direction, defines a secondary circle of radius r passing through the primary point (point P in Figure 2). Thus, given a primary point and a radius r, each secondary point is the center of a circle of radius r passing through the primary point.
Figure 2.
Each primary point (blue point P) defines a primary circle of radius r (blue). Each secondary point, such as the red point on the primary circle, defines a secondary circle of radius r (red) passing through the primary point.
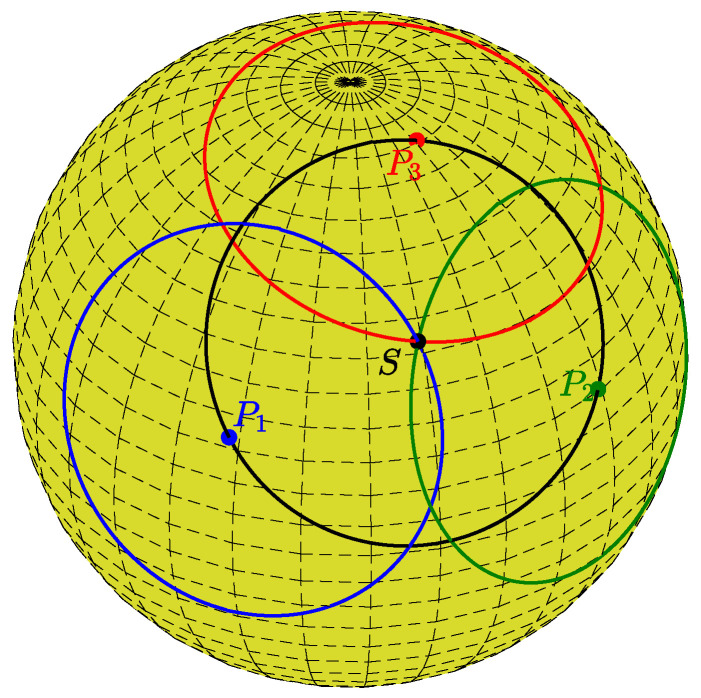
Since this property holds for any secondary point on a primary circle, a set of primary circles for primary points located on the same circle will intersect at a specific secondary point, which is the center of the circle passing through all the primary points. This is illustrated in Figure 3, where the red, blue, and green points are primary points on the same (black) circle of radius r. The corresponding primary circles of radius r intersect at the black secondary dot S, which defines the secondary circle (black) passing through all the primary points.
Figure 3.
The red, green, and blue points are primary points located on the same circle (black). Each primary point defines a primary circle. All the primary circles intersect at a secondary point (black point S). That point defines a secondary circle (black) passing through the primary points.
Now, given a set of unit co-spherical points, i.e., a set of points located on the unit sphere, we look for the normal direction that determines the circle of (pre-defined) radius r passing through the largest possible subset of points in S. The problem amounts to finding the largest co-circular (with given radius r) subset of S. We approach it by viewing each point as a primary point corresponding to a primary circle of radius r. We view as a secondary point corresponding to a secondary circle on which a point lies. We select , compatible with the largest possible number of primary points . In other words, we select , which is the largest intersection of primary circles.
As just presented, the problem and its solution strategy can be regarded as a generalization of the classical Hough transform for circles of known radius in the plane. In principle, one might indeed solve the problem by allocating a memory array on a spherical surface and incrementing memory cells on the primary circles corresponding to the data-set (voting). The memory cell with the largest accumulation will then correspond to , which is the largest intersection of primary circles, i.e., the normal direction defining the circle of radius r passing through the largest possible subset of points in S.
In practice, working with spherical memory arrays is highly inconvenient. We therefore carry out the computation using a planar memory array, where the orthogonal planar axes are and . Note, however, that the mapping of the conceptual spherical memory array to a planar array is non-trivial in both theory and practice, as is the drafting of planar maps of planet Earth [19]. As will be seen, this difficulty reveals itself in the context of the parameter-space quantization.
We can summarize these concepts as follows: Given a (unit) sphere and a radius r,
Property 1.
A primary point on the sphere corresponds to a curve in the parameter plane. The curve can be viewed as the mapping of the primary circle associated with the primary point from the sphere to the plane.
Property 2.
A point in the parameter plane corresponds to a secondary circle of radius r on the sphere.
Property 3.
Primary points lying on the same circle of radius r on the sphere correspond to curves through a common point in the parameter plane.
In the next section, we determine as a function of (or as a function of ). This is the voting pattern associated with a data point .
3. The Voting Pattern
3.1. Derivation of the Voting Pattern
Consider a primary point on a unit sphere. We proceed to express the equation of the corresponding family of primary circles lying on parallel planes, as illustrated in Figure 1 (right). Generally, the equation of a plane in 3D space is of the form
| (1) |
Note that is the normal to the plane, and if it is normalized such that , then d is the distance of the plane from the origin.
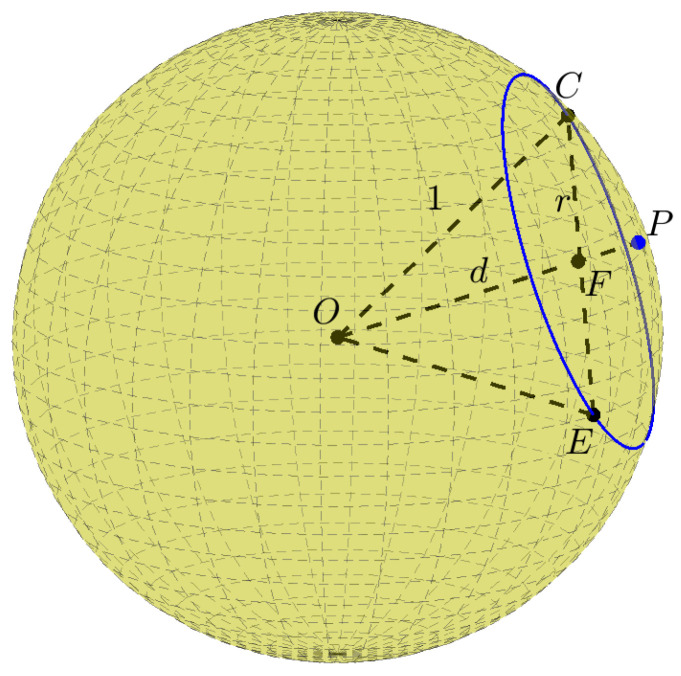
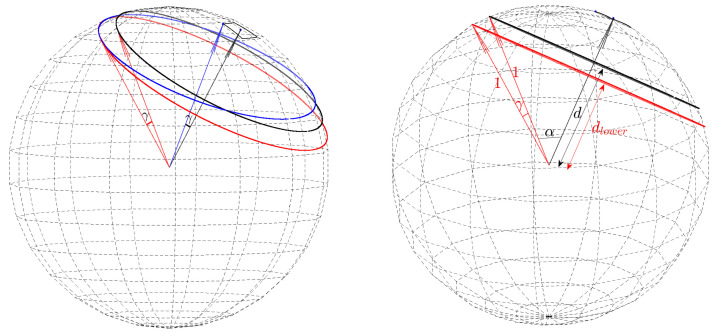
Using Pythagoras’ theorem, for a unit sphere, the relation between d and the radius r of the circle is (see Figure 4):
| (2) |
Figure 4.
The relation between d and the circle radius r. P is a primary point on a unit sphere. The blue circle is the primary circle of radius r defined by P. The triangle is right-angled.
In Equation (1), is the normal to the plane. Here the normal is defined by the primary point. In terms of its angular coordinates ,
| (3) |
Thus, the equation of the plane containing the primary circle is:
| (4) |
The primary circle itself is the intersection of this plane with the unit sphere. In spherical coordinates, a point on the unit sphere is
| (5) |
Substituting in the plane Equation (4) we obtain
| (6) |
Rearranging this, we obtain a relation between the angular coordinates of secondary points on the primary circle.
| (7) |
| (8) |
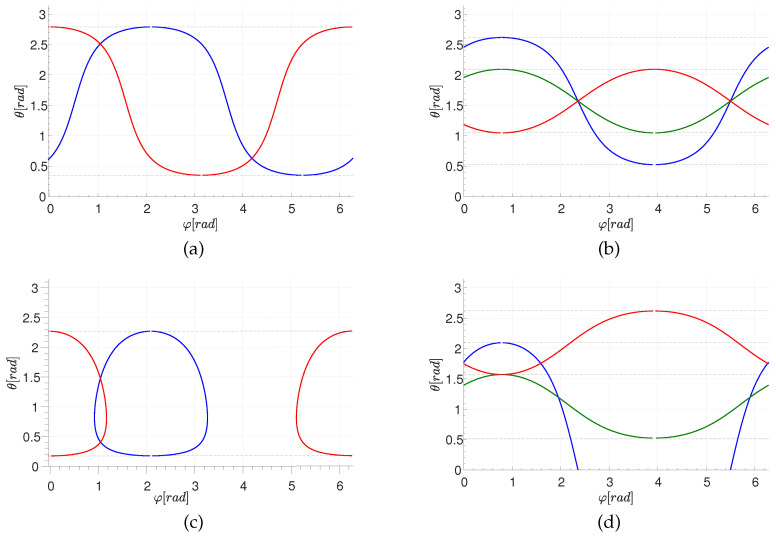
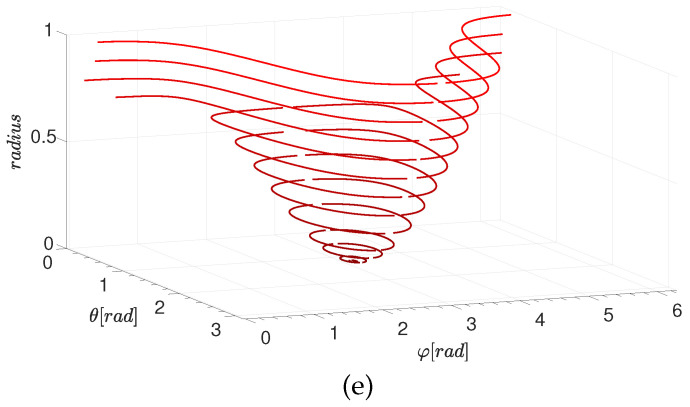
For a given primary point and a plane distance d, Equation (8) determines the azimuthal angle of a secondary point in terms of the polar angle . The two solutions reflect the fact that a circle of latitude (defined by ) that intersects a primary circle (excluding the two circles of latitude that osculate the primary circle) intersects the primary circle at two points; see Figure 2 and Figure 3. The dependence on n is due to the periodicity of . Figure 5 shows the locus of {,} pairs for selected values of , , and d.
Figure 5.
The locus of {,} pairs for selected values of , , and d. (a,b) The case of . (a): for two primary points with ; blue: , red: . (b): for three primary points with ; blue: , red: , green: . (c,d) Same as (a,b) but for . (e) Illustrating the dependence on . Here the primary point is .
As shown in Figure 5 (top), for the case of a great circle , we can express as a single-valued function of . Substituting in Equation (7),
| (9) |
Solving for ,
| (10) |
3.2. Domain and Range of the Voting Pattern
We have so far seen that for a given primary point , the coordinate of a secondary point is obtained by substituting the coordinate in Equation (8). In this subsection, we proceed to show the dependence of the domain and the range of as a function of , as represented by Equation (8), on the primary point coordinates and the distance d.
As shown in Figure 4, for a given distance , each (spherical) circle of radius r (Equation (2)) on a unit sphere is uniquely defined by one (spherical) point on the unit sphere. Any such spherical point can be represented by the spherical coordinates and . Therefore, any spherical circle with radius is uniquely defined by and .
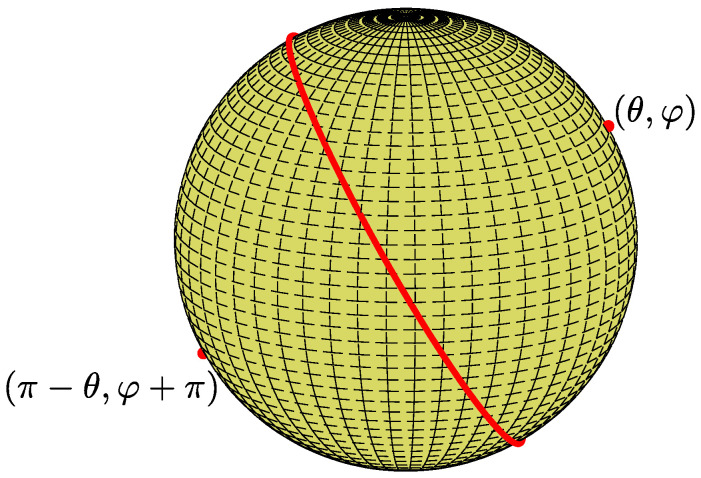
In the case of great circles, , the points and (red points in Figure 6) define the same plane. In other words, each great circle (red) is represented by two spherical points, one at each hemisphere. Consider the subset of spherical points in the range and . There is a bijective transformation from this subset to the set of great circles on the unit sphere. To conclude, each spherical point with and uniquely defines a great circle.
Figure 6.
In the case of the great circles, , two antipodal spherical points (red), one at each hemisphere, define the same great circle.
Returning to the general case, for a given primary point , the spherical points that satisfy Equation (8) represent the secondary circles on which the primary point lies. We are interested in secondary points with , so n is selected such that .
Given a primary point and d, the domain of Equation (8) consists of coordinates of the secondary points. The value of the secondary points are such that the argument of the inverse cosine function satisfies
| (11) |
Denote by the limiting values of , i.e., the values corresponding to the two circles of latitude osculating the primary circle:
| (12) |
We choose n such that . Therefore, given a primary point and a distance d, the coordinate of any point on the secondary circle lies between and . Note that the largest difference between (of the primary point) and of a secondary point is obtained for any of the limiting values . The difference is the angle between the radius vectors pointing to the primary point and to either of the two points of osculation, and this angle is equal to .
3.3. Sphere of Radius R
The result expressed by Equations (8) and (10) can be easily generalized from the unit sphere to a sphere of radius R. The vector representing a point on the sphere (Equation (5)) is multiplied by R. Substituting in Equation (4), we obtain
where, generalizing Equation (2), d is now related to the radius of the circle by . Thus, Equations (6) and (8) will hold if d is replaced by , where
So, technically, an algorithm to search for circles of radius r on a unit sphere can be readily applied to spheres of radius R by normalizing the circle radius r by R.
4. Algorithm for Great-Circle Detection
In this section, we present an algorithm for finding great circles on a sphere. More accurately, given a set of N co-spherical points, we find the great circle that passes through the largest subset of S. Specifically, the (secondary) great circle passing through the largest possible subset of (primary) points is defined by the (secondary) point . The algorithm belongs to the Hough transform family, since it is based on voting in a quantized parameter space.
The parameter plane is is limited to the rectangle and tessellated by rectangular cells. Note that, in the case of great circles, Equation (10) specifies as a function of , hence the parameterization is expressed as . In the general case, where Equation (8) determines as a function of , the parametrization will be written as . Each cell represents a subset of (secondary) spherical points, and is of the form and , where is the center of the cell. In common Hough algorithms, the cells are of uniform shape and size, their centers form a set of rectangular grid points, and each cell is represented by an accumulator in a memory array, referred to as the accumulator array.
For each (primary) point in the data-set, we compute as a function of (Equation (10)) and increment the accumulators corresponding to cells along the curve. The accumulation stage of the algorithm can be visualized as drawing the discretized curves in the parameter plane for all primary points. Eventually, the indices of the accumulator with the maximal reading represent the parameters of the great circle. Rather than determining all the cells that the curve passes through, the common Hough transform practice is to approximate the process by sampling the argument () and quantizing the function (). This leads in our case to Algorithm 1:
| Algorithm 1: great-circle detection |
| Initialize the matrix (accumulator array) M with zeros. For each primary point 1 to N For each step Calculate by Equation (10). Round each to the nearest integer multiple of . Increment the accumulator of M corresponding to . Find and corresponding to the entry with the largest accumulation in M. |
The computational complexity of the algorithm is linear in the number of primary points N. With rectangular tessellation of the parameter plane, the computational load also depends on the number of discrete values, , and on the number of discrete values, . Specifically, the computational complexity of the voting stage is and that of the search stage is .
Note that the approximation, sampling and quantizing rather than determining the cells that the curve passes through, leads to a pitfall. Since the magnitude of the slope of can be large, the discretized curves may not be digitally connected [20]. Thus, they may not intersect in the digital domain even though they do intersect in the continuous domain. This hazard may not be apparent in cases where N is large and intersections are dense, but may manifest itself in cases where N is small. This may then lead to peak-spreading in the parameter plane, and consequently to misdetection and poor localization of peaks. In contrast, if the approximation is discarded and the cells intersected by the curve are incremented, the discretization of the curve amounts to the classical square quantization scheme [21], and the discretized curve is digitally connected.
5. Algorithm for General (Radius r) Circle Detection on a Sphere
We now consider the more general problem—detecting circles of any given radius r on the sphere. Here, the given circle radius may not coincide with the radius of the sphere; hence, the circles to be detected are not necessarily great circles. Formally, given a set of co-spherical points and a circle radius r, we find the circle of radius r passing through the largest subset of S. In this case, the parameter plane is limited to a larger rectangle . We compute and as a function of for each primary point using Equation (8), and increment the accumulators corresponding to cells intersected by the curves. Approximating the process by sampling the argument and quantizing the functions leads to Algorithm 2:
| Algorithm 2: General (any given radius r) circle detection on a sphere |
|
Initialize the matrix (accumulator array) M with zeros. Normalize the radius r by the sphere radius R. Calculate d by Equation (2). For each primary point 1 to N For each step If satisfies Equation (11) then Calculate and by Equation (8). Round to the nearest integer multiples of . Increment the accumulators of M corresponding to . Find and corresponding to the entry with the largest accumulation in M. |
Here the computational complexity of the voting stage is and that of the search stage is again , where in this case . The accumulation stage of Algorithm 2 can be visualized as drawing the discretized curves in the parameter plane for all primary points. As discussed in Section 4, care should again be taken when considering the use of the voting approximation (sampling the argument and quantizing the functions rather than determining the cells that the curves pass through).
6. Parameter-Space Quantization and Error Analysis
6.1. Preliminaries and Motivation
In Hough transform algorithms [2], a data (image) point is mapped into a space of parameters for a class of geometric primitives (such as straight lines). The parameter space is quantized into cells and represented by an array of accumulators. The mapping is carried out by incrementation of the relevant accumulators (voting). Once all data points have voted, a search for the maximum in the accumulator array reveals the parameters of the geometric primitive instance that are best supported by the data.
Parameter space quantization is an essential element of the Hough transform. On the one hand, it determines the resolution of the output parameters. On the other hand, it reflects the tolerance of the algorithm to location errors in the data. Thus, coarse quantization leads to poor output resolution, but quantization that is too fine may lead, in the presence of data location errors, to peak-spreading in the accumulator array and consequent detection errors.
In the Hough transform for straight lines using the normal parameterization, uniform quantization of the parameter space into cells of equal size implies an equal (translation- and rotation-invariant) measure of the infinite set of straight lines represented by each cell [2,22,23]. In the proposed algorithms for great- and small-circle detection on a sphere, the parameter space is (in principle) an isomorphic spherical parameter space. This is analogous to the isomorphism between the image space and the parameter space in the Hough transform for circles of known radius [2]. Note that the area of a cell in the spherical parameter space is, due to rotational symmetry, a rotation-invariant measure of the infinite set of the spherical circles represented by the cell. We therefore wish to quantizate the spherical parameter space into cells of similar area.
6.2. Towards Uniform Spherical Quantization
Working with spherical memory arrays is currently impractical. We therefore carry out the computation using a planar memory array, where the orthogonal planar axes are and . Nevertheless, mapping the conceptual spherical array to a planar array is problematic [19]. Specifically, in the context of parameter-space quantization, uniform (rectangular) quantization in the plane, via uniform quantization of the individual angular coordinates and , corresponds to cells of non-uniform area on the sphere. Assuming small quantization steps and in the plane, the spherical surface area of the corresponding cell at and is approximately
| (13) |
where is largest at the equator, where , and equal to . For non unit spheres, is scaled by where R is the radius.
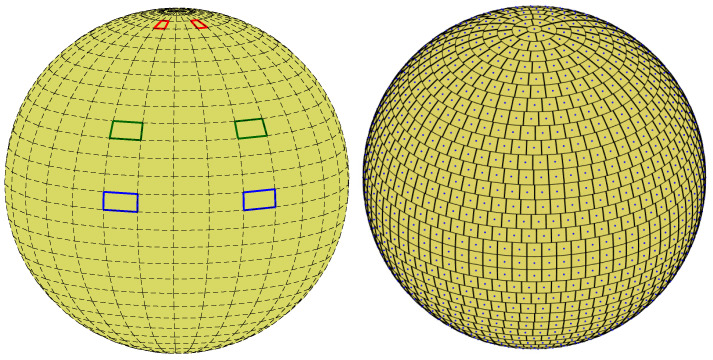
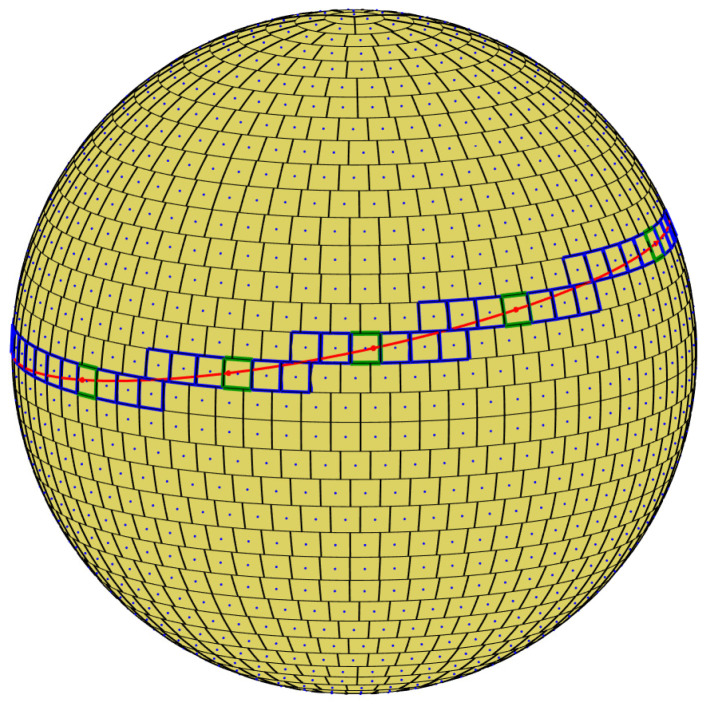
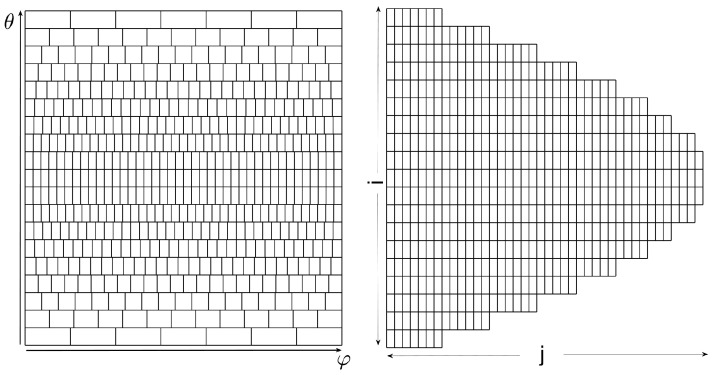
Cells of non-uniform area imply biased voting. One way to handle bias is by normalizing each accumulator count by the area of the corresponding cell. Note, however, that the normalization is associated with singularity at the poles. Lutton et al. [13] suggested using almost-equal-sized cell quantization, letting depend on ; see Figure 7. In our case, almost-equal-sized cell quantization is obtained by letting
| (14) |
where the layer number n is obtained by rounding to the nearest integer, , and is the almost uniform cell size (spherical surface area).
Figure 7.
(Left) Uniform rectangular quantization of the parameter plane, i.e., uniform quantization of the angular coordinates and , corresponds to cells of non-uniform area on the sphere. Cells are small near the poles and large near the equator. (Right) Almost-equal-sized cell quantization.
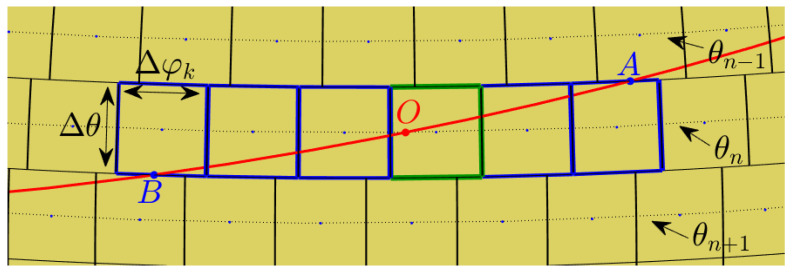
When voting into the (non-uniform) planar array corresponding to almost-equal-sized cells on the sphere, we again need to decide whether to increment all cells through which the continuous voting curve passes, or to employ the approximation—sampling and quantizing in the context of general circles. The two options are illustrated in Figure 8. Incrementing all cells through which the continuous voting curve passes means voting for both the blue and green cells. In contrast, sampling and quantizing generates (the centers of) the green cells alone.
Figure 8.
Incrementing all cells through which the continuous voting curve passes means voting for both the blue and green cells. In contrast, sampling and quantizing generates the centers of the green cells alone.
In our analysis and experiments, the first option is followed, i.e., the approximation is not employed and all cells through which the continuous voting curve passes are incremented. Technically, referring to Figure 9, at layer we increment the accumulator(s) between A and B inclusively.
Figure 9.
At layer we increment the accumulator(s) between A and B inclusively. On the sphere, these points are the intersections of the primary circle with the upper and lower boundaries of the layer. In the respective planar array, the points A and B are the intersections of the voting curve corresponding to the primary circle with the layer. Had the approximation been employed, only the green cell would have been incremented, as its center is the closest (in terms of ) to the intersection of the curve with the sampled value of .
6.3. The Distance of Primary Points from the Common Secondary Circle
Consider the cell centered at that received the largest number of votes from primary points. In other words, the cell centered at is the one intersected by the largest number of primary circles centered at primary points. Due to primary points’ location errors, and due to the finite (i.e., not infinitesimal) cell size, the primary circles intersecting the cell do not usually intersect at a single point within the cell themselves. Thus, typically, the primary points that have voted for the cell are only roughly co-circular. The common secondary circle passing near these primary points is defined by the approximate secondary point , i.e., by the center of the cell.
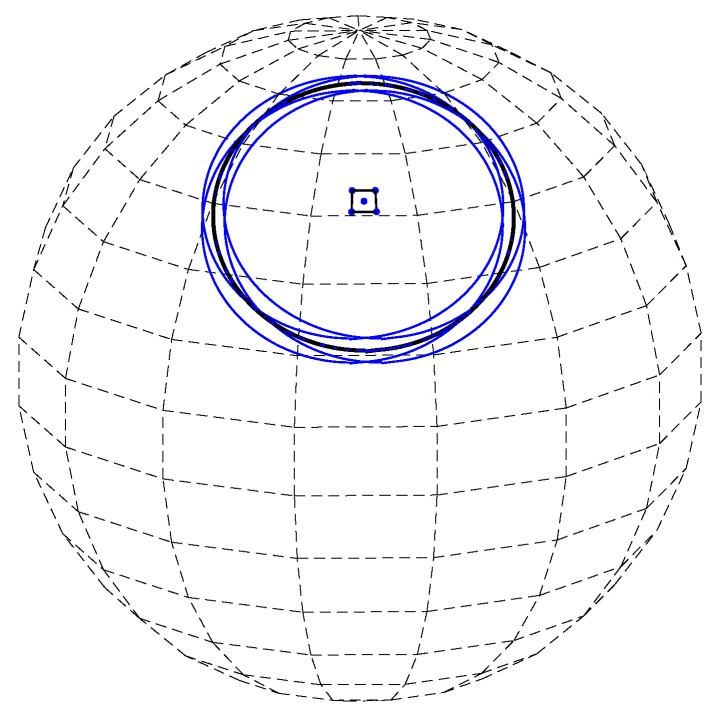
What is the maximum distance of the primary points contributing to the cell from the secondary circle defined by ? Furthermore, how does this depend on the finite cell size? This distance determines, on the one hand, the resolution of the algorithm and, on the other hand, its tolerance to noise (errors) in the location of the data (primary) points. To answer these questions, we calculate the distance between the common secondary circle (the black circle in Figure 10) and the circles defined by the four corners of the cell. The coordinates of the four corners are
where is the layer-dependent quantization step (Equation (14)) at , and the corresponding circles are shown blue in Figure 10.
Figure 10.
A cell centered at . The black circle is the common secondary circle defined by the center of this cell. The four blue circles are the circles defined by the corners of the cell.
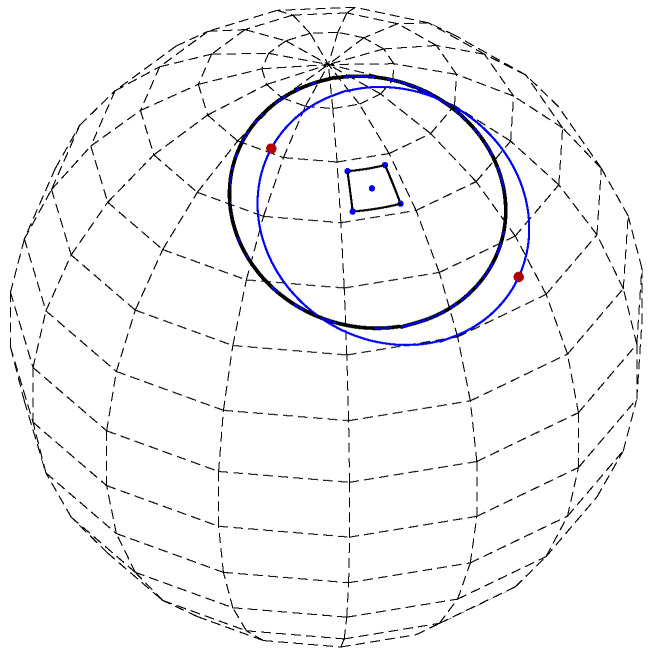
Given one of the (corner) circles defined by a corner point (the blue circle in Figure 11), the largest distance from the common secondary circle is achieved by two critical points (red points in Figure 11) on the corner circle. One critical point is closer than the common secondary circle to the cell center, whereas the other critical point is more distant than the common secondary circle from the cell center.
Figure 11.
A secondary circle (black) and a corner circle (blue). The maximum distance of a point on the corner circle to the secondary circle is achieved by the two critical points (red).
Consider any of the two critical points and its respective closest point on the secondary circle. Viewing the critical point and its closest point as (spherical) radius vectors, let denote the angle between them. Let a denote the radius vector corresponding to the secondary point , and let b denote the radius vector associated with the corner point. Referring to Figure 12 (left), we observe that, since a is normal to the secondary circle and b is normal to the corner circle, is also the angle between a and b. Assuming a unit sphere,
| (15) |
Figure 12.
(Left) The angle between the (red) radius vector pointing at a critical point and its respective closest point on the common secondary circle (black) is equal to the angle between the radius vector (black) corresponding to the secondary point at the center of the cell and the radius vector (blue) associated with a corner point. (Right) The common secondary circle (black) and one of the critical circles (red). The spherical radius vector defined by the angular coordinates of the secondary point passes through the centers of the common secondary circle and the two critical circles, and this radius vector is perpendicular to the planes containing the circles. d and are the distances of the common secondary circle and the (lower) critical circle from the origin of the sphere, respectively.
The angle can be viewed as an angular distance measure between the cell center and one of its corners. With almost-equal-sized cell quantization, is similar between cells and between corner points of a particular cell.
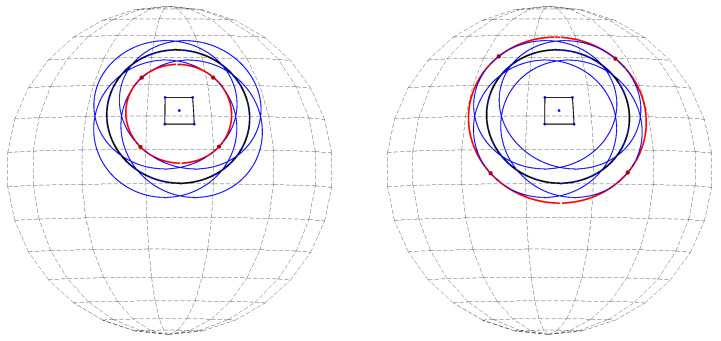
Cells have four corner points. Each corner point is associated with two critical points, one closer to and one more distant from the cell center. The eight critical points can be divided into two subsets, each with four critical points. One subset contains the four critical points, shown red in Figure 13 (left), closer to the cell center, whereas the other subset contains the four critical points more distant from the cell center, shown in red in Figure 13 (right). The angular distance between any of the eight critical points and its closest point on the common secondary circle is similar. This means that the four critical points in each of the two subsets are nearly co-circular. The two circles, shown in red in Figure 13, each defined by the four critical points in each of the two subsets, are referred to as lower and higher critical circles. They are on planes parallel to each other and also to the secondary circle plane, where the lower critical circle is closer to the origin and the higher is more distant from the origin. Specifically, their distances from the origin are
| (16) |
Figure 13.
(Left) The four critical points (red) closer to the cell center and the (higher) critical circle they define. (Right) The four critical points (red) more distant from the cell center and the (lower) critical circle they define.
The spherical radius vector defined by the angular coordinates of the secondary point passes through the centers of the secondary circle and the two critical circles, and is perpendicular to (the planes containing) them; see Figure 12 (right).
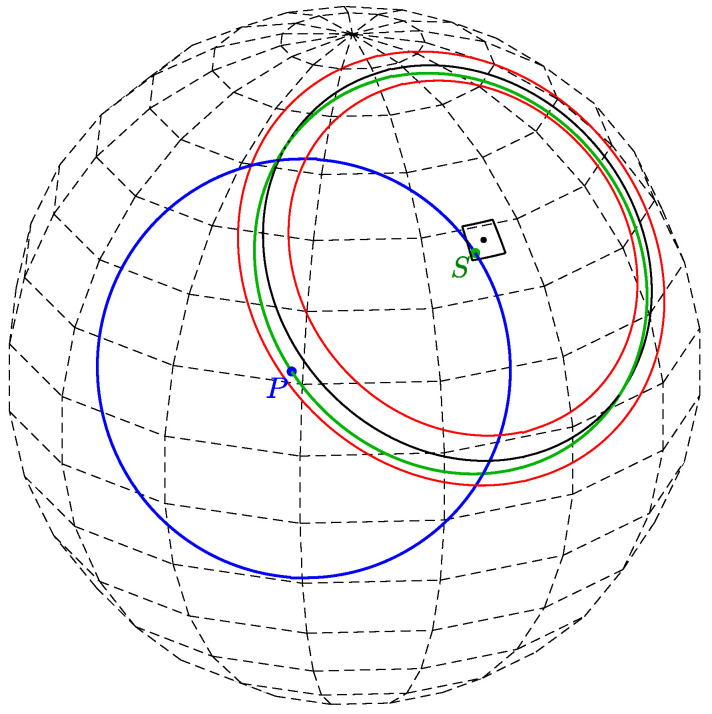
Referring to Figure 14, let P be a primary point of which the primary circle (blue point and blue circle) votes for a cell centered at . In other words, the primary circle defined by the primary point P intersects the cell . This implies that the coordinates of any point on the primary circle within the cell, i.e., any secondary point S in the cell (green point), are bounded between and . Consider the common secondary circle defined by the cell center (black circle) and the nearby secondary circle associated with any other secondary point within the cell (green circle). The nearby secondary circle passes through the primary point P, whereas the common secondary circle generally passes just near P.
Figure 14.
The primary point P (blue) with the corresponding primary circle (blue), which votes for the cell with the maximum count. The secondary point S on the primary circle and inside the cell defines a secondary circle (green) passing exactly through the primary point P. The primary point P is located within a spherical segment associated with the cell. The black circle is the common secondary circle defined by the center of the cell, and the red circles are the lower and higher critical circles.
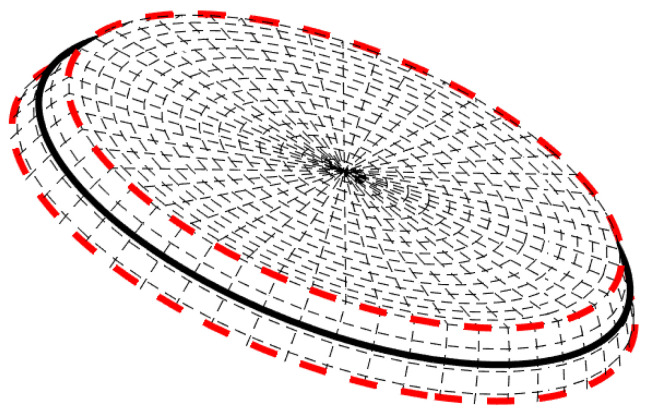
The angle between the radius-vector pointing at the cell center and the radius vector pointing at the nearby secondary point is less than or equal to , and equality to is achieved when the nearby secondary point coincides with one of the corner points of the cell. The radius vectors are normals of the planes containing these circles. So, the angle between the plane containing the common secondary circle and the plane containing the nearby secondary circle is less than . The critical circles are defined such that the angle between the radius vector pointing to a point on the critical circle and the radius vector pointing to its closest point on the common secondary circle is . So, the nearby secondary circle lies on a spherical segment (see Figure 15) containing the common secondary circle and delimited by the two critical circles (red circles in Figure 14 and Figure 15). In other words, the angle between the radius vector pointing to the primary point P and the radius vector pointing to its closest point on the common secondary circle is less than . Hence, the orthodromic distance (great circle distance) of the primary point P to each point on the common secondary circle is upper-bounded by , where R is the radius of the sphere.
Figure 15.
Spherical segment defined by the lower and higher critical circles (red). The black circle is the common secondary circle.
As shown in Appendix A, can be readily expressed in terms of the almost-equal-sized cellquantization parameters, and . For a unit sphere
| (17) |
In this case is approximately half of the diagonal of the almost-equal-sized cell. For a sphere of radius R, in Equation (17) should be scaled down by .
To conclude, the primary point of which the primary circle votes for a cell centered at is located on the spherical segment defined by the cell center. The orthodromic distance between the primary point and the common secondary circle (defined by the cell center) is upper-bounded by , where R is the sphere radius and is the central angle between the radius vector and one of the radius vectors pointing at the cell corners, expressible in terms of the almost-equal-sized cell area.
6.4. Improved Algorithm for General (Radius r) Circle Detection on a Sphere
Consider the problem of general (any given radius r) circle detection on a sphere, as presented in Section 5. We now apply the almost-equal-sized cell quantization scheme, and vote for all cells intersected by the voting curve. For each primary point in the dataset, the algorithm first calculates the limiting values of , and loops over all multiples of between the limiting values . For each , it computes the coordinates of the points A and B by substituting in Equation (8). It then increments all the accumulators which correspond to the discrete points with and , . Finally, the accumulator with the maximal reading indicates the spherical circle of radius r passing through the largest subset of (primary) points in the data-set. This leads to Algorithm 3:
Note that the accumulator array M in this algorithm is no longer a rectangular matrix. The azimuthal step between adjacent accumulators in the layer is -dependent and equals . Therefore, the number of accumulators in each is different. Figure 16 (left) shows the accumulator array in the plane. In Figure 16 (right), the accumulators are represented by identical rectangles, where the i axis represents the nearest integer multiple of and the j axis represents the nearest integer multiple of .
| Algorithm 3: Improved general circle detection on a sphere |
|
Initialize the accumulator array M with zeros. Normalize the radius r by the sphere radius R. Calculate d by Equation (2). For each primary point 1 to N Calculate by Equation (12). For each from until : For both and in Equation (8): 1. Calculate by Equation (14). 2. Calculate and by substituting in Equation (8). 3. Choose n such that and 4. Round and to the nearest integer multiples of . 5. Increment the accumulators from to to Find and corresponding to the entry with the largest accumulation in M. |
Figure 16.
Two illustrations of the accumulator array M with almost-equal-sized cell quantization. Left: The accumulators tessellating the plane. Right: Accumulators represented by identical rectangles, where the i axis represents the nearest integer multiple of and the j axis represents the nearest integer multiple of .
7. Great Circle Examples
What is the great circle on planet Earth that passes through the largest number of airports? Furthermore, what is the great circle that passes through the largest number of cities? We answer these questions using the proposed algorithms, relying on city [24] and airport [25] databases.
7.1. Uniform Quantization in the Plane (Algorithm 1) Examples
-
(1)
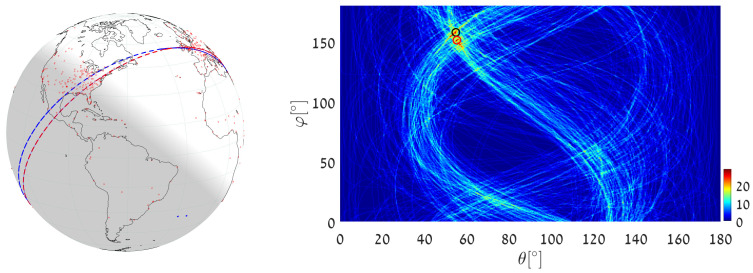
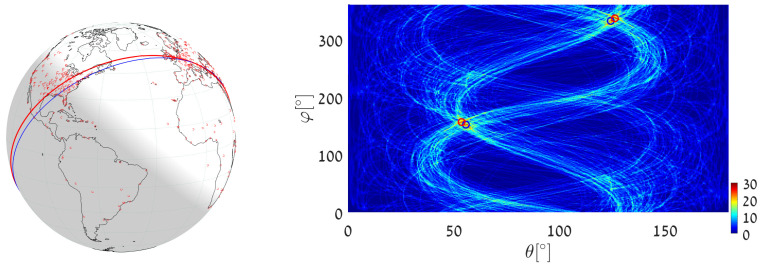
We execute Algorithm 1, taking the world’s major airports (red dots in Figure 17) as input primary points (a total of 617 points). The parameter space is discretized with . The great circle that passes through the maximum number of airports (blue circle in Figure 17) is on the great circle plane with normal and visits 29 airports, listed in Appendix B. Note that here and in the following, the number of digits after the decimal point in and relates to the location of the cell center. Obviously, the accuracy of the detected circle parameters follows from the cell size, i.e., from and . In order to find the circle passing through the largest number of remaining airports (excluding the 29 airports associated with the first maximum), we identify all primary points of which the voting contributed to the first maximum and remove their votes (unvote [5,6,7]). The new maximum represents the great circle passing through the largest subset of remaining (primary) points in the data-set. It lies on the great circle plane with normal and visits 28 different airports.
-
(2)
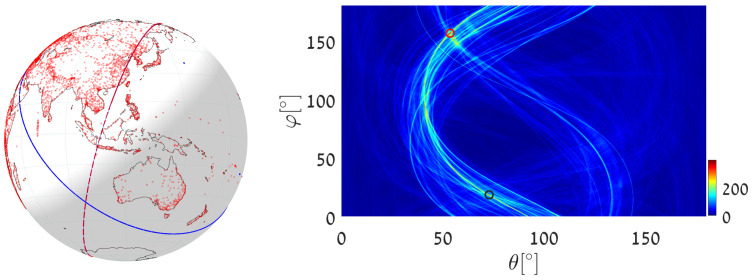
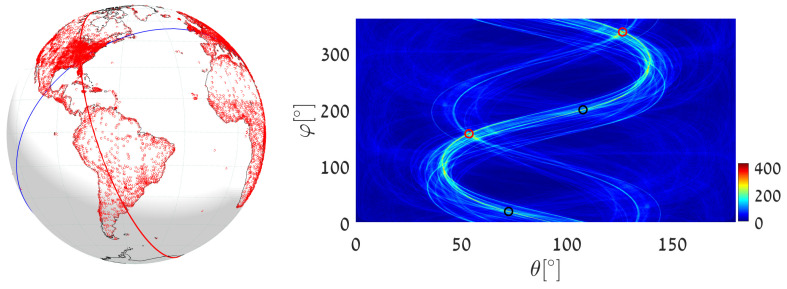
We again execute Algorithm 1, this time taking 12,960 world cities (red dots in Figure 18) as input primary points. The parameter space is discretized with . The great circle (blue circle in Figure 18) that passes through the maximum number of cities is on the great circle plane with normal and visits 397 different cities. The great circle that passes through the maximum number of remaining cities (i.e., the maximum after unvoting) is on the great circle plane with normal and visits 321 cities.
-
(3)
We execute the algorithm in order to find the great circle that passes through a specific airport and the maximum number of other airports. Instead of searching for the maximum value in all the accumulators, we search only in accumulators along the curve corresponding to the specific airport. This reduces the computation time, since we search in instead of accumulators.
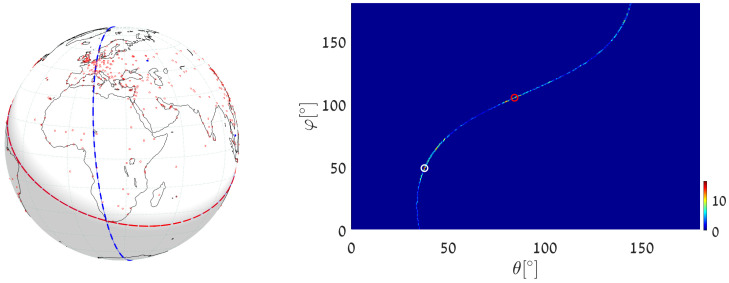
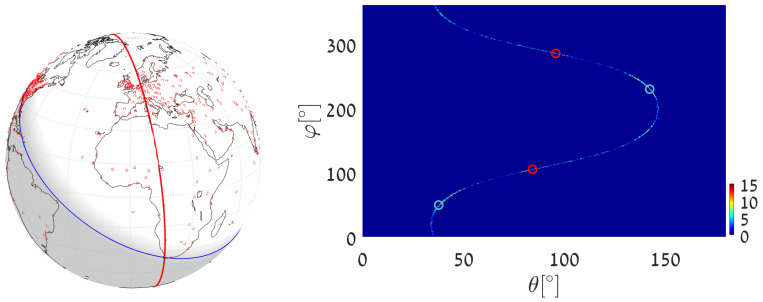
Taking Cape Town International Airport as the specific airport, the great circle that passes through Cape Town International Airport and through the maximum number of other airports is defined by the normal direction (blue circle in Figure 19) and visits 16 different airports, listed in Appendix C. In this case, the discretization of the parameter space is . The great circle that passes through Cape Town International Airport and through the maximum number of remaining airports (the maximum after unvoting, i.e., excluding the airports associated with the first maximum) is on the great circle plane with normal and visits 13 different airports.
Figure 17.
Executing Algorithm 1 on the airport database. (Left) The blue great circle passes through the maximum number of airports (red dots). The red great circle corresponds to the second maximum, following the unvoting process. (Right) Heat plot of the accumulator array M, showing the parameters of the two great circles.
Figure 18.
Executing Algorithm 1 on the city database. (Left) The blue great circle passes through the maximum number of cities (red dots). The red circle corresponds to the second maximum, following the unvoting process. (Right) Heat plot of the accumulator array M, showing the parameters of the two great circles.
Figure 19.
(Left) Detecting the great circle (blue) passing through Cape Town International Airport and through the maximum number of other airports, using uniform quantization in the plane. The red circle corresponds to the second maximum, following the unvoting process. (Right) Heat plot of the accumulator array M along the curve corresponding to Cape Town airport, showing the parameters of the two great circles.
7.2. Almost-Equal-Sized Cell Quantization Examples
We now address the same great-circle detection tasks using almost-equal-sized cell quantization. To achieve this, we apply Algorithm 3 (general circle detection) with hence .
-
(1)
We execute Algorithm 3 with , taking the world’s major airports as primary input points. We set and , which yields accuracy similar to the worst-case accuracy (at in the above uniform quantization example. The great circle (the blue circle in Figure 20) that passes through the maximum number of airports is on the great circle plane with normal , . It visits 30 different airports, listed in Appendix D. The great circle that passes through the largest number of remaining airports (the maximum after unvoting) is on the great circle plane with and visits 27 airports.
-
(2)
We execute Algorithm 3 with , taking 12,960 world cities (red dots in Figure 18) as input primary points. We set and . The great circle (the blue circle in Figure 21) that passes through the maximum number of cities is on the great circle plane with normal and visits 425 cities. The great circle that passes through the maximum number of remaining cities (the maximum after unvoting) is on the great circle plane with normal and visits 335 cities.
-
(3)
We execute Algorithm 3 with in order to find the great circle that passes through a specific airport and through the maximum number of other airports. Instead of searching for the maximum value in all the accumulators, we search only in accumulators along the curve corresponding to the specific airport. We again take Cape Town International Airport as the specific airport, now with and . The great circle (the blue circle in Figure 22) that passes through Cape Town International Airport and through the maximum number of other airports is defined by the normal direction , and visits 15 different airports listed in Appendix E. The great circle that passes through the Cape Town International Airport and through the maximum number of remaining airports (the maximum after unvoting, i.e., excluding the airports associated with the first maximum) is on the great circle plane with normal and visits 14 different airports.
Figure 20.
Executing Algorithm 3 on the airport database: (Left) The blue great circle passes through the maximum number of airports (red dots). The red great circle corresponds to the second maximum, following the unvoting process. (Right) Heat plot of the accumulator array M, showing the parameters of the two great circles.
Figure 21.
Executing Algorithm 3 on the city database. (Left) The blue great circle passes through the maximum number of cities (red dots). The red circle corresponds to the second maximum, following the unvoting process. (Right) Heat plot of the accumulator array M, showing the parameters of the two great circles.
Figure 22.
(Left) Detecting the great circle (blue) passing through Cape Town International Airport and passing through the maximum number of other airports, using almost-equal-sized cell quantization. The red circle corresponds to the second maximum, following the unvoting process. (Right) Heat plot of the accumulator array M along the curve corresponding to Cape Town airport, showing the parameters of the two great circles.
The number of data points (airports or cities) associated with the great circle detected depends on the size of the parameter-space quantization cells, i.e., on the quantization level. For the examples in this subsection (almost-equal-sized cell quantization), the dependence is presented in Appendix F.
The differences between the results obtained with uniform quantization in the plane and the those achieved using almost-equal-sized cell quantization are due to the non-equal cell sizes on the sphere yielded by uniform quantization in the plane. Referring to Figure 23, with uniform quantization in the plane (Figure 23 (left)), cells that are close to the equator are larger than cells close to the poles. In contrast, with almost-equal-sized cell quantization (Figure 23 (right)), all cells have approximately the same size. In the above experiments, we chose such that the smallest in the almost-equal-sized quantization scheme was equal to used in uniform quantization in the plane. Thus, with almost-equal-sized quantization, the size of the cell on the sphere is larger or equal to that obtained using uniform quantization in the plane. In other words, given cell coordinates and on the sphere, the cell at these coordinates using almost-equal-sized cell quantization is larger or equal in area to the cell at the same coordinates using uniform quantization in the plane. Thus, although the great circle on planet Earth that passes through the largest number of cities is about using both quantization schemes, with uniform quantization in the plane it is associated with 397 cities, whereas with almost-equal-sized cell quantization the number of cities is 425.
Figure 23.
(Left) Cells corresponding to uniform quantization in the plane; cells close to the equator are larger than cells close to the poles. Corner circles (red) of cells closer to the pole are closer to each other than corner circles of cells closer to the equator. (Right) Almost-equal-sized cell quantization: all cells are of approximately the same size, so the spherical segments between the upper and lower critical circles (blue) cover similar areas.
8. General (Small) Circle Examples
In the previous section we found great circles on planet Earth passing through the largest possible number of airports or cities. In this section, we detect small circles of a given radius r that visit as many airports or cities as possible. We use algorithm 3 (almost-equal-sized cell quantization). We normalize the radius of the sphere (planet earth) to ; hence, .
-
(1)
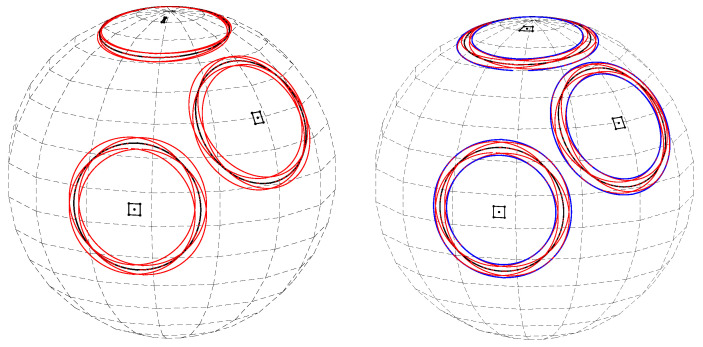
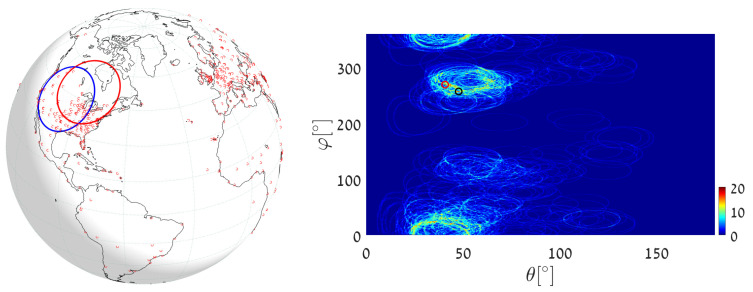
We execute algorithm 3 with , taking the world’s largest airports as input primary points. We set and . The circle of radius that passes through the maximum number of airports (the blue circle in Figure 24) is on the circle plane with normal and visits 20 large airports. The circle of radius that passes through the largest number of remaining airports (red circle in Figure 24, corresponding to the maximum after unvoting) is on the circle plane with normal , and visits 19 different airports.
-
(2)
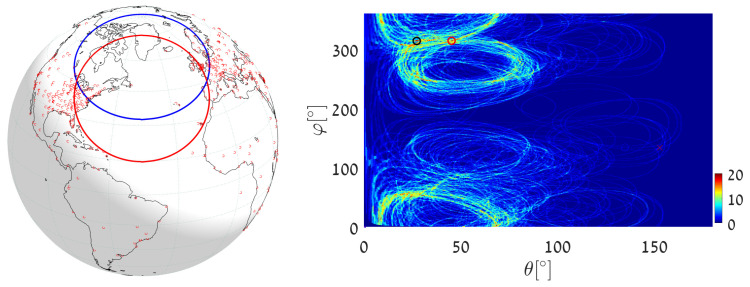
We now execute algorithm 3 with , again taking the world’s largest airports as input primary points. We set and . The circle of radius that passes through the maximum number of airports (the blue circle in Figure 25) is on the circle plane with normal , and visits 20 large airports. The circle of radius that passes through the largest number of remaining airports (red circle in Figure 25, corresponding to the maximum after unvoting) is on the circle plane with normal and visits 19 different airports.
-
(3)
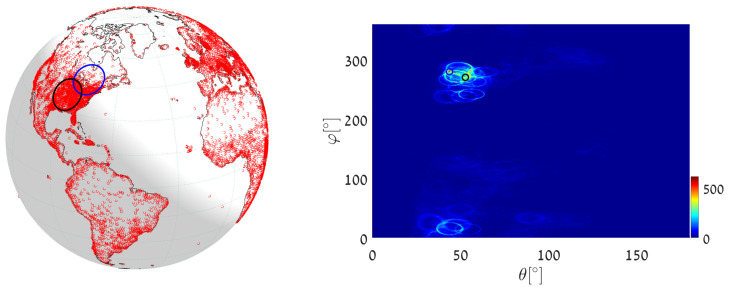
We execute algorithm 3 with , this time taking the input primary points from the city database. We set and . The circle of radius that passes through the maximum number of cities (the blue circle in Figure 26) is on the circle plane with normal , and visits 616 cities. The circle of radius that passes through the largest number of remaining cities (the black circle in Figure 26, corresponding to the maximum after unvoting) is on the circle plane with normal and visits 386 cities.
-
(4)
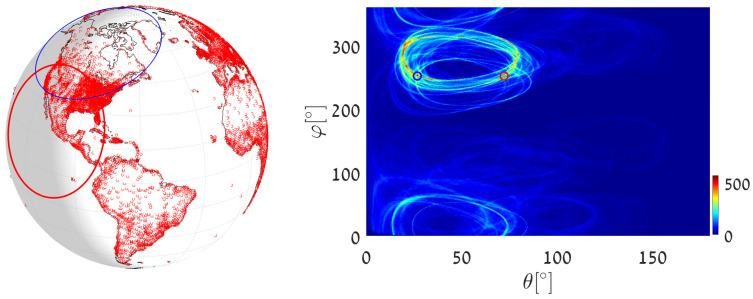
We execute algorithm 3, now with , taking the input primary points from the city database. We set and . The circle of radius that passes through the maximum number of cities (the blue circle in Figure 27) is on the circle plane with normal , and visits 568 cities. The circle of radius that passes through the largest number of remaining cities (the black circle in Figure 26, corresponding to the maximum after unvoting) is on the circle plane with normal and visits 523 cities.
Figure 24.
Executing Algorithm 3 with on the airport database. (Left) The blue circle passes through the maximum number of airports (red dots). The red circle corresponds to the second maximum, following the unvoting process. (Right) Heat plot of the accumulator array M, showing the parameters of the two circles.
Figure 25.
Executing Algorithm 3 with on the airport database. (Left) The blue circle passes through the maximum number of airports (red dots). The red circle corresponds to the second maximum, following the unvoting process. (Right) Heat plot of the accumulator array M, showing the parameters of the two circles.
Figure 26.
Executing Algorithm 3 with on the city database. (Left) The blue circle passes through the maximum number (616) of cities (red dots). The black circle, passing through 386 cities, corresponds to the second maximum, following the unvoting process. (Right) Heat plot of the accumulator array M, showing the parameters of the two circles.
Figure 27.
Executing Algorithm 3 with on the city database. (Left) The blue circle passes through the maximum number (568) of cities (red dots). The red circle, passing through 523 cities, corresponds to the second maximum, following the unvoting process. (Right) Heat plot of the accumulator array M, showing the parameters of the two circles.
The experimental results in Section 7 and Section 8 were obtained using Matlab on a low-end personal computer with i5-8265U 1.6GHz CPU and 8.00 GB RAM. The Matlab computing time for the various experiments is summarized in Table 1. As expected, computing time was roughly proportional to the number of data points, and increased as the parameter space quantization was refined.
Table 1.
Total computing time and computing time per-point (msec) using Matlab on a low-end PC. Results are reported for great-circle detection () and small-circle detection () and for different parameter-space resolution values ( and for Algorithm 1, and for Algorithm 3).
| Dataset | Algorithm 1 | Algorithm 3 | ||||||
|---|---|---|---|---|---|---|---|---|
| Δθ | Δφ | Computing Time (ms) |
Δθ | ΔS | Computing Time (ms) |
|||
| Total Time |
Avg. per Point |
Total Time |
Avg. per Point |
|||||
| Airports | 2 | 2 | 366 | 0.43 | 2 | 595 | 0.93 | |
| 1 | 1 | 531 | 0.71 | 1 | 791 | 1.33 | ||
| 0.5 | 0.5 | 1298 | 1.98 | 0.5 | 1777 | 3.02 | ||
| (616 pts.) | 0.25 | 0.25 | 3321 | 5.16 | 0.25 | 3668 | 5.96 | |
| Cities | 2 | 2 | 3644 | 0.29 | 2 | 6755 | 0.53 | |
| 1 | 1 | 6174 | 0.47 | 1 | 10,225 | 0.75 | ||
| 0.5 | 0.5 | 22,779 | 1.64 | 0.5 | 26,231 | 2.07 | ||
| (12,959 pts.) | 0.25 | 0.25 | 64,385 | 5.02 | 0.25 | 72,061 | 5.56 | |
| Cities | - | - | - | - | 2 | 5972 | 0.48 | |
| - | - | - | - | 1 | 8343 | 0.70 | ||
| - | - | - | - | 0.5 | 23,403 | 1.98 | ||
| (12,959 pts.) | - | - | - | - | 0.25 | 64,078 | 4.97 | |
| Cities | - | - | - | - | 2 | 5562 | 0.43 | |
| - | - | - | - | 1 | 7630 | 0.57 | ||
| - | - | - | - | 0.5 | 22,423 | 1.71 | ||
| (12,959 pts.) | - | - | - | - | 0.25 | 58,805 | 4.53 | |
9. Conclusions
In this paper we present the first comprehensive solution to the problem of detecting circles, great and small, in a spherical set of points. The suggested approach follows the Hough transform methodology and addresses the fundamental issues associated with Hough algorithms, including parameterization, parameter-space quantization, and analysis of the quantization-induced error. The time-complexity of the proposed algorithms is linear in the number of data-points. The required memory size is simply the number of cells in the accumulator array, which is bounded and two-dimensional in the case of great circles and in the case of small circles of known radius.
Potential applications for this research arise in cases where the data are naturally spherical and where circular features need to be detected. The planetary and geophysical sciences provide numerous examples, including crater and volcano detection. Computer vision applications arise in omnidirectional image analysis, including fisheye image analysis, where spherical image representations are ubiquitous.
The proposed method can be readily extended to the detection of circles of unknown radius in a spherical set of points. The additional unknown can be accommodated either by sequentially applying the known-radius algorithm with different radii, or by adding a dimension representing the unknown radius to the accumulator array.
Appendix A. Expressing the Angle γ in Terms of ΔS and Δθ
In this appendix we express the angle between the radius vector pointing at the cell center and that pointing to any of its corners, such as .
Assuming a unit sphere, the chord length between the two vector tips is
where
Applying the first-order Taylor series approximation to and ,
The third terms in and are negligible (second-order) compared to the other (first-order) terms. Substituting Equation (14),
Squaring, we obtain
Substituting in the definition of C,
Thus, the central angle between the two vectors is
Appendix B. The 29 Airports Located on the Great Circle That Passes through the Maximum Number of Airports—Uniform Quantization
| Airport Name | Latitude | Longitude | ||
| 1 | Prishtina International Airport | 42.572800 | 21.035801 | 0.289202 |
| 2 | Pierre Elliott Trudeau Airport (Montreal) | 45.470600 | −73.740799 | 0.066198 |
| 3 | Brussels South Charleroi Airport | 50.459202 | 4.453820 | 0.108124 |
| 4 | Stuttgart Airport | 48.689899 | 9.221960 | 0.032867 |
| 5 | Karlsruhe Baden-Baden Airport | 48.779400 | 8.080500 | 0.265290 |
| 6 | Luton Airport (London) | 51.874699 | −0.368333 | 0.120182 |
| 7 | Heathrow Airport (London) | 51.470600 | −0.461941 | 0.274561 |
| 8 | Stansted Airport (London) | 51.884998 | 0.235000 | 0.276526 |
| 9 | RAF (Brize Norton) | 51.750000 | −1.583620 | 0.282675 |
| 10 | Findel International Airport (Luxembourg) | 49.623333 | 6.204444 | 0.116230 |
| 11 | Ramstein Air Base | 49.436901 | 7.600280 | 0.153979 |
| 12 | Buffalo Niagara International Airport | 42.940498 | −78.732201 | 0.087453 |
| 13 | John Glenn Columbus International Airport | 39.998001 | −82.891899 | 0.134049 |
| 14 | Corpus Christi International Airport | 27.770399 | −97.501198 | 0.120094 |
| 15 | Cincinnati Northern Kentucky Airport | 39.048801 | −84.667801 | 0.086447 |
| 16 | Erie International Tom Ridge Field | 42.083127 | −80.173867 | 0.101441 |
| 17 | William P Hobby Airport (Houston) | 29.645399 | −95.278900 | 0.141916 |
| 18 | George Bush Intercontinental Airport (Houston) | 29.984400 | −95.341400 | 0.121704 |
| 19 | Rickenbacker International Airport (Columbus) | 39.813801 | −82.927803 | 0.253096 |
| 20 | Memphis International Airport | 35.042400 | −89.976700 | 0.199325 |
| 21 | Monroe Regional Airport | 32.510899 | −92.037697 | 0.292742 |
| 22 | Greater Rochester International Airport | 43.118900 | −77.672401 | 0.256870 |
| 23 | Louisville International Standiford Field | 38.174400 | −85.736000 | 0.020793 |
| 24 | Paphos International Airport | 34.717999 | 32.485699 | 0.020407 |
| 25 | RAF (Akrotiri) | 34.590401 | 32.987900 | 0.189568 |
| 26 | Zagreb Airport | 45.742901 | 16.068800 | 0.085825 |
| 27 | Joe Punik Airport (Ljubljana) | 46.223701 | 14.457600 | 0.158587 |
| 28 | Don Miguel International Airport (Guadalajara) | 20.521799 | −103.310997 | 0.288277 |
| 29 | Queen Alia International Airport (Amman) | 31.722601 | 35.993198 | 0.086299 |
Appendix C. The 16 Airports Located on the Great Circle That Passes through Cape Town and the Maximum Number of Other Airports—Uniform Quantization
| Airport Name | Latitude | Longitude | ||
| 1 | Cape Town International Airport | −33.964802 | 18.601700 | 0.030981 |
| 2 | Tunis Carthage International Airport | 36.851002 | 10.227200 | 0.154490 |
| 3 | Munster Osnabrck Airport | 52.134602 | 7.684830 | 0.227835 |
| 4 | Cologne Bonn Airport | 50.865898 | 7.142740 | 0.310424 |
| 5 | Dortmund Airport | 51.518299 | 7.612240 | 0.085782 |
| 6 | Karlsruhe Baden-Baden Airport | 48.779400 | 8.080500 | 0.045184 |
| 7 | Bergen Airport Flesland | 60.293400 | 5.218140 | 0.307745 |
| 8 | Stavanger Airport Sola | 58.876701 | 5.637780 | 0.247560 |
| 9 | Ramstein Air Base | 49.436901 | 7.600280 | 0.253077 |
| 10 | Hosea Kutako Airport (Windhoek) | −22.479900 | 17.470900 | 0.305683 |
| 11 | Ndjili International Airport (Kinshasa) | −4.385750 | 15.444600 | 0.250095 |
| 12 | Malpensa International Airport (Milan) | 45.630600 | 8.728110 | 0.078630 |
| 13 | Genoa Cristoforo Colombo Airport (Genova) | 44.413300 | 8.837500 | 0.177389 |
| 14 | Milano Linate Airport (Milan) | 45.445099 | 9.276740 | 0.275585 |
| 15 | Zurich Airport (Zurich) | 47.464699 | 8.549170 | 0.067036 |
| 16 | Hammamet International Airport (Enfidha) | 36.075833 | 10.438611 | 0.083588 |
Appendix D. The 30 Airports Located on the Great Circle That Passes through the Maximum Number of Airports—Almost-Equal-Sized Cell Quantization
| Airport Name | Latitude | Longitude | ||
| 1 | South Charleroi Airport (Brussels) | 50.459202 | 4.453820 | 0.154079 |
| 2 | Munich Airport | 48.353802 | 11.786100 | 0.267122 |
| 3 | Stuttgart Airport | 48.689899 | 9.221960 | 0.199825 |
| 4 | Gatwick Airport (London) | 51.148102 | −0.190278 | 0.226057 |
| 5 | Heathrow Airport (London) | 51.470600 | −0.461941 | 0.025712 |
| 6 | RAF (Fairford) | 51.682201 | −1.790030 | 0.026802 |
| 7 | RAF (Brize Norton) | 51.750000 | −1.583620 | 0.076266 |
| 8 | Shannon Airport | 52.702000 | −8.924820 | 0.141270 |
| 9 | Findel International Airport (Luxembourg) | 49.623333 | 6.204444 | 0.177932 |
| 10 | Ramstein Air Base | 49.436901 | 7.600280 | 0.022154 |
| 11 | Joint Base Andrews (Camp Springs) | 38.810799 | −76.866997 | 0.272409 |
| 12 | Hartsfield Jackson Airport (Atlanta) | 33.636700 | −84.428101 | 0.047392 |
| 13 | Asheville Regional Airport | 35.436199 | −82.541801 | 0.251562 |
| 14 | Bradley International Airport (Hartford) | 41.938900 | −72.683197 | 0.156189 |
| 15 | General Edward Logan Airport (Boston) | 42.364300 | −71.005203 | 0.253187 |
| 16 | Thurgood Marshall Airport (Baltimore) | 39.175400 | −76.668297 | 0.093830 |
| 17 | Ronald Reagan Airport (Washington) | 38.852100 | −77.037697 | 0.154835 |
| 18 | Newark Liberty International Airport | 40.692501 | −74.168701 | 0.136928 |
| 19 | Spartanburg International Airport (Greenville) | 34.895699 | −82.218903 | 0.321778 |
| 20 | Washington Dulles International Airport | 38.944500 | −77.455803 | 0.126876 |
| 21 | La Guardia Airport (New York) | 40.777199 | −73.872597 | 0.210181 |
| 22 | Dobbins Air Reserve Base (Marietta) | 33.915401 | −84.516296 | 0.296766 |
| 23 | Montgomery Regional Airport | 32.300598 | −86.393997 | 0.280931 |
| 24 | Mobile Regional Airport | 30.691200 | −88.242798 | 0.310154 |
| 25 | Philadelphia International Airport | 39.871899 | −75.241096 | 0.261567 |
| 26 | Blacksburg Regional Airport (Roanoke) | 37.325500 | −79.975403 | 0.225211 |
| 27 | Sofia Airport | 42.696693 | 23.411436 | 0.204411 |
| 28 | Nikola Tesla Airport (Belgrade) | 44.818401 | 20.309099 | 0.245757 |
| 29 | King Khaled International Airport (Riyadh) | 24.957600 | 46.698799 | 0.135812 |
| 30 | atl | 33.137551 | −84.375000 | 0.338159 |
Appendix E. The 15 Airports Located on the Same Great Circle That Passes through Cape Town and the Maximum Number of Other Airports—Almost-Equal-Sized Cell Quantization
| Airport Name | Latitude | Longitude | ||
| 1 | Cape Town International Airport | −33.964802 | 18.601700 | 0.317152 |
| 2 | Albuquerque International Sunport | 35.040199 | −106.609001 | 0.225185 |
| 3 | Fort Worth Alliance Airport | 32.987598 | −97.318802 | 0.072202 |
| 4 | Cannon Air Force Base (Clovis) | 34.382801 | −103.321999 | 0.143119 |
| 5 | Dallas Love Field (Dallas) | 32.847099 | −96.851799 | 0.072541 |
| 6 | Dallas Fort Worth International Airport | 32.896801 | −97.038002 | 0.066215 |
| 7 | Hollywood Airport (Fort Lauderdale) | 26.072599 | −80.152702 | 0.147474 |
| 8 | Meacham International Airport (Fort Worth) | 32.819801 | −97.362396 | 0.098141 |
| 9 | Biloxi International Airport (Gulfport) | 30.407301 | −89.070099 | 0.286861 |
| 10 | Metropolitan Oakland International Airport | 37.721298 | −122.221001 | 0.268331 |
| 11 | San Francisco International Airport | 37.618999 | −122.375000 | 0.155643 |
| 12 | Norman Y. Mineta Airport (San Jose) | 37.362598 | −121.929001 | 0.067841 |
| 13 | Sarasota Bradenton International Airport | 27.395399 | −82.554398 | 0.029516 |
| 14 | Lynden Pindling Airport (Nassau) | 25.039000 | −77.466202 | 0.112437 |
| 15 | Luis Munoz Marin Airport (San Juan) | 18.439400 | −66.001801 | 0.061461 |
Appendix F. The Dependence of the Number of Points Associated with the Great Circle Detected on the Parameter Space Quantization Level
| Dataset | Quantization | Number of Points | Parameters of the | ||
| Level | Associated with the | Great Circle Detected | |||
| (Degrees) | Great Circle Detected | (Degrees) | |||
| Cities | 2 | 1703 | 156.2500 | 53 | |
| 1 | 1177 | 155.7093 | 53.5000 | ||
| 0.5 | 729 | 156.4544 | 53.7500 | ||
| 0.25 | 425 | 156.3934 | 53.625 | ||
| 0.2 | 359 | 156.4300 | 53.7000 | ||
| 0.1 | 198 | 155.7920 | 53.2500 | ||
| 0.05 | 120 | 145.0215 | 48.0750 | ||
| Airports | 2 | 78 | 156.2500 | 53 | |
| 1 | 50 | 157.8840 | 54.5000 | ||
| 0.5 | 30 | 156.4544 | 53.7500 | ||
| 0.25 | 19 | 150.7367 | 55.1250 | ||
| 0.166 | 15 | 154.3911 | 52.2500 | ||
| 0.125 | 13 | 155.7198 | 53.4375 | ||
| 0.1 | 12 | 151.2559 | 55.3500 | ||
| 0.05 | 10 | 154.8403 | 56.1750 | ||
| Airports through Cape Town | 2 | 39 | 49.3805 | 39 | |
| 1 | 24 | 49.3151 | 37.5000 | ||
| 0.5 | 15 | 49.3878 | 37.7500 | ||
| 0.25 | 10 | 49.0724 | 37.8750 | ||
Author Contributions
Conceptualization, N.K.; Formal analysis, B.I.; Investigation, B.I.; Methodology, N.K.; Software, B.I.; Supervision, N.K.; Writing—original draft, B.I.; Writing—review and editing, N.K. All authors have read and agreed to the published version of the manuscript.
Institutional Review Board Statement
Not applicable.
Informed Consent Statement
Not applicable.
Data Availability Statement
Not applicable.
Conflicts of Interest
The authors declare no conflict of interest.
Funding Statement
This research received no external funding.
Footnotes
Publisher’s Note: MDPI stays neutral with regard to jurisdictional claims in published maps and institutional affiliations.
References
- 1.Fischler M.A., Bolles R.C. Random Sample Consensus: A paradigm for model fitting with applications to image analysis and Automated Cartography. Commun. Assoc. Comput. Mach. ACM. 1981;24:381–396. doi: 10.1145/358669.358692. [DOI] [Google Scholar]
- 2.Duda R.O., Hart P.E. Use of the Hough transformation to detect lines and curves in pictures. Commun. Assoc. Comput. Mach. ACM. 1972;15:11–15. doi: 10.1145/361237.361242. [DOI] [Google Scholar]
- 3.Kiryati N., Bruckstein A.M. Heteroscedastic Hough Transform (HtHT): An efficient Method for Robust Line Fittingin the ‘Errors in the Variables’ Problem. Comput. Vis. Image Underst. 2000;78:69–83. doi: 10.1006/cviu.1999.0828. [DOI] [Google Scholar]
- 4.López-González G., Arana-Daniel N., Bayro-Corrochano E. Conformal Hough Transform for 2D and 3D Cloud Points. In: Ruiz-Shulcloper J., di Baja G.S., editors. Progress in Pattern Recognition, Image Analysis, Computer Vision, and Applications (CIARP 2013), Lecture Notes in Computer Science. Volume 8258 Springer; Berlin/Heidelberg, Germany: 2013. [Google Scholar]
- 5.Gerig G., Klein F. Fast contour identification through efficient Hough Transform and simplified interpretation strategy; Proceedings of the International Conference on Pattern Recognition (ICPR); Paris, France. 27–31 October 1986; pp. 498–500. [Google Scholar]
- 6.Gerig G. Linking image-space and accumulator-space: A new approach for object recognition; Proceedings of the 1st International Conference on Computer Vision (ICCV); London, UK. 8–14 June 1987; pp. 112–117. [Google Scholar]
- 7.Matas J., Galambos C., Kittler J. Progressive Probabilistic Hough Transform; Proceedings of the British Machine Vision Conference (BMVC); Southampton, UK. 14–17 September 1998; pp. 26.1–26.10. [Google Scholar]
- 8.Vasseur P., Moaddib E.-M. Central Catadioptric Line Detection; Proceedings of the British Machine Vision Conference (BMVC); London, UK. 7–9 September 2004. [Google Scholar]
- 9.Torii A., Imiya A. The randomized-Hough-transform-based method for great-circle detection on sphere. Pattern Recognit. Lett. 2007;28:1186–1192. doi: 10.1016/j.patrec.2007.02.002. [DOI] [Google Scholar]
- 10.Boutteau R., Savatier X., Bonardi F., Ertaud J.-Y. Road-line detection and 3D reconstruction using fisheye cameras; Proceedings of the IEEE 16th International Conference on Intelligent Transportation Systems (ITSC); The Hague, The Netherlands. 6–9 October 2013. [Google Scholar]
- 11.Barnard S.T. Interpreting perspective images. Artif. Intell. 1983;21:435–462. doi: 10.1016/S0004-3702(83)80021-6. [DOI] [Google Scholar]
- 12.Quan L., Mohr R. Determining persepctive structures using hierarchical Hough transform. Pattern Recognit. Lett. 1989;9:279–286. doi: 10.1016/0167-8655(89)90006-8. [DOI] [Google Scholar]
- 13.Lutton E., Maitre H., Lopez-Krahe J. Contribution to the determination of vanishing points using Hough transform. IEEE Trans. Pattern Anal. Mach. Intell. 1994;16:430–438. doi: 10.1109/34.277598. [DOI] [Google Scholar]
- 14.Ying X., Hu Z. Catadioptric line features detection using Hough transform; Proceedings of the 17th International Conference on Pattern Recognition (ICPR); Cambridge, UK. 26 August 2004; pp. 839–842. [Google Scholar]
- 15.Ericson S., Astrand B. Row-detection on an agricultural field using omnidirectional camera; Proceedings of the IEEE/RSJ International Conference on Intelligent Robots and Systems; Taipei, Taiwan. 18–22 October 2010. [Google Scholar]
- 16.Pacey A., Macpherson C.G., McCaffrey K.J.W. Linear volcanic segments in the central Sunda Arc, Indonesia, identified using Hough Transform analysis: Implications for arc lithosphere control upon volcano distribution. Earth Planet. Sci. Lett. 2013;369–370:24–33. doi: 10.1016/j.epsl.2013.02.040. [DOI] [Google Scholar]
- 17.Andikagumi H., Macpherson C.G., McCaffrey K.J.W. Upper plate stress controls the distribution of Mariana arc volcanoes. J. Geophys. Res. Solid Earth. 2020;125:e2019JB017391. doi: 10.1029/2019JB017391. [DOI] [Google Scholar]
- 18.Wessel P. Hotspotting: Principles and properties of a plate tectonic Hough transform. Geochem. Geophys. Geosyst. 2008;9:Q08004. doi: 10.1029/2008GC002058. [DOI] [Google Scholar]
- 19.Snyder J.P. Flattening the Earth: Two Thousand Years of Map Projections. The University of Chicago Press; Chicago, IL, USA: 1993. [Google Scholar]
- 20.Klette R., Rosenfeld A. Digital Geometry: Geometric Methods for Digital Picture Analysis. Elsevier; Amsterdam, The Netherlands: 2004. (Section 1.1.4) [Google Scholar]
- 21.Koplowitz J. On the performance of chain codes for quantization of line drawings. IEEE Trans. Pattern Anal. Mach. Intell. PAMI. 1981;3:181–185. doi: 10.1109/TPAMI.1981.4767075. [DOI] [PubMed] [Google Scholar]
- 22.Kiryati N., Lindenbaum M., Bruckstein A.M. Digital or analog Hough transform? Pattern Recognit. Lett. 1991;12:291–297. doi: 10.1016/0167-8655(91)90412-F. [DOI] [Google Scholar]
- 23.Santalo L. Encyclopedia of Mathematics and Its Applications. Volume 1 Addison-Wesley; Boston, MA, USA: 1976. Integral Geometry and Geometric Probability. [Google Scholar]
- 24.World Cities Coordinates Data Set. [(accessed on 14 October 2019)]. Available online: https://simplemaps.com/data/world-cities.
- 25.Airports Coordinates Data Set. [(accessed on 14 October 2019)]. Available online: https://www.partow.net/miscellaneous/airportdatabase/
Associated Data
This section collects any data citations, data availability statements, or supplementary materials included in this article.
Data Availability Statement
Not applicable.


