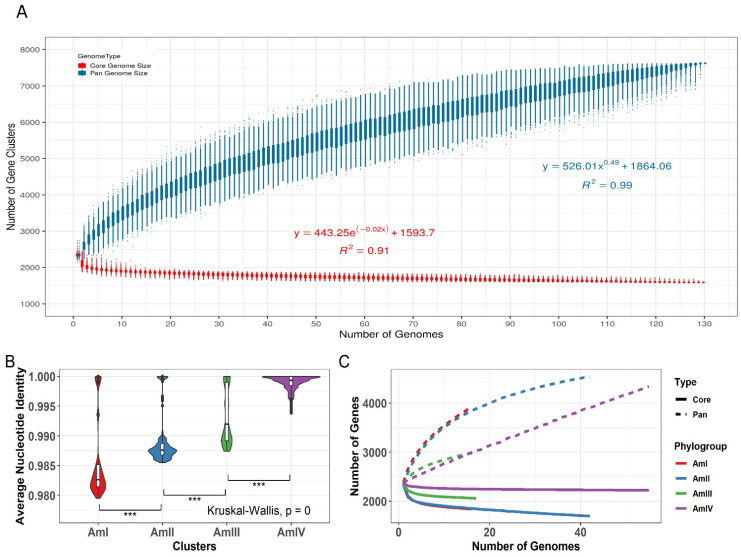
Figure 3.
Pan-genome modeling of A. muciniphila. (A) Modelling of the pan-genome size of the 130 strains. It is evident that the pan-genome curve is rising upwards, indicating an expanding pan-genome. The γ of more than 0 indicates an open genome, and the correct data revealed a γ value of 0.49. (B) The range of ANI across four phylogroups. AmI shows the most variability in ANI among all the phylogroups, while strains of the AmIV are more similar to each other as compared to that of other phylogroups. (C) The pan-genome modeling of all the subgroups of A. muciniphila. The γ values were 0.31, 0.17, 0.2, and 0.9 for AmI, AmII, AmIII, and AmIV, respectively. The highest number of genes are predicted to be in AmII, while AmIV is expanding at a rate higher than others including AmII. Significance is denoted by: “***” if p value is less than 0.001.

