One of the hallmarks of the cerebral cortex is the extreme diversity of interneurons1–3. The two largest subtypes of cortical interneurons, parvalbumin (PV)- and somatostatin (SST)-positive cells, are morphologically and functionally distinct in adulthood but arise from common lineages within the medial ganglionic eminence (MGE)4–11. This makes them an attractive model for studying the generation of cell diversity. Here, we examine how developmental changes in transcription and chromatin structure allow these cells to acquire distinct identities. Generic interneuron features are first detected upon cell cycle exit through the opening of chromatin at distal elements. By constructing cell type specific gene regulatory networks (GRNs), we observed that PV and SST cells initiate distinct programs upon settling within the cortex. We used these networks to model the differential transcriptional requirement of a shared regulator, Mef2c, and confirmed the accuracy of our predictions through experimental loss-of-function experiments. We thus reveal how a common molecular program diverges to allow these neuronal subtypes to acquire highly specialized properties by adulthood. Our methods provide a framework for examining the emergence of cellular diversity, as well as for quantifying and predicting the impact of candidate genes on cell type specific development.
Results
Transcriptional and chromatin landscapes of the MGE
To investigate the establishment of PV and SST interneuron identities, we first sought to determine the earliest timepoint at which they can be distinguished from projection neurons, the other major MGE-derivative. Our previous work indicated that at a transcriptional level this distinction is first detectable in postmitotic populations, when cells diverge into three branches corresponding to specific fates – interneuron (branch 1) and projection neuron precursors (branches 2 and 3)8. To explore whether there is an earlier chromatin signature indicative of interneuron identity, we compared the RNA expression and chromatin accessibility in these precursor populations at embryonic day 13 (E13), the peak of MGE interneuron neurogenesis.
To this end, we performed scRNA-, scATAC-, and multiomic (dual RNA/ATAC) sequencing on the E13 MGE from Dlx6a-Cre;Ai14 mice, using the expression of the Dlx6a-based reporter to discern mitotic progenitors from postmitotic precursors12 (Supplementary Table 1, Extended Data Fig. 1a–h). Diffusion map analysis of E13 MGE scRNA- and scATAC-seq datasets resulted in cells being ordered into a single trajectory, where the primary source of variability was maturation state (Fig. 1a, b). Notably, promoter accessibility for developmentally-relevant genes generally increases earlier and persists longer compared to gene expression (Fig. 1c, d, Extended Data Fig. 1i).
Figure 1: Distal chromatin elements provide the earliest markers of interneuron identity.
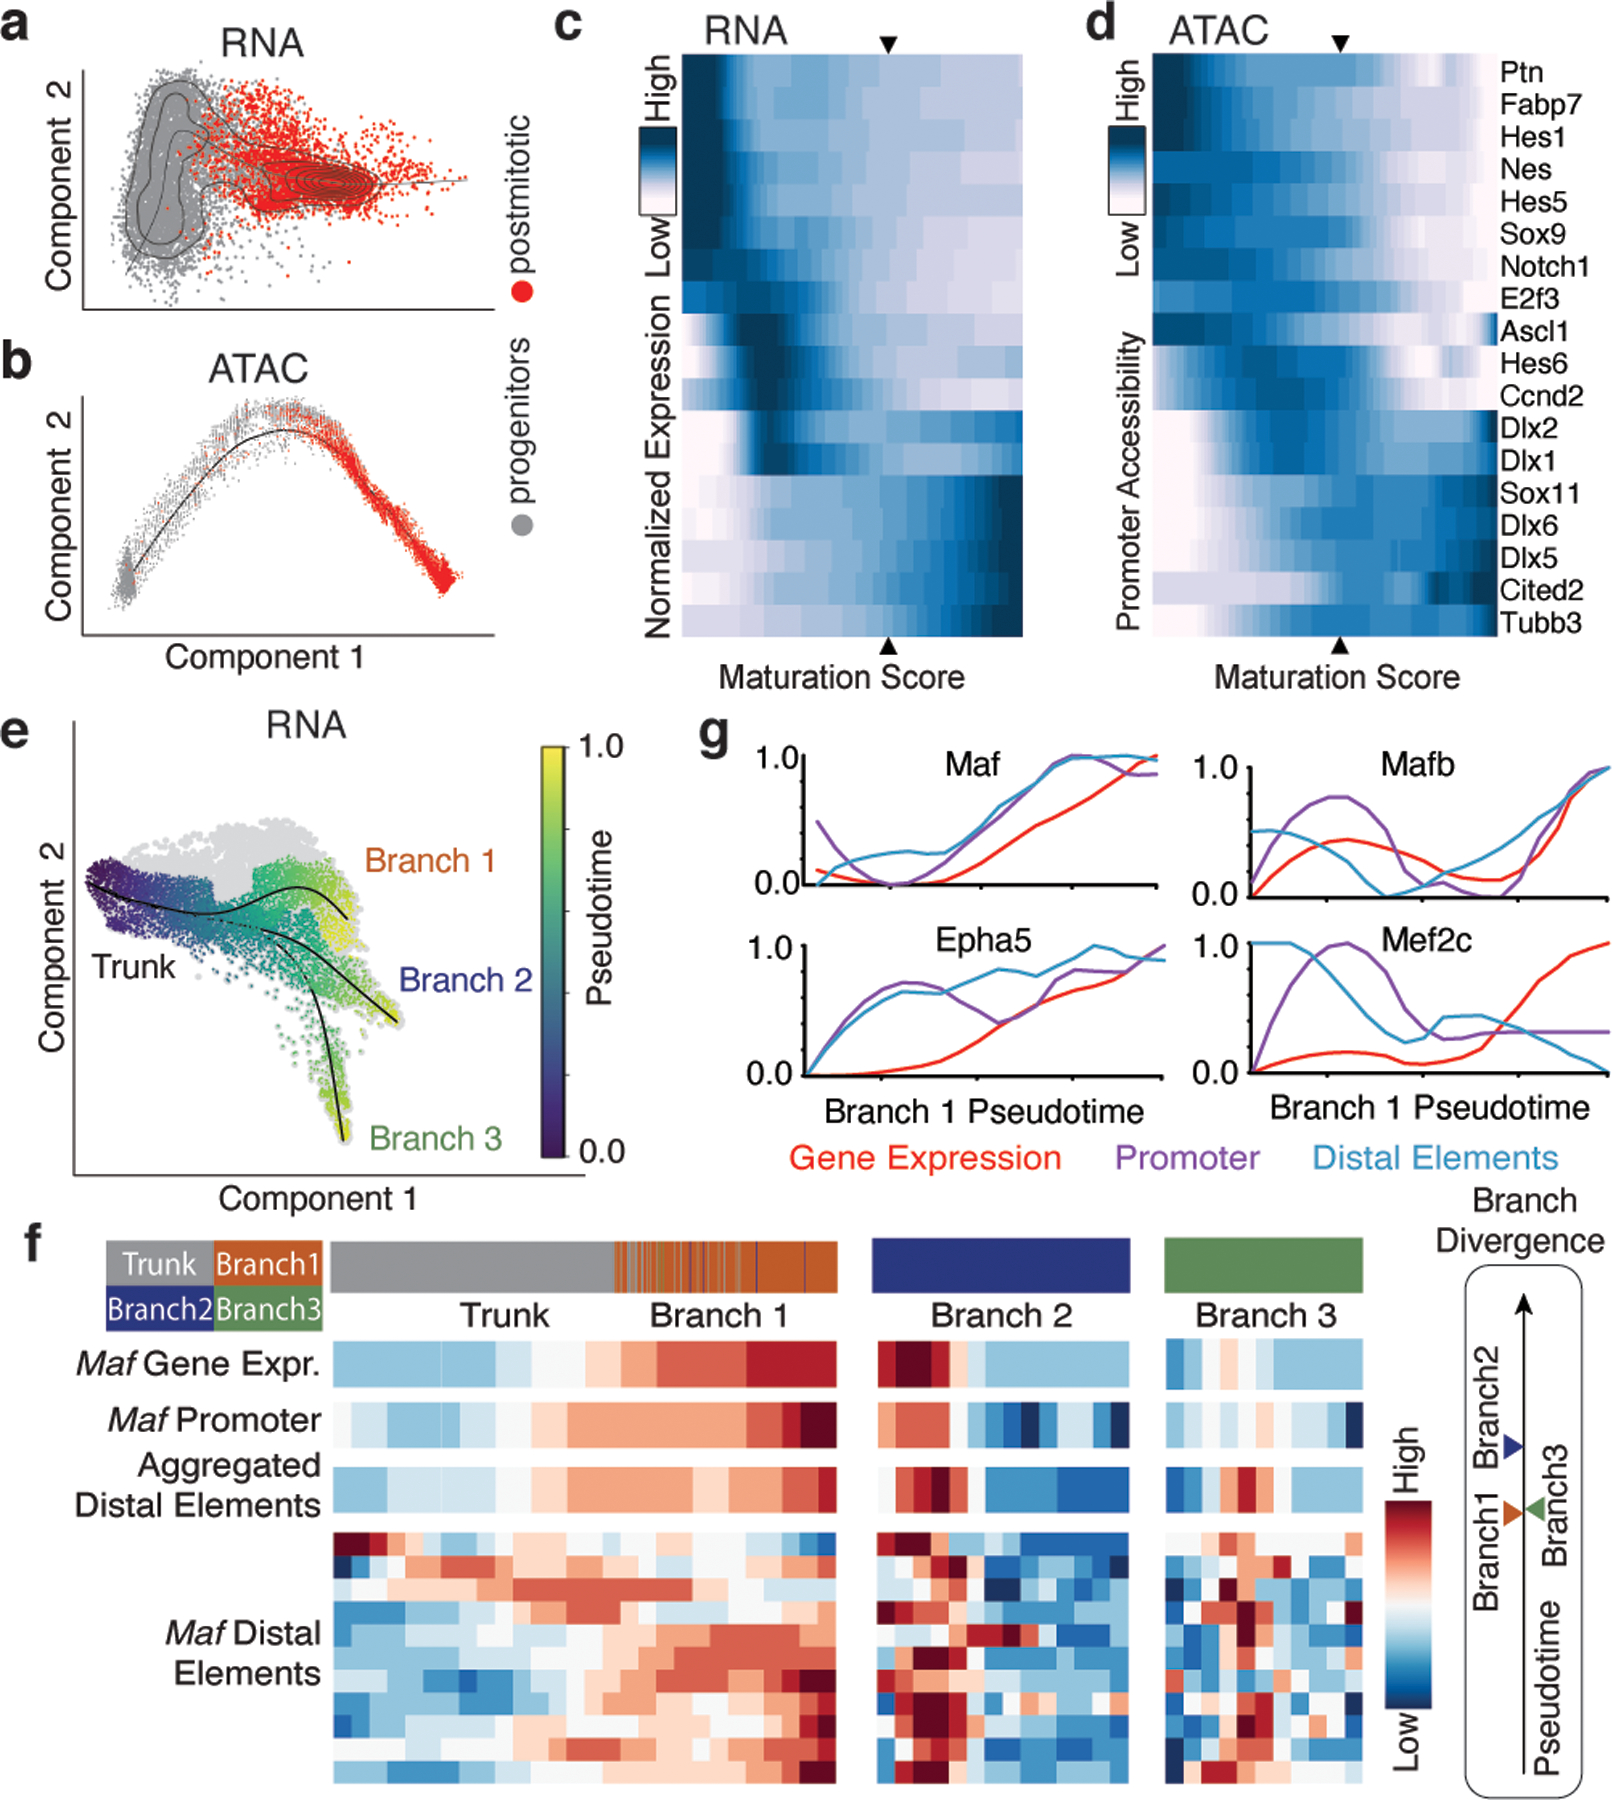
a and b, Diffusion maps of MGE cells using scRNA- (a) and scATAC-seq (b). Cells order into a maturation trajectory with both methods.
c and d, RNA expression of maturation-relevant genes (c) and the corresponding promoter accessibility (d) across the maturation trajectory. Scale denotes normalized row-scaled expression or promoter accessibility. Arrowheads indicate the mitotic/postmitotic transition.
e, Diffusion map analysis of scRNA-seq data from postmitotic MGE revealed three distinct branches: Branch 1-interneurons, Branch 2 & 3-projection.
f, Detailed analysis of the Maf locus for gene expression, promoter and aggregated accessibility of distal elements shown for early postmitotic (trunk) and branch-specific cells. Bottom heatmaps show Maf distal elements compared for their accessibility across branches. Timeline (right) indicates the earliest time at which each branch can be distinguished by gene expression.
g, Gene expression (red), promoter accessibility (green), and aggregated accessibility of distal elements (blue) for four branch 1 marker genes across the pseudotime.
To identify the earliest features indicative of an interneuron (branch 1) identity, we subsetted postmitotic neurons and used several maturation trajectory methods to identify the three developmental branches, using the multiomic dataset to ensure accurate label transfer between scRNA- and scATAC-seq analyses (Fig. 1e; Extended Data Fig. 2a, b, Extended Data Fig. 3a, b, c). Next, we performed differential expression analysis to identify the earliest branch 1 genes expressed in postmitotic cells. To identify distal chromatin elements associated with these genes, we collated ATAC-seq peaks surrounding them and trained a classifier to identify those most informative for distinguishing branch identity (Methods). Further analysis confirmed that these peaks were predominantly accessible in branch 1 cells (Extended Data Fig. 4a, b, Supplementary Table 2).
Narrowing our focus to transcription factors (TFs), we found that Maf, a regulator of cell identity13,14, is both highly expressed in branch 1 interneurons and exhibits an enriched DNA binding motif in their open chromatin (Extended Data Fig. 3). Examination of chromatin accessibility surrounding this gene revealed distal loci become accessible prior to the initiation of gene expression (Fig. 1f). Similar dynamics were observed for several other branch 1-specific TFs (Fig. 1g; Extended Data Fig. 4a, b), suggesting distal elements may provide the earliest indication of interneuron identity, perhaps as a form of priming15. We therefore explored the accessibility of these distal elements prior to cell cycle exit. To this end, we used our classifier to annotate mitotic and postmitotic cells collected at E13. This failed to detect branch 1 interneurons prior to cell cycle exit (Extended Data Fig. 4c). Thus, at present there is no evidence of divergence of interneuron from projections cells prior to cell cycle exit.
Chromatin remodels upon cortical settling
To investigate how early interneuron identity diverges, we next collected scRNA- and scATAC-seq datasets from the E18, P2, P10, and P28 cortex of Dlx6a-Cre;INTACT mice (Supplementary Table 1). In adult cortical interneurons, scRNA- and scATAC-seq profiles are closely correlated16–18. However, our investigation of these populations at E13 reveals a misalignment between transcriptional and chromatin signatures in developing cells. To evaluate when during development they come into concordance, we aligned these datasets at each timepoint using both Seurat canonical correlation analysis (CCA)19 and Conos20 (Fig. 2a–d, Extended Data Figs. 5, 6, 7). Analysis of the more mature populations (P10, P28) confirmed that cluster labels can be transferred from scRNA-seq to scATAC-seq data with high confidence (Fig. 2c,d). By contrast, this was not the case at early postnatal or embryonic timepoints (E18, P2) (Fig. 2a,b).
Figure 2: Remodeling of interneuron chromatin architecture during migration and post-settling.
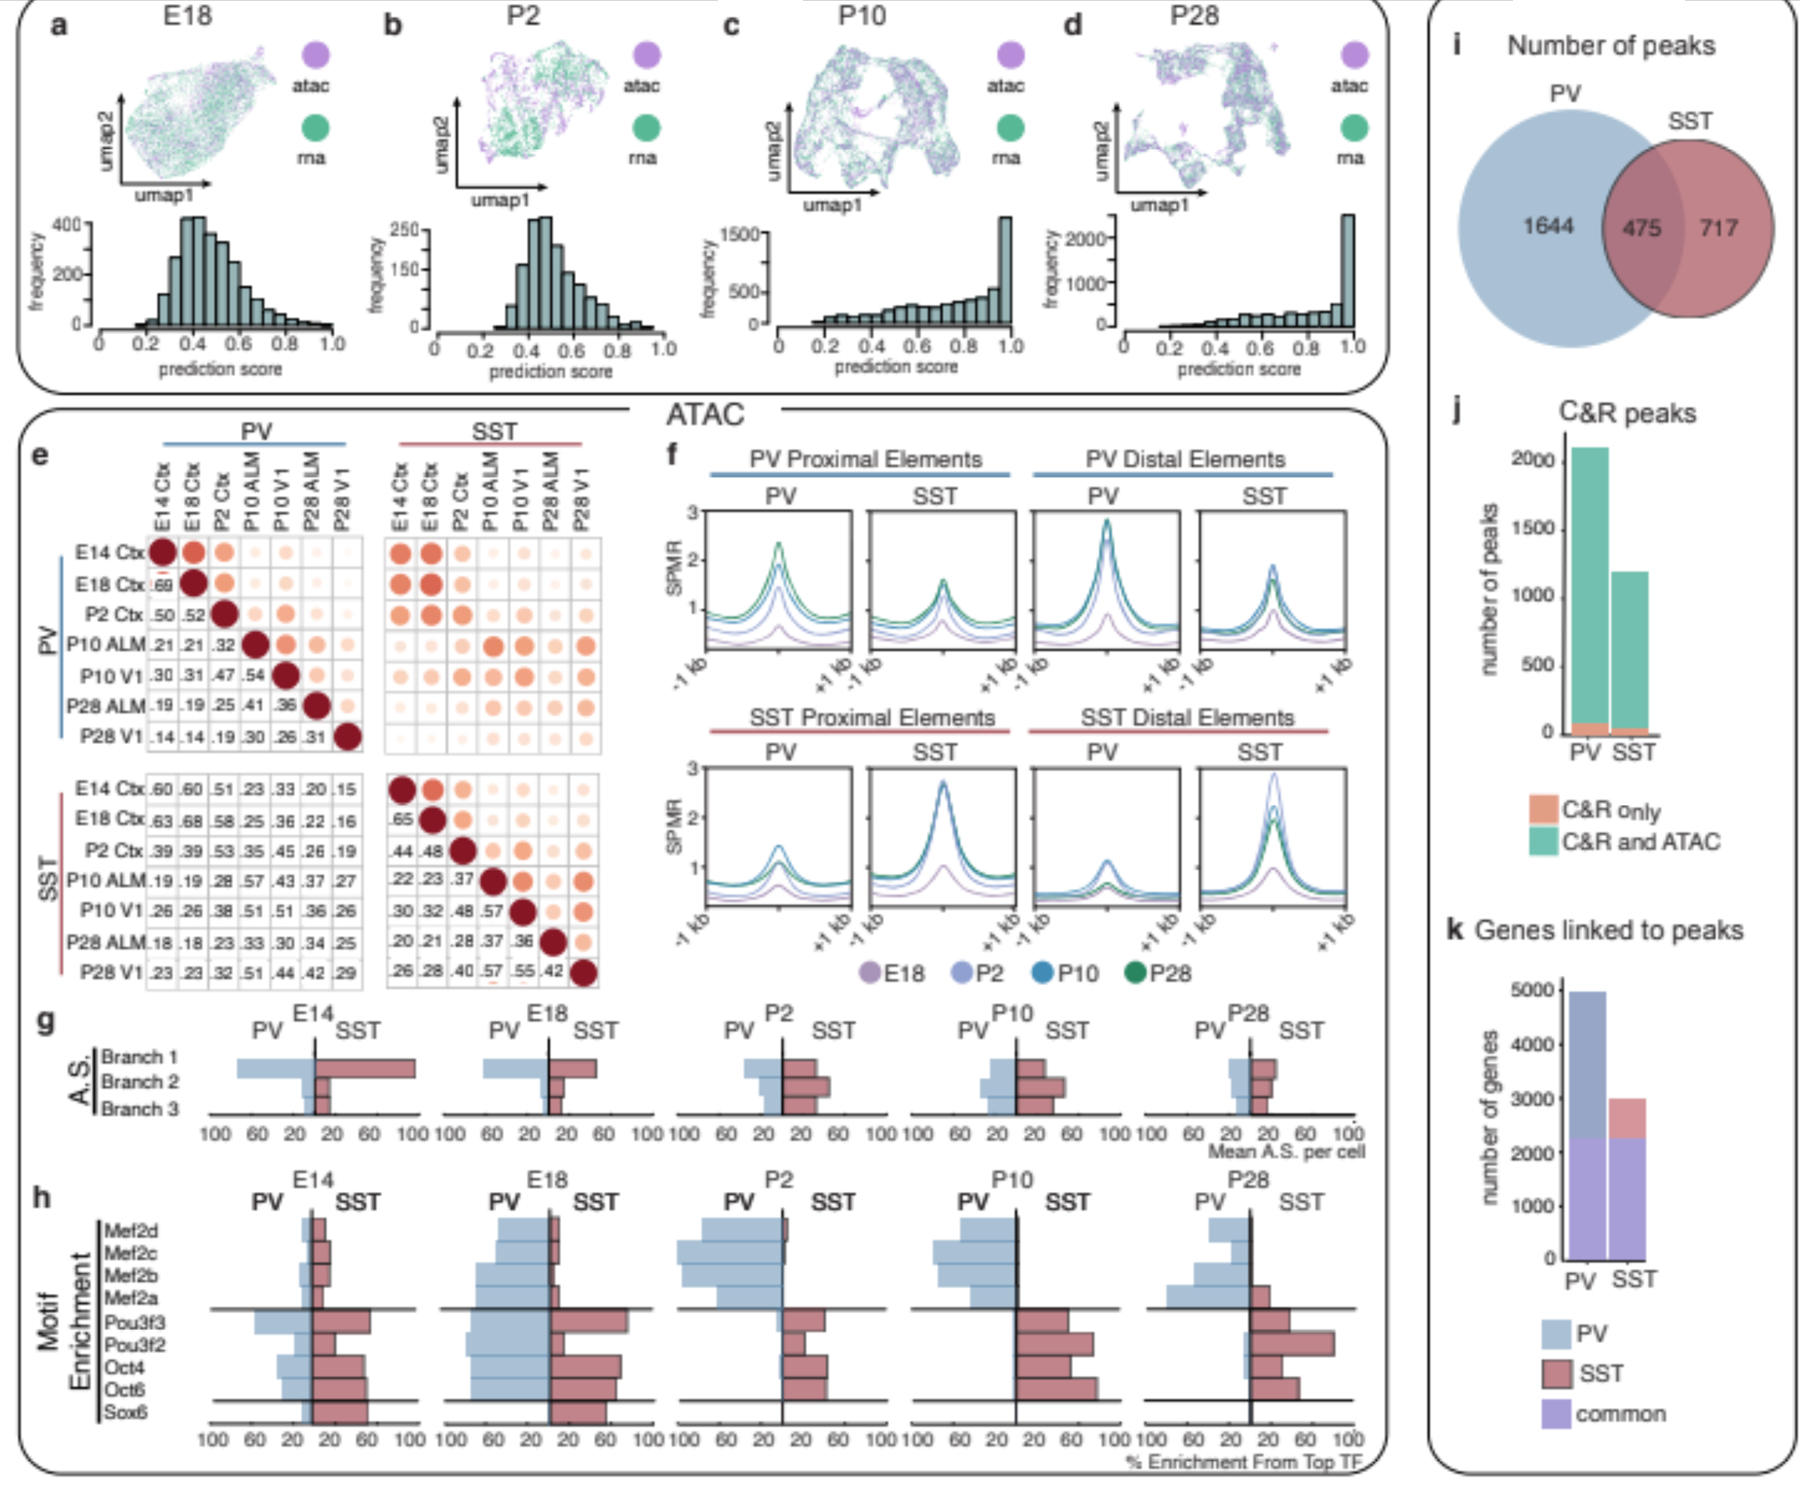
a,b,c,d UMAP of coembedded scRNA- and scATAC-seq data (top) and prediction scores of scATAC-seq assignment to scRNA-defined clusters (bottom) at E18 (a), P2 (b), P10 (c), P28 (d).
e, Jaccard distance analysis for PV and SST cell scATAC-seq peaks across timepoints.
f, Average signal within cell type-specific accessible peaks identified at P28 located for proximal elements (gene bodies or promoters: TSS+/−2kb) or distal elements across timepoints.
g, Aggregated scores (AS) for branch-specific peaks.
h, Motif enrichment (ME) in class-specific loci at each timepoint. Each TF enrichment value is normalized by the largest enrichment value in the population.
i, Relative distribution of P28 MEF2C CUT&RUN peaks in PV versus SST interneurons.
j, Peaks identified exclusively in CUT&RUN (orange) or jointly in CUT&RUN and ATAC-seq analyses (green).
k, Number of genes linked to CUT&RUN peaks found uniquely in PV (blue), SST (red) or shared in both populations (purple). Peaks were assigned to genes based on scATAC co-accessibility with promoters.
SPMR, signal per million reads; ME, Motif Enrichment; AS, Aggregated Score; C&R, CUT&RUN
P2 is the timepoint at which interneurons complete migration, reach their settling position in the cortex, and begin circuit integration.21 Consistent with our RNA/ATAC alignment comparisons, Jaccard analysis of scATAC-seq across development segregates timepoints before and after P2 (Fig. 2e). To examine the emergence of subtype-specific features at this transition, we analyzed peaks unique to PV or SST interneurons at P28 (44,322 and 24,428, respectively) and found that these mature subtype-specific elements are first detectable in distal loci at P2 (Fig. 2f, Extended Data Fig. 8a–d). Thus, the developmental window during which interneurons settle within cortical layers represents a period when chromatin structure undergoes significant remodeling.
To characterize this transition, we cataloged accessible chromatin elements specific to PV or SST interneurons at both migratory (E14-E18) and post-settling (P2-P28) timepoints. Branch 1-specific loci generally become less accessible at this juncture, consistent with their role in establishing common interneuron identity (Fig. 2g). Next, we identified TF motifs enriched during these two periods, the majority of which were shared between PV and SST interneurons - LHX and DLX motifs during migration, and FOS/JUN motifs post-settling (Supplementary Table 3). By contrast, few TFs were cell type-selective during these periods. In SST cells, SOX and POU motifs were sequentially enriched during migratory and post-settling periods, respectively (Fig. 2h). In PV cells, MEF motifs became enriched at E18 and persisted post-settling. These dynamic patterns correspond with the known function of these TFs during these phases of interneuron development8,22–24.
Our scATAC-seq analysis suggests that certain TFs are utilized in a cell type-specific manner despite not being selectively expressed. To investigate this possibility, we performed CUT&RUN for MEF2C in the mature PV and SST populations. This work revealed both common and subtype-specific binding of MEF2C, with more loci specifically bound in PV cells compared to SST (Fig. 2i, Extended Data Fig. 9a–d). Most of the peaks identified with CUT&RUN were also found in our scATAC analysis, although only a subset of these featured canonical MEF2C binding motifs (Fig. 2j, Extended Data Fig. 9e). We could therefore use peak co-accessibility to link CUT&RUN peaks to gene promoters (Fig. 2k). Gene ontology analysis revealed that these putative MEF2C targets are involved in synapse assembly and organization (Extended Data Fig. 9j, k).
Gene regulation specializes as cells mature
The divergence in the gene expression and chromatin structure of PV and SST interneurons greatly accelerates upon settling within the cortex. To characterize these dynamics, we constructed gene regulatory networks (GRNs) using a multitask inference methodology25 and separated shared regulatory interactions from cell type-specific ones across development (E18, P2, and P28) (Fig. 3a, b). Each regulator-target interaction is represented in our GRNs as an edge linking TFs to genes. The number of detected genes and edges progressively increase at each sequential timepoint (Fig. 3c,d). Over development, cell type-specific edges replace shared ones (Fig. 3e,f). Notably, TFs co-expressed within both cell types shift from regulating common to cell type-specific genes (Fig. 3g). This observation suggests that the chromatin landscape has been sculpted such that cell type-specific gene expression can be mediated without a requirement for selective TF expression.
Figure 3: The maturation of gene networks is characterized by the emergence of cell type-specific regulatory interactions.
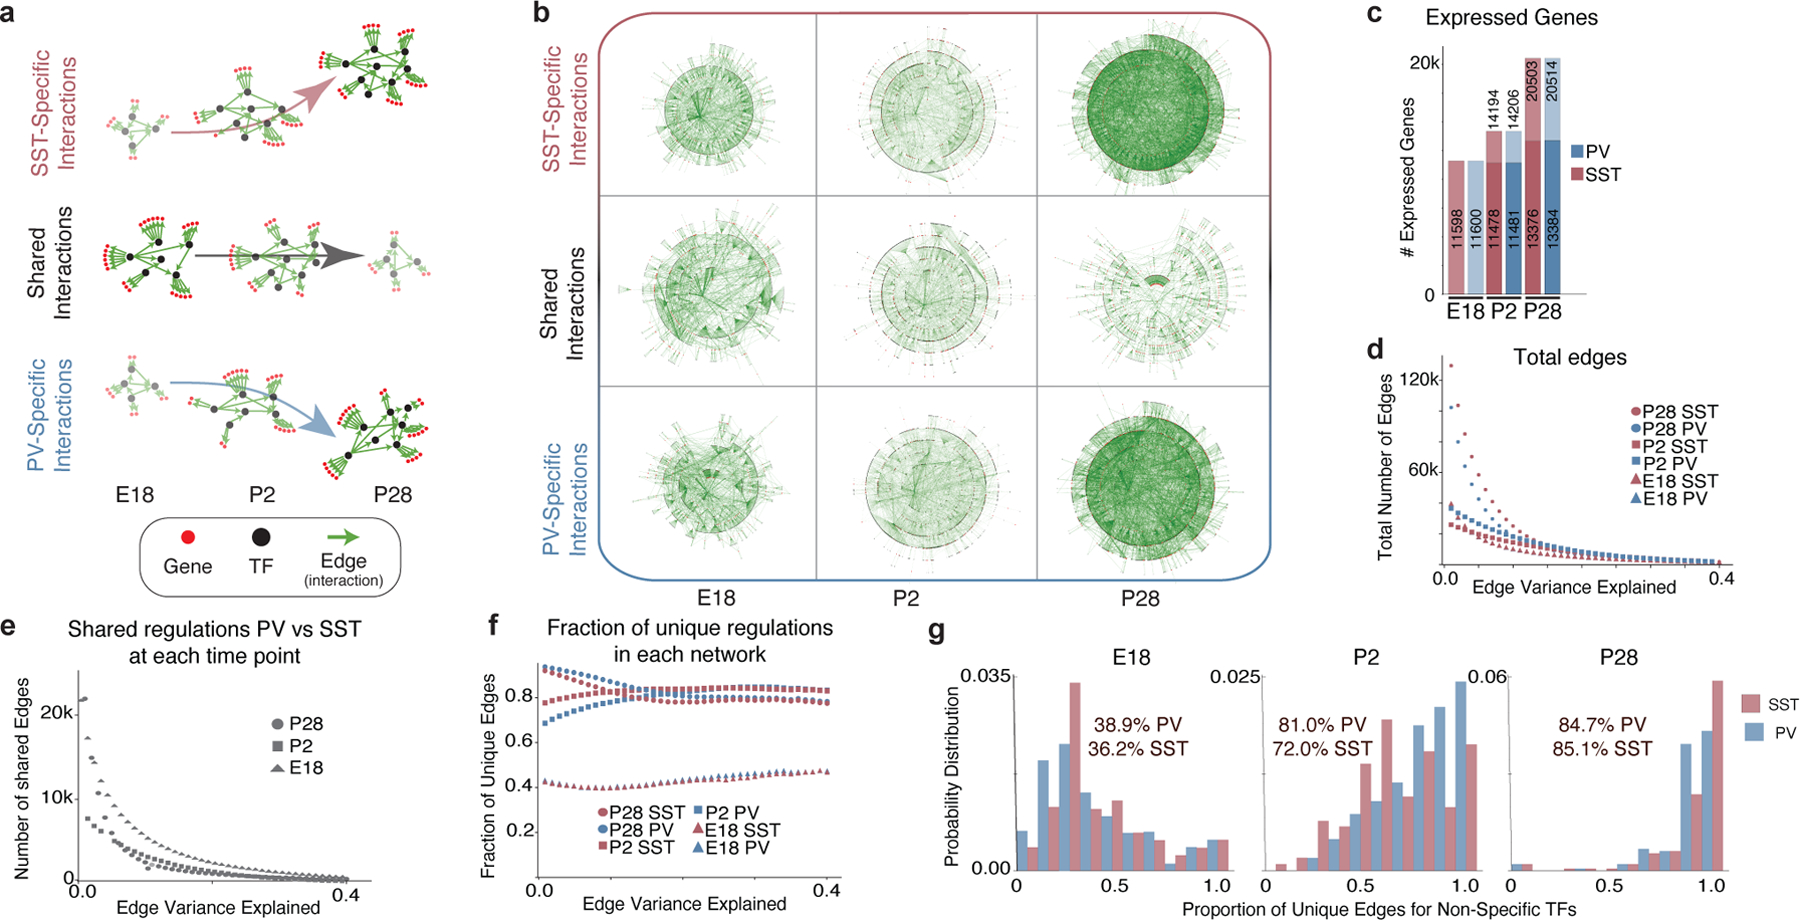
a, Schematic illustrating key findings of the GRN analysis. Early in development, shared TFs generally target the same genes in both PV and SST cells. By adulthood, cell type-specific programs take over, with TFs regulating genes in a cell type-specific manner.
b, Graphical representation of unique and common gene regulatory edges constructed using GRN analysis. Edges that explain at least 0.05% of the target’s variance are included. Each edge (green line) connects a TF (black dot) to a target gene (red dot) or another TF.
c, Total number of genes detected in PV and SST interneurons at each timepoint. For P2 and P28, gene expression is divided into maintained from the earlier timepoint (bottom) versus newly expressed (top). Genes with <10 counts across all cells were excluded.
d, Number of edges at each timepoint. Note: In d-f, the x-axis represents the edges that explain up to a certain value of its target’s variance.
e, Edges shared between PV and SST.
f, Proportion of the GRN unique to PV or SST cells at each age.
g, The proportion of unique targets of common TFs. TFs were considered common if they had an absolute LFC ≤0.25 and expressed in >10% of both PV and SST cells. Statistics within graphs represent the mean percentage of unique edges per common TF.
Mef2c loss perturbs interneuron development
Having developed a comprehensive model of gene regulation in PV and SST interneurons, we wished to query how removal of a critical TF impacts gene expression and test our ability to predict these perturbations in silico. In a previous study, we found that Mef2c is essential for PV interneuron development, resulting in their loss after P68. This is consistent with the enrichment of MEF2C motifs in PV-specific ATAC-seq (Fig. 2h). However, our CUT&RUN analysis revealed significant utilization of MEF2C within both PV and SST cells (Fig. 2i–k). Thus, Mef2c provides an ideal exemplar to examine both the unique and shared aspects of gene regulation across these developing cell types.
Using a Lhx6iCre driver to remove Mef2c in both PV and SST cells, we examined the impact on gene expression and chromatin structure at P2. We first integrated scRNA-seq data from these P2 Mef2c conditional knockout (cKO) animals with that from P2 wildtype animals (WT). Unbiased clustering analysis revealed that a greater number of cKO cells colocalize with wild-type SST interneurons than PV cells, indicating that the loss of Mef2c disproportionately disrupts PV cell maturation (Fig. 4a–c). The fragility of cKO neurons necessitated collecting single nuclei for this experiment. To ensure that the differences seen between WT and cKO were not a result of comparing whole cell and nuclear RNA-seq data, we collected an additional wild-type P2 nuclear dataset and confirmed that when compared to cKO, both the clustering and differential gene expression were highly similar to the results using whole cell WT data (Extended Data Fig. 10a–c, Supplementary Table 4).
Figure 4: Loss of Mef2c disproportionately affects the gene regulatory landscape of PV cells.

a, UMAP of integrated E18, P2 and P2 Mef2c cKO scRNA-seq data.
b, UMAP in (a) segregated according to timepoint and color-coded by cell type.
c, Cluster composition delineated by (i) marker gene expression, (ii) cell type, (iii) timepoint, (iv) cell number.
d, Proportion of scATAC-seq peaks with MEF2C motifs in E18 WT, P2 WT, and P2 Mef2c cKO datasets. Charts are scaled to reflect the total number of peaks.
e, Venn diagram showing all peaks with MEF2C motifs in WT P2 and cKO P2 (i) in PV cells, (ii) SST cells.
f, Number of MEF2C binding sites (identified in the MEF2C CUT&RUN experiment, see Fig. 2) that were either accessible in both the P2 WT and Mef2c cKO scATAC-seq dataset (light green) or that were accessible in the P2 WT cells but inaccessible in the cKO (dark green).
g, UMAP of simulated Mef2c knockout cells (P2SimKO) and cells from the true cKO RNA-seq dataset (P2cKO), P2 WT RNA-seq dataset (P2WT), and E18 WT RNA-seq dataset (E18).
Our scATAC-seq analysis of cKO cells confirmed the strong impact of Mef2c loss on PV cell development but also revealed the more subtle impact on SST cells. In clustering analysis of scATAC-seq data, both PV and SST cKO cells segregate from WT cells (Extended Data Fig. 10d–g). Furthermore, during normal development, cell-type specific and shared peaks featuring Mef2c motifs increase in number between E18 and P2. The overall number of peaks seen in the P2 Mef2c cKO cells, however, resembles that seen at E18, indicating a delay in their maturation (Fig. 4d, e). Importantly, the proportion of PV-specific peaks was selectively reduced in the cKO (Fig. 4d, f, Extended Data Fig. 10e). These findings indicate that Mef2c sculpts the chromatin landscapes of both PV and SST interneurons during early postnatal development and plays a particularly important role in the opening of PV-specific loci.
To demonstrate that GRNs are more than a static representation of cell state, we queried whether we could use them to quantitatively predict changes in gene expression. First, we generated simulated Mef2c knockout neurons (P2SimKO) by computationally removing Mef2c in the P2 GRN. By integrating these cells with the experimental cKO (P2cKO) and wildtype P2 (P2WT) cells, we observed clusters formed primarily composed of P2SimKO and P2cKO cells (Fig. 4g, clusters 4 and 5), confirming that our simulated output matched those seen in true cKO cells. Next, we examined the 364 direct targets of Mef2c predicted by the GRN and found that 81% of them were differentially expressed between P2WT and P2cKO datasets (Supplementary Table 4). These direct targets included 17 TFs. We next iteratively calculated the differential expression of their targets (4205 in total) and found that 81% of these predicted second-order Mef2c targets were correctly inferred. The same analysis comparing cKO data to single nucleus rather than whole cell WT data similarly found 79% of direct and 77% of indirect targets were differentially expressed (Supplementary Table 4). Finally, as an independent validation of our P2 GRN, we re-calculated Mef2c transcription factor activity (TFA) using gene expression values measured in the P2cKO dataset. This computational experiment reported a TFA that centers around zero, compared to the unaltered P2 values that centers around −0.1, validating that removal of Mef2c eliminates its TFA from the network. Taken together, these results demonstrate that with sufficient scRNA-seq and ATAC-seq data we are now able to accurately infer the effects of gene loss in silico.
Discussion
In this study, we examined how PV and SST interneurons arise from common progenitors to become molecularly and functionally distinct by adulthood. We observed that these cell types initially share a molecular program that establishes a general interneuron identity before becoming diversified through the actions of cell-type specific TFs. The maintenance of their distinct fates is stabilized in mature cells through the crystallization of unique chromatin landscapes. Our analysis revealed that RNA expression gives an instantaneous measure of a cell’s developmental state, while chromatin provides both a history of a cell’s developmental progression and a predictor of its future identity.
As development proceeds, we found that RNA- and ATAC-seq data remain discordant until interneurons reach their settling positions and begin terminal differentiation at P2. This represents a critical inflection point at which cells transition from having predominantly shared chromatin architecture to establishing cell type specific landscapes. Interestingly, the comparison of GRNs at different developmental timepoints revealed that in adulthood, shared TFs are able to direct cell type specific gene programs. This finding indicates the strong contribution of chromatin architecture to the maintenance of adult fate. Indeed, the ability to reprogram terminally differentiated cells requires the erasure of the unique chromatin marks that characterize them as mature populations26,27.
In addition to providing a global overview of cell type specific molecular programs, GRNs are powerful predictive models. With the anticipated improvements that will be gained through iterative analysis, this has far reaching implications both for developmental biology and for assessing the impact of candidate genes on cell type specific development. In this regard, the fact that MEF2C loss-of-function mutations in humans result in autism spectrum disorder and intellectual disability28,29 suggests that analyses such as this have the potential to provide important insight into the etiology of these disorders. Hence, our work not only reveals how specific interneuron identities arise but also provides a road map for understanding both normal and pathophysiological development.
Methods
Mouse lines
For embryonic timepoints, male hemizygous Dlx6a-Cre mice30 (Jax stock #008199) were crossed with female homozygous Ai9 or Ai14 mice31 (Rosa-LSL-tdtomato, Jax stock # 007909 or 007914) and checked daily for the presence of a vaginal plug, with the morning a plug was found being considered embryonic day 0. Embryos were screened using a fluorescent microscope for the presence of tdTomato. For embryonic timepoints using wild-type mice, timed pregnant CD-1 mice were used (Charles River #022). For postnatal timepoints, male hemizygous Dlx6a-Cre mice were crossed with female homozygous INTACT mice32 (flox-Sun1-eGFP, Jax stock #021039) to yield Dlx6a-Cre;INTACT offspring. In Mef2c conditional knockout experiments, for wild-type controls, Dlx6a-Cre males were crossed with female homozygous Ai9 mice to yield offspring with both alleles collected at P2. For Mef2c conditional knockouts, male Lhx6-iCre/o;Mef2c-Fl/+ mice33,34 (Jax stock #026555 and #025556) were crossed INTACT;Mef2c-Fl/Fl females to yield offspring with all necessary experimental alleles collected at P2. All mouse colonies were maintained in accordance with protocols approved by the Institutional Animal Care and Use Committees at Harvard Medical School and the Broad Institute of MIT and Harvard. Both male and female mice were used for all scATAC-seq and scRNA-seq experiments.
Single-cell preparation for scATAC-seq and scRNA-seq
For both ATAC-seq and RNA-seq library preparation from embryonic timepoints (E13-E18), embryos were harvested from pregnant dams and relevant brain regions were dissected in ice-cold Leibovitz’s L-15 medium. Pooled tissue from several embryos were dissociated using the Neural Tissue Dissociation Kit (T) (Miltyeni Biotec, PN-130–093-231) according to the manufacturer’s instructions. Dissociated cells were then filtered through a 70 um filter, centrifuged at 300xg for 5 min at 4C, and, where cell-sorting was required, resuspended in 1% BSA in PBS for cell sorting of tdTomato+ cells. Sorting was performed on a Sony SH800S cell sorter with a 100 µm chip. Cells for scRNA-seq were then directly used for input to 10x Genomics scRNA-seq library prep. For scATAC-seq, nuclei were isolated from sorted cells as described in the 10x Genomics demonstrated protocol ‘Nuclei Isolation for Single Cell ATAC Sequencing’ for input to single-cell ATAC library preparation. For the P2 whole-cell WT RNA-seq dataset, cell preparation was performed as described above, except with ACSF used for the dissection instead of L-15.
For P10 and P28 RNA-seq datasets, as well as the Mef2c cKO P2 dataset and control WT nuclear P2 dataset, nuclei were isolated as described previously with some modifications32. Briefly, brains were harvested, sectioned coronally on a stainless steel mouse brain slicer (Zivic Instruments), and regions of interest were dissected in ice cold Homogenization Buffer (HB) (0.25M sucrose, 25mM KCl, 5mM MgCl2, 20mM Tricine-KOH, 1mM DTT, 0.15mM spermine, 0.5mM spermidine). Dissected tissue was then transferred to a 2 ml dounce homogenizer containing HB + 0.3% IGEPAL-CA630 + 0.2U/µl RNAse inhibitor and homogenized with 10 strokes of pestle A and 10 strokes of pestle B. Nuclei were then filtered through a 30 μm filter and centrifuged at 500xg for 5 minutes at 4C. The pellet was resuspended in 1% BSA + 0.2U/µl RNAse inhibitor in PBS and centrifuged again at 500xg for 5 minutes at 4C. The pellet was then again resuspended in 1% BSA + 0.2U/µl RNAse inhibitor in PBS and filtered through a 40 μm filter for sorting of GFP+ nuclei on a Sony SH800S cell sorter with a 100 µm chip. Nuclei were collected in 1% BSA + 0.2U/µl RNAse inhibitor for input to 10X Genomics scRNA-seq.
For all ATAC-seq postnatal timepoints (P2 WT and cKO, P10, P28), brains were harvested, sectioned coronally on a stainless-steel mouse brain slicer (Zivic Instruments), and regions of interest were dissected in ice cold ACSF. Tissue was then transferred to a dounce homogenizer containing Lysis Buffer (10 mM Tris-HCl, 10 mM NaCl, 3 mM MgCl2, 0.01% Tween-20, and 0.01% IGEPAL CA-630, 0.001% Digitonin). Tissue was homogenized with 10 strokes of pestle A, 10 strokes of pestle B, and incubated for 5 minutes on ice before being filtered through a 30 μm filter and centrifuged at 500xg for 10 minutes at 4C. The pellet was resuspended in 1% BSA in PBS for sorting for GFP+ nuclei. For all timepoints, cells or nuclei were sorted into Diluted Nuclei Buffer (10x Genomics) on a Sony SH800S cell sorter with a 100 µm chip.
Single-cell ATAC-seq and RNA-seq library preparation and sequencing
Single-cell ATAC-seq libraries for all timepoints were prepared on the 10x Genomics platform using the Chromium Single Cell ATAC Library & Gel Bead Kit v1.0 (PN-1000111), Chromium Chip E Single Cell kit (PN-1000156) and Chromium i7 Multiplex Kit N, Set A (PN-1000084) as instructed by the manufacturer. Single-cell RNA-seq libraries for E13, P2 Mef2c cKO, P10, and P28 datasets were prepared on the 10x Genomics platform using the Chromium Single Cell 3’ Library and Gel Bead Kit v3.0 (PN-1000075), Chromium Single Cell 3’ Library Construction Kit v3.0 (PN-1000078), Chromium Chip B Single Cell kit (PN-1000154) and Chromium i7 Multiplex Kit (PN-120262) as instructed by the manufacturer. The P2 nuclear RNA-seq library was prepared using the Chromium Single Cell 3’ Library and Gel Bead Kit v3.1 (PN-1000121). Single-cell RNA-seq libraries for E18 and P2 whole cell WT datasets were prepared on the 10x Genomics platform using the Chromium Single Cell 3’ Library and Gel Bead Kit v2.0 (PN-120237), Chromium Single Cell 3’ Library Construction Kit v2 (PN-120267), Chromium Chip A Single Cell kit (PN-1000009) and Chromium i7 Multiplex Kit (PN-120262) as instructed by the manufacturer. Libraries were sequenced using the Nova-Seq 100 cycle kit (Illumina) by Broad Institute Genomic Services.
Single-cell ATACseq data processing
Raw scATAC-seq data was processed using the standard CellRanger ATAC v1.1.0 pipeline (10x Genomics). Reads were aligned to the GRCm38 (mm10) mus musculus genome. Peak calling was performed using ChromA with default parameters “ChromA atac -i <file1> <file2> -spec mouse”. Peak calling on subpopulations of cells was performed with ChromA after isolation specific barcodes using “ChromA filter -c <cells> -i <file>”. Jaccard distance calculation was performed using bedtools jaccard.
Single-cell RNA-seq data processing
Raw scRNA-seq data was processed using the standard CellRanger v3.0.0 pipeline (10x Genomics). Reads were aligned to the GRCm38 (mm10) mus musculus genome. For single-nuclei RNA-seq datasets, a custom pre-mRNA reference from the mm10 genome was generated allowing intronic sequences to be included in gene counts. It cannot be ruled out that some differences in gene expression could result from differences in 10X Genomics chemistry (v2 vs v3) or cell preparation techniques (whole cell vs nuclear).
E13 Multiome (dual RNA/ATAC) library preparation and data processing
E13.5 embryos were harvested from timed pregnant CD-1 mice and the MGE was dissected in ice-cold Leibovitz’s L-15 medium. Pooled tissue from several embryos were dissociated using the Neural Tissue Dissociation Kit (T) (Miltyeni Biotec, PN-130–093-231) according to the manufacturer’s instructions. Dissociated cells were then filtered through a 70 um filter, and centrifuged at 300xg for 5 min at 4C. Nuclei then were isolated as described in the 10x Genomics demonstrated protocols ‘Nuclei Isolation from Embryonic Mouse Brain for Single Cell Multiome ATAC + Gene Expression Sequencing’ for fresh tissue for input to single-cell Multiome library preparation. Single-cell multiomic (ATAC + Gene Expression) libraries were prepared on the 10x Genomics platform using the Chromium Next GEM Single Cell Multiome ATAC + Gene Expression Reagent Bundle (PN-1000285), Chromium Next GEM Chip J Single Cell Kit (PN-1000230), Single Index Kit N Set A (Pn- PN-1000212) and Dual Index Kit TT Set A (PN-1000215) as instructed by the manufacturer. Libraries were sequenced using the Nova-Seq 100 cycle kit (ATAC library) and Next-Seq 150 cycle kit (Gene Expression library) (Illumina) by Broad Institute Genomic Services.
Raw multiomic data was processed using the Cell Ranger ARC v1.0.0 pipeline (10x Genomics). Reads were aligned to the GRCm38 (mm10) mus musculus genome.
Assignment of mitotic and postmitotic states
We defined mitotic and postmitotic populations for cells within scRNA-seq datasets following the procedure of Mayer et al8. Briefly, in each cell we compared the sum of phase-specific gene expression to the distribution of background 100 randomly selected genes. Phase specific enrichment was z-scored against the background gene sets. Finally, the S-phase score and G2/M phase score was subtracted to create the cell cycle score which is used to select cycling cells. Cell cycle signature was calculated using the previously published cell cycle gene list35. We did not regress out the cell cycle signature. In scATAC-seq datasets, cells were assigned a developmental phase by extending labels of multiome experiments. In multiome experiments, the scRNA-seq portion of the data can be annotated using the above procedure and these labels can be propagated to the corresponding scATAC-seq dataset.
Pseudotime Trajectory Analysis
Branch analysis for postmitotic cells from the scRNA-seq datasets was performed as described previously8. Briefly, postmitotic cells were isolated and the Seurat pipeline was run.19 Unsupervised clustering was run using the Leiden algorithm. Next, diffusion map representation was calculated using the diffusionMap library in R. Finally, 10 pca components were fed into Palantir36 and pseudotime and branch probabilities were calculated using the following parameters (num_waypoints=1000, knn=30). Lineages were defined using slingshot.37
Generation of Pseudotime Time Traces of Gene Expression and Accessibility
Chromatin accessibility and gene expression time traces were smoothed over pseudotime with local polynomial regression fitting in R (loess) separately, then min-max normalized.
Peak - Gene Branch Specific Association
To associate chromatin accessibility peaks annotated with ChromA38 to corresponding genes, we treated each gene independently. First, we selected peaks located within a 500kb window around the gene and built a classifier by using these peaks as features in an elasticnet regularized mutlinomial classification (sklearn SGDClassifier with following parameters class_weight=‘balanced’, l1_ratio=0.95, loss=‘log’, penalty=‘elasticnet’) task set to distinguish cells confidently assigned to each postmitotic branch using peaks as features. Hyper parameters were tuned using cross validation, and performances estimated using an 80%(train) 10%(validation) 10%(test) observation split. Finally, the most classification relevant peaks are kept and sorted if their absolute coefficient is > 0. Distal aggregated accessibility score was built by first min-max normalization of each peak time trace (through pseudotime). Next, time traces were added and min-max normalized again. The same classification procedure was used to annotated cells belonging to each branch or early mitotic cells. Mitotic cells were distinguished by the mitotic-postmitotic separation. Early mitotic cells were those mitotic cells lacking expression of Sp9.
Calculation of ATAC-seq aggregated scores
Aggregated scores were calculated by selecting a subset of peaks which are differentially accessible in the condition of interest (i.e., peaks for the calculation of branch 1 aggregated scores are peaks differentially accessible in branch 1 cells compared to branch 2 and 3). Next, library size was corrected by normalizing the number of reads in each region by the total number of reads in the cell. The normalized read size was aggregated by summing reads in selected regions. Finally, an average aggregated accessibility was computed.
scATAC-seq cell type classification
Cardinal class assignments into PV and SST cell types at P28 and P10 was performed by analyzing clusters for promoter accessibility of cardinal class marker genes. Next, to transfer labels to E18, we identified mutually exclusive peaks shared in each cardinal class at P28 and P10 (i.e. running ChromA consensus on data sets from PV cells belonging to P10 and P28 or SST at the same time points). We used these peaks to build a classifier identifying cardinal classes and using CGE cells as a null hypothesis. We repeated the same procedure to transfer labels at E14 by using mutually exclusive peaks from E18 and P10.
Clustering of scRNA-seq datasets
E18, P2, P10, and P28 scRNA-seq datasets were processed using the Seurat pipeline19. The number of principal components used for clustering analysis were determined with the ElbowPlot function. Graph-based clustering was then used as described to assign cells to clusters. Clusters in P28 dataset were then assigned to a cardinal class based on the expression of marker genes. Cells within P10, P2, and E18 datasets were assigned to a cardinal class via Seurat CCA and label transfer of P28 dataset cardinal class assignments as described previously.8
Generation of snap objects and integration of scATAC and scRNA-seq data
The fragments.tsv from the output of the CellRanger ATAC pipeline were then used to generate snap files for analysis using the snapATAC package as described previously18. 5kb bins were used to partition the genome and create the cell-by-bin matrix. Cells were clustered using k-nearest neighbor graph-based clustering (k=15). For visualization of marker gene loci, accessibility within gene body regions was calculated, counts were normalized by RPM, and the resulting cell-by-gene matrix was smoothed with Magic. For integration with scRNA-seq data, a cell-by-gene matrix was produced for the scATAC-seq dataset with the same method for all variable genes within the RNA-seq dataset. The scATAC-seq cell-by-gene matrix was then converted to a Seurat object using the snapATAC function snapToSeurat. Defining transfer anchors and alignment of scATAC and scRNA-seq data was then performed as described previously19.
Generation of accessibility heatmaps
Accessibility heatmaps (for cardinal class-specific regions and comparison of proximal vs. distal elements) were generated using bedtools computeMatrix and plotHeatmap. Reference files were bed files of peaks exclusively called within the given cardinal class. For comparison of proximal and distal elements, proximal elements were defined as those regions falling within gene bodies or promoter regions (TSS +/− 2kb), while distal elements comprised everything outside these regions.
Motif enrichment analysis
TF motif enrichment analysis was performed on appropriate bed files using Homer39 with the following parameters: findMotifsGenome.pl input.bed mm10 output -size 200 -len 8. For identification of branch-specific TFs, the intersection was found between motifs significantly enriched in only one branch (within branch-exclusive loci) and whose corresponding TF was differentially expressed within the same branch compared to the other two branches. In Figure 2, motif enrichment is quantified as the percentage enriched, normalized to the enrichment of the top % enriched motif to account for differences in the overall number accessible of peaks across developmental datasets.
Mef2c CUT&RUN library preparation
Nuclear isolation was performed as described previously32. The neocortex was dissected from adult Pv-Cre;INTACT and Sst-Cre;INTACT mice in ice-cold buffer HB [0.25 M sucrose, 25 mM KCl, 5 mM MgCl2, 20 mM Tricine-KOH pH 7.8, 1 mM DTT, 0.15 mM spermine, 0.5 mM spermidine, 1X cOmpleteTM, EDTA-free Protease Inhibitor Cocktail (Sigma), and 10 mM Sodium Butyrate]. Cortices were homogenized by a dounce homogenizer in the presence of 0.3% IGEPAL. The homogenate was then filtered through a 30 µm MACS SmartStrainer (Miltenyi Biotec), mixed with working solution [5 volume of OptiPrep + 1 volume of Diluent (150 mM KCl, 30 mM MgCl2, and 120 mM Tricine-KOH pH 7.8)] at a 1:1 ratio, and underlaid with 30% and 40% gradient solution (working solution diluted by buffer HB). Following ultracentrifugation at 10,000g for 18 mins at 4°C, nuclei were collected from the interface of 30% and 40% layers and then resuspended in FACS buffer (1X PBS, 1% BSA, 1X Protease Inhibitor Cocktail, and 10 mM Sodium Butyrate) for sorting GFP-positive nuclei on a Sony SH800S sorter.
CUT&RUN on sorted nuclei was performed as described previously40. Nuclei were resuspended in CUT&RUN wash buffer (20 mM HEPES pH 7.5, 150 mM NaCl, 0.2% Tween 20, 1 mg/ml BSA, 0.5 mM Spermidine, 1X Protease Inhibitor Cocktail, and 10 mM Sodium Butyrate) and captured with Concanavalin A beads (Bangs Laboratories) at room temperature for 10 mins. Bead-bound nuclei were then incubated with MEF2C antibody (182901-AP, Proteintech, 1:100) in antibody buffer (CUT&RUN wash buffer, 0.1% Triton X-100, and 2 mM EDTA) overnight at 4°C. The next day, beads were washed twice with antibody buffer and then incubated with pA-MNase (0.7 µg/ml) in antibody buffer at 4°C for 1 hour. After two washes with Triton wash buffer (CUT&RUN wash buffer and 0.1% Triton X-100), tethered cleavage was induced by addition of CaCl2 at a final concentration of 3mM on ice for 30 mins. To release protein-DNA complex, nuclei were combined with 2X STOP solution (340 mM NaCl, 20 mM EDTA, 4 mM EGTA, 0.04% Triton X-100, and 50 µg/ml RNase A) at a 1:1 ratio and incubated at 37°C for 20 mins. Solubilized chromatin was separated from bead-bound nuclei on a magnetic rack, supplemented with 0.1% SDS, and then digested with 0.2 mg/ml Proteinase K at 65°C for 1 hour. Released DNA was extracted with phenol chloroform. CUT&RUN libraries were constructed using NEBNext Ultra II DNA Library Prep Kit as described previously.41 Libraries with different barcodes were pooled and sequenced on NextSeq with NextSeq 500/550 High Output Kit v2 (75 cycles), generating 7–14 million paired-end 42-bp reads per sample.
Mef2c CUT&RUN data processing and analysis
CUT&RUN data were processed as described previously.42 Briefly, paired-end reads were trimmed with Trimmomatic to remove adaptor sequences. Trimmed reads were then aligned to the mm10 genome using Bowtie2 with the –dovetail setting enabled. PCR duplicates, multiple mapped reads, and reads overlapping with the blacklist regions were excluded from downstream analyses. To ensure all libraries were compared at the same read depth, BAM files were downsampled to 8.5 million reads before peak calling. For each sample, peaks were called and bigwig files were generated using MACS2 (-f BAMPE -g mm -q 0.05 -B) (v.2.2.7.1; https://github.com/taoliu/MACS). Because the majority of CUT&RUN peaks overlapped with scATAC-seq peaks, scATAC-seq coaccessibility data was used to assign peaks to gene promoters. For this, the Cicero package43 was used to generate co-accessibility scores (conns) for each peak as described previously for P28 V1 scATAC-seq data. The resulting table was then filtered for those containing peaks falling within promoter regions (within 2 kb of a TSS), then for those connections with a co-accessibility score over 0.2. Finally, the peaks fitting these criteria were filtered for those overlapping with CUT&RUN peaks. Finally, genes associated with the promoters co-accessible with these peaks were used for downstream analysis (comparison of number of genes associated, gene ontology). Gene ontology analysis was performed using ClusterProfiler (https://github.com/YuLab-SMU/clusterProfiler).
Gene regulatory network inference
Gene regulatory network inference was performed using a previously described the multitask learning algorithm25 implemented in the inferelator pipeline (https://github.com/flatironinstitute/inferelator)44. Briefly, cellular gene expression (in matrix form, dimensions cells by genes) was represented as a linear multiplication between a transcription factor (TF) activity matrix (in matrix form, dimensions cells by TFs) and the gene regulatory network linking genes to TFs (in matrix form, dimensions TF by genes). First, a prior structure of the gene regulatory network was calculated by using chromatin information to identify TF binding motif and link TFs to nearby genes (inferelator-prior; http://github.com/flatironinstitute/inferelator-prior). Next, the transcription factor activity matrix was computed by inverting the linear system, using the already computed prior network matrix. Finally, gene expression and the activity matrix were fed into the multitask learning pipeline. Gene regulatory networks are displayed by using jp-gene-viz (https://github.com/simonsfoundation/jp_gene_viz). To simulate Mef2c KO expression data, we set to zero the Mef2c value in the transcription factor (TF) activity matrix and then multiplied this matrix by the gene regulatory network. These simulated expression values were then processed through the regular RNA-seq processing pipeline. Scripts for analysis are available at https://github.com/marianogabitto/ChromatinDynamics2020-Analysis.
Mef2c cKO RNA-seq data processing
Single-cell RNA-seq datasets collected from the cortex of wild-type animals at E18 and P2, and from Mef2c conditional knockout animals at P2 (P2Mef2c-KO), were aligned by different methods (Seurat, Conos; using default parameters), with both algorithms displaying similar results. The results shown in the main figure represent Seurat alignment after regular pre-processing.
Mef2c cKO ATAC-seq data processing
The P2 scATAC-seq data from Mef2c cKO animals was processed to generate a SnapATAC object and the cluster the cells as described above. Clusters were assigned to the PV or SST cardinal class based on the accessibility of marker genes for either class. Peaks were then called for each class using ChromA38. HOMER analysis was performed as described above to annotate peaks containing a Mef2c motif for comparison to E18 and P2 wild-type datasets. The overlap of peaks across datasets or cell types was determined using bedtools jaccard.
Mef2c in silico cKO prediction
The P2-Mef2c-simKO dataset reconstructed from our network inference algorithm (equation 1) was computed in the following way.
First, we modeled the expression X of a gene i in a sample j (Xij) as the weighted sum of the activities of each transcription factor k at sample j (Ak,j). Magnitude and direction (activation or repression) of a regulatory interaction between transcription factor k and gene i were learned by solving for β. Next, in the A matrix, Mef2c activity was zeroed for every cell (A*). Finally, the P2-Mef2c-simKO reconstructed gene expression (X*) matrix was calculated by multiplying β by A*. To calculate knock-out TFA, we solved equation 1 by inverting the relationship between the network and the transcription factor activity (Â=βprior−1 XMef2c-cKO). In this case, we used gene expression values belonging to P2-Mef2c-cKO dataset and the network was our prior network computed from the P2 WT dataset. Log fold change was then computed between P2-Mef2c-WT vs P2-Mef2c-cKO. For this analysis, PV and SST cells were grouped together and the perturbation was performed on the population as a whole, and compared to the entire true KO and WT datasets containing both PV and SST cells.In order to predict targets of Mef2c, genes with edges connected directly to Mef2c were considered direct targets. Of these, 17 were TFs. Genes connected to these 17 TFs were considered indirect targets of Mef2c. To determine the validity of these predicted targets, they were compared to experimental Mef2c cKO scRNA-seq data compared to both whole single cell (WTwc) and single nuclear (WTnuc) wild-type scRNA-seq data. Both comparisons were considered because the whole cell WT dataset was used to compute the GRN, but the cKO dataset was collected using single nuclei and we thus wanted to ensure that differentially expressed genes were not a result of comparing whole cell to nuclear data. To that end, Batchelor and scran were used to preprocessed and compute batch corrected expression matrices. Two alignments were then computed : WTwc and cKO (WTK); WTnuc and cKO (WTNK). Each alignment were preprocessed with multiBatchNorm using the genes intersection between each dataset pair, and corrected expression generated with fastMNN. The average corrected expression by condition was then computed. Fold change of average corrected expression was then computed using the following formula : FC = (A-B)/B. We then scored each of direct and indirect Mef2c targets identified in the P2 GRN, and considered our prediction accurate if the fold change was >=.5 or <=−.25.
Statistics
No statistical methods were used to predetermine sample sizes. Clustering of scRNA-seq and scATAC-seq data was performed in an unbiased manner. For motif analysis, a p-value of less than 0.01 was considered significant. A non-parametric Wilcoxon rank sum test was used to find differentially expressed genes between clusters or cell types within scRNA-seq datasets. For scATAC-seq datasets, ChromA was used to call peaks within each dataset as described above and peaks called exclusively within a dataset were used to define mutually exclusive peaks.
Code Availability
The ChromA package, used for peak calling in all scATAC-seq datasets, is available at https://github.com/marianogabitto/ChromA. The CellRanger and CellRanger ATAC pipelines, used for preprocessing of scRNA- and scATAC-seq libraries, respectively, are available at https://support.10xgenomics.com/single-cell-gene-expression/software/downloads/latest and https://support.10xgenomics.com/single-cell-atac/software/downloads/latest. The snapATAC package, used for downstream analysis of scATAC-seq datasets, is available at https://github.com/r3fang/SnapATAC. The Seurat package, used for scRNA-seq analysis and integration of scRNA- and scATAC-seq datasets, is available at https://github.com/satijalab/seurat. Scripts for analysis are available at https://github.com/marianogabitto/ChromatinDynamics2020-Analysis.
Data Availability
All sequencing data produced for this study are available at the Gene Expression Omnibus (GEO) at GEO accession number GSE165233. E18 scRNA-seq data is available from GEO under the accession number GSE104158. P28 V1 scATAC-seq data is available from GEO under accession number GSE152449.
Extended Data
Extended Data Figure 1. Quality control of embryonic scRNA-seq samples and mitotic versus postmitotic discrimination.
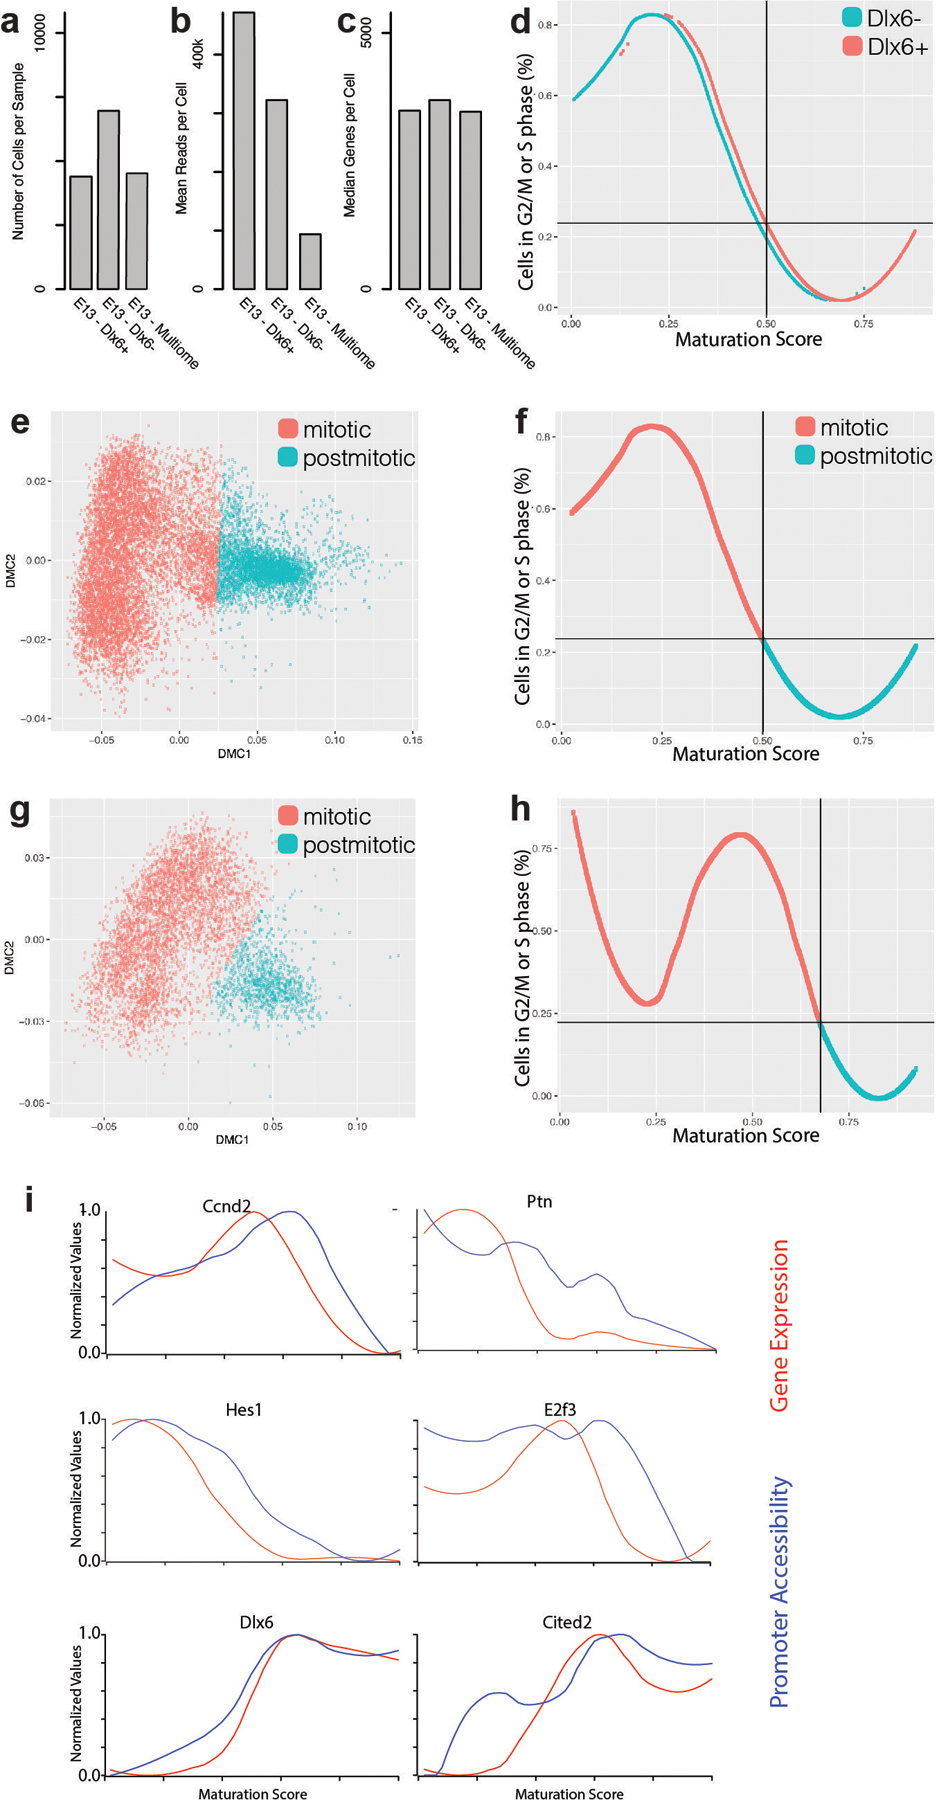
a, Number of cells in Dlx6a− and Dlx6a+ scRNA-seq datasets collected from E13 MGE in Dlx6a-Cre;Ai9 mice and multiome dataset in E13 MGE wild type mice.
b, Mean reads per cell in Dlx6a−, Dlx6a+ and multiome scRNA-seq datasets.
c, Median genes detected per cell in Dlx6a−, Dlx6a+ and multiome scRNA-seq datasets.
d, Fraction of cells scored to be in G2/M or S phase of the cycle cycle at each maturation score. Blue line indicates cells from the Dlx6- dataset, red line indicates cells from the Dlx6+ dataset.
e, Diffusion map of E13 Dlx6a− and Dlx6a+ MGE scRNA-seq data color-coded by assignment to a mitotic (red) or postmitotic (blue) state.
f, Percentage of cycling cells as a function of the position along the maturation trajectory color-coded by assignment to a mitotic (red) or postmitotic (blue) state in E13 Dlx6a− and Dlx6a+ MGE scRNA-seq datasets.
g, Diffusion map of E13 multiome MGE scRNA-seq data color-coded by assignment to a mitotic (red) or postmitotic (blue) state.
h, Percentage of cycling cells as a function of the position along the maturation trajectory color-coded by assignment to a mitotic (red) or postmitotic (blue) state in E13 multiome MGE scRNA-seq dataset.
i, Line plots indicating the promoter accessibility (blue) and gene expression (red) for six developmentally-regulated genes.
Extended Data Figure 2. Developmental characterization of embryonic E13 MGE cells surveyed using scRNA-seq, scATAC-seq, and multiomic methods.
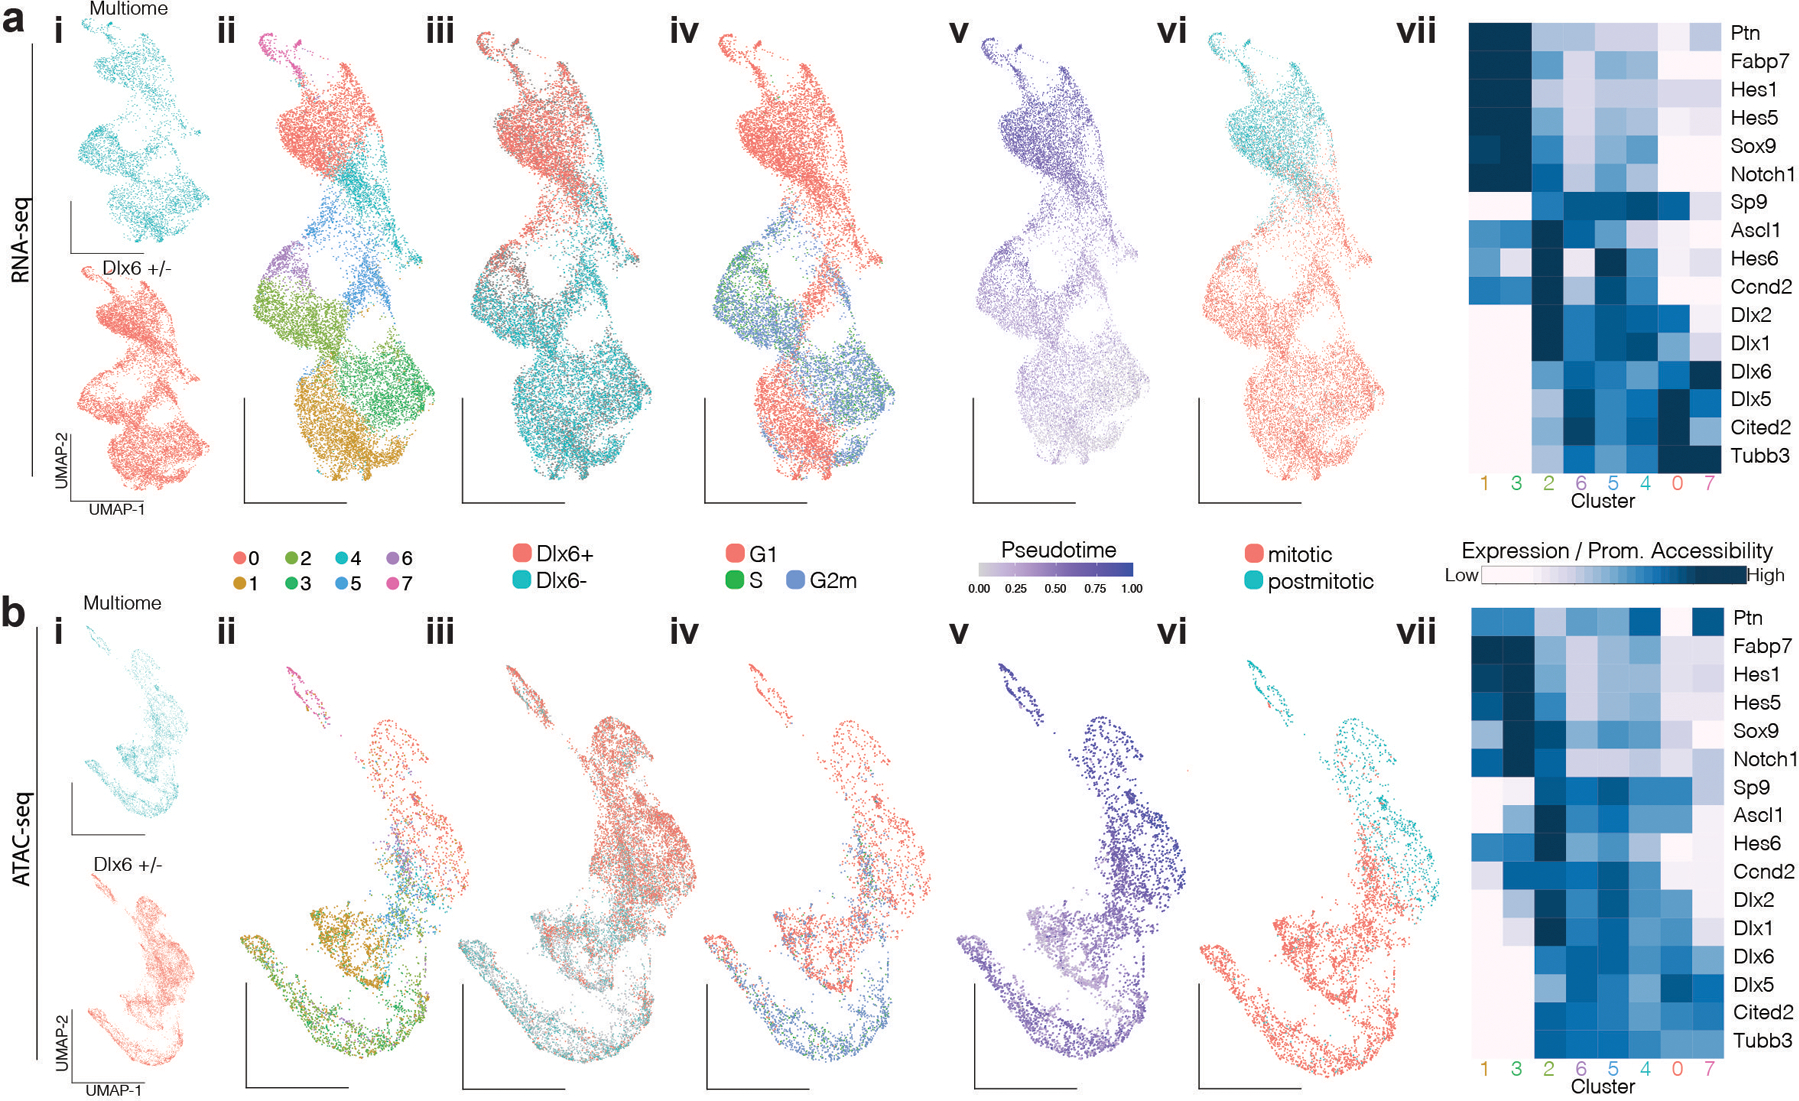
a, Analysis of Dlx6a−, Dlx6a+ and multiome scRNA-seq datasets collected from E13 MGE in Dlx6a-Cre;Ai9 mice and multiome dataset in E13 MGE wild type mice.
b, Analysis of Dlx6a−, Dlx6a+ and multiome scATAC-seq datasets collected from E13 MGE in Dlx6a-Cre;Ai9 mice and multiome dataset in E13 MGE wild type mice.
i, Dlx6+/− FAC-sorted and multiome cells.
ii, Unbiased cluster annotation.
iii, Dlx6+ and Dlx6- annotation.
iv, Cell cycling phase annotation.
v, Pseudotime annotation.
vi, Mitotic and postmitotic cell annotation.
In ii-vi, Annotations are performed on scRNA-seq datasets and transferred to scATAC-seq datasets through the multiome dataset. scRNA- and scATAC-seq low dimensional representation reflects UMAP embedding.
vii, Average gene expression and promoter accessibility for unbiased clusters.
Extended Data Figure 3. Orthogonal maturation trajectory methods reveal branching fates in postmitotic MGE cells at E13.
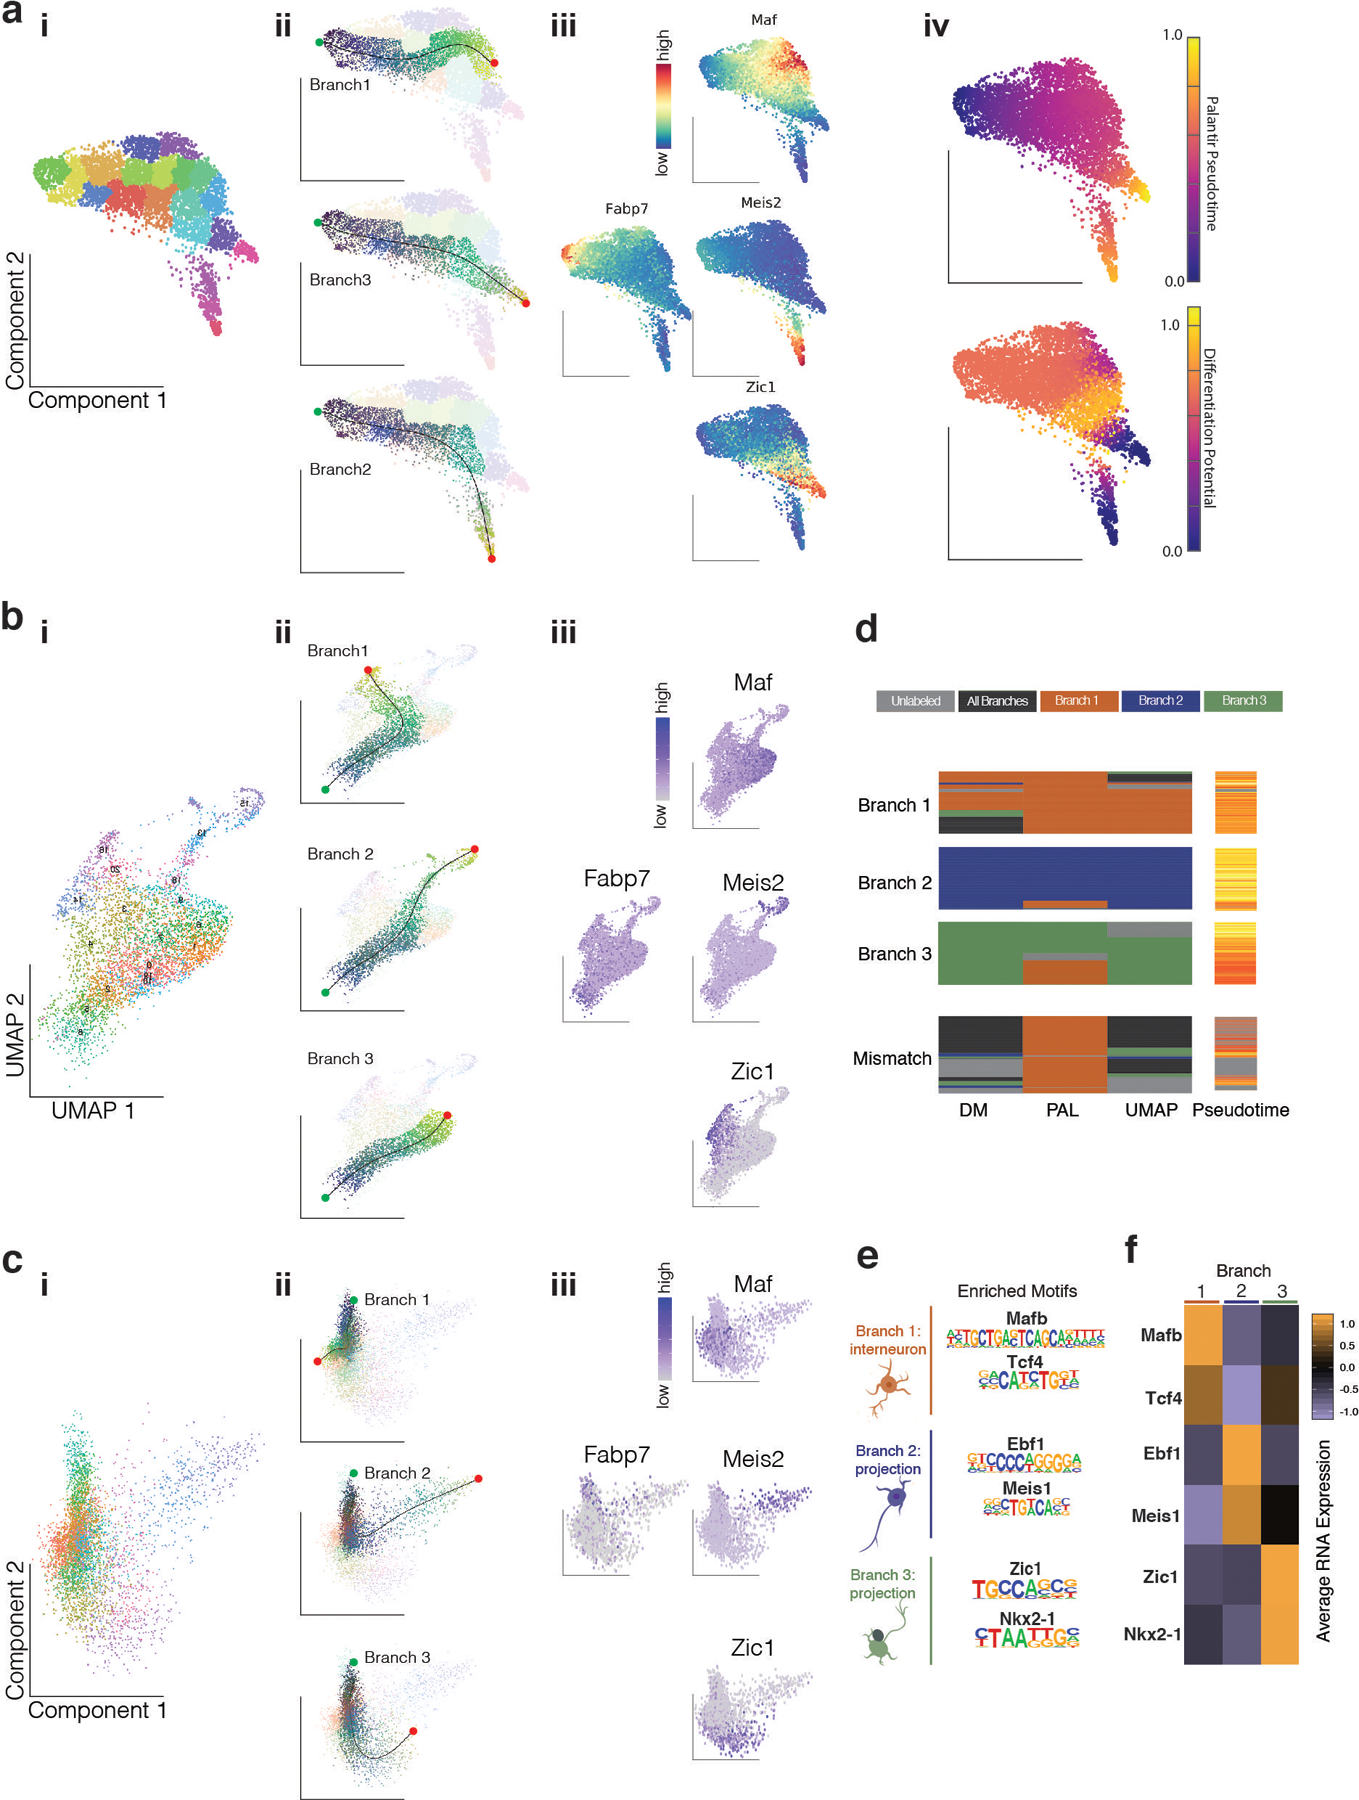
a, Palantir Analysis of Analysis of Dlx6a−, Dlx6a+ and multiome scRNA-seq postmitotic cells.
b, UMAP Analysis of Analysis of Dlx6a−, Dlx6a+ and multiome scRNA-seq postmitotic cells.
c, Diffusion Maps Analysis of Analysis of Dlx6a−, Dlx6a+ and multiome scRNA-seq postmitotic cells.
For a, b, c:
i, Unbiased clustering annotation.
ii, Branch trajectories color-coded by slingshot pseudotime.
iii, Gene expression for mitotic marker (Fabp7) and branch-specific marker (Zic1, Meis2, Maf).
iv, For Palantir, cells are color coded by Palatir Pseudotime or Differentiation Potential.
d, Confusion matrix reveals agreement of branch labels between different trajectory methods.
e, TFs with binding motif highly enriched in a branch specific manner.
f, Average gene expression across branches for TFs in e.
Extended Data Figure 4. Chromatin accessibility precedes gene expression in branch 1- specific genes.
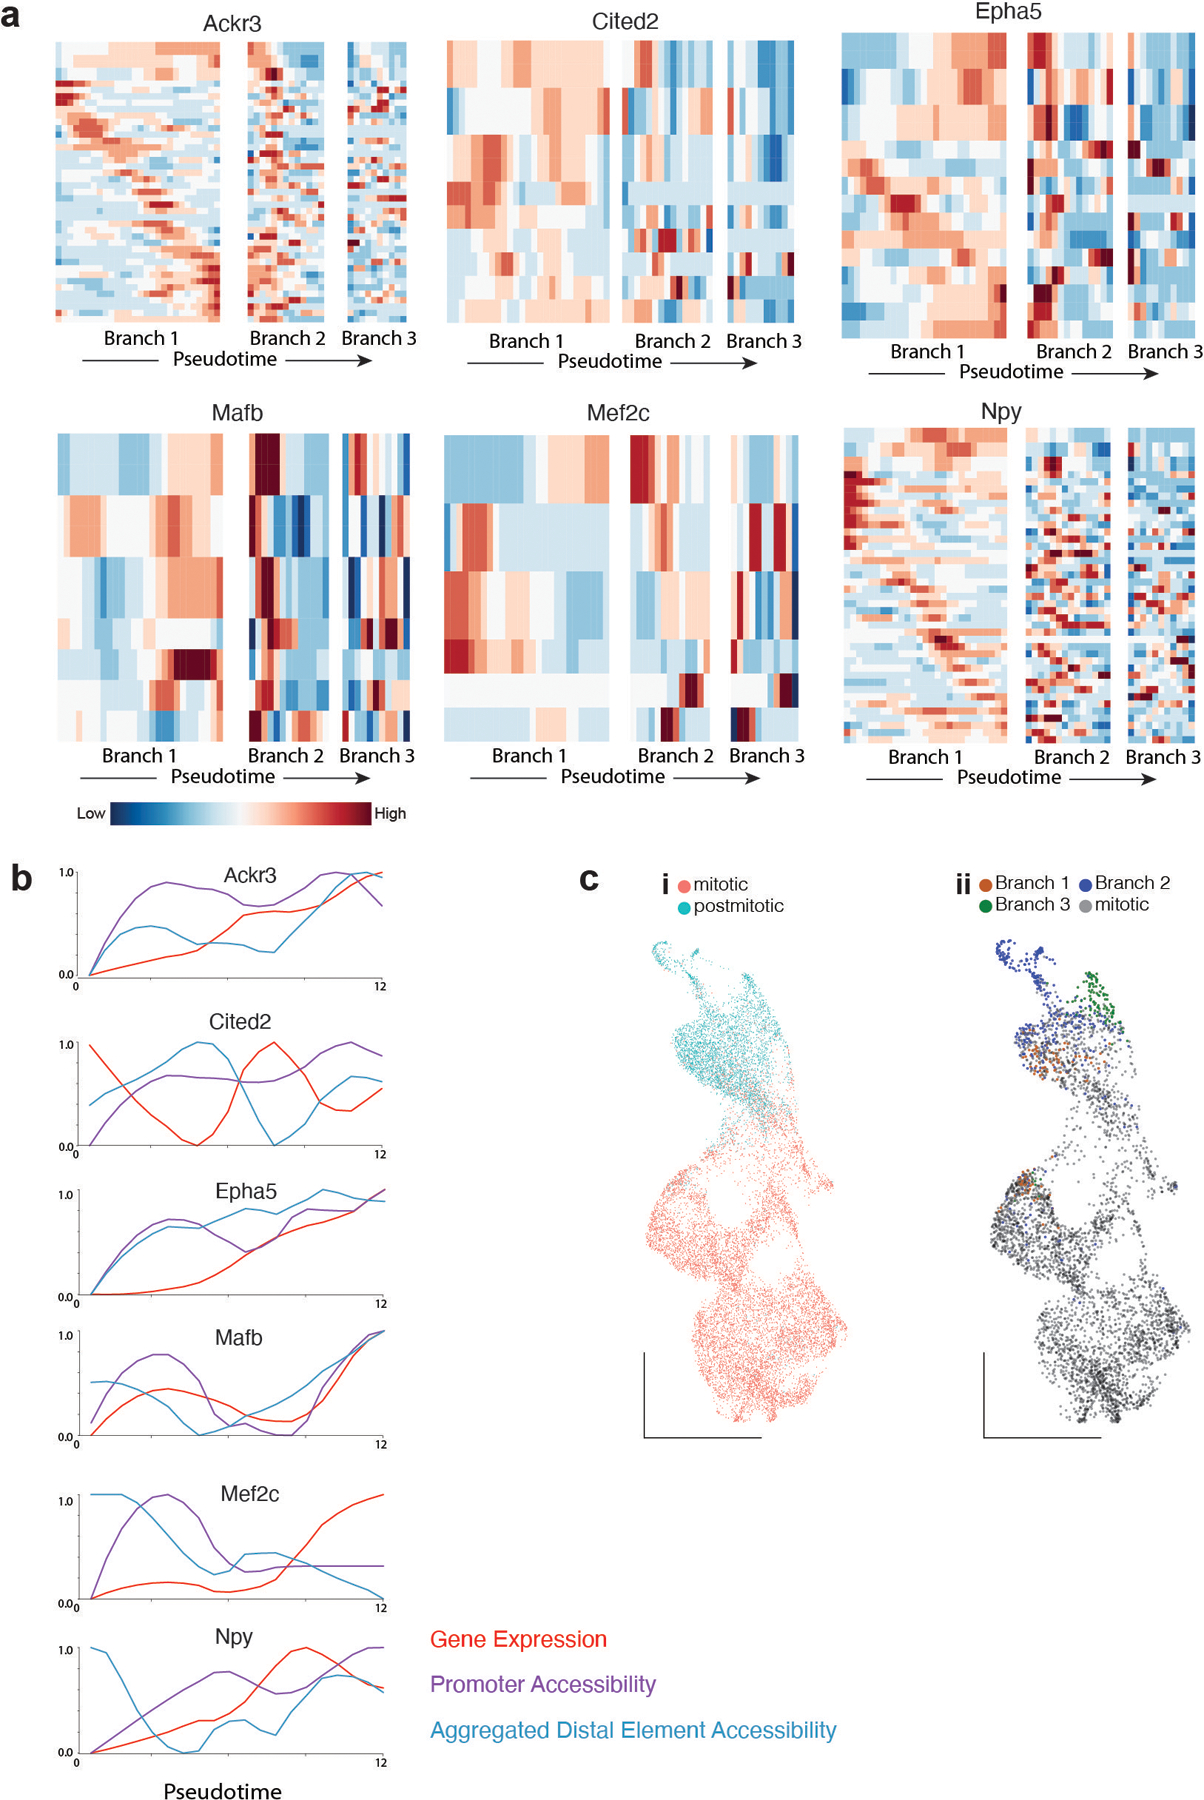
a, Heatmap depicting gene expression, Promoter and distal elements accessibility throughout branch 1 pseudotime for loci +/− 500kb around six branch 1 - specific genes. Distal elements are selected based on the relevance for classifying branch 1 cells. For each gene, row 1 shows gene expression, row 2 promoter accessibility, row 3 aggregated accessibility and the remaining rows are distal branch 1 classifying elements. Each trace has been smoothed using the lowess function in R.
b, Gene expression, Promoter and Aggregated accessibility throughout branch 1 pseudotime for 10 branch 1 - specific genes.
c, Only postmitotic cells are classified as branch neurons by supervised classification methods.
c-i) Classification of E13 cells into mitotic or postmitotic cells based on cell cycle RNA score.
c-ii) Classification of E13 cells into mitotic or branch 1,2,3 lineages based on chromatin accessibility.
Extended Data Figure 5: Analysis of MGE-derived cortical interneuron scRNA-seq datasets from E18 through P28.
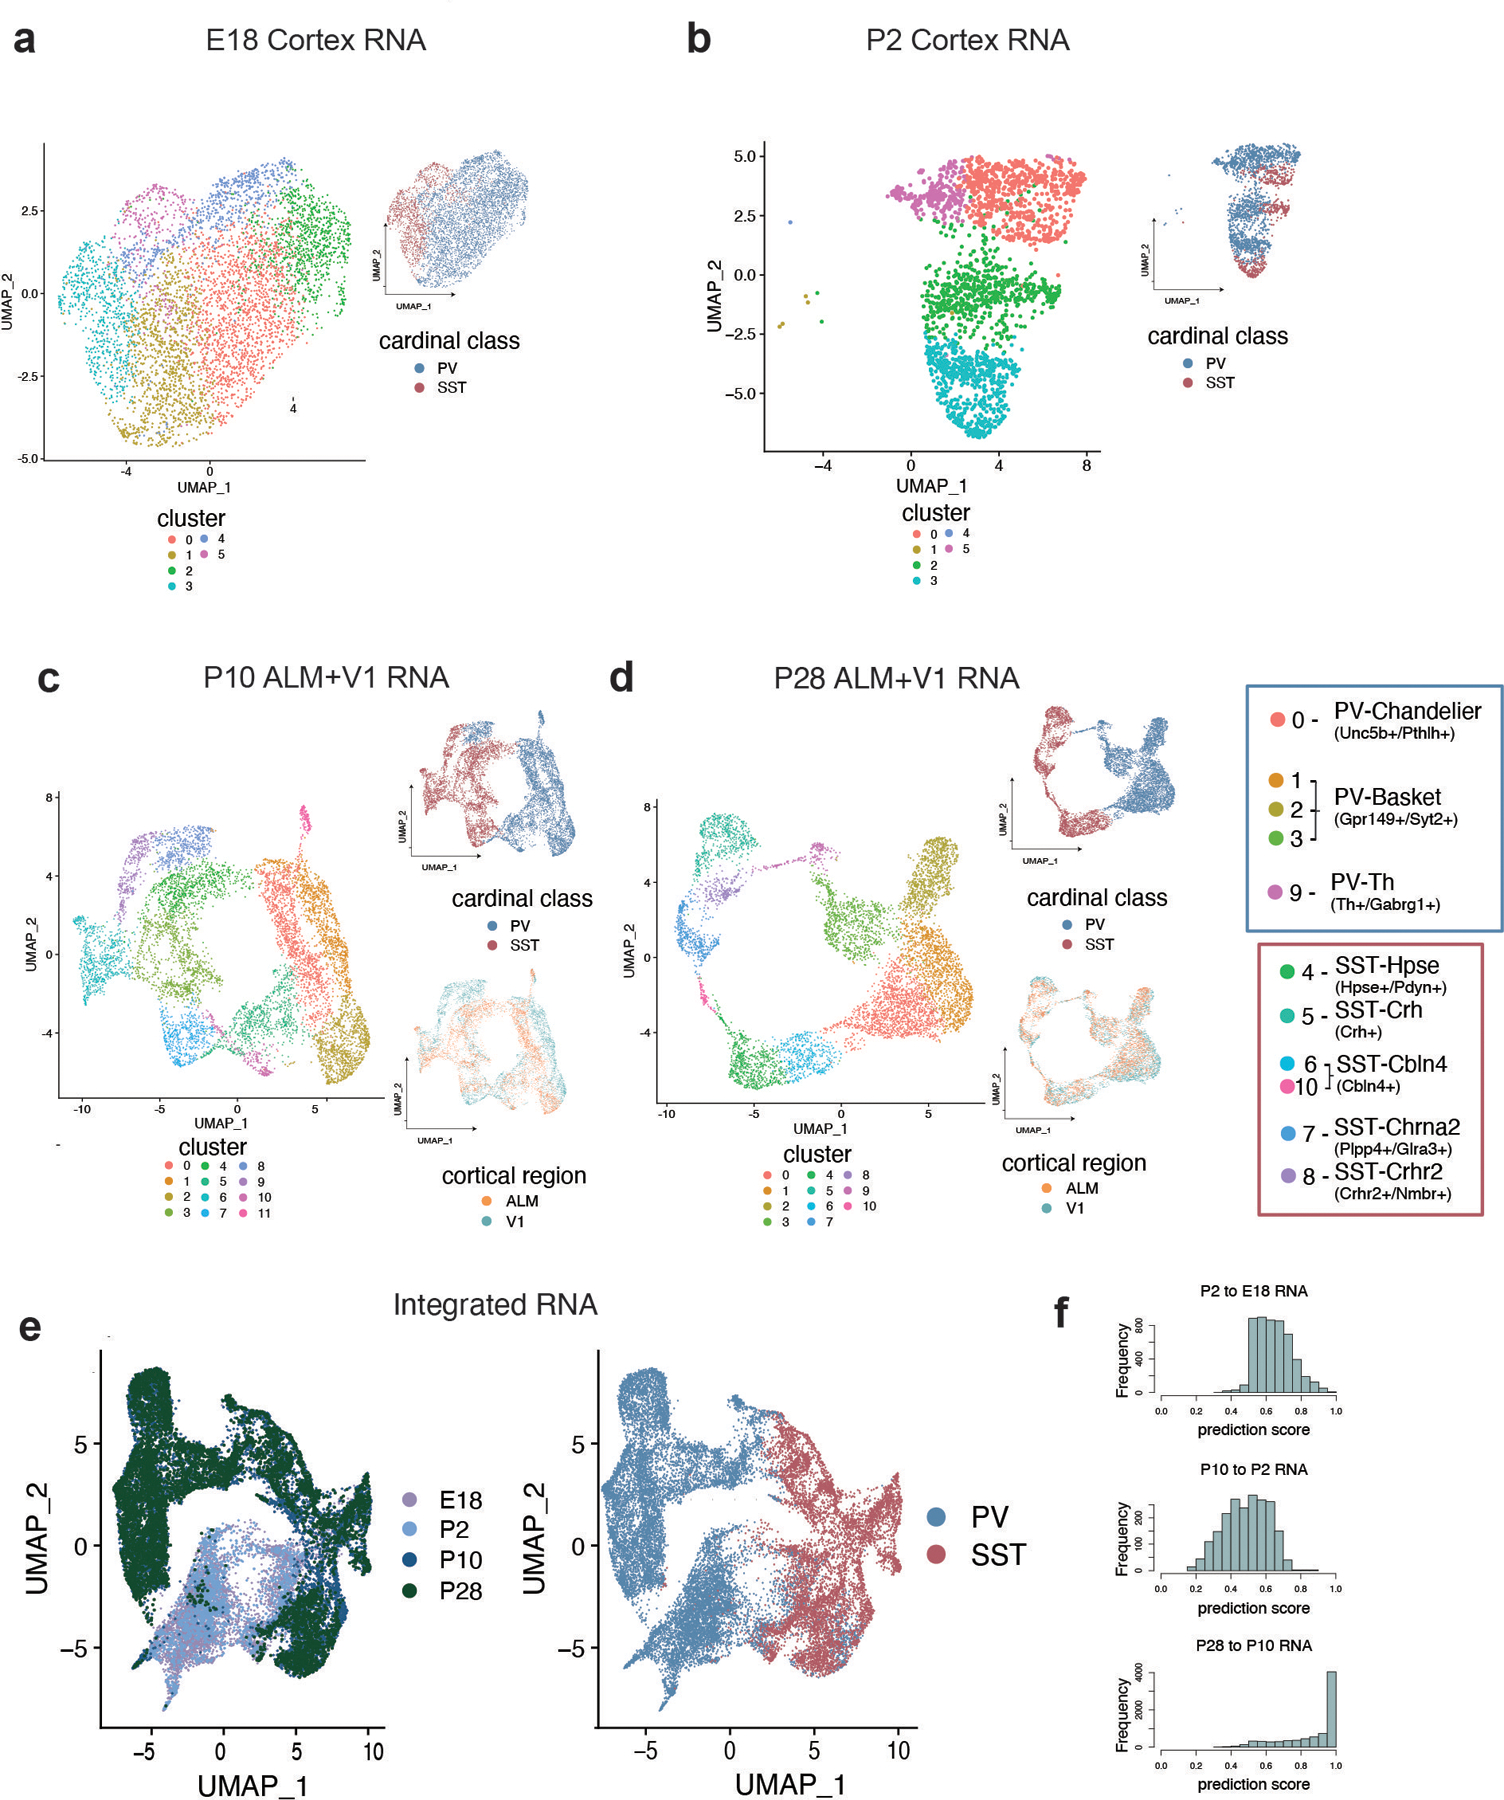
a-d, UMAP showing individual scRNA-seq datasets from Dlx6a+ labeled cortical neurons, subsetted for PV+ and SST+ interneurons, collected at E18 (a), P2 (b), P10 (c), and P28 (d). Left UMAP in each panel is color-coded by cluster identity (individually determined for each dataset). Right UMAP in each panel is color-coded by cardinal class. Bottom right UMAP in (c) and (d) is color-coded by cortical region of origin (anterior lateral motor cortex - ALM, primary visual cortex - V1). In (d), the right-most boxes show each cluster linked to its subtype identity, determined by expression of marker genes.
e, Integration of E18, P2, P10, and P28 scRNA-seq datasets using Seurat CCA. Left UMAP is color-coded by timepoint, right is color-coded by cardinal class.
f, Prediction score indicating the confidence of label transfer between each timepoint. Cluster labels were transferred from P2 to E18 (top), from P10 to P2 (middle) and from P28 and P10 (bottom). Label transfer prediction scores were lowest between P10 and P2 timepoints.
Extended Data Figure 6: Analysis of MGE-derived interneuron scATAC-seq datasets from E18 through P28.
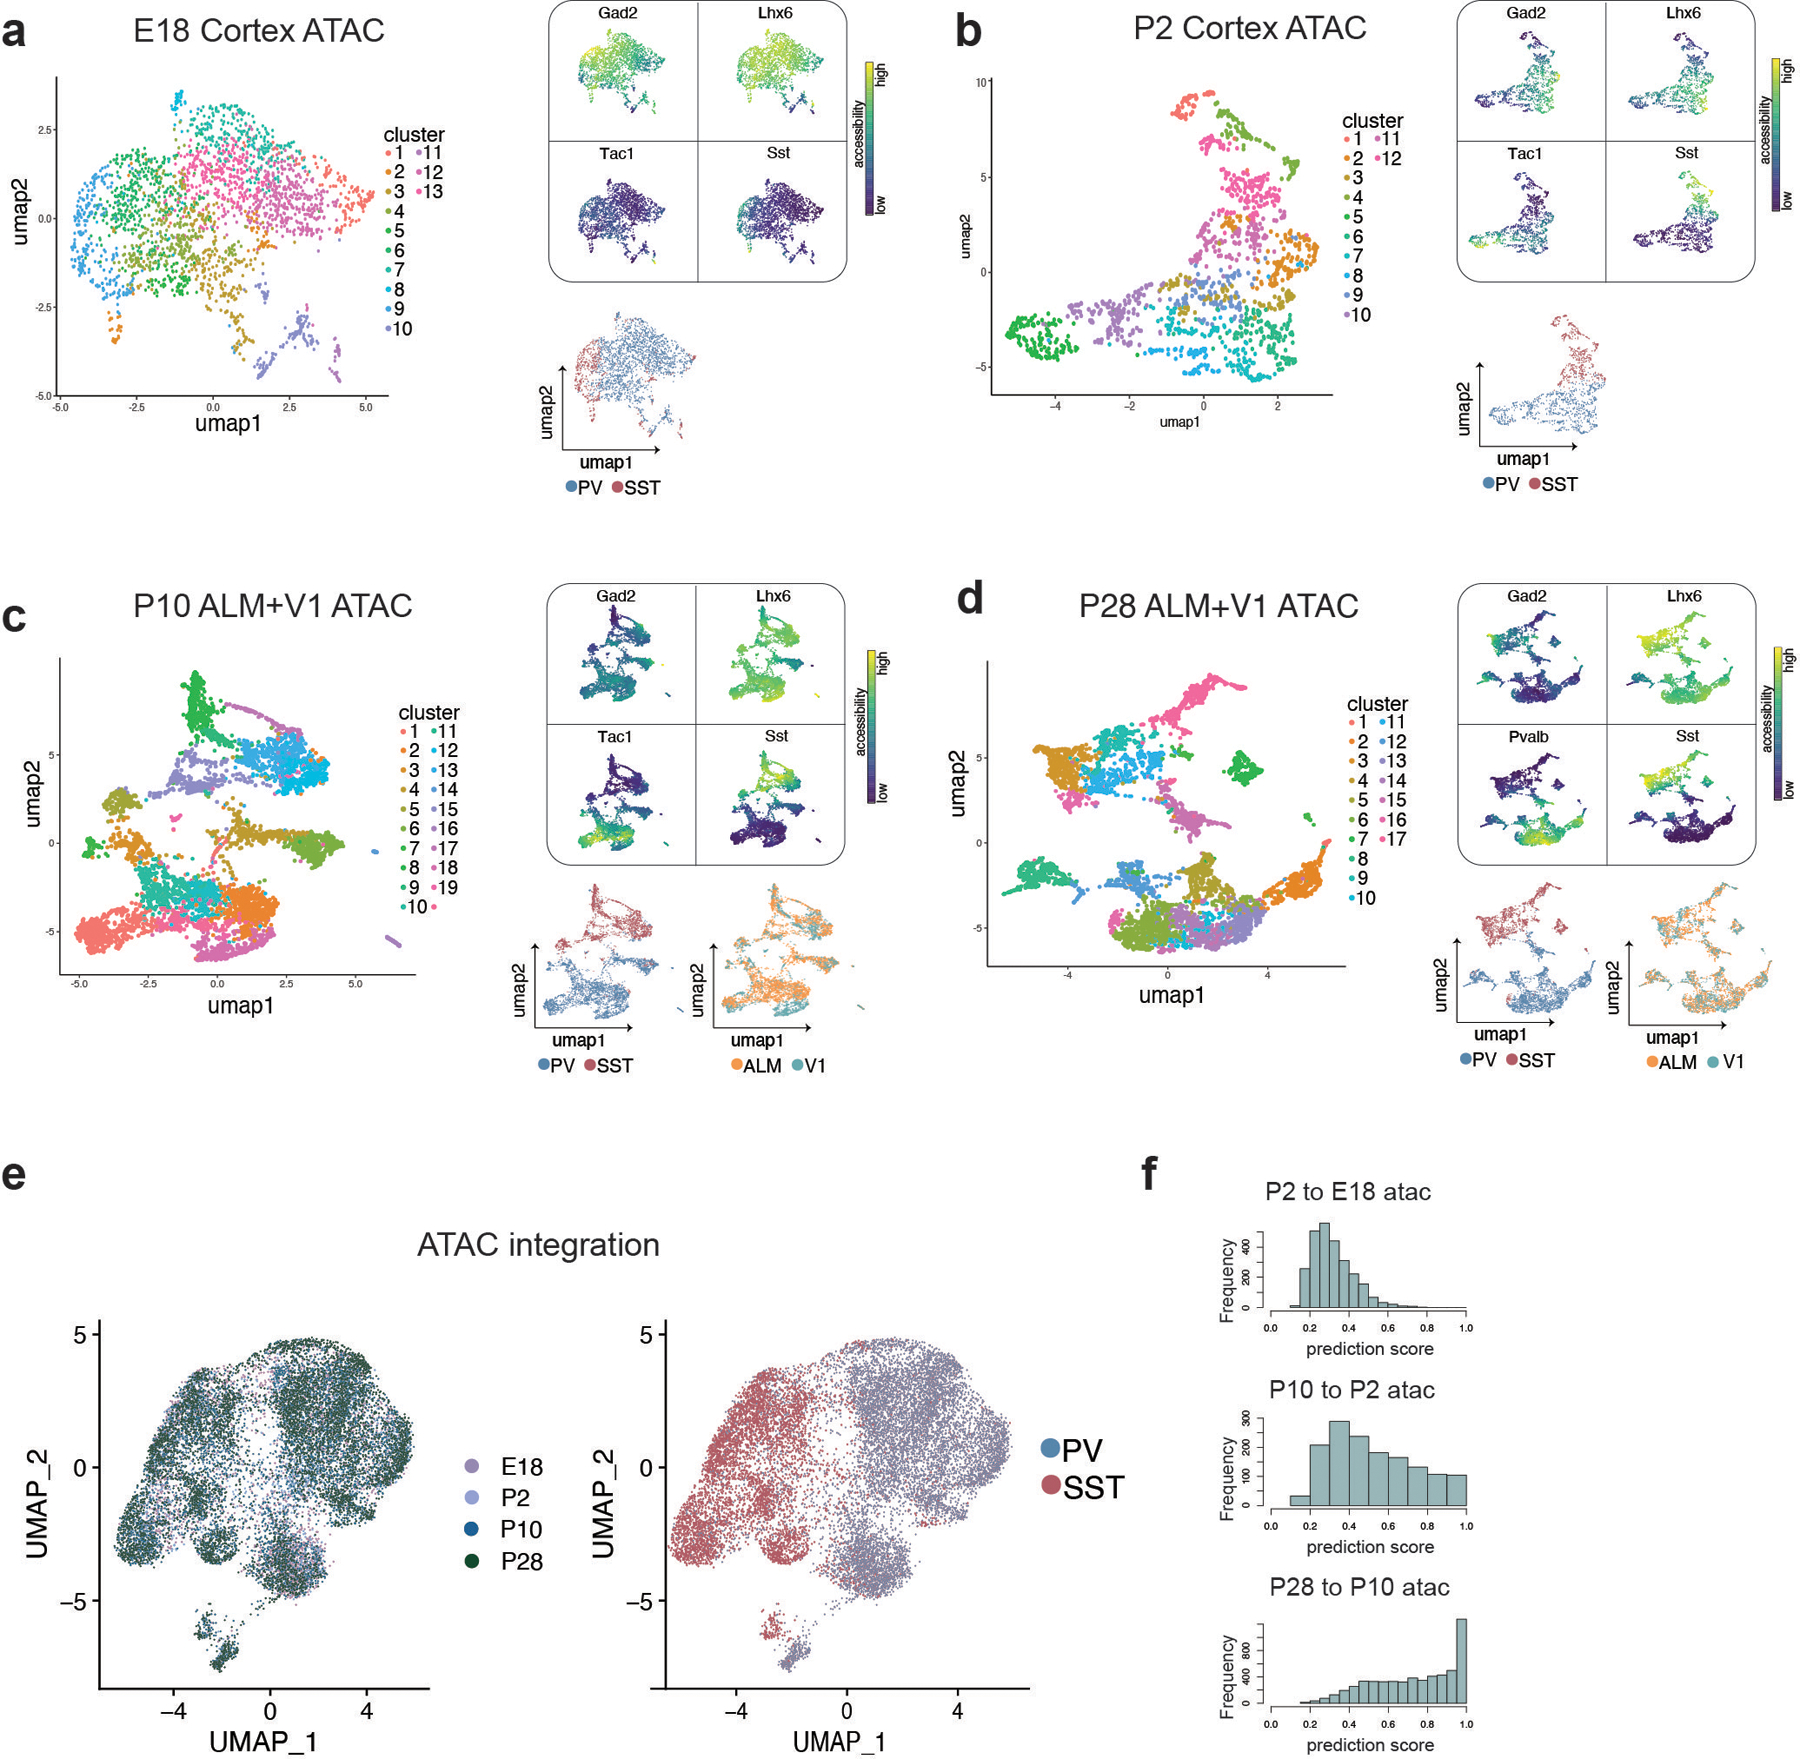
a-d, UMAP showing individual scATAC-seq datasets from Dlx6a+ labeled cortical neurons, subsetted for PV+ and SST+ interneurons, collected at E18 (a), P2 (b), P10 (c), and P28 (d). Left UMAP in each panel is color-coded by cluster identity (individually determined for each dataset). Top right of each panel shows gene body accessibility of Gad2 (interneuron marker gene), Lhx6 (MGE-derived interneuron marker gene), Tac1 or PV (PV cIN marker gene), and Sst (SST cIN marker gene). Bottom right UMAP in each panel is color-coded by cardinal class, determined by accessibility of cardinal-class specific loci (identified at P28) and confirmed by marker gene accessibility. See methods for more information on cardinal class assignment in ATAC-seq data. Additional bottom right UMAP in (c) and (d) is color-coded by cortical region of origin (anterior lateral motor cortex - ALM, primary visual cortex - V1).
e, Integration of E18, P2, P10, and P28 scATAC-seq datasets using Seurat CCA. Left UMAP is color-coded by timepoint, right is color-coded by cardinal class.
f, Prediction score indicating the confidence of label transfer between each timepoint. Cluster labels were transferred from P2 to E18 (top), from P10 to P2 (middle) and from P28 and P10 (bottom). Label transfer prediction scores progressively increased over developmental time.
Extended Data Figure 7: Integration of MGE-derived interneuron scRNA-and scATAC-seq datasets.
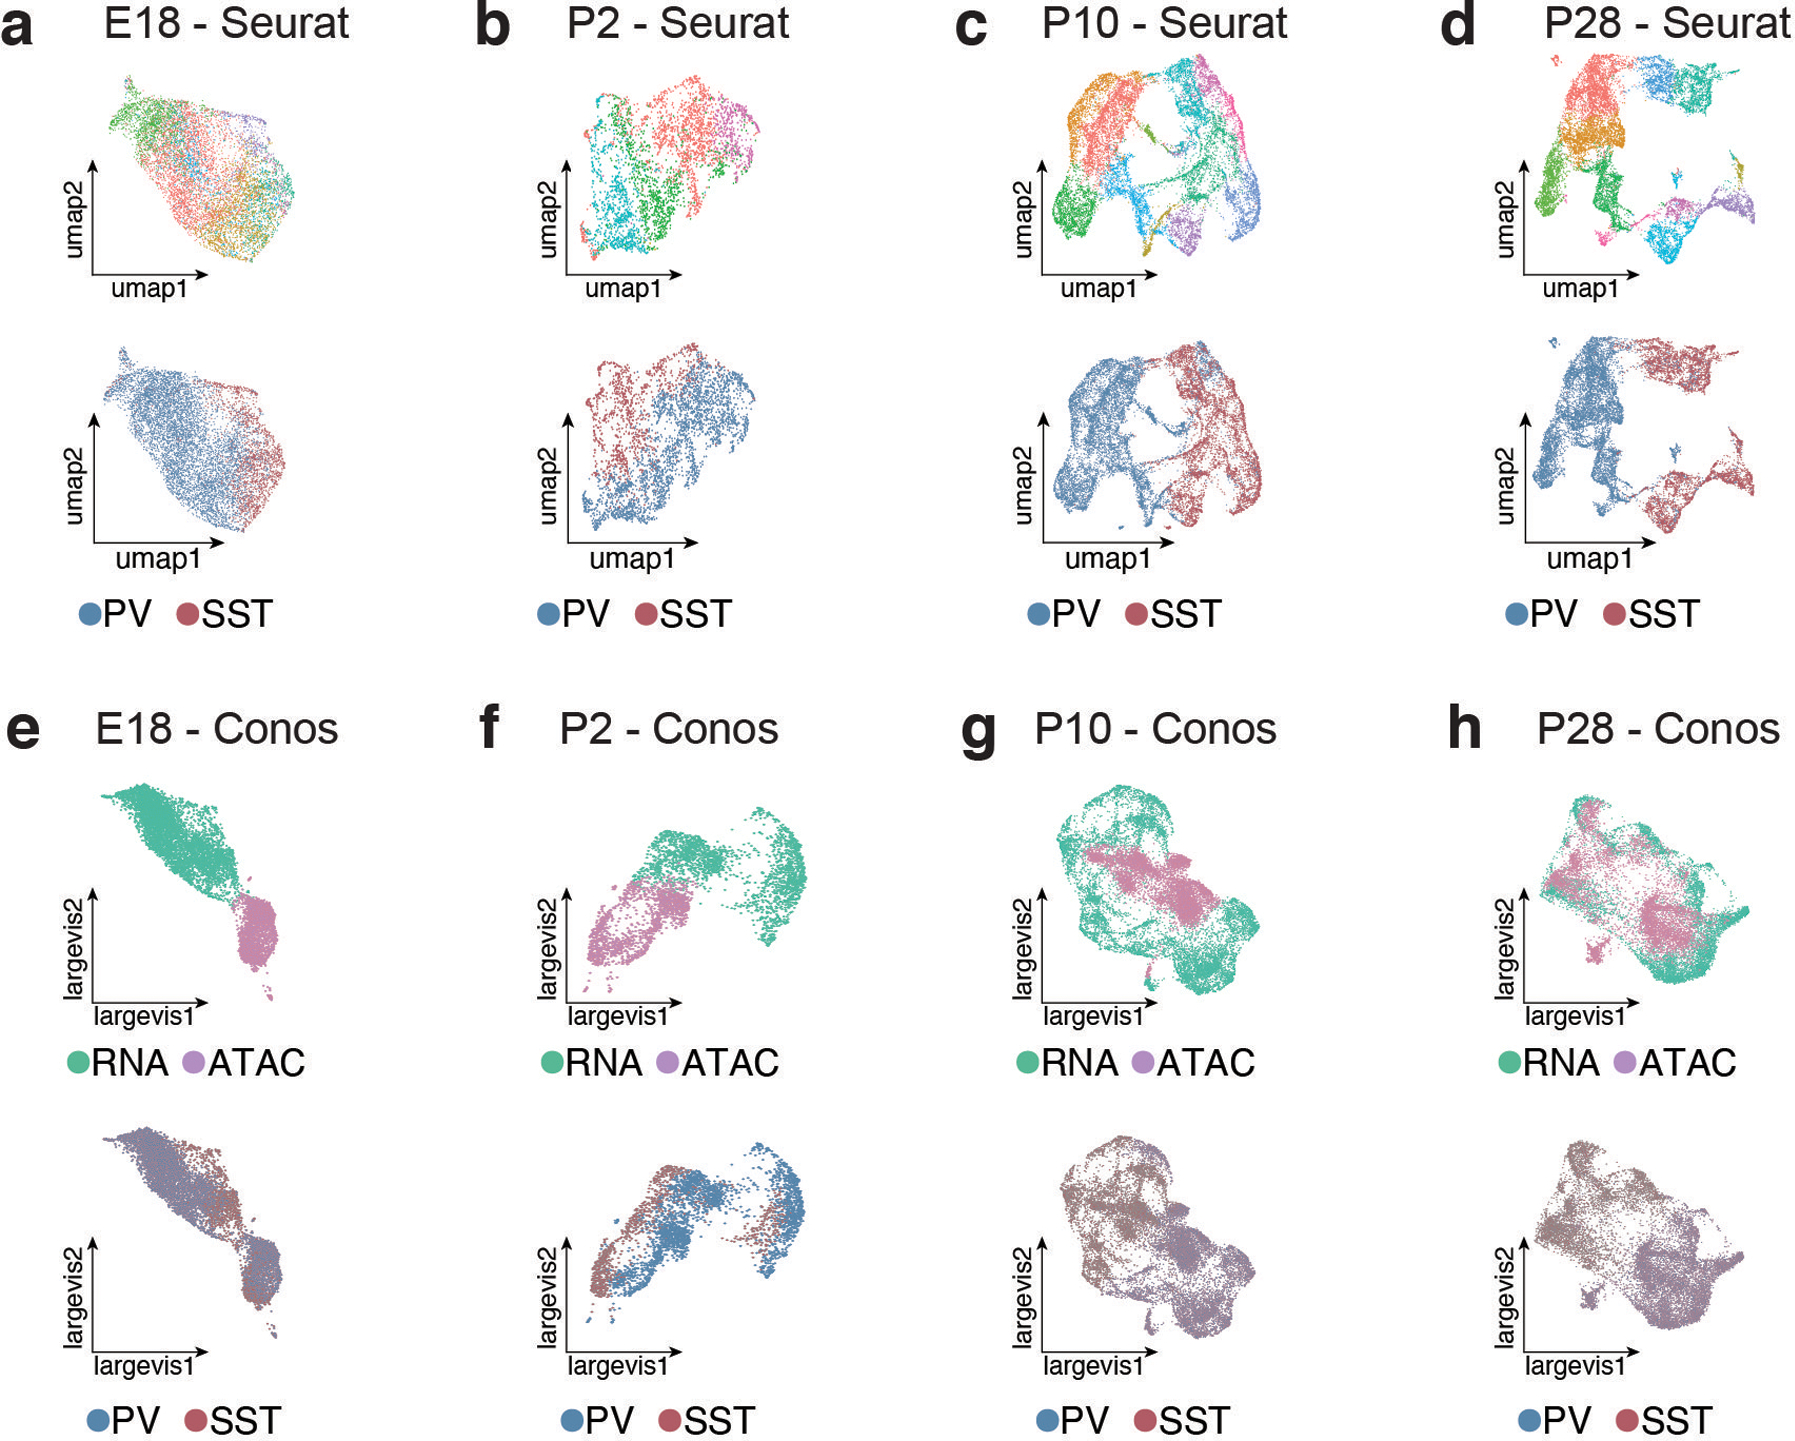
a-d, UMAPs showing scRNA- and scATAC-seq datasets integrated using Seurat CCA at E18 (a), P2 (b), P10 (c), and P28 (d). Top panel shows UMAP color-coded by RNA-seq cluster identity - i.e., the labels used for label transfer and calculation of prediction scores in Figure 2a–d. Bottom panel UMAP is color-coded by cardinal class identity.
e-h, UMAPs showing scRNA- and scATAC-seq datasets integrated using CONOS E18 (e), P2 (f), P10 (g), and P28 (h). Top panel shows UMAP color-coded by dataset of origin (RNA or ATAC). Bottom panel UMAP is color-coded by cardinal class identity. Cells from RNA and ATAC datasets integrated relatively well at later developmental timepoints, but were mostly segregated at earlier timepoints (E18, P2).
Extended Data Figure 8: Distally located loci open in specific cardinal classes earlier in development than proximal elements.
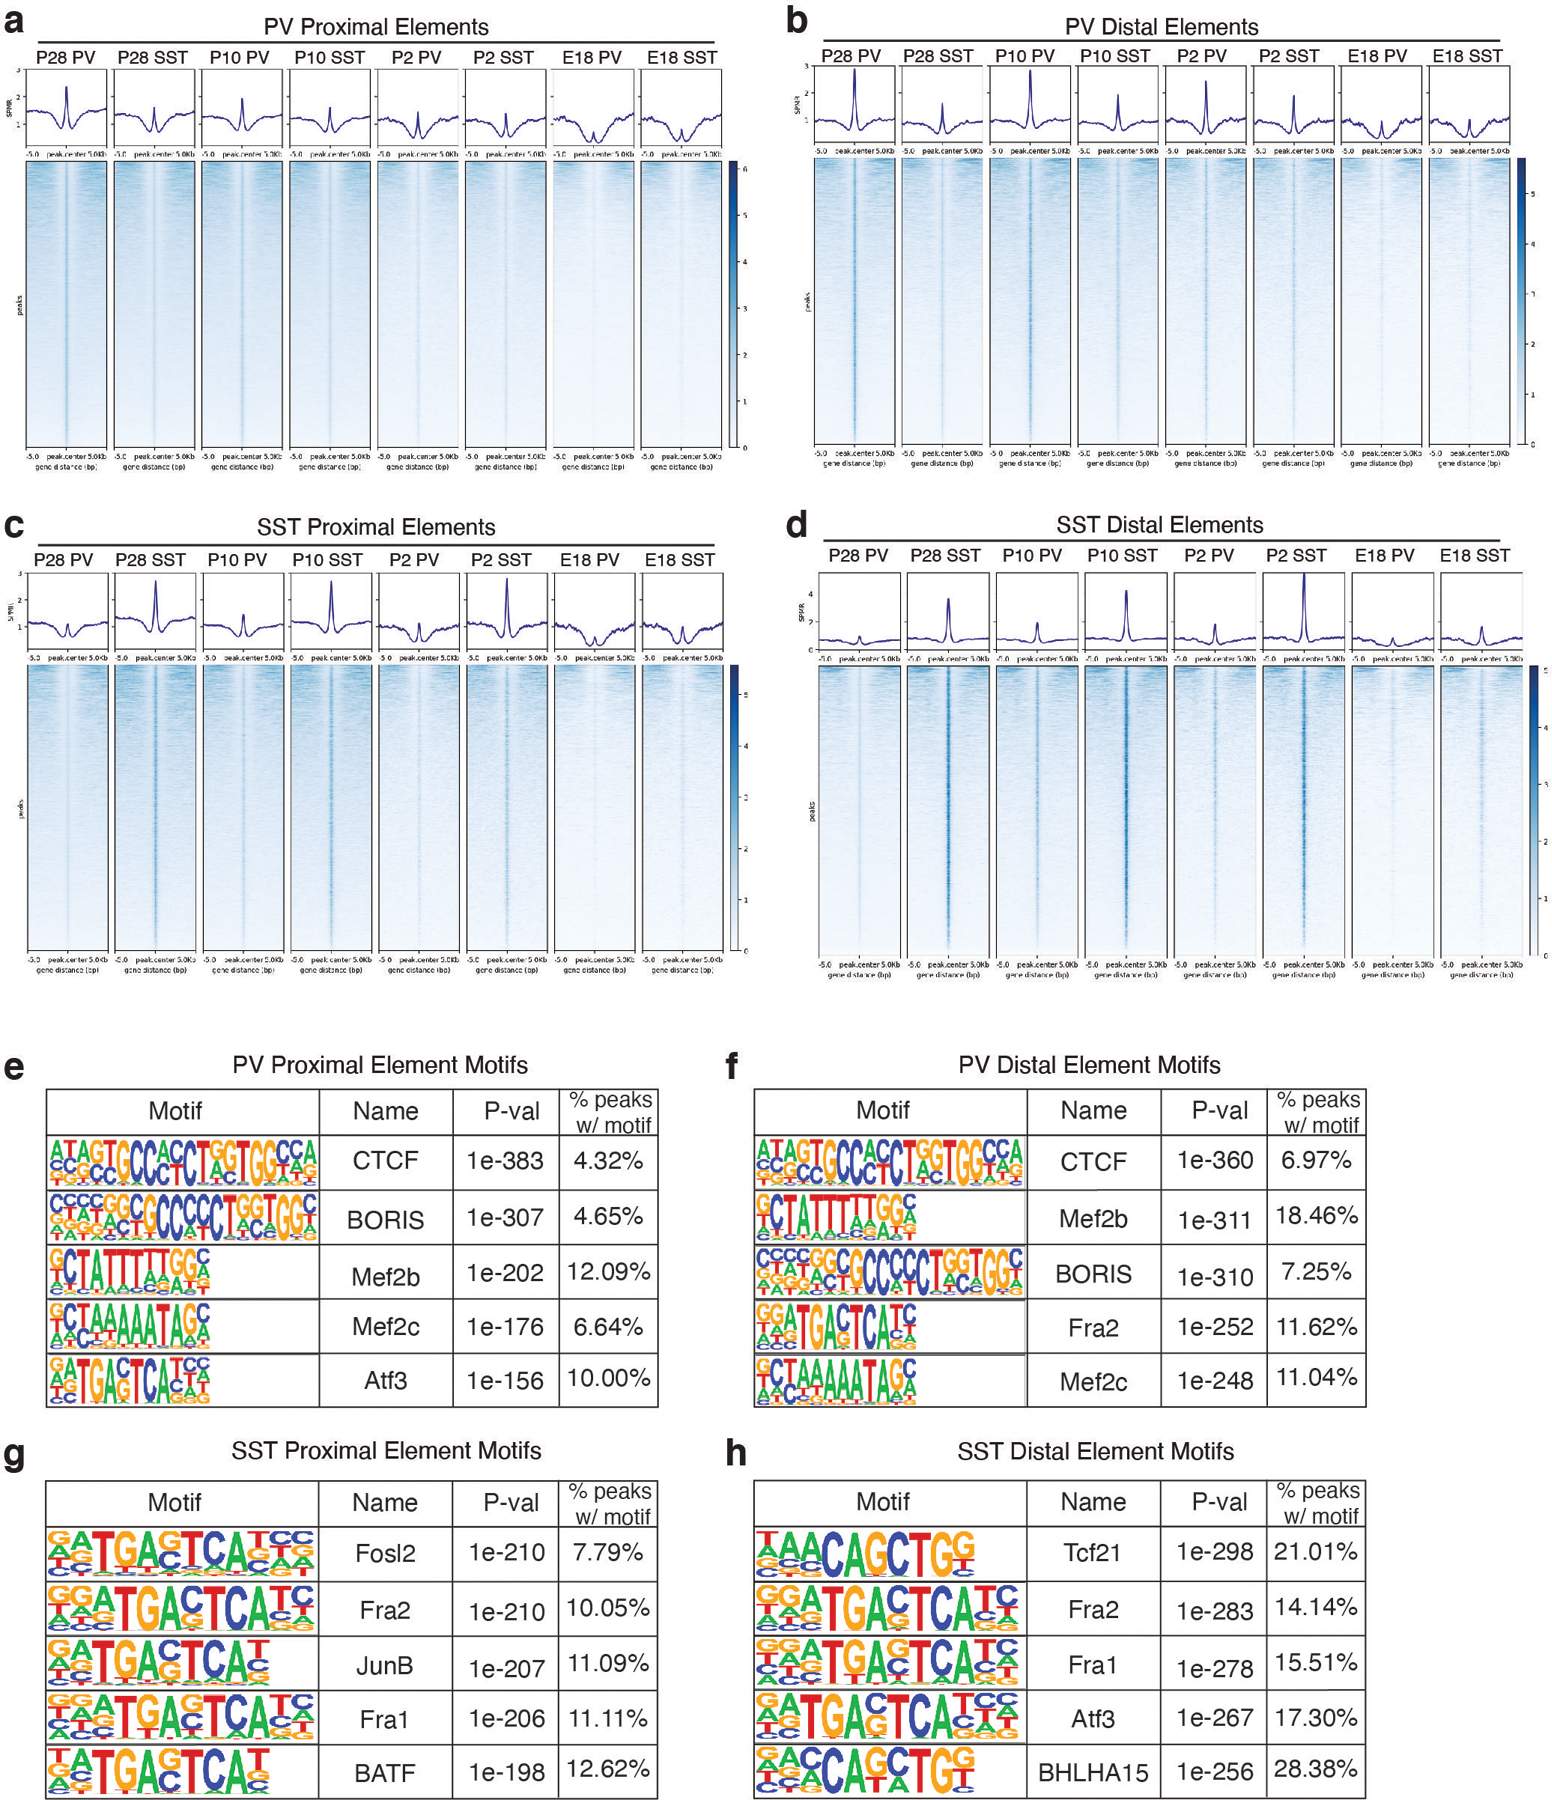
a, Average signal (top) and signal at each locus (bottom) for peaks specifically called for PV cells at P28 that are within promoters or gene bodies (i.e., proximal elements). Promoter regions were defined as TSS+2 kb upstream. Signal within PV and SST cells at P28, P10, P2, and E18 are shown over a window 5 kb up- and down-stream of peak center (compare to Figure 2f, which zooms in to a 1 kb +/− window).
b, Average signal (top) and signal at each locus (bottom) for peaks specifically called for PV cells at P28 that are distally located at each timepoint.
c, Average signal (top) and signal at each locus (bottom) for peaks specifically called for SST cells at P28 that are within promoters or gene bodies (proximal) at each timepoint.
d, Average signal (top) and signal at each locus (bottom) for peaks specifically called for SST cells at P28 that are distally located at each timepoint.
e, Top five enriched motifs for P28 PV-specific proximal peaks.
f, Top five enriched motifs for P28 PV-specific distal peaks.
g, Top five enriched motifs for P28 SST-specific proximal peaks.
h, Top five enriched motifs for P28 SST-specific distal peaks.
Extended Data Figure 9: MEF2C CUT&RUN in PV and SST interneurons at P28.
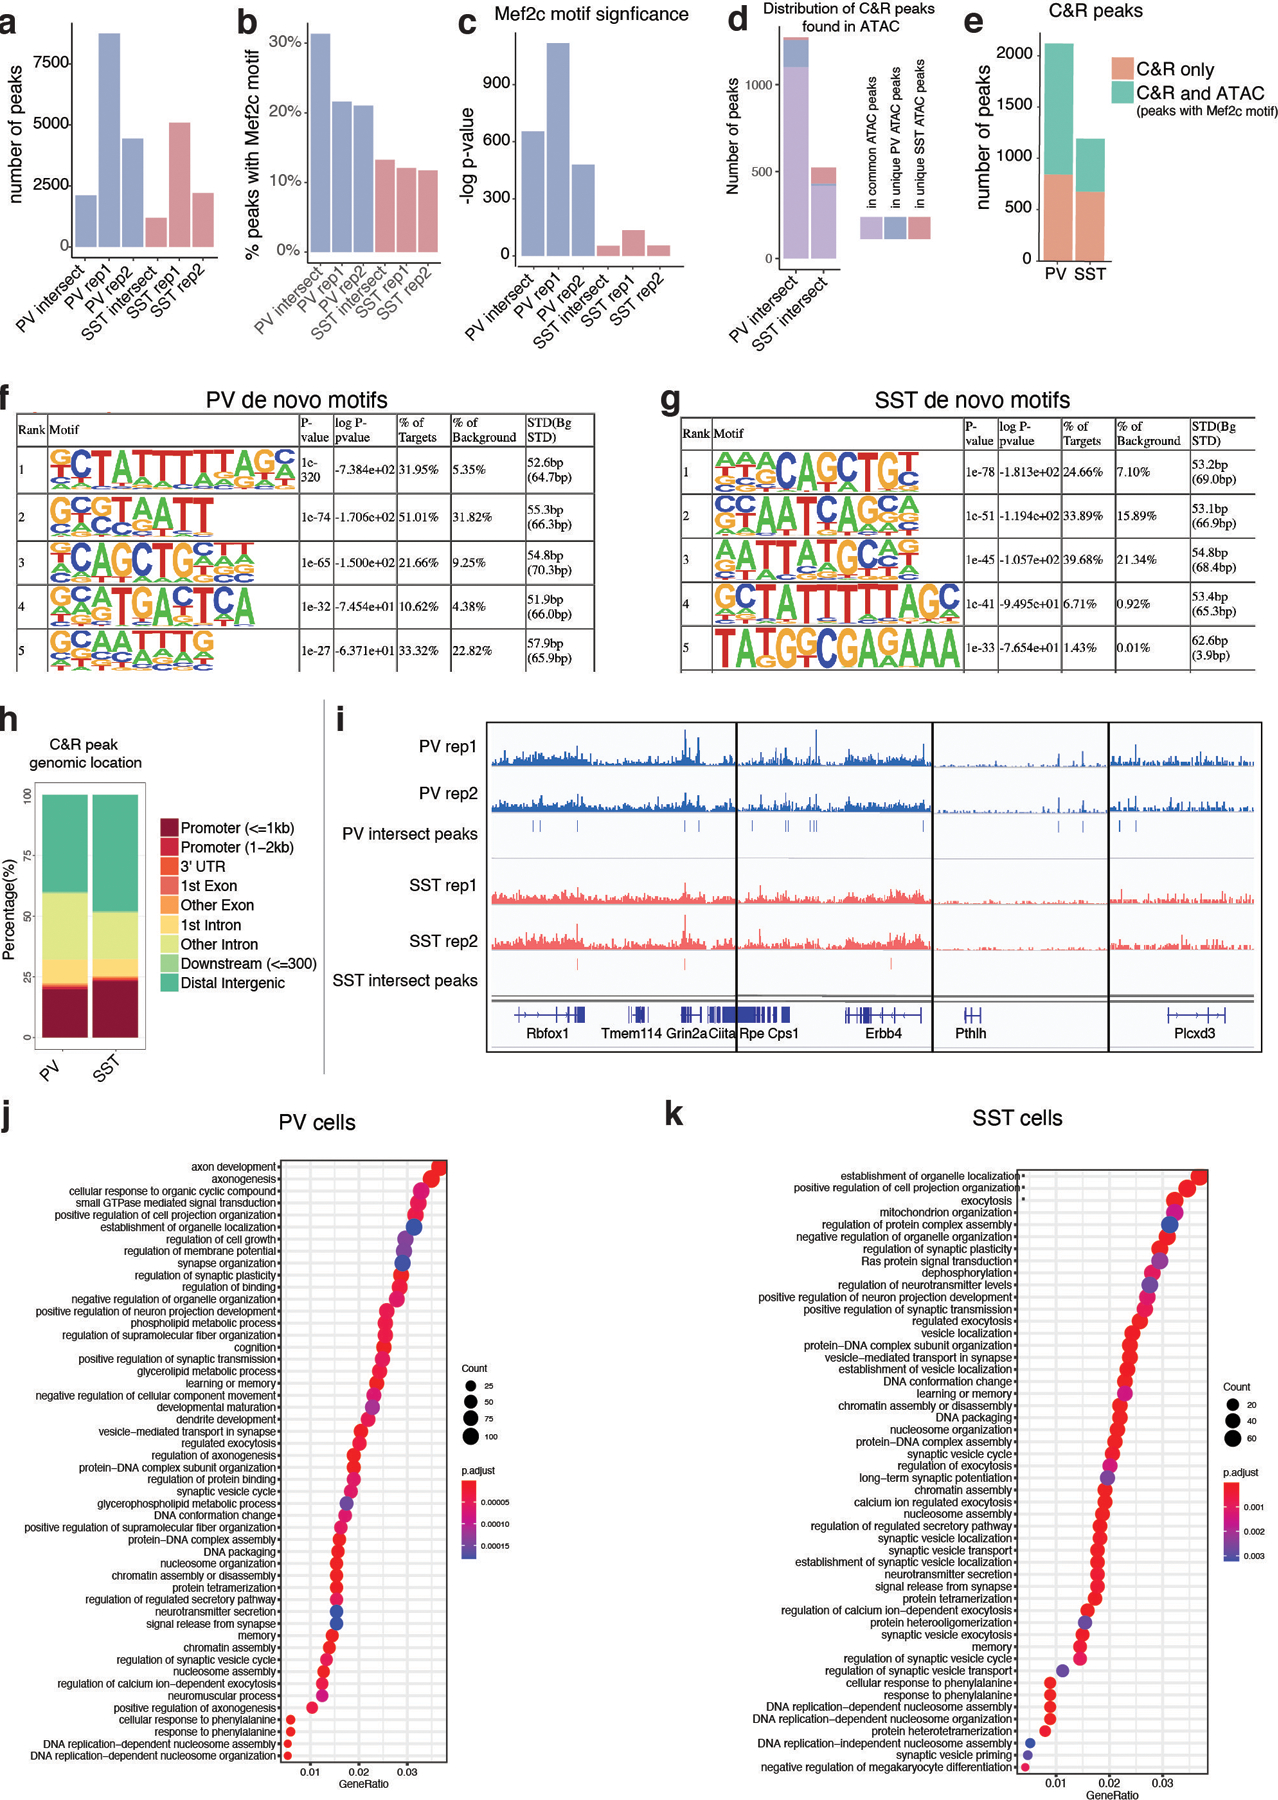
a, Number of peaks called in each CUT&RUN replicate from PV (blue) and SST (red) cells, and the number of peaks present in both replicates from each cell type (intersect).
b, Percentage of peaks containing a canonical Mef2c motif in each replicate.
c, Significance (-log p-value) of enrichment of Mef2c motif in each replicate.
d, The distribution of CUT&RUN peaks that were also present in P28 ATAC peak sets containing MEF2C motifs. For this analysis, the CUT&RUN replicate intersect peak sets of PV and SST were subsetted for those peaks that were also present in the ATAC peaks called for each cell type at P28 and found to contain a canonical MEF2C motif. Of those, they were categorized for those that were present in both PV and SST ATAC peak sets or unique to one cell type.
e, Compares peaks identified in CUT&RUN (orange) or jointly in CUT & RUN and ATAC-seq analyses (green). ATAC-seq peaks used in this analysis were those identified in each cell type at P28 regardless of presence or absence of a canonical Mef2c motif. Compare with Fig. 2j which performs the same analysis but only includes ATAC peaks with a Mef2c motif.
f-g, HOMER results for de novo motif discovery in replicate intersect peak sets for PV and SST cINs.
h, Genomic location of each CUT&RUN peak in replicate intersect peak sets for PV and SST cINs.
i, Integrative Genomics Viewer (IGV) snapshots showing bigwig files for each CUT&RUN replicate and associated peaks called in both replicates (intersect) for PV and SST cINs. Genomic loci shows are examples of genes with nearby peaks for commonly expressed genes (Rbfox1, Grin2a) and PV-enriched genes (Erbb4, Pthlh, Plxcd3).
j and k, Gene Ontology (GO) term analysis. Each CUT&peak was associated with the nearest gene TSS. These lists of genes for PV and SST cells were then used as input for GO term analysis, revealing an enrichment of genes associated with synapse development.
Extended Data Figure 10: Single-cell RNA- and ATAC-seq analysis of Mef2c cKO interneurons compared to wild-type (WT) cells at P2.
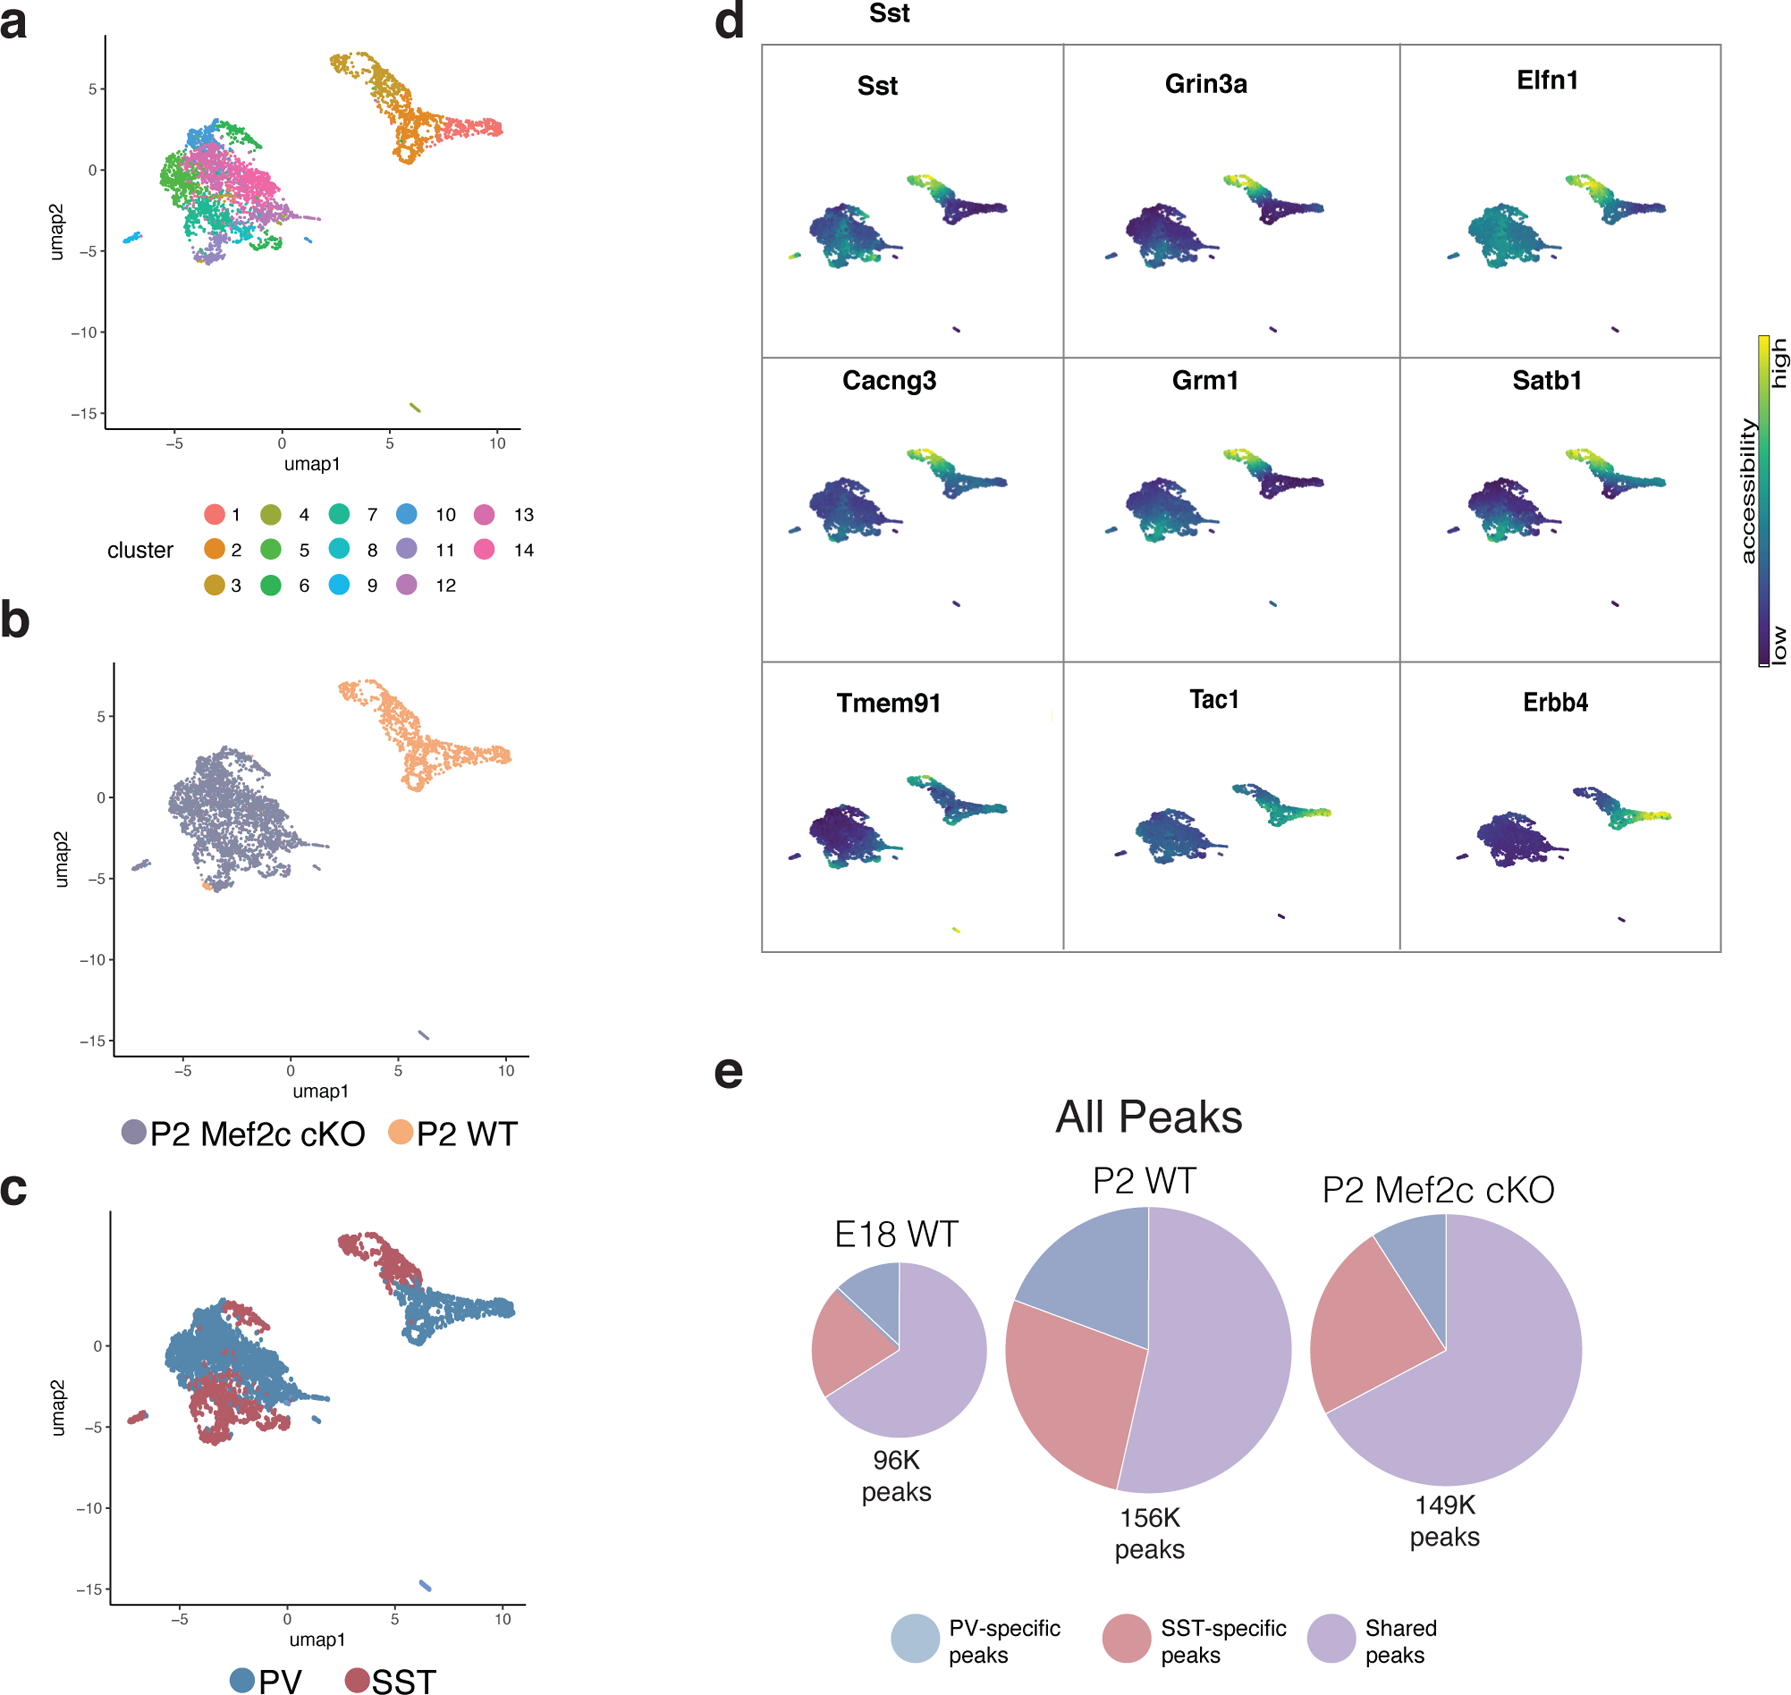
a, UMAP of P2 WT snRNA-seq and P2 Mef2c cKO snRNA-seq data integrated using Seurat and color-coded by cluster identity. WT dataset here was prepared using single nuclei to match cKO rather than the whole cell dataset (see Fig. 4).
b, UMAP in (a) segregated according to timepoint and color-coded by cell type.
c, Cluster composition delineated by (i) marker gene expression (ii) cell type (iii) cell number. Compare a-c here with Fig.4 a–c - this figure contains single nucleus data for both WT and cKO while Fig 4 WT data is whole cell.
d, UMAP of Mef2c cKO and WT cells color-coded by cluster.
e, UMAP of Mef2c cKO and WT cells color-coded by genotype.
f, UMAP of Mef2c cKO and WT cells color-coded by cardinal class identity. Mef2c cKO identity was determined by the accessibility of marker genes (see d) and assignment of clusters to the appropriate cardinal class.
g, Gene body accessibility of SST and PV cIN marker genes (SST: Sst, Grin3a, Elfn1, Cacng3, Grm1, Satb1, Tmem91. PV: Tac1, Erbb4).
h, Pie chart representation of scATAC-seq data showing the total number of peaks in E18 WT, P2 WT, and P2 Mef2c cKO, subdivided into peaks that are PV or SST cell specific or shared across both cell types. Compare to Figure 4d, which shows similar pie charts but only for peaks with Mef2c motifs.
Supplementary Material
Acknowledgments
We thank J. Dimidschstein, E. Favuzzi, D. Ginty, E. Macosko, and E. Miraldi for helpful feedback and discussion. We also thank N. Yusuf and M. Fernandez-Otero for technical assistance, R. Batista-Brito for providing animals for the Mef2c LOF experiments, and C. Davis for sharing CUT&RUN protocol and reagents. G.F. and K.C.A. acknowledge support from the following sources: NIH 1UG3MH120096-01 (G.F.), NIH 5R01MH071679-15 (G.F.), NIH F31NS103398 (K.C.A.). R.B. and M.I.G. acknowledge support from the following sources: NIH R01DK103358, Simons Foundation, NSF- IOS-1546218, NIH R35GM122515, NSF CBET- 1728858, NIH R01AI130945.
Footnotes
Competing Interests
The authors declare no competing interests. Correspondence and requests for materials should be addressed to G.F. (gordon_fishell@hms.harvard.edu) or R.B. (rbonneau@flatironinstitute.org).
References
- 1.Ascoli GA et al. Petilla terminology: Nomenclature of features of GABAergic interneurons of the cerebral cortex. Nat. Rev. Neurosci 9, 557–568 (2008). [DOI] [PMC free article] [PubMed] [Google Scholar]
- 2.Defelipe J et al. New insights into the classification and nomenclature of cortical GABAergic interneurons. Nat. Rev. Neurosci 14, 202–216 (2013). [DOI] [PMC free article] [PubMed] [Google Scholar]
- 3.Kepecs A & Fishell G Interneuron cell types are fit to function. Nature 505, 318–26 (2014). [DOI] [PMC free article] [PubMed] [Google Scholar]
- 4.Mayer C et al. Clonally Related Forebrain Interneurons Disperse Broadly across Both Functional Areas and Structural Boundaries. Neuron 87, 989–998 (2015). [DOI] [PMC free article] [PubMed] [Google Scholar]
- 5.Harwell CC et al. Wide Dispersion and Diversity of Clonally Related Inhibitory Interneurons. Neuron 87, 999–1007 (2015). [DOI] [PMC free article] [PubMed] [Google Scholar]
- 6.Freund TF Interneuron Diversity series: Rhythm and mood in perisomatic inhibition. Trends Neurosci 26, 489–495 (2003). [DOI] [PubMed] [Google Scholar]
- 7.Tremblay R, Lee S & Rudy B GABAergic Interneurons in the Neocortex: From Cellular Properties to Circuits. Neuron 91, 260–292 (2016). [DOI] [PMC free article] [PubMed] [Google Scholar]
- 8.Mayer C et al. Developmental diversification of cortical inhibitory interneurons. Nature 555, 457–462 (2018). [DOI] [PMC free article] [PubMed] [Google Scholar]
- 9.Mi D et al. Early emergence of cortical interneuron diversity in the mouse embryo. Science (80-.) 360, 81–85 (2018). [DOI] [PMC free article] [PubMed] [Google Scholar]
- 10.Wonders CP et al. A spatial bias for the origins of interneuron subgroups within the medial ganglionic eminence. Dev. Biol 314, 127–136 (2008). [DOI] [PMC free article] [PubMed] [Google Scholar]
- 11.Batista-Brito R & Fishell G The developmental integration of cortical interneurons into a functional network. Curr. Top. Dev. Biol 87, 81–118 (2009). [DOI] [PMC free article] [PubMed] [Google Scholar]
- 12.Wang Y et al. Dlx5 and Dlx6 regulate the development of parvalbumin-expressing cortical interneurons. J. Neurosci 30, 5334–5345 (2010). [DOI] [PMC free article] [PubMed] [Google Scholar]
- 13.Pai EL-L et al. Mafb and c-Maf Have Prenatal Compensatory and Postnatal Antagonistic Roles in Cortical Interneuron Fate and Function. Cell Rep 26, 1157–1173.e5 (2019). [DOI] [PMC free article] [PubMed] [Google Scholar]
- 14.Pai ELL et al. Maf and mafb control mouse pallial interneuron fate and maturation through neuropsychiatric disease gene regulation. Elife 9, 1–26 (2020). [DOI] [PMC free article] [PubMed] [Google Scholar]
- 15.Ma S et al. Chromatin Potential Identified by Shared Single-Cell Profiling of RNA and Chromatin. Cell 183, 1103–1116.e20 (2020). [DOI] [PMC free article] [PubMed] [Google Scholar]
- 16.Sinnamon JR et al. The accessible chromatin landscape of the murine hippocampus at single-cell resolution. Genome Res 29, 857–869 (2019). [DOI] [PMC free article] [PubMed] [Google Scholar]
- 17.Preissl S et al. Single-nucleus analysis of accessible chromatin in developing mouse forebrain reveals cell-type-specific transcriptional regulation. Nat. Neurosci 21, 432–439 (2018). [DOI] [PMC free article] [PubMed] [Google Scholar]
- 18.Fang R et al. Comprehensive analysis of single cell ATAC-seq data with SnapATAC. Nat. Commun 1–15 (2021) doi: 10.1038/s41467-021-21583-9. [DOI] [PMC free article] [PubMed]
- 19.Stuart T et al. Comprehensive Integration of Single-Cell Data. Cell 177, 1888–1902.e21 (2019). [DOI] [PMC free article] [PubMed] [Google Scholar]
- 20.Barkas N et al. Joint analysis of heterogeneous single-cell RNA-seq dataset collections. Nat. Methods 16, 695–698 (2019). [DOI] [PMC free article] [PubMed] [Google Scholar]
- 21.Miyoshi G & Fishell G GABAergic interneuron lineages selectively sort into specific cortical layers during early postnatal development. Cereb. Cortex 21, 845–52 (2011). [DOI] [PMC free article] [PubMed] [Google Scholar]
- 22.Batista-Brito R et al. The Cell-Intrinsic Requirement of Sox6 for Cortical Interneuron Development. Neuron 63, 466–481 (2009). [DOI] [PMC free article] [PubMed] [Google Scholar]
- 23.Azim E, Jabaudon D, Fame RM & MacKlis JD SOX6 controls dorsal progenitor identity and interneuron diversity during neocortical development. Nat. Neurosci 12, 1238–1247 (2009). [DOI] [PMC free article] [PubMed] [Google Scholar]
- 24.Au E et al. A modular gain-of-function approach to generate cortical interneuron subtypes from ES cells. Neuron 80, 1145–58 (2013). [DOI] [PMC free article] [PubMed] [Google Scholar]
- 25.Castro DM, de Veaux NR, Miraldi ER & Bonneau R Multi-study inference of regulatory networks for more accurate models of gene regulation. PLoS Comput. Biol 15, 1–22 (2019). [DOI] [PMC free article] [PubMed] [Google Scholar]
- 26.Yadav T, Quivy J-P & Almouzni G Chromatin plasticity: A versatile landscape that underlies cell fate and identity. Science (80-.) 361, 1332–1336 (2018). [DOI] [PubMed] [Google Scholar]
- 27.Ladstätter S & Tachibana K Genomic insights into chromatin reprogramming to totipotency in embryos. J. Cell Biol 218, 70–82 (2019). [DOI] [PMC free article] [PubMed] [Google Scholar]
- 28.Harrington AJ et al. MEF2C regulates cortical inhibitory and excitatory synapses and behaviors relevant to neurodevelopmental disorders. Elife 5, 1–27 (2016). [DOI] [PMC free article] [PubMed] [Google Scholar]
- 29.Cosgrove D et al. Genes influenced by MEF2C contribute to neurodevelopmental disease via gene expression changes that affect multiple types of cortical excitatory neurons. Hum. Mol. Genet (2020) doi: 10.1093/hmg/ddaa213. [DOI] [PubMed]
Methods References
- 30.Monory K et al. The Endocannabinoid System Controls Key Epileptogenic Circuits in the Hippocampus. Neuron 51, 455–466 (2006). [DOI] [PMC free article] [PubMed] [Google Scholar]
- 31.Madisen L et al. A robust and high-throughput Cre reporting and characterization system for the whole mouse brain. Nat. Neurosci 13, 133–140 (2010). [DOI] [PMC free article] [PubMed] [Google Scholar]
- 32.Mo A et al. Epigenomic Signatures of Neuronal Diversity in the Mammalian Brain. Neuron 86, 1369–84 (2015). [DOI] [PMC free article] [PubMed] [Google Scholar]
- 33.Vong LH, Ragusa MJ & Schwarz JJ Generation of conditional Mef2cloxp/loxp mice for temporal- and tissue-specific analyses. Genesis 43, 43–48 (2005). [DOI] [PubMed] [Google Scholar]
- 34.Fogarty M et al. Spatial genetic patterning of the embryonic neuroepithelium generates GABAergic interneuron diversity in the adult cortex. J. Neurosci 27, 10935–46 (2007). [DOI] [PMC free article] [PubMed] [Google Scholar]
- 35.Tirosh I et al. Single-cell RNA-seq supports a developmental hierarchy in human oligodendroglioma. Nature 539, 309–313 (2016). [DOI] [PMC free article] [PubMed] [Google Scholar]
- 36.Setty M et al. Characterization of cell fate probabilities in single-cell data with Palantir. Nat. Biotechnol 37, 451–460 (2019). [DOI] [PMC free article] [PubMed] [Google Scholar]
- 37.Street K et al. Slingshot: cell lineage and pseudotime inference for single-cell transcriptomics. BMC Genomics 19, 477 (2018). [DOI] [PMC free article] [PubMed] [Google Scholar]
- 38.Gabitto MI et al. Characterizing chromatin landscape from aggregate and single-cell genomic assays using flexible duration modeling. Nat. Commun 11, 1–10 (2020). [DOI] [PMC free article] [PubMed] [Google Scholar]
- 39.Heinz S et al. Simple Combinations of Lineage-Determining Transcription Factors Prime cis-Regulatory Elements Required for Macrophage and B Cell Identities. Mol. Cell 38, 576–589 (2010). [DOI] [PMC free article] [PubMed] [Google Scholar]
- 40.Stroud H et al. An Activity-Mediated Transition in Transcription in Early Postnatal Neurons. Neuron 1–17 (2020) doi: 10.1016/j.neuron.2020.06.008. [DOI] [PMC free article] [PubMed]
- 41.Liu N et al. Direct Promoter Repression by BCL11A Controls the Fetal to Adult Hemoglobin Switch. Cell 173, 430–442.e17 (2018). [DOI] [PMC free article] [PubMed] [Google Scholar]
- 42.Zhu Q, Liu N, Orkin SH & Yuan G-C CUT&RUNTools: a flexible pipeline for CUT&RUN processing and footprint analysis. Genome Biol 20, 192 (2019). [DOI] [PMC free article] [PubMed] [Google Scholar]
- 43.Pliner H et al. Chromatin accessibility dynamics of myogenesis at single cell resolution. bioRxiv 155473 (2017) doi: 10.1101/155473. [DOI]
- 44.Jackson C & Skok Gibbs C Inferelator Example Data and Scripts [Data set]. Zenodo (2019) doi: 10.5281/zenodo.3355524. [DOI]
Associated Data
This section collects any data citations, data availability statements, or supplementary materials included in this article.
Supplementary Materials
Data Availability Statement
All sequencing data produced for this study are available at the Gene Expression Omnibus (GEO) at GEO accession number GSE165233. E18 scRNA-seq data is available from GEO under the accession number GSE104158. P28 V1 scATAC-seq data is available from GEO under accession number GSE152449.


