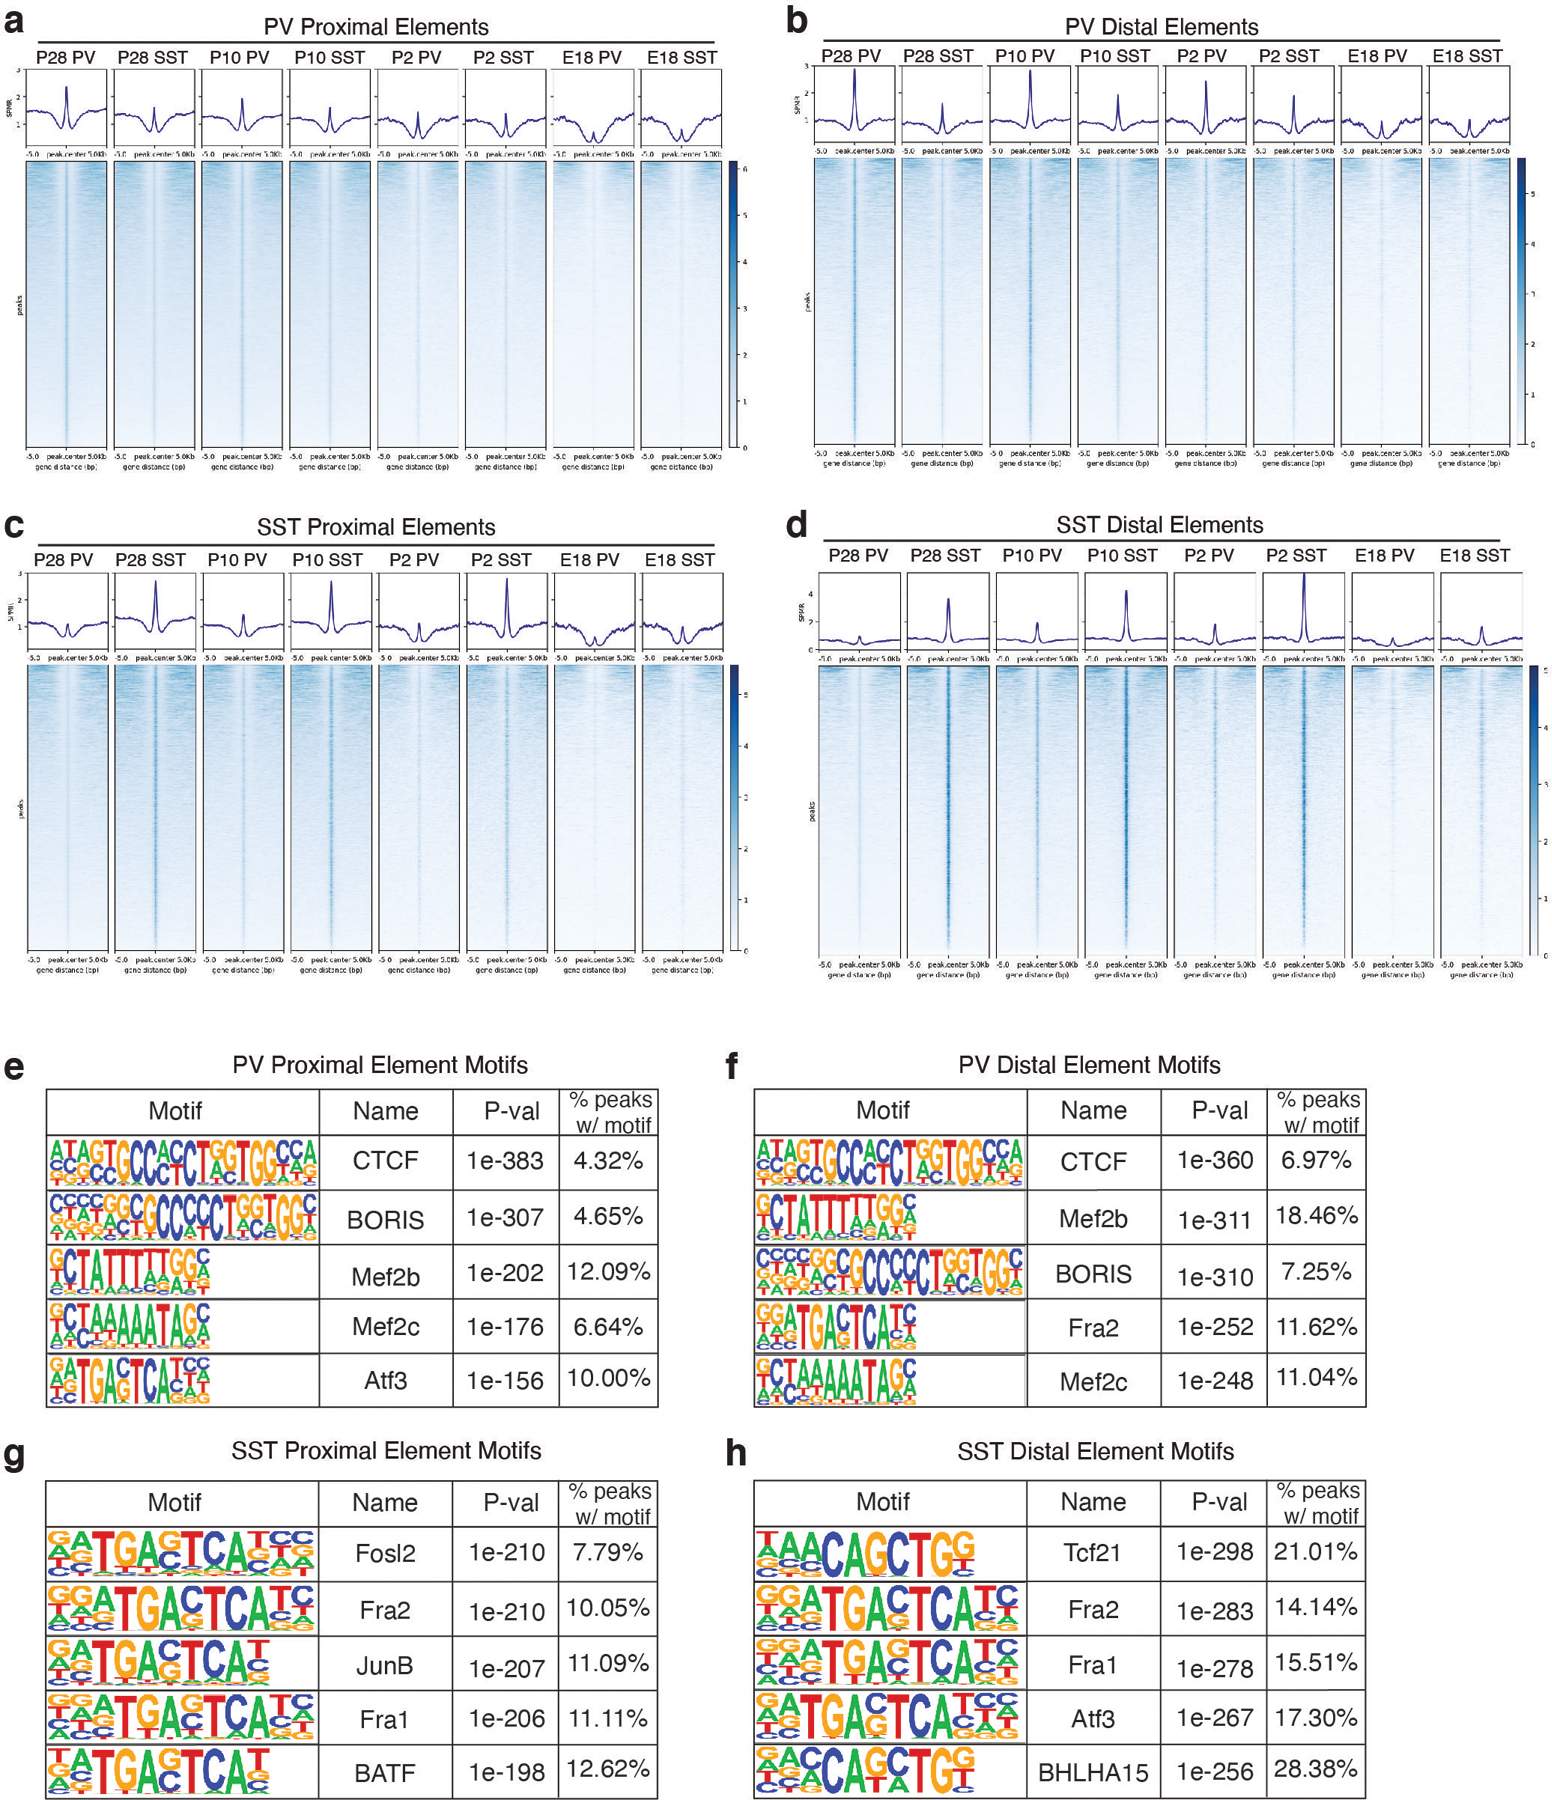
Extended Data Figure 8: Distally located loci open in specific cardinal classes earlier in development than proximal elements.

a, Average signal (top) and signal at each locus (bottom) for peaks specifically called for PV cells at P28 that are within promoters or gene bodies (i.e., proximal elements). Promoter regions were defined as TSS+2 kb upstream. Signal within PV and SST cells at P28, P10, P2, and E18 are shown over a window 5 kb up- and down-stream of peak center (compare to Figure 2f, which zooms in to a 1 kb +/− window).
b, Average signal (top) and signal at each locus (bottom) for peaks specifically called for PV cells at P28 that are distally located at each timepoint.
c, Average signal (top) and signal at each locus (bottom) for peaks specifically called for SST cells at P28 that are within promoters or gene bodies (proximal) at each timepoint.
d, Average signal (top) and signal at each locus (bottom) for peaks specifically called for SST cells at P28 that are distally located at each timepoint.
e, Top five enriched motifs for P28 PV-specific proximal peaks.
f, Top five enriched motifs for P28 PV-specific distal peaks.
g, Top five enriched motifs for P28 SST-specific proximal peaks.
h, Top five enriched motifs for P28 SST-specific distal peaks.
