

Abstract
Aim:
Prevalence of clinically actionable genetic variants of CYP2C19 is lacking in specific population subgroups. This study aims to assess the frequencies of CYP2C19*2, *3, and *17 in Asian, Native Hawaiian and Pacific Islander (NHPI) population subgroups compared with Europeans.
Patients & methods:
The study included repository DNA samples of 1064 women, 18 years or older, who self-reported as Filipino, Korean, Japanese, Native Hawaiian, Marshallese and Samoan.
Results:
The overall frequencies of CYP2C19*2 (25-36%) and CYP2C19*3 (2.5-10%) were significantly higher in all our subgroups than in Europeans (15 and 0.02%, respectively). The overall frequency of CYP2C19*17 was significantly lower in all our subgroups (1–6%) than in Europeans (21.7%).
Conclusion:
This is the first report on the frequencies of CYP2C19*2, *3, and *17 in women of Asian and NHPI descent with distinct population subgroup differences. Differential allele frequencies of CYP2C19 among population subgroups underscore the importance of increasing racial and ethnic diversity in pharmacogenetic research.
Keywords: : Asian subgroups, CYP450 enzymes, genomics, Hawaii clopidogrel lawsuit, health disparities, Native Hawaiians, Pacific Islanders subgroups, pharmacogenetics, race and ethnicity
Plain language summary
CYP2C19 encodes the CYP2C19 drug-metabolizing enzyme, a key protein in the liver involved in breaking down many commonly prescribed drugs. Individuals of Asian ancestry are more likely to have variations in this gene that could make it either less functional or non-functional. Racial categorization of Asian and Native Hawaiian and Pacific Islander (NHPI) groups is broad and overlooks possible genetic differences between the population subgroups. In this study, we used biobank DNA to examine the frequency of three genetic variants in CYP2C19 among 1064 Asian and NHPI women. We compared this group to a large multi-ethnic population including 2.2 million people. Our study provides the first report on CYP2C19 variants frequency among specific Asian and NHPI subgroups. Notably, Native Hawaiians have distinct variant frequencies compared with other Asian and Pacific Islander subgroups. Knowledge of the frequency of CYP2C19 gene variations in under-represented population subgroups is needed to advance personalized medicine and reduce racial health disparities in genetic research.
Tweetable abstract
CYP2C19 allele frequency among under-represented subgroups to ultimately diversify #Pharmacogenetic research. Notably, individuals of Native Hawaiian have distinct allele frequencies relative to other Asian and Pacific Islander subgroups. #Future_Medicine
The prevalence of clinically actionable sequence variants in drug metabolism and response pharmacogenes is well documented in Europeans (EUR) [1]. However, the prevalence of the same sequence variants is either extrapolated or unknown among selected under-represented ancestral populations. Determining the frequencies of clinically actionable gene variants in population subgroups is essential to estimate the clinical impact of pre-emptive pharmacogenetic testing and to diversify the genetic research landscape [2]. With the growing diversity in the US population, there is an ever-growing need to identify new population-specific genetic variants to achieve health equity and to personalize medicine [3]. Very important pharmacogenes (VIPs) encode enzymes known to metabolize numerous commonly prescribed drugs [4]. VIPs are mostly expressed in the liver, GI tract and kidney. Genetic variations (caused by single nucleotide polymorphisms [SNP]) in drug-metabolizing enzymes could affect drug response and treatment outcomes. Particularly, genetic variants in the Cytochrome P450 Family 2 Subfamily C Member 19 (CYP2C19) [5] (Supplementary Table 1) play a significant role in the selection of prescription drugs among certain drug classes, including antiplatelet, selective serotonin inhibitors, specific proton pump inhibitors and antiepileptics (Supplementary Table 2) [6–9]. CYP2C19, like many other CYP450 metabolizing enzyme encoding genes, is highly polymorphic and is responsible for the metabolism of 7% of clinically prescribed medications [10–13]. To date, PharmVar cataloged 39 star (*) alleles, each one of which represents a unique and fully defined haplotype [14–16].
The CYP2C19*1 haplotype is associated with normal enzyme-mediated metabolic function. While many variant alleles have been shown to have decreased or no function, other genetic variants in CYP2C19 could decrease its metabolic activity. Specifically, the CYP2C19*2, *3 and *17 are clinically important alleles. The CYP2C19*2 allele is the result of a synonymous polymorphism in exon 5 causing aberrant splicing leading to a premature stop codon and a lack of functional enzyme (Supplementary Table 1) [17,18]. The CYP2C19*3 allele is characterized by a premature stop codon due to a nonsynonymous polymorphism in exon 4 and a lack of functional enzyme (Supplementary Table 1) [17,18]. By contrast, the increased function allele CYP2C19*17 is characterized by gene over-expression due to a promoter variant in the 5′ regulatory region (Supplementary Table 1) [9,19]. According to their diplotype, individuals are generally classified as ultrarapid metabolizers (UM) with two increased function alleles; rapid metabolizers (RM) with one functional plus one increased function alleles, intermediate metabolizers (IM) with one functional plus one no function allele or one increased function allele and no function allele poor metabolizers (PM) with two non-functional alleles and normal metabolizers (NM) with two functional alleles (Supplementary Table 2) [9,19].
Multiple studies have linked major adverse cardiovascular events (e.g., cardiovascular death, myocardial infarction, stroke or stent thrombosis) to CYP2C19 genotype in clopidogrel-treated acute coronary syndrome (ACS) patients undergoing percutaneous coronary intervention (PCI) [20–23 24] . Subjects with two nonfunctional alleles (CYP2C19*2/*2, *2/*3, and *3/*3) have no metabolic activity compared with normal metabolizers [9,20,25]. Moreover, well-characterized variants in the CYP2C19 gene can substantially modify the metabolism of previously mentioned medications that have genotype-based guidelines available [9,26–28]. Disproportionate diplotype frequencies of these variants could have clinical implications in the process of selecting the optimal medication for a patient. For instance, CYP2C19 IM or PM phenotypes are associated with reduced antiplatelet activity response to clopidogrel in ACS patients undergoing PCI [9].
Knowledge of allele frequencies in a population with a significantly higher prevalence of specific genetic variants such as CYP2C19 among Asian subgroups, is crucial to optimize medication selection and improve treatment outcomes [9,29]. Although the clinical implications of CYP2C19 variants impacting function have been studied in limited samples of Asian population subgroups, including Filipino and Japanese [30], the frequencies of CYP2C19 alleles are well-characterized for Japanese [31] and Korean [32,33]. Furthermore, other Asian and Pacific Islander subgroups are underrepresented in clinical and genetic research [29,34,35]. For instance, publicly available genetic databases lack information about the prevalence of different variants in several pharmacogenes for Filipinos, Native Hawaiians and specific Pacific Islanders groups [36,37].
Despite their distinct cultural and geographical location differences, individuals of Asian, Hawaiian or Oceanic descent are categorized as Asian and NHPI, respectively. Therefore, the inclusion of distinct Asian and NHPI subgroups in genetic research could illuminate significant patterns of CYP2C19 allelic distribution [1,38]. Our central hypothesis is that the genotype/allele frequencies of CYP2C19 variants differ between each group of post-partum females of Asian descent (Filipino, Japanese or Korean), NHPI (Native Hawaiians, Marshallese or Samoan) descent and European (EUR). Therefore, this study aims to use biobanked DNA to assess the prevalence of the well-established and clinically actionable CYP2C19*2,*3, and *17 allelic variants in ethnically distinct population groups, by comparing them to EUR in a large multi-ethnic study [1]. The results from this study will help reduce the knowledge gaps of VIPs in underrepresented population subgroups, contextualize their impact on personalized medicine, and reimagine racial categorizations of distinct population subgroups.
Materials & methods
Study population
The University of Hawaii (UH) Human Studies Program reviewed and exempted all study materials and methods (Protocol Number: 2018-00225). The UH biospecimens repository provided de-identified DNA samples linked with limited clinical data. The original DNA sample collection was integrated with routine prenatal and hospital labor and delivery processes. The participants of this study were only post-partum women who donated their placenta, umbilical cord, excess blood cord, and maternal blood. The inclusion criteria of our study were adults (i.e., ≥18 years old) and self-identified of complete ancestry of Filipino, Japanese, Samoan, Korean, Marshallese and Native Hawaiian. Complete ancestry was self-reported and characterized based on having both biological parents and all grandparents identifying with the same race and ethnicity. Details on study approval, sample procurement and genotyping were previously published [39]. For the reference group, we used genetic data of EUR from Inonova et al. [1] to compare the frequencies of three major clinically actionable CYP2C19 variants, CYP2C19*2, *3 *17, with our studied population subgroups.
DNA extraction & genotyping
DNA samples were previously extracted from peripheral blood of post-partum women and genotyped at the Genomics and Bioinformatics Shared Resource, Cancer Center (Honolulu, Hawaii). Genetic testing assays were used on the TaqMan OpenArray, Format 32. Each assay with the assay IDs C__25986767_70, C__27861809_10, and C____469857_10 was used to detect SNPs rs4244285, rs4986893, and rs12248560, respectively that allowed the detection of CYP2C19*2, *3 and *17 alleles. The customized TaqMan genotyping assay OpenArray panel was run on the QuantStudio™ 12K Flex Real-Time PCR system. All assays were predesigned by Applied Biosystems (Thermo Fisher Scientific, MA, USA), including the ‘made to order’.
Genotype to diplotype & predicted phenotype translations
First, we used the CPIC CYP2C19 allele definition table [18] to translate the genotype in each SNP (using the rs #s) to star (*) variant (Supplementary Table 1). Using the CPIC translation table approach, the reference allele translates to CYP2C19*1 (i.e., individuals without any of the variant allele of CYP2C19*2, *3 or *17). Then, we used CPIC diplotype to phenotype translation table [18] to characterize the frequency of CYP2C19 NM, IM, PM, RM and UM (Supplementary Table 2).
Statistical analysis
Descriptive statistics were used to summarize data using percentages, range, mean and standard deviation. We assessed the Hardy–Weinberg equilibrium of each SNP within the different population subgroups, using a χ2 or Fisher's Exact test with a Bonferroni corrected p-value < 0.008 for statistical significance. Microsoft Excel® 2019 (WA, USA) was used to compare the observed and expected genotype frequencies for each SNP. Comparison of allele and genotype frequencies between each group of Asian ethnicities (Filipino, Japanese and Korean), Native Hawaiian, and Pacific Islanders (Marshallese and Samoan) compared with EURs were conducted using χ2 or Fisher's Exact test, when appropriate, with a Bonferroni corrected p-value < 0.008 for statistical significance. Multinomial proportions were used to calculate the 95% CI of genotype, diplotype, and allele frequencies, using the DescTools [40] (v0.99.37; Sinforeli A, 2021) package. Statistical analysis was conducted using RStudio1.4.1103 (R Core Team, 2020, Vienna, Austria) [41].
Results
Biobanked DNA samples of 1064 participants were used to calculate genotype and allele frequencies for our population subgroups. This sample was distributed across six self-reported ethnicities; Filipino (21.61%), Japanese (19.73%), Korean (9.77%), Native Hawaiian (14.84%), Marshallese (15.13%) and Samoan (18.89%). Table 1 summarizes the demographic characteristics of these participants. The genotype call rates for each SNP were 96.1% (902 participants out of 939) for CYP2C19*2, 97.3% (914 participants out of 939) for CYP2C19*3, and 95.8% (900 participants out of 939) for CYP2C19*17. The frequencies of CYP2C19 alleles and diplotypes across different ethnicities are summarized in Tables 2 and 3. All our tested SNPs were in Hardy–Weinberg equilibrium (p-value > 0.008) across all population subgroups.
Table 1. . Demographic characteristics of study participants.
| Characteristic | n (%)† |
|---|---|
| Age (years), mean ± standard deviation | 28.8 ± 6.3 |
|
Sex Female |
1064 (100) |
|
Ancestry (ethnicity) Native Hawaiian Asian Filipino Japanese Korean Pacific Islander Samoan Marshallese |
158 (14.8) 230 (21.6) 210 (19.7) 104 (9.8) 201 (18.9) 161 (15.1) |
Percentages are based on the total number of study participants without any missing data at the CYP2C19*2, *3, or *17 haplotype.
Table 2. . CYP2C19*1, *2, *3 and *17 allele frequencies among different Asian, Native Hawaiian and Pacific Islander subgroups, compared with European.
| Ethnic Group | EUR (Reference)† | Filipino | Japanese | Korean | N. Hawaiian | Marshallese | Samoan | |
|---|---|---|---|---|---|---|---|---|
| CYP2C19 allele % (n), 95% CI | *1 ‡ | 63.6 (2149479) | 55.2 (204), (49.3, 59.8) | 54.7 (201), (49.4, 60) | 56.7 (84), (47.6, 63.8) | 167.2 (196), (61.9, 72.7) | 54.5 (130), (47.7, 60.7) | 54.8 (198), (49.4, 60.1) |
| Sample size (n) | 1,689,246 | 186 | 184 | 75 | 146 | 118 | 178 | |
| p-value | Reference | 0.01¶ | 0.01¶ | 0.2¶ | 0.4¶ | 0.03¶ | 0.01¶ | |
| *2 § | 14.6 (493349) | 35.8 (136), (31.1, 40.9) | 35.1 (129), (30.2, 40.1) | 33.8 (52), (26.6, 41.6) | 24.7 (72), (19.9, 29.7) | 33.6 (82), (27.9, 39.8) | 35.1 (127), (30.1, 40.1) | |
| Sample size (n) | 1,689,553 | 190 | 184 | 77 | 146 | 122 | 181 | |
| p-value | Reference | <0.0001 | <0.0001 | <0.0001 | 0.0005 | <0.0001 | <0.0001 | |
| *3 § | 0.02 (676) | 8.5 (33), (6, 11.2) | 9.1 (34), (6.5, 12) | 8.2 (13), (4.4, 12.2) | 2.4 (7), (1, 4) | 9.8 (24), (6.6, 13.5) | 9 (33), (6.3, 11.7) | |
| Sample size (n) | 1,689,908 | 193 | 186 | 79 | 148 | 122 | 184 | |
| p-value | Reference | <0.0001 | <0.0001 | <0.0001 | <0.0001 | <0.0001 | <0.0001 | |
| *17 § | 21.7 (733416) | 0.5 (2), (0, 1.1) | 1.1 (4), (0.3, 2) | 1.3 (2), (0, 2.7) | 5.7 (17), (3.4, 8.2) | 2.1 (5), (0.8, 3.9) | 1.1 (4), (0, 1.9) | |
| Sample size (n) | 1,689,898 | 188 | 185 | 76 | 148 | 120 | 181 | |
| p-value | Reference | <0.0001 | <0.0001 | <0.0001 | <0.0001 | <0.0001 | <0.0001 | |
Bolded letter indicates the risk allele.
Total sample presented in this table does not include participants carrying the following diplotypes CYP2C19*N/*17 (n=38), *N/*2 (n=19) and *N/*N (n=5); N indicates novel haplotypes where both CYP2C19*2 and *17 defining SNPs were present on the same chromosome. Data obtained from Ionova et al. taken from [1].
Inferred proportion for CYP2C19*1 was estimated using the following formula [100 - (sum of variant allele proportions of CYP2C19*2, *3 and *17)].
Frequencies of CYP2C19*2, *3 and *17 alleles were calculated separately from the genotype/diplotype data.
Not significant from EUR (p > 0.008).
EUR: European.
Table 3. . CYP2C19*1, *2, *3 and *17 diplotype frequencies among different Asian, Native Hawaiian and Pacific Islander subgroups, compared with European.
| Ethnic group | EUR (reference) (n = 1689246)† | Filipino (n = 186)‡ | Japanese (n = 184)‡ | Korean (n = 75)‡ | Native Hawaiian (n = 146)‡ | Marshallese (n = 118)‡ | Samoan (n = 178)‡ | Phenotype predicted | |
|---|---|---|---|---|---|---|---|---|---|
| CYP2C19 diplotype & predicted phenotype frequency % (n), 95% CI | *1/*1 | 40.6 (684846) | 28.5 (53), (21.5, 36.3) | 32.1 (59), (25, 39.9) | 36 (27), (25.3, 48.4) | 44.5 (65), (36.3, 53.1) | 33.9 (40), (25.4, 43.8) | 31.5 (56), (24.1, 39.3) | NM |
| Phenotype§ frequency | 40.6% | 28.5% | 32.1% | 36% | 44.5%# | 33.9% | 31.5% | ||
| *17 / *17 | 4.7 (80580) | 0 (0), (0, 7.8) | 0 (0), (0, 7.8) | 0 (0), (0, 12.4) | 0.7 (1), (0, 9.2) | 0.9 (1), (0, 10.7) | 0 (0), (0, 7.9) | UM | |
| Phenotype§ frequency | 4.7% | 0% | 0% | 0% | 0.7% | 0.9% | 0% | ||
| *1/ *17 | 27.6 (465574) | 1.1 (2), (0, 8.9) | 1.6 (3), (0, 9.5) | 0 (0), (0, 12.4) | 8.2 (12), (0, 16.8) | 0 (0), (0, 9.9) | 1.7 (3), (0, 9.6) | RM | |
| Phenotype§ frequency | 27.6% | 1.1% | 1.6% | 0% | 8.2% | 0% | 1.7% | ||
| *1/ *2 | 18.5 (313706) | 39.3 (73), (32.3, 47.1) | 32.6 (60), (25.5, 40.4) | 32 (24), (21.3, 44.4) | 33.6 (49), (25.3, 42.1) | 32.2 (38), (23.7, 42.1) | 38.2 (68), (30.9, 46.1) | IM | |
| *1/ *3 | 0.02 (507) | 12.4 (23), (5.4, 20.2) | 10.9 (20), (3.8, 18.7) | 8 (6), (0, 20.4) | 3.4 (5), (0, 11.9) | 10.2 (12), (1.8, 20.1) | 8.4 (15), (1.1, 16.3) | ||
| *2/*17 | 6.3 (107439) | 0 (0), (0, 7.8) | 0.5 (1), (0, 8.4) | 1.3 (1), (0, 13.7) | 0.7 (1), (0, 9.2) | 1.7 (2), (0, 11.6) | 0.6 (1), (0, 8.4) | ||
| *3/*17 | 0.0096 (169) | 0 (0), (0, 7.8) | 0 (0), (0, 7.8) | 1.3 (1), (0, 13.7) | 1.4 (2), (0, 9.9) | 0 (0), (0, 9.9) | 0 (0), (0, 7.9) | ||
| Phenotype§ frequency | 24.8% | 51.6% | 44% | 42.6% | 39.1% | 44.1% | 47.2% | ||
| *2/*2 | 2.1 (36322) | 13.4 (25), (6.5, 21.3) | 15.2 (28), (8.2, 23) | 16 (12), (5.3, 28.4) | 7.5 (11), (0, 16.1) | 11 (13), (2.5, 20.9) | 12.4 (22), (5.1, 20.2) | PM | |
| *3/*3 | 0.0003 (5) | 0 (0), (0, 7.9) | 0.5 (1), (0, 8.3) | 1.3 (1), (0, 13.7) | 0 (0), (0, 8.6) | 0 (0), (0, 9.9) | 1.1 (2), (0, 9) | ||
| *2/*3 | 0.005 (98) | 5.4 (10), (0, 13.2) | 6.5 (12), (0, 14.4) | 4 (3), (0, 16.4) | 0 (0), (0, 8.6) | 10.2 (12), (1.8, 20.1) | 6.2 (11), (0, 14.1) | ||
| Phenotype§ frequency | 2.2% | 18.8% | 22.2% | 21.3% | 7.5% | 21.2% | 19.7% | ||
| χ2 or Fisher's Exact test, p-value¶ | Reference | 3.1e-13 | 8.1e-12 | 1.9e-13 | 0.00021 | 4.7e-13 | 1.03e-11 | – | |
Bolded letter indicates the risk allele.
Total sample presented in this table does not include participants carrying the following diplotypes CYP2C19*N/*17 (n=38), *N/*2 (n=19) and *N/*N (n=5); N indicates Novel haplotype where both *2 and *17 defining SNPs were present on the same chromosome. Data obtained from Ionova et al. taken from [1].
Participants with missing data at one or more of the three haplotypes (CYP2C19*2, *3 and *17) were excluded from our diplotyping; however, their data were used to calculate allele frequencies.
CYP2C19 CPIC Diplotype to Phenotype Translation Table [18].
p-value for the difference in phenotype frequencies (UM (CYP2C19*17/*17), RM (CYP2C19*1/*17), NM (CYP2C19*1/*1), IM (CYP2C19*1/*2, *1/*3, *2/*17, *3/*17) and PM (CYP2C19*2/*2, *3/*3, *2/*3)) between each ethnicity and European.
Not significant from EUR (p = 0.34).
EUR: European; IM: Intermediate metabolizer; NM: Normal metabolizer; PM: Poor metabolizer; RM: Rapid metabolizer; UM: Ultrarapid metabolizer.
CYP2C19 allele frequencies
Allele frequencies are presented in Table 2. Our sample subgroups had a lower CYP2C19*1 frequency than EUR (∼55 vs 63%), except for Native Hawaiians who had the highest allele frequency relative to other subgroups and EUR; however, the differences were not significant (p > 0.008). In each ethnicity of our studied population, the frequencies of CYP2C19*2, *3 and *17 variants were significantly different from EUR (Table 2). The overall range of the no function allele frequencies of CYP2C19*2 and *3 was significantly higher in our population groups (25–36% and 2.5–10%, respectively) than EUR (15 and 0.02%, respectively). The frequency of the CYP2C19*2 variant in Filipino (35.8%, 95% CI: 31.1, 40.9), Japanese (35.1%, 95% CI: 30.2, 40.1), Korean (33.8%, 95% CI: 26.6, 41.6), Native Hawaiian (24.7%, 95% CI: 19.9, 29.7), Marshallese (33.6%, 95% CI: 27.9, 39.8) and Samoan (35.1%, 95% CI: 30.1, 40.1) population subgroups was approximately double the rate seen in EUR (14.6%) (Table 2). Among our population subgroups, Marshallese had the highest frequency of CYP2C19*3 at 9.8% (95% CI: 6.6, 13.5). The CYP2C19*3 variant was also detected in 9% of Samoan (95% CI: 6.3, 11.7), 9.1% of Japanese (95% CI: 6.5, 12), 8.5% of Filipino (95% CI: 6, 11.2), 8.2% of Korean (95% CI: 4.4, 12.2), and 2.4% of Native Hawaiian (95% CI: 1, 4) (Table 2). In contrast, the overall frequency of the CYP2C19*17 allele was significantly higher in EUR (21.7%) than in our population subgroups (1–6%) (Table 2).
Altered activity allele frequencies were distinctly higher among our population subgroups, with the Filipino cohort having the highest frequency of CYP2C19*2, at a rate of 36%; the Marshallese cohort having the highest frequency of CYP2C19*3, at a rate of 10%; and Native Hawaiians having the highest frequency of CYP2C19*17 at a rate of 6%. The Asian subgroups and Pacific Islanders had the lowest prevalence of wild-type allele (i.e., CYP2C19*1) at ∼55%, except for Native Hawaiians, indicating that almost half of our population had at least one of the three clinically actionable alleles of CYP2C19*2, *3 or *17 (Figure 1). For the entire study population sample, the rate of having at least one of the aforementioned clinically relevant CYP2C19 allelic variants is 33–45% relative to 36% in EUR. Specifically, the Marshallese, Samoan, Filipino and Japanese cohorts had the highest rates at ∼45%, followed by the Korean cohort with a rate at 43%. Distinctly, the Native Hawaiian cohort had the lowest rate at 33% (Figure 1).
Figure 1. . Proportion of individuals with at least one CYP2C19*2, *3 or *17 allele.
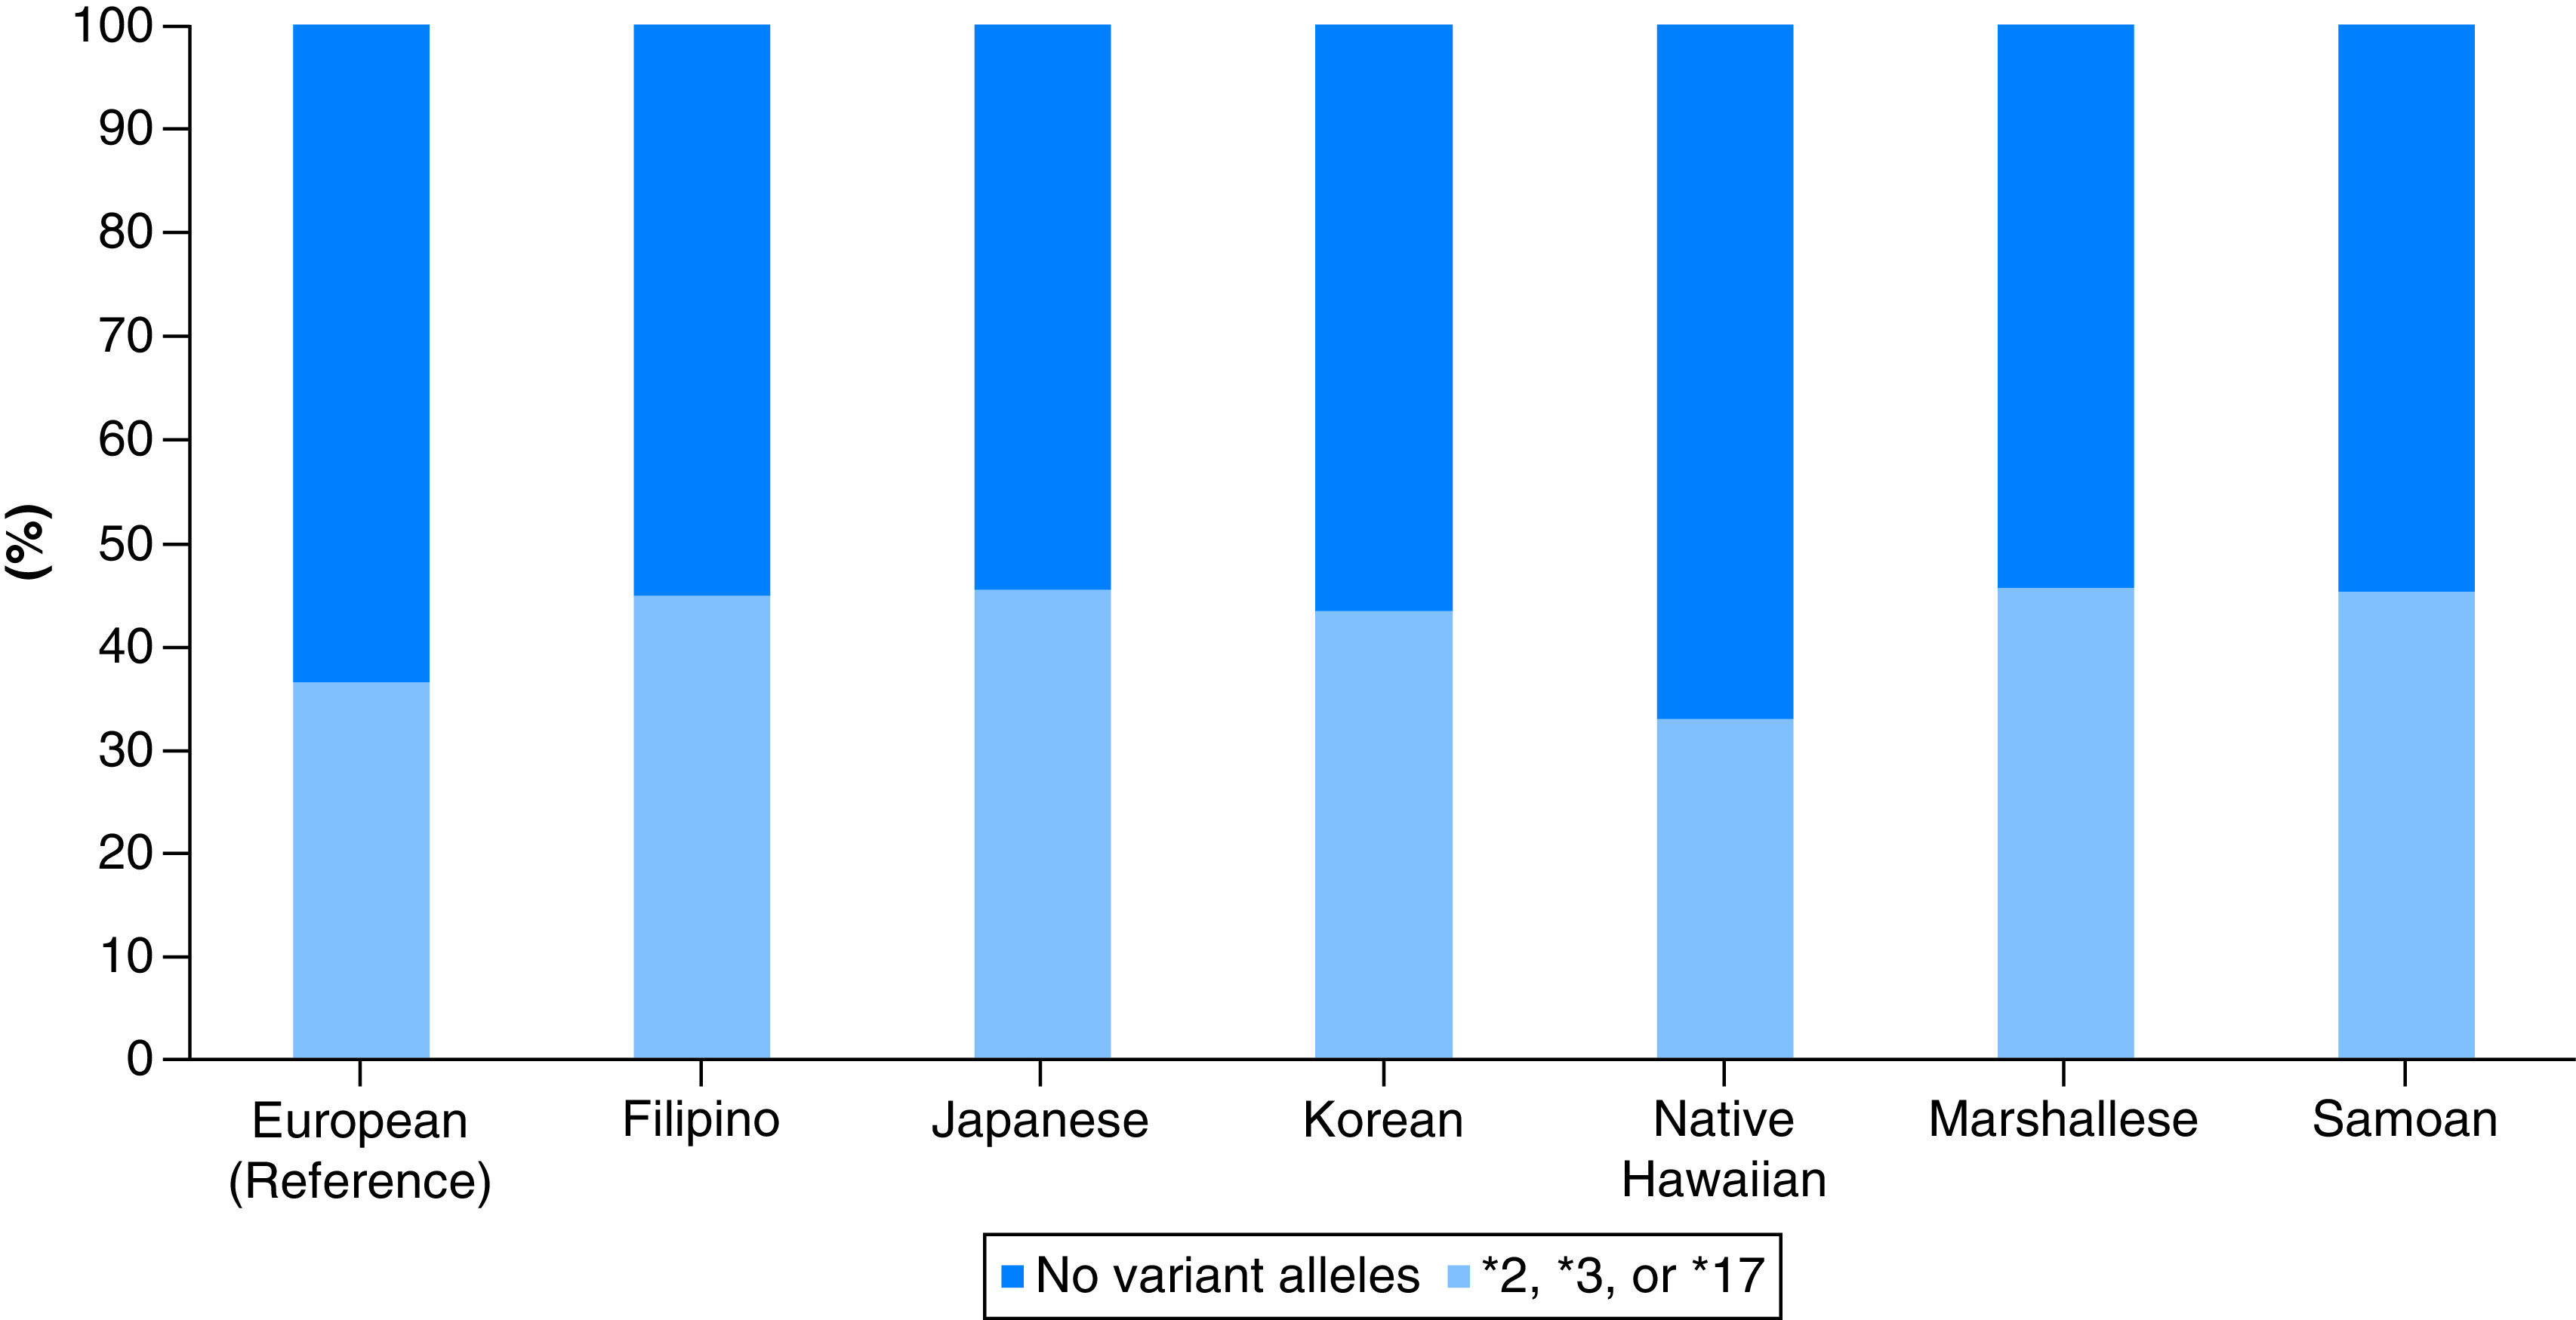
Light blue color represents the proportion of each population subgroup carrying at least one actionable CYP2C19 allele (i.e., CYP2C19*2, *3 or *17). Dark blue color represents the proportion of each population subgroup without any of the CYP2C19*2, *3 or *17 alleles.
CYP2C19 diplotype frequencies
CYP2C19 diplotype frequencies are presented in Table 3. The CYP2C19*1/*1 was significantly less prevalent in our Asian and Pacific Islander subgroups (∼32 and ∼33%, respectively) relative to EUR (41%). Conversely, Native Hawaiians had a higher frequency of CYP2C19*1/*1 (44.5%) than EUR (41%) and Asian and Pacific Islander subgroups (∼32 and ∼33%, respectively). The Asian subgroups, Native Hawaiians and Pacific Islanders were found to have significantly higher frequencies of CYP2C19*2/*2, *2/*3 and*3/*3 (8–16%, 4–10% and ∼1.3%, respectively) than EUR (2.1%, 0.005%, and 0.0003%, respectively). The frequency of CYP2C19*2/*2 was 13.4% in Filipino (95% CI: 6.5, 21.3), 15.2% in Japanese (95% CI: 8.2, 23), 16% in Korean (95% CI: 5.3, 28.4), 11% in Marshallese, (95% CI: 2.5, 20.9), 12.4% in Samoan, (95% CI: 5.1, 20.2), and 7.5% in Native Hawaiian (95% CI: 0, 16.1). The CYP2C19*2/*3 frequency was 4% in Korean (95% CI: 0, 16.4), 5.4% in Filipino (95% CI: 0, 13.2), 6.5% in Japanese (95% CI: 0, 14.4), 10.2% in Marshallese, (95% CI: 1.8, 20.1), and undetected in Native Hawaiian. Lastly, the frequency of CYP2C19*3/*3 was 0.5% in Japanese (95% CI: 0, 8.3), 1.3% in Korean (95% CI: 0, 13.7), 1.1% in Samoan (95% CI: 0, 9) and absent in the remaining ethnicities (Table 3).
The overall ranges of frequencies of CYP2C19*1/*2, *1/*3, *2/*17 and *3/*17 diplotypes were detected at significantly higher rates in our studied population subgroups relative to EUR (Table 3). Among the reduced function diplotypes and across all population subgroups, the most common diplotype was CYP2C19*1/*2 at ∼35% followed by *1/*3 at ∼9% with the rest falling below 1–2%. The CYP2C19*1/*2 frequency was more prevalent in Filipino (39.3%; 95% CI: 32.3, 47.1), followed by Samoan (38.2%; 95% CI: 30.9, 46.1). Similarly, Filipino had the highest CYP2C19*1/*3 diplotype frequency at 12.4% (95% CI: 5.4, 20.2) followed by Japanese at 10.9% (95% CI: 3.8, 18.7) and Marshallese at 10.2% (95% CI: 1.8, 20.1). Native Hawaiians had the highest frequency of CYP2C19*1/*17 at 8.2% (95% CI: 0, 16.8) compared with ∼1.4% in Filipino, Japanese and Samoan, and undetected the remaining subgroups. The CYP2C19*17/*17 diplotype was rare in Native Hawaiians and Marshallese, 0.7 and 0.9%, respectively, and absent in the remaining ethnicities (Table 3).
CYP2C19 predicted phenotype frequency
The Native Hawaiian subgroup had the highest frequency of CYP2C19 NM predicted phenotype (44.5%) among all our population subgroups and relative to EUR (41%). The frequencies of the CYP2C19 rapid and ultrarapid metabolizers (28 and 5%, respectively) were significantly higher in the EUR compared with Asian subgroups (∼2 and 0%), Native Hawaiians (8 and ∼1%), and Pacific Islanders (∼2 and ∼1%). The IM phenotype was significantly more common in Asian subgroups, Native Hawaiians and Pacific Islanders (43–52, 39 and ∼45%, respectively) than in EUR (25%). Almost half of our population had a high prevalence of being CYP2C19 IM, indicating that these populations have a potentially clinically actionable genotype. Similarly, the PM phenotype rate was significantly higher in Asian subgroups, Native Hawaiians and Pacific Islanders (18–22, 8 and ∼20%, respectively) than the EUR (2%). (Table 3).
Discussion
To our knowledge, this analysis is the first and only report on allele frequencies of CYP2C19*2, *3 and *17 in women of Filipino, Native Hawaiian Marshallese and Samoan descent. We believe our study results expands the knowledge of CYP2C19 allele and genotype frequencies among underrepresented ethnic groups and improves the clinical decision-making process to personalize medicine. Although previous research showed a high prevalence of the CYP2C19 variants (CYP2C19*2 and *3) in East Asian (EAS) and NHPI, it overlooked the differences between Asian ancestral ethnic subgroups. Unlike previous studies, our analysis illustrates the overall frequencies within the diverse Asian and Pacific Islanders population subgroups that are minimally represented in research. These new insights allow us to inform future genetic research studies to focus on high-risk population subgroups.
Previous studies indicated that Asian ancestral subgroups have higher rates of CYP2C19 IM (29-35%) and PM (9%) phenotype compared with Caucasians (∼15 and 0.4%) [37,42]. A large retrospective multi-ethnic study estimating CYP2C19 genotype frequencies of PMs (CYP2C19*3/*3) and IMs (CYP2C19*1/*2 and *1/*3) were significantly higher in EAS and NHPI relative to other ethnicities, including EUR [1]. Specifically, the CYP2C19*3/*3 (PM) frequency was 0.44% in EAS, and 0.32% in NHPI, relative to <0.0003% in EUR. Besides, the CYP2C19*1/*2 (IM) frequency was 35.2% in EAS, and 33.5% in NHPI, while the CYP2C19*1/*3 (IM) frequency was 7.3% in EAS and 8.3% in NHPI. EAS and NHPI had the second-highest CYP2C19*2/*2 (PM) frequencies (8.22% and 7.9%, respectively), after South Asian (10.59%), among other populations, including EUR (2.15%), African–American (3.26%), Hispanic (1.99%), Middle Eastern (1.46%), American Native Indian and Alaska Native (1.92%) and Ashkenazi Jewish (1.99%) [1]. Importantly, the study included a small size of participants of EAS and NHPI descent.
Our results are consistent with previously published reports. Ionova et al., in a retrospective and large multi-ethnic study estimating CYP2C19 genotype frequencies with a sample size of more than 2.2 million, showed that CYP2C19*2 was prevalent in EASs (28.4%), and NHPIs (27.6%). Also, CYP2C19*3 was predominantly found in EASs (6%) and NHPIs (6.5%), but CYP2C19*17 was more common in EURs (21.74 %), African–Americans (22%), Middle Eastern (21.7%) compared with EAS (3.7%) and NHPI (5.5%) [1].
Our cohort revealed a comparable frequency of CYP2C19*2 to EAS (33.8–35.8%) and NHPI (24.7–35.1%). The frequency of CYP2C19*3 was also comparable in our cohort of EAS (8.2–9.1%) and NHPI (2.4–9.8%). Also, the frequency of CYP2C19*17 in the EUR population from 1000 Genomes Project Phase III [37] was comparable to the findings of Ionova et al. [1] (22.5 vs 21.7%). Our findings indicate that CYP2C19*17 was significantly less common in NHPI relative to EUR, which was also consistent with the results from Ionova et al. [1] (1.1–5.7% vs 5.5%). Conversely, the frequency of CYP2C19*17 in our cohort of EAS was relatively lower than the frequency reported by Ionova et al. [1] (0.5–1.3% vs 3.7%).
Our findings are in parallel with the analysis by Zhou et al. indicating that CYP2C19*2 and CYP2C19*3 as the most prevalent alleles in EASs (78.5% and 6.7%), with CYP2C19*17 being more abundant in EURs (54.8%) [38]. The authors analyzed their results based on genetically identified ethnicities, while our study analysis reported frequencies based on self-identified race and ethnicity. Regardless of the variation in population identification approaches, the comparable results highlight the reliability of our methodology. Additionally, our findings of CYP2C19*2, *3, and *17 prevalence in Japanese are in line with published reports from the Pharmacogenomics Knowledge-Base (PharmGKB) [6,42]. According to prior research, the frequencies of CYP2C19*2, *3, and *17 in Japanese (n = 208) were 32.1%, 7.1%, and 1.5%, respectively [6,42], which are similar to our estimates of 35.1%, 9.1%, and 1.1%, respectively (Table 2).
Larsen et al. reported that Pacific Islanders and Maori patients with ACS were significantly more likely than EUR to have a higher CYP2C19*2 allele prevalence (47% vs 26%; p < 0.05) [43]. Another study showed that 13.6% of South Pacific Polynesians were CYP2C19 PMs [44]. However, the latter study only included 51 Samoan ancestral participants. Results from our Pacific Islander (PI) cohort showed a lower prevalence of CYP2C19*2 allele (∼34%). Unlike the previous study which combined PI and Maori, overlooking possible allele differences between the subgroups, we focused on two distinct and well-characterized PI groups – Marshallese and Samoan. Indeed, information scarcity about population-specific allele frequency could lead to inaccurate prediction of ADRs in these populations [29].
Well-characterized variants in the CYP2C19 gene can significantly modify the metabolism of several medications that have genetic-based guidelines provided by the Clinical Pharmacogenetics Implementation Consortium (CPIC) [9,19]. High frequencies of variant genotypes that alter the function of major drug-metabolizing enzymes, could have significant clinical implications for the decision-making process in drug selection. Even though genetic polymorphisms in CYP2C19 could result in different phenotype profiles, the magnitude of risk is medication specific. For instance, CYP2C19 IM or PM phenotypes are associated with the reduced response to clopidogrel and increased risk of major cardiovascular outcomes in patients with ACS, undergoing PCI, or increased drug concentration in patients treated with PPIs. Hence, the US FDA issued a Black Box Warning regarding using clopidogrel in CYP2C19 PMs [45,46]. Unlike the FDA, CPIC guidelines recommend clopidogrel alternatives in the CYP2C19 IMs and PMs phenotypes [9,19,20,25]. On the contrary, the risk of negative outcomes due to the CYP2C19 PM phenotype is minor for patients taking PPIs (e.g., esomeprazole or rabeprazole). As a result, the CPIC guidelines did not recommend dosing change but suggested monitoring efficacy and considering a 50% reduction in the daily dose [28]. A growing body of evidence suggested an association between CYP2C19*2 and *3 and phenytoin metabolism, impacting the maintenance dose required [8,47,48]. One study reported that, although CYP2C19 only partly (10%) contributes to the metabolism of phenytoin (90% metabolized by CYP2C9), PMs of Asian ancestry required maintenance dose reduction of this narrow therapeutic index drug by 11% relative to NMs [48].
Given the high prevalence of CYP2C19 IM or PM phenotypes across Asian and NHPI ethnic groups, as demonstrated by this study, knowledge of the patient's CYP2C19 genotype should be considered when prescribing medications that have genotype-based guidelines available. We calculated each Asian and NHPI subgroups' prevalence with a potentially clinically relevant CYP2C19 variant (Table 3). The proportions of IM or PM in each subgroup of our study significantly surpass those who are IM or PM in EUR; except for UM or RM phenotypes, which are more common in EUR than in our studied population subgroups (Table 3). Ionova, Y. et al. [1] reported that 127,169 prescriptions were written for potential CYP2C19 non-normal metabolizers, for whom standard dosing or drug selection may not be best due to CPIC guidelines. Of these prescriptions, 8448 were for clopidogrel (a drug with potentially severe PGx outcomes) in IM or PM patients. Interestingly, both Asian and NHPI groups had the highest prevalence of non-functional variants and the highest proportion of antiplatelet prescriptions compared with other ethnicities [1].
These findings have other implications for other PGx-based medications, such as voriconazole. Pharmacokinetic studies found that CYP2C19 PMs had significantly higher levels of exposure to voriconazole relative to NM in healthy volunteers [49,50]. Hence, they are at an increased risk of adverse drug reactions (ADRs) due to prolonged exposure and higher trough concentration. Specifically, the CPIC guidelines recommend choosing an alternative antifungal in a patient with a CYP2C19 PM phenotype [26]. Selective serotonin reuptake inhibitors (SSRIs) are commonly prescribed and widely used for major depressive and anxiety disorders. Specifically, citalopram and escitalopram are extensively metabolized by CYP2C19, thus decreased clearance and increased exposure in patients deficient in this enzyme's activity may increase the risk of major ADRs such as QT prolongation. Indeed, CPIC guidelines recommend a 50% reduction of the starting dose or choosing an alternative in a patient with CYP2C19 PM phenotype [51].
Our cohort had a significantly higher frequency (8–22%) of CYP2C19 PM phenotypes compared with EUR (2%) (Table 3). This high prevalence of PM indicates that our population subgroups have a potentially actionable genotype and may benefit from preemptive pharmacogenetic testing. The CYP2C19 IM phenotype was detected at a significantly higher rate in our population groups (39-52%) versus EUR (25%) (Table 3).
State population demographics have been implicated in the ongoing litigation between the State of Hawaii and the pharmaceutical companies that manufactured Plavix® (clopidogrel). Our results provide more insights into the role of population-level genetics and the response to one of the most widely prescribed CYP2C19 substrate drugs, clopidogrel. The State of Hawaii is known to have the highest concentration of Native Hawaiians (NHs), Pacific Islanders (PIs), and Asians per capita in the United States [52]. Our results demonstrated that NHs had a significantly higher rate of CYP2C19 IM and PM (39% and 7.5%, respectively) than EUR (25% and 2.2%, respectively). Compared with Asian and PI subgroups, NHs have the lowest frequencies of CYP2C19 IM and PM phenotypes (∼21% vs 8%). Nonetheless, NHs had the highest frequency of CYP2C19 NM phenotype (45%) compared with EUR (41%), PI (36%), and Asian subgroups (29%). Collectively, our observations suggest that the high clustering of both NHPI and Asian subgroups in the State of Hawaii could have significantly amplified the poor treatment outcomes with clopidogrel, leading to the Hawaii clopidogrel lawsuit against Bristol–Myers Squibb and Sanofi [53].
Including Asian and NHPI subgroups in pharmacogenetic studies significantly reinforces the notion that populations with a high prevalence of clinically actionable CYP2C19 variants (CYP2C19*2, *3, and *17) could greatly benefit from pharmacogenetic testing. Healthcare providers could use this pharmacogenetic information to make optimal drug selections and engage in discussions with their patients about their treatment options. Pre-emptive pharmacogenetic testing provides an approach to predicting therapeutic outcomes and minimizing the risk of ADR, especially among medications that have robust drug–gene pairs guidelines. Collectively, our findings provide a significant step in implementing a personalized medicine approach for our patients and an illustration of meaningful subgroup differences in risk allele frequencies.
Limitations
Our study is not without limitations. First, our study only interrogated three CYP2C19 variants, CYP2C19*2, *3, and *17. This limited investigation may underestimate the frequencies of other CYP2C19 haplotypes in Asian or NHPI subgroups. Second, translating the CYP2C19 genotypes to phenotypes (e.g., NM, IM, RM or UM), was not confirmed by functional assays that could determine the enzyme metabolic activity. It is plausible that other or novel CYP2C19 variants in our population subgroups may influence CYP2C19 enzymatic activity. While more genetic studies are needed to test this hypothesis, our approach used well-validated CPIC translation tables [18] to define CYP2C19 star alleles to translate a diplotype to a predicted phenotype [18]. CYP2C19 diplotype may partially predict the CYP2C19 phenotypic status [54,55]. Third, race and ethnicity were self-reported, which could differ from genetically determined ancestry. Self-reported race and ethnicity is a common clinical practice, and clinicians often assign patients' racial demographics based on self-reported race and ethnicity, making our estimates more consistent with current practice. Some of our population subgroups could benefit from a larger sample size, especially Koreans. Finally, all our study participants were females which is not representative of the entire populations. However, we do not anticipate that the allele frequencies to significantly differ between males and females, despite conflicting reports of gender-specific CYP2C19 enzymatic activity [56–58]. Future studies should include a representative larger sample size of the respective population subgroup.
Conclusion
Significant variations in haplotype and diplotype frequencies of CYP2C19 were found between Asian and NHPI subgroups compared with EUR. Further, CYP2C19*2 and *3 variants were detected at higher frequencies in Asian and NHPI groups than in EUR. Our results are consistent with published reports showing that Asian population subgroups have a high prevalence of the reduced or no function alleles of CYP2C19 compared with EUR. With significantly different frequencies of CYP2C19 variants among our population subgroups from EUR, knowledge of an individual's CYP2C19 metabolizer status may warrant substantive treatment modifications and ultimately reduce the racial health disparities of the response to pharmacotherapy, especially in individuals of Asian and NHPI descent.
Future perspective
This study highlights the limitations of the broader racial categorization of Asian and NHPI populations. It also demonstrates significant differences in the frequency of three clinically actionable alleles in CYP2C19 between distinct population subgroups. Coupled with the CYP2C19 CPIC guidelines, our results, once validated, could be used to advocate for pharmacogenetic testing among select population subgroups with a high frequency of no or decreased CYP2C19 enzymatic function. Studying well-characterized population subgroups has the potential to discover novel variants and distinct allele frequencies, which can optimize our prediction model and move us beyond the one genotype that fits all [59]. Finally, engaging diverse ancestral subgroups in genetic research will enhance polygenic risk score assessments to accurately predict the response to a given treatment and disease risk across the entire population. Collectively, targeted efforts of increasing representation of minority population groups are warranted to increase diversity in the genetic research landscape and reduce health disparities associated with accessing genetic testing.
Summary points.
The CYP2C19 gene encodes a major drug-metabolizing enzyme with three clinically actionable variants, including CYP2C19*2, *3, and *17.
A large retrospective multi-ethnic study estimating CYP2C19 allele and diplotype frequencies showed that the rates of PM and IM phenotypes were significantly higher in Asian and NHPI than other ethnicities.
Racial categorizations of Asian and NHPI are broad and overlook possible genetic differences between population subgroups, rendering the frequency of CYP2C19 unknown in NHPI subgroups (i.e., Native Hawaiian, Samoan, and Marshallese).
Allele frequencies of CYP2C19*2, *3, and *17 were significantly different from EUR in each population subgroup. The non-functional alleles CYP2C19*2 and *3 were significantly higher in all population subgroups (25-36% and 2.5-10%, respectively) than EUR (15% and 0.02%, respectively). The increased function allele CYP2C19*17 was significantly lower in all population subgroups (1-6%) versus EUR (22%).
Native Hawaiians showed distinct allele frequencies relative to other Asian and Pacific Islanders. Specifically, the Native Hawaiian subgroup had less prevalence of the no function alleles CYP2C19*2 and *3 (24.7% and 2.4%, respectively) than other subgroups (33-35% and 8-10%, respectively). Additionally, the subgroup had more prevalence of the increased function allele CYP2C19*17 (5.7%) than other Asian and Pacific Islanders subgroups (0.5-2%).
This report is the first study that dissected the broad racial categorization of some Asian and NHPI population subgroups and showed important differences in allele frequency of three clinically actionable alleles in CYP2C19 relative to the European population.
Prospective studies with larger representative sample sizes are needed to elucidate possible sex-specific differences in CYP2C19 variant frequencies.
Supplementary Material
Acknowledgments
The authors would like to thank PM Gerk for critically reviewing the manuscript. The authors would also like to express their gratitude towards the peer reviewers and their dedication to scientific investigation. Their invaluable expert feedback has greatly improved the manuscript.
Footnotes
Supplementary data
To view the supplementary data that accompany this paper please visit the journal website at: www.futuremedicine.com/doi/suppl/10.2217/pme-2021-0175
Author contributions
KY Alrajeh and YM Roman wrote the manuscript; YM Roman designed the research and obtained the samples; YM Roman performed the research; KY Alrajeh and YM Alrajeh analyzed the data. All authors agreed to the final version of the manuscript.
Financial & competing interests disclosure
This project was, in part, supported by the National Institute on Minority Health and Health Disparities U54MD007584, G12MD007601, and the National Institute General Medical Sciences P20GM103466, from the National Institutes of Health. The content is solely the responsibility of the authors and does not necessarily represent the official views of the NCRR. The authors have no other relevant affiliations or financial involvement with any organization or entity with a financial interest in or financial conflict with the subject matter or materials discussed in the manuscript apart from those disclosed.
No writing assistance was utilized in the production of this manuscript.
Ethical conduct of research
This study was reviewed and approved by the University of Hawaii Human Subject Review Board. Protocol no. 2018-0022
References
Papers of special note have been highlighted as: • of interest; •• of considerable interest
- 1.Ionova Y, Ashenhurst J, Zhan J et al. CYP2C19 allele frequencies in over 2.2 million direct‐to‐consumer genetics research participants and the potential implication for prescriptions in a large health system. Clin. Transl. Sci. 13(6), 1298–1306 (2020). [DOI] [PMC free article] [PubMed] [Google Scholar]; • This large multi-ethnic study provides information on diplotype and allele frequencies in various ethnicities, including Europeans, East Asians, and Native Hawaiians and Pacific Islanders.
- 2.Roman YM. Race and precision medicine: is it time for an upgrade? Pharmacogenomics J. 19(1), 1–4 (2019). [DOI] [PubMed] [Google Scholar]; • Provides population-level insight about the necessity of diversifying the research landscape, specifically genetic research.
- 3.Roman Y. The United States 2020 Census data: implications for precision medicine and the research landscape. Per. Med. 19(1), 5–8 (2021). [DOI] [PubMed] [Google Scholar]; • Emphasizes the importance of determining novel population-specific genetic variants to ultimately personalize medicine.
- 4.Saravanakumar A, Sadighi A, Ryu R, Akhlaghi F. Physicochemical properties, biotransformation, and transport pathways of established and newly approved medications: a systematic review of the Top 200 Most prescribed drugs vs. the FDA-approved drugs between 2005 and 2016. Clin. Pharmacokinet. 58(10), 1281–1294 (2019). [DOI] [PMC free article] [PubMed] [Google Scholar]
- 5.OMIM. 124020. CYTOCHROME P450, SUBFAMILY IIC, POLYPEPTIDE 19; CYP2C19. https://omim.org/entry/124020?search=124020&highlight=124020.
- 6.Whirl-Carrillo M, McDonagh EM, Hebert JM et al. Pharmacogenomics knowledge for personalized medicine. Clin. Pharmacol. Ther. 92(4), 414–417 (2012). [DOI] [PMC free article] [PubMed] [Google Scholar]
- 7.Lima JJ, Thomas CD, Barbarino J et al. Clinical Pharmacogenetics Implementation Consortium (CPIC) Guideline for CYP2C19 and Proton Pump Inhibitor Dosing. Clin. Pharmacol. Ther. 109(6), 1417–1423 (2021). [DOI] [PMC free article] [PubMed] [Google Scholar]
- 8.Eltalal S, el Ayouty M, El-Said A, Wahba Y. CYP2C9 (*2&*3) and CYP2C19 (*2&*3) polymorphisms among children with nonlesional epilepsy: a single-center study. Acta Neurol. Belg. 121(6), 1623–1631 (2021). [DOI] [PubMed] [Google Scholar]
- 9.Lee CR, Luzum JA, Sangkuhl K et al. Clinical Pharmacogenetics Implementation Consortium Guideline for CYP2C19 Genotype and Clopidogrel Therapy: 2022 Update. Clin. Pharmacol. Ther. (2022). [DOI] [PMC free article] [PubMed] [Google Scholar]; • Provides contemporary evidence for genotype-guided treatment for clopidogrel recommendations.
- 10.PHARMGKB. Very Important Pharmacogene: CYP2C19. www.pharmgkb.org/vip/PA166169770.
- 11.Scott SA, Sangkuhl K, Shuldiner AR et al. PharmGKB summary: very important pharmacogene information for cytochrome P450, family 2, subfamily C, polypeptide 19. Pharmacogenet. Genomics 22(2), 159–165 (2012). [DOI] [PMC free article] [PubMed] [Google Scholar]
- 12.Stingl JC, Brockmöller J, Viviani R. Genetic variability of drug-metabolizing enzymes: the dual impact on psychiatric therapy and regulation of brain function. Mol. Psychiatry 18(3), 273–287 (2013). [DOI] [PubMed] [Google Scholar]
- 13.Zanger UM, Schwab M. Cytochrome P450 enzymes in drug metabolism: regulation of gene expression, enzyme activities, and impact of genetic variation. Pharmacol. Ther. 138(1), 103–141 (2013). [DOI] [PubMed] [Google Scholar]
- 14.Botton MR, Whirl-Carrillo M, del Tredici AL et al. PharmVar GeneFocus: CYP2C19. Clin. Pharmacol. Ther. 109(2), 352–366 (2021). [DOI] [PMC free article] [PubMed] [Google Scholar]
- 15.Gaedigk A, Ingelman-Sundberg M, Miller NA, Leeder JS, Whirl-Carrillo M, Klein TE. The Pharmacogene Variation (PharmVar) Consortium: Incorporation of the Human Cytochrome P450 (CYP) Allele Nomenclature Database. Clin. Pharmacol. Ther. 103(3), 399–401 (2018). [DOI] [PMC free article] [PubMed] [Google Scholar]
- 16.Gaedigk A, Casey ST, Whirl-Carrillo M, Miller NA, Klein TE. Pharmacogene Variation Consortium: A Global Resource and Repository for Pharmacogene Variation. Clin. Pharmacol. Ther. 110(3), 542–545 (2021). [DOI] [PMC free article] [PubMed] [Google Scholar]
- 17.Pratt VM, del Tredici AL, Hachad H et al. Recommendations for Clinical CYP2C19 Genotyping Allele Selection: A Report of the Association for Molecular Pathology. J. Mol. Diagn. 20(3), 269–276 (2018). [DOI] [PubMed] [Google Scholar]
- 18.Clinical Pharmacogenetics Implementation Consortium. CPIC® Guideline for clopidogrel and CYP2C19 (2022). https://cpicpgx.org/guidelines/guideline-for-clopidogrel-and-cyp2c19/. ; •• This webpage provides all tables necessary to translate the genotype to diplotype and phenotype data for the CYP2C19 pharmacogene.
- 19.Caudle KE, Dunnenberger HM, Freimuth RR et al. Standardizing terms for clinical pharmacogenetic test results: consensus terms from the Clinical Pharmacogenetics Implementation Consortium (CPIC). Genet. Med. 19(2), 215–223 (2017). [DOI] [PMC free article] [PubMed] [Google Scholar]
- 20.Sorich MJ, Rowland A, McKinnon RA, Wiese MD. CYP2C19 genotype has a greater effect on adverse cardiovascular outcomes following percutaneous coronary intervention and in Asian populations treated with clopidogrel: a meta-analysis. Circ. Cardiovasc. Genet. 7(6), 895–902 (2014). [DOI] [PubMed] [Google Scholar]
- 21.Lee CR, Thomas CD, Beitelshees AL et al. Impact of the CYP2C19*17 allele on outcomes in patients receiving genotype-guided antiplatelet therapy after percutaneous coronary intervention. Clin. Pharmacol. Ther. 109(3), 705–715 (2021). [DOI] [PMC free article] [PubMed] [Google Scholar]
- 22.Zhang Z, Chen M, Zhang L, Zhao Q. The impact of cytochrome 450 and Paraoxonase polymorphisms on clopidogrel resistance and major adverse cardiac events in coronary heart disease patients after percutaneous coronary intervention. BMC Pharmacol. Toxicol. 21(1), 1 (2020). [DOI] [PMC free article] [PubMed] [Google Scholar]
- 23.Mohareb MW, AbdElghany M, Zaki HF, El-Abhar HS. Diabetes and CYP2C19 polymorphism synergistically impair the antiplatelet activity of clopidogrel compared with ticagrelor in percutaneous coronary intervention-treated acute coronary syndrome patients. J. Cardiovasc. Pharmacol. 76(4), 478–488 (2020). [DOI] [PubMed] [Google Scholar]
- 24.Cavallari LH, Lee CR, Beitelshees AL et al. Multisite investigation of outcomes with implementation of CYP2C19 genotype-guided antiplatelet therapy after percutaneous coronary intervention. JACC Cardiovasc. Interv. 11(2), 181–191 (2018). [DOI] [PMC free article] [PubMed] [Google Scholar]
- 25.Mega JL, Close SL, Wiviott SD et al. Cytochrome P-450 polymorphisms and response to clopidogrel. N. Engl. J. Med. 360(4), 354–362 (2009). [DOI] [PubMed] [Google Scholar]
- 26.Moriyama B, Obeng AO, Barbarino J et al. Clinical Pharmacogenetics Implementation Consortium (CPIC) Guidelines for CYP2C19 and Voriconazole Therapy. Clin. Pharmacol. Ther. 102(1), 45–51 (2017). [DOI] [PMC free article] [PubMed] [Google Scholar]
- 27.Brown JT, Bishop JR, Sangkuhl K et al. Clinical Pharmacogenetics Implementation Consortium Guideline for Cytochrome P450 (CYP)2D6 Genotype and Atomoxetine Therapy. Clin. Pharmacol. Ther. 106(1), 4–102 (2019). [DOI] [PMC free article] [PubMed] [Google Scholar]
- 28.Lima JJ, Thomas CD, Barbarino J et al. Clinical Pharmacogenetics Implementation Consortium (CPIC) Guideline for CYP2C19 and Proton Pump Inhibitor Dosing. Clin. Pharmacol. Ther. 109(6), 1417–1423 (2021). [DOI] [PMC free article] [PubMed] [Google Scholar]
- 29.Lo C, Nguyen S, Yang C et al. Pharmacogenomics in Asian subpopulations and impacts on commonly prescribed medications. Clin. Transl. Sci. 13(5), 861–870 (2020). [DOI] [PMC free article] [PubMed] [Google Scholar]
- 30.Goldstein JA, Ishizaki T, Chiba K et al. Frequencies of the defective CYP2C19 alleles responsible for the mephenytoin poor metabolizer phenotype in various Oriental, Caucasian, Saudi Arabian and American black populations. Pharmacogenetics 7(1), 59–64 (1997). [DOI] [PubMed] [Google Scholar]
- 31.Kubota T, Chiba K, Ishizaki T. Genotyping of S-mephenytoin 4′-hydroxylation in an extended Japanese population. Clin. Pharmacol. Ther. 60(6), 661–666 (1996). [DOI] [PubMed] [Google Scholar]
- 32.Lee SS, Lee SJ, Gwak J et al. Comparisons of CYP2C19 genetic polymorphisms between Korean and Vietnamese populations. Ther. Drug Monit. 29(4), 455–459 (2007). [DOI] [PubMed] [Google Scholar]
- 33.Roh HK, Dahl ML, Tybring G, Yamada H, Cha YN, Bertilsson L. CYP2C19 genotype and phenotype determined by omeprazole in a Korean population. Pharmacogenetics 6(6), 547–551 (1996). [DOI] [PubMed] [Google Scholar]
- 34.Brown M, Moyer A. Predictors of awareness of clinical trials and feelings about the use of medical information for research in a nationally representative US sample. Ethn. Health 15(3), 223–236 (2010). [DOI] [PubMed] [Google Scholar]
- 35.Minocher Homji RS, Lakhoo S, Ray JG. Recruitment of immigrant and ethnic minorities in primary prevention trials of cardiovascular disease. QJM 104(6), 469–476 (2011). [DOI] [PubMed] [Google Scholar]
- 36.Collet JP, Hulot JS, Pena A et al. Cytochrome P450 2C19 polymorphism in young patients treated with clopidogrel after myocardial infarction: a cohort study. Lancet 373(9660), 309–317 (2009). [DOI] [PubMed] [Google Scholar]
- 37.IGSR: The International Genome Sample Resource. The International Genome Sample Resource. www.internationalgenome.org/.
- 38.Zhou Y, Ingelman-Sundberg M, Lauschke VM. Worldwide Distribution of Cytochrome P450 Alleles: A meta-analysis of population-scale sequencing projects. Clin. Pharmacol. Ther. 102(4), 688–700 (2017). [DOI] [PMC free article] [PubMed] [Google Scholar]
- 39.Roman Y, Tiirikainen M, Prom-Wormley E. The prevalence of the gout-associated polymorphism rs2231142 G&T in ABCG2 in a pregnant female Filipino cohort. Clin. Rheumatol. 39(8), 2387–2392 (2020). [DOI] [PubMed] [Google Scholar]
- 40.Signorelli A, Aho K, Alfons A et al. DescTools: Tools for Descriptive Statistics. R package version 0.99.45. Cran R Project (2022). https://cran.r-project.org/web/packages/DescTools/index.html [Google Scholar]
- 41.R Core Team. R: A language and environment for statistical computing. R Foundation for Statistical Computing, Vienna, Austria: (2020). www.R-project.org/. [Google Scholar]
- 42.Ensembl. Ensembl genome browser 103. https://useast.ensembl.org/index.html.
- 43.Larsen PD, Johnston LR, Holley A et al. Prevalence and significance of CYP2C19*2 and CYP2C19*17 alleles in a New Zealand acute coronary syndrome population. Intern. Med. J. 45(5), 537–545 (2015). [DOI] [PubMed] [Google Scholar]
- 44.Wanwimolruk S, Bhawan S, Coville PF, Chalcroft SCW. Genetic polymorphism of debrisoquine (CYP2D6) and proguanil (CYP2C19) in South Pacific Polynesian populations. Eur. J. Clin. Pharmacol. 54(5), 431–435 (1998). [DOI] [PubMed] [Google Scholar]
- 45.Holmes DR, Dehmer GJ, Kaul S, Leifer D, O'Gara PT, Stein CM. ACCF/AHA clopidogrel clinical alert: Approaches to the FDA “boxed warning”: A report of the American college of cardiology foundation task force on clinical expert consensus documents and the American heart association. J. Am. Coll. Cardiol. 56(4), 321–341 (2010). [DOI] [PubMed] [Google Scholar]
- 46.United States Food & Drug Administration. FDA Drug Safety Communication: Reduced effectiveness of Plavix (clopidogrel) in patients who are poor metabolizers of the drug. www.fda.gov/drugs/postmarket-drug-safety-information-patients-and-providers/fda-drug-safety-communication-reduced-effectiveness-plavix-clopidogrel-patients-who-are-poor.
- 47.Odani A, Hashimoto Y, Otsuki Y et al. Genetic polymorphism of the CYP2C subfamily and its effect on the pharmacokinetics of phenytoin in Japanese patients with epilepsy. Clin. Pharmacol. Ther. 62(3), 287–292 (1997). [DOI] [PubMed] [Google Scholar]
- 48.Liao K, Liu Y, Ai CZ, Yu X, Li W. The association between CYP2C9/2C19 polymorphisms and phenytoin maintenance doses in Asian epileptic patients: a systematic review and meta-analysis. Int. J. Clin. Pharmacol. Ther. 56(7), 337–346 (2018). [DOI] [PubMed] [Google Scholar]
- 49.Chung H, Lee H, Han H et al. A pharmacokinetic comparison of two voriconazole formulations and the effect of CYP2C19 polymorphism on their pharmacokinetic profiles. Drug Des. Devel. Ther. 9, 2609–2616 (2015). [DOI] [PMC free article] [PubMed] [Google Scholar]
- 50.Lee S, Kim BH, Nam WS et al. Effect of CYP2C19 polymorphism on the pharmacokinetics of voriconazole after single and multiple doses in healthy volunteers. J. Clin. Pharmacol. 52(2), 195–203 (2012). [DOI] [PubMed] [Google Scholar]
- 51.Hicks JK, Bishop JR, Sangkuhl K et al. Clinical Pharmacogenetics Implementation Consortium. Clinical Pharmacogenetics Implementation Consortium (CPIC) guideline for CYP2D6 and CYP2C19 genotypes and dosing of selective serotonin reuptake inhibitors. Clin. Pharmacol. Ther. 98(2), 127–134 (2015). [DOI] [PMC free article] [PubMed] [Google Scholar]
- 52.United States Census Bureau. QuickFacts, HI, USA, www.census.gov/quickfacts/HI. [Google Scholar]
- 53.PharmGKB Blog: plavix manufacturers to pay $834 million to state of Hawaii (2021). https://pharmgkb.blogspot.com/2021/02/plavix-manufacturers-to-pay-834-million.html.
- 54.Kiss ÁF, Vaskó D, Déri MT, Tóth K, Monostory K. Combination of CYP2C19 genotype with non-genetic factors evoking phenoconversion improves phenotype prediction. Pharmacol. Rep. 70(3), 525–532 (2018). [DOI] [PubMed] [Google Scholar]
- 55.Sviri S, Shpizen S, Leitersdorf E, Levy M, Caraco Y. Phenotypic-genotypic analysis of CYP2C19 in the Jewish Israeli population. Clin. Pharmacol. Ther. 65(3), 275–282 (1999). [DOI] [PubMed] [Google Scholar]
- 56.Hägg S, Spigset O, Dahlqvist R. Influence of gender and oral contraceptives on CYP2D6 and CYP2C19 activity in healthy volunteers. Br. J. Clin. Pharmacol. 51(2), 169–173 (2001). [DOI] [PMC free article] [PubMed] [Google Scholar]
- 57.Laine K, Tybring G, Bertilsson L. No sex-related differences but significant inhibition by oral contraceptives of CYP2C19 activity as measured by the probe drugs mephenytoin and omeprazole in healthy Swedish white subjects. Clin. Pharmacol. Ther. 68(2), 151–159 (2000). [DOI] [PubMed] [Google Scholar]
- 58.Xie HG, Huang SL, Xu ZH, Xiao ZS, He N, Zhou HH. Evidence for the effect of gender on activity of (S)-mephenytoin 4′-hydroxylase (CYP2C19) in a Chinese population. Pharmacogenetics 7(2), 115–119 (1997). [DOI] [PubMed] [Google Scholar]
- 59.Roman YM, McClish D, Price ET et al. Cardiometabolic genomics and pharmacogenomics investigations in Filipino Americans: steps towards precision health and reducing health disparities. American Heart Journal Plus: Cardiology Research and Practice 15, 100136 (2022). [DOI] [PMC free article] [PubMed] [Google Scholar]
Associated Data
This section collects any data citations, data availability statements, or supplementary materials included in this article.