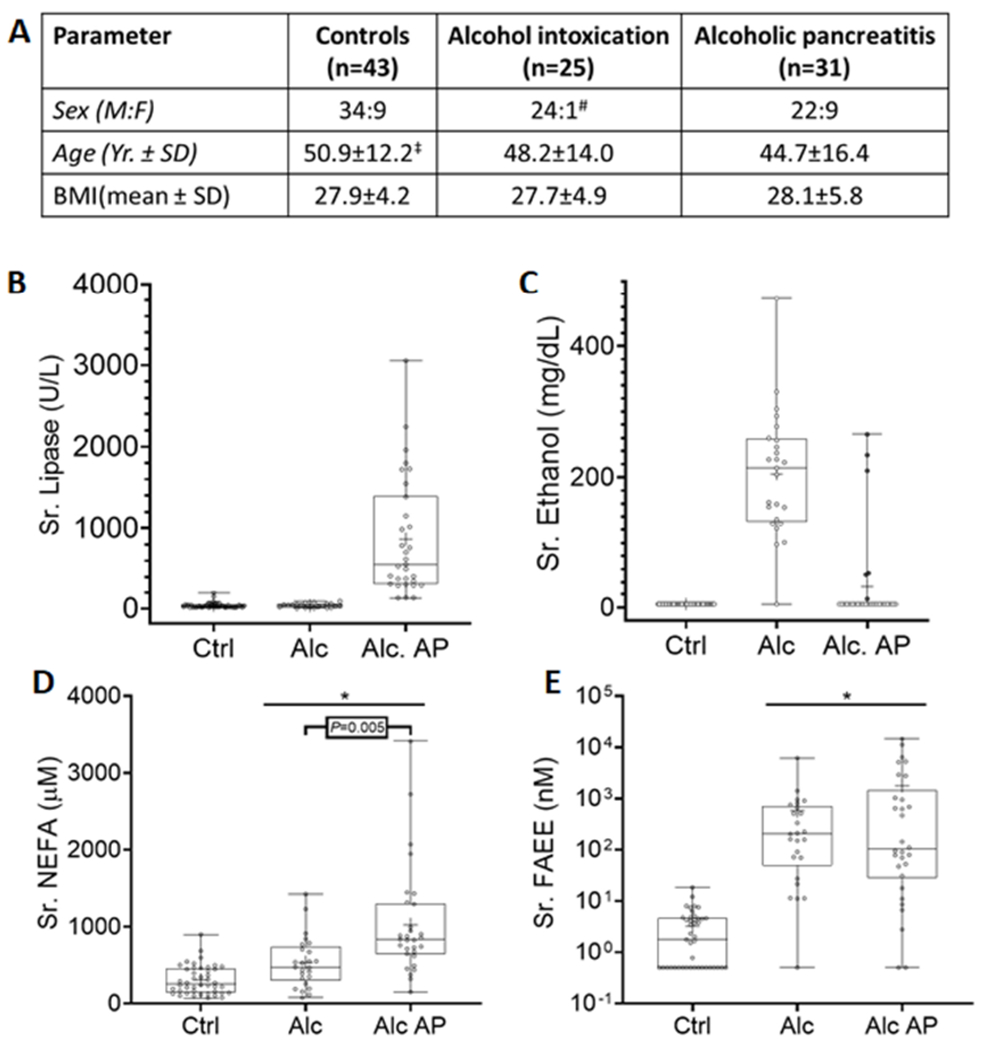
Figure 1: Biometrics and serum parameters of patients included in the study:

A: Table comparing biometric parameters of controls, alcohol intoxication and alcoholic pancreatitis patients. Each box shows data for the category listed at the top of the column with the mean ± standard deviation (SD) of the parameter compared in the row. # Significant difference in sex distribution was observed when comparing Alcohol intoxication vs. other groups (p=0.05), and Alcohol intoxication vs. AP (P=.03). ‡ Significant difference in age was observed when comparing with alcohol pancreatitis and control patients (P=.02). B-D: Box plots of serum parameters in controls (Ctrl), acute alcoholic intoxication patients (Alc) and or alcoholic pancreatitis (Alc AP) patients. Serum lipase (B), Ethanol (C), non-esterified fatty acids (NEFA; D) and fatty acid ethyl esters (FAEE; E) for each individual patient are shown as dots, the median as the horizontal line, mean as “+”, the boxes show the interquartile range and error bars show the range. The “*” indicates a P value <.05 vs. controls on ANOVA.
