All biologists who sample natural communities are plagued with the problem of how well a sample reflects a community's “true” diversity. New genetic techniques have revealed extensive microbial diversity that was previously undetected with culture-dependent methods and morphological identification (reviewed in references 2 and 46), but exhaustive inventories of microbial communities still remain impractical. As a result, we must rely on samples to inform us about the actual diversity of microbial communities.
Ecologists studying the diversity of macroorganisms also face this estimation problem and have designed tools to deal with the problems of sampling (14, 25, 36). Sparked by the availability of microbial diversity data, interest is emerging in applying these tools to microbes. Reliable estimates of microbial diversity would offer a means to address once intractable questions, such as what processes control microbial diversity? How do microbial communities affect ecosystem functioning? How are human beings affecting microbial communities?
Several microbial studies have used diversity indices (39, 44), estimated species richness (33, 43), and compared sample diversity with rarefaction curves (19, 40). Still others have proposed new diversity statistics specific to microbial samples (69). Despite the recent interest, however, the success of these tools has not yet been evaluated for microbial communities, and other potential approaches remain to be explored.
Here we compare the utility of various statistical approaches for assessing the diversity of microbial communities. First, we show examples of communities in which macroorganisms are as diverse as some microbial communities, suggesting that diversity estimation methods developed for macroorganisms may be appropriate for microbial samples. Second, we review these methods and discuss how to evaluate the success of diversity estimators for microbial communities for which the true diversity is unknown. We argue that even without knowing the “truth,” it is possible to rigorously compare relative diversity among communities. Finally, we apply some of these diversity measures to microbial data sets and examine how the confidence of the measures changes with sample size.
Throughout the paper, we use the term diversity to mean richness, or the number of types. We also use the term microbial with bacteria in mind, although much of the discussion is applicable to other microbes. For clarity, we will often refer to species as the measured unit of diversity, but our discussion can be applied to any operational taxonomic units (OTUs), such as the number of unique terminal restriction fragments (35) or number of 16S ribosomal DNA (rDNA) sequence similarity groups (41). Finally, we are concerned here with estimating richness and do not address how this diversity is related to functional diversity (1).
ARE MICROBES TOO DIVERSE TO COUNT?
In any community, the number of types of organisms observed increases with sampling effort until all types are observed. The relationship between the number of types observed and sampling effort gives information about the total diversity of the sampled community. This pattern can be visualized by plotting an accumulation or a rank-abundance curve.
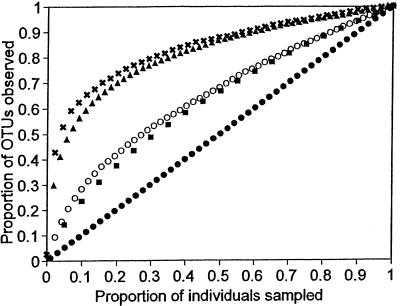
An accumulation curve is a plot of the cumulative number of types observed versus sampling effort. Figure 1 shows the accumulation curves for samples from five communities: bacteria from a human mouth (33), soil bacteria (6), tropical moths (56), tropical birds (J. B. Hughes, unpublished data), and temperate forests (26). We standardized the data sets by the number of individuals collected to compare the shapes of the curves. Differences in the richness and relative abundances of species in the sampled communities underlie the differences in the shape of the curves. Because all communities contain a finite number of species, if the surveyors continued to sample, the curves would eventually reach an asymptote at the actual community richness (number of types). Thus, the curves contain information about how well the communities have been sampled (i.e., what fraction of the species in the community have been detected). The more concave-downward the curve, the better sampled the community.
FIG. 1.
Accumulation curves for Michigan plants (✖; n = 1,783) (26), Costa Rican birds (▴; n = 5,007) (J. B. Hughes, unpublished data), human oral bacteria (○; n = 264) (33), Costa Rican moths (■; n = 4,538) (56), and East Amazonian soil bacteria (●; n = 98) (6). Curves are averaged over 100 simulations using the computer program EstimateS and are standardized for the number of individuals and species observed.
The idea that microbial diversity cannot be estimated comes from the fact that many microbial accumulation curves are linear or close to linear because of high diversity, small sample sizes, or both. Indeed, the accumulation curve of East Amazonian soil bacteria represents the worst-case scenario (Fig. 1). Every individual identified was a different type; therefore, this sample supplies no information about how well the community has been sampled. At the other extreme, the plant and bird communities plotted in Fig. 1 are well sampled, and the samples therefore contain considerable information about total richness. The two intermediate curves provide the most telling comparison, however. Even though the moth sample is much larger than the mouth bacteria sample (4,538 versus 264 individuals), the shape of the curves is similar. In other words, the communities have been sampled with roughly equivalent intensity relative to their overall richness.
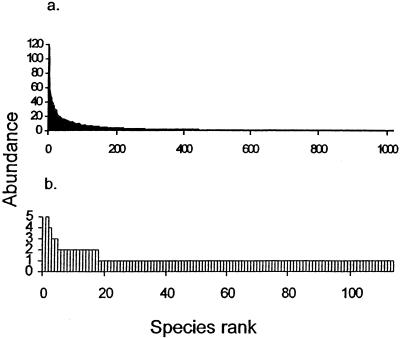
Another way to compare how well communities have been sampled is to plot their rank-abundance curves. The species are ordered from most to least abundant on the x axis, and the abundance of each type observed is plotted on the y axis. The moth and soil bacteria communities exhibit a similar pattern (Fig. 2), one that is typical of superdiverse communities such as tropical insects. A few species in the sample are abundant, but most are rare, producing the long right-hand tail on the rank-abundance curve.
FIG. 2.
Rank-abundance curves for (a) tropical moths (n = 4,538) (56) and (b) temperate soil bacteria (n = 137) (39). The two most abundant species of moths (396 and 173 individuals) are excluded from panel a to shorten the y axis.
If these organisms were sampled on the same spatial scale, there is no doubt that soil bacterial diversity would be higher than moth diversity. These comparisons suggest, however, that our ability to sample bacterial diversity in a human mouth or in a few grams of some soils may be similar to our ability to sample moth diversity in a few hundred square kilometers of tropical forest. Thus, at least for some communities, microbiologists may be able to coopt techniques that ecologists use to estimate and compare the richness of macroorganisms.
Ultimately, microbes—like tropical insects—are too diverse to count exhaustively. While it would be useful to know the actual diversity of different microbial communities, most diversity questions address how diversity changes across biotic and abiotic gradients, such as disturbance, productivity, area, latitude, and resource heterogeneity. The answers to these questions require knowing only relative diversities among sites, over time, and under different treatment regimens. Using this approach, the relationships between insect diversity and many environmental variables have been well studied (50, 57, 63, 64), even though estimates of the total number of insect species range over three orders of magnitude (22, 54).
SOME POSSIBLE TOOLS: RAREFACTION AND RICHNESS ESTIMATORS
A variety of statistical approaches have been developed to compare and estimate species richness from samples of macroorganisms. In this section, we consider the suitability of four approaches for microbial diversity studies.
The first approach, rarefaction, has been adopted recently by a number of microbiologists (4, 19, 40). Rarefaction compares observed richness among sites, treatments, or habitats that have been unequally sampled. A rarefied curve results from averaging randomizations of the observed accumulation curve (25). The variance around the repeated randomizations allows one to compare the observed richness among samples, but it is distinct from a measure of confidence about the actual richness in the communities.
In contrast to rarefaction, richness estimators estimate the total richness of a community from a sample, and the estimates can then be compared across samples. These estimators fall into three main classes: extrapolation from accumulation curves, parametric estimators, and nonparametric estimators (14, 23, 47). To date, we have found only two studies that apply richness estimators to microbial data (33, 43).
Most curve extrapolation methods use the observed accumulation curve to fit an assumed functional form that models the process of observing new species as sampling effort increases. The asymptote of this curve, or the species richness expected at infinite effort, is then estimated. These models include the Michaelis-Menten equation (13, 51) and the negative exponential function (61). The benefit of estimating diversity with such extrapolation methods is that once a species has been counted, it does not need to be counted again. Hence, a surveyor can focus effort on identifying new, generally rarer, species. The downside is that for diverse communities in which only a small fraction of species is detected, several curves often fit equally well but predict very different asymptotes (61). This approach therefore requires data from relatively well sampled communities, so at present curve extrapolation methods do not seem promising for estimating microbial diversity in most natural environments.
Parametric estimators are another class of estimation methods. These methods estimate the number of unobserved species in the community by fitting sample data to models of relative species abundances. These models include the lognormal (49) and Poisson lognormal (7). For instance, Pielou (48) derived an estimator that assumes species abundances are distributed lognormally; that is, if species are assigned to log abundance classes, the distribution of species among these classes is normal. By fitting sample data to the lognormal distribution, the parameters of the curve can be evaluated. Pielou's estimator uses these parameter values to estimate the number of species that remain unobserved and thereby estimate the total number of species in the community.
There are three main impediments to using parametric estimators for any community. First, data on relative species abundances are needed. For macroorganisms, often only the presence or absence of a species in a sample or quadrat is recorded. In contrast, data on relative OTU abundances of microbes are often collected (see discussion below about potential biases). Second, one has to make an assumption about the true abundance distribution of a community. Although most communities of macroorganisms seem to display a lognormal pattern of species abundance (17, 36, 66), there is still controversy as to which models fit best (24, 30). In the absence of a variety of large microbial data sets, it is not clear which, if any, of the proposed distribution models describe microbial communities. Finally, even if one of these models is a good approximation of relative abundances in microbial communities, parametric estimators require large data sets to evaluate the distribution parameters. The largest microbial data sets currently available include only a few hundred individuals.
The final class of estimation methods, nonparametric estimators, is the most promising for microbial studies. These estimators are adapted from mark-release-recapture (MRR) statistics for estimating the size of animal populations (32, 59). Nonparametric estimators based on MRR methods consider the proportion of species that have been observed before (“recaptured”) to those that are observed only once. In a very diverse community, the probability that a species will be observed more than once will be low, and most species will only be represented by one individual in a sample. In a depauperate community, the probability that a species will be observed more than once will be higher, and many species will be observed multiple times in a sample.
The Chao1 and abundance-based coverage estimators (ACE) use this MRR-like ratio to estimate richness by adding a correction factor to the observed number of species (9, 11). (For reviews of these and other nonparametric estimators, see Colwell and Coddington [14] and Chazdon et al. [12].) For instance, Chao1 estimates total species richness as
 |
where Sobs is the number of observed species, n1 is the number of singletons (species captured once), and n2 is the number of doubletons (species captured twice) (9). Chao (9) noted that this index is particularly useful for data sets skewed toward the low-abundance classes, as is likely to be the case with microbes.
The ACE (10) incorporate data from all species with fewer than 10 individuals, rather than just singletons and doubletons. ACE estimates species richness as
 |
where Srare is the number of rare samples (sampled abundances ≤10) and Sabund is the number of abundant species (sampled abundances >10). Note that Srare + Sabund equals the total number of species observed. CACE = 1 − F1/Nrare estimates the sample coverage, where F1 is the number of species with i individuals and  Finally,
 |
which estimates the coefficient of variation of the Fi's (R. Colwell, User's Guide to EstimateS 5 [http://viceroy.eeb.uconn.edu/estimates]).
Both Chao1 and ACE underestimate true richness at low sample sizes. For example, the maximum value of SChao1 is (S2obs + 1)/2 when one species in the sample is a doubleton and all others are singletons. Thus, SChao1 will strongly correlate with sample size until Sobs reaches at least the square root of twice the total richness (14).
EVALUATING RICHNESS ESTIMATORS
Given the variety of possible diversity estimators, how does one evaluate their utility? Clearly, the most desirable estimator is one that is both precise and unbiased. Precision describes the variation of the estimates from all possible samples that can be taken from the population. Bias describes the difference between the expected value of the estimator and the true, unknown richness of the community being sampled (in other words, whether the estimator consistently under- or overestimates the true richness).
To test for bias, one needs to know the true richness to compare against the sample estimates. As yet, this comparison is impossible for microbes, because no communities have been exhaustively sampled. The bias of richness estimators has only been tested in a few natural communities in which the exact abundance of every species in an area is known (12, 14, 15, 26, 47).
In contrast, precision is a relatively simple property to assess. With multiple samples (or one large sample) from a microbial community, the variance of microbial richness estimates can be calculated and compared. Moreover, most ecological questions require only comparisons of relative diversity. For these questions, an estimator that is consistent with repeated sampling (is precise) is often more useful than one that on average correctly predicts true richness (has the lowest bias). Thus, if we use diversity measures for relative comparisons, we avoid the problem of not being able to measure bias. (This assumes that the bias of an estimator does not differ so radically among communities that it disrupts the relative order of the estimates. In the absence of alternative evidence, this initial assumption seems appropriate.)
Chao (8) derives a closed-form solution for the variance of SChao1:
 |
This formula estimates the precision of Chao1; that is, it estimates the variance of richness estimates that one expects from multiple samples. A closed-form solution of variance for the ACE has not yet been derived.
Comparisons of relative species richness based on rarefaction may seem more reliable than comparisons using extrapolations that require a number of assumptions, but rarefaction is limited for two reasons. First, rarefaction compares samples, not communities. The error bars around a rarefaction curve describe the variation due to reordering of subsamples within the collected sample, not the precision of the observed richness. In contrast, a measure of precision would describe the variation in the number of species expected to be observed if the community were sampled repeatedly. It is possible to estimate the precision of rarefaction curves, for instance, by bootstrapping (20). Error bars derived by this method allow the detection of significant differences in observed richness between communities.
Second, the rank order of observed richness values does not necessarily correspond to relative total richness, because rarefaction analyses do not exclude the possibility that the species accumulation curves cross at a higher sample size (34). In contrast, species richness estimators take the shape of the accumulation curve into account to determine total richness. Thus, in theory these estimators can predict a crossover of the accumulation curves and thereby better predict relative total richness.
CASE STUDIES
In terms of both underlying assumptions and their ability to be evaluated, nonparametric estimators are a promising tool for assessing microbial diversity. To further investigate their potential, we applied these techniques to four microbial data sets. In particular, we compared the use of nonparametric estimators with the rarefaction approach and investigated how the precision of their estimates changes with sample size. These four data sets were among the largest available and represented a range of habitat types and environmental gradients. We came across a number of additional data sets that would also have been appropriate for these analyses (19, 53), although others of comparable size were too diverse to be analyzed with these techniques (5, 45).
The analyses were performed with EstimateS (version 5.0.1; R. Colwell, University of Connecticut [http://viceroy.eeb.uconn.edu/estimates]). For the purposes of inputting data into the program, we treated each cloned sequence as a separate sample. We ran 100 randomizations for all tests. Further randomizations did not change the results.
Human mouth and gut.
Two of the best-sampled microbial communities are from human habitats. Kroes et al. (33) sampled subgingival plaque from a human mouth. They used PCR to amplify the bacterial 16S rDNA, created clone libraries from the amplified DNA, and then sequenced 264 clones. Kroes et al. defined an OTU as a 16S rDNA sequence group in which sequences differed by ≤1%. By this definition, they found 59 distinct OTUs from their sample of 264 16S rDNA sequences. Although the accumulation curve does not reach an asymptote, it is not linear (Fig. 3). Thus, we can try to estimate total OTU richness. For these data, the Chao1 estimator levels off at 123 OTUs, suggesting that, after that point, the Chao1 estimate is relatively independent of sample size. In contrast, the ACE does not plateau as sample size increases, indicating that the estimate is not independent of sample size.
FIG. 3.
Observed and estimated OTU richness of bacteria in a human mouth (33) versus sample size. The number of OTUs observed for a given sample size, or the accumulation curve, is averaged over 50 simulations (○). Estimated OTU richness is plotted for Chaol (●) and ACE (▴) estimators.
Suau et al. (65) investigated the diversity of bacteria in a human gut. Similar to Kroes et al. (33), they amplified, cloned, and sequenced 16S rDNA fragments. Their definition of an OTU differed slightly from that in the Kroes et al. study, however; they define an OTU as a 16S rDNA sequence group in which sequences differed by ≤2%. With this definition, they identified 82 OTUs from 284 clones.
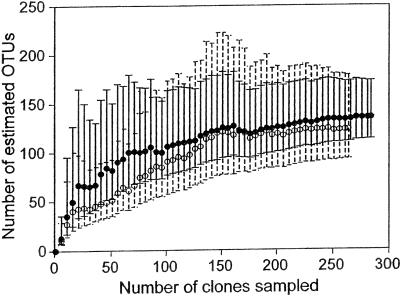
Because the two studies use slightly different definitions of an OTU, the data for the mouth and gut bacteria are not entirely comparable. Their contrast does demonstrate the application of these approaches, however. After an initial increase, the mean Chao1 estimate for both communities is relatively level as sample size increases, and therefore we can compare the estimates at the highest sample size for each community (Fig. 4). We used a log transformation to calculate the confidence intervals (CIs) because the distribution of estimates is not normal (8). Given the OTU definitions, total richness of the mouth and gut bacterial communities is not significantly different, as estimated by Chao1. Chao1 estimates that the mouth community has 123 OTUs (95% CIs, 93 and 180), and the gut community has 135 OTUs (95% CIs, 110 and 170).
FIG. 4.
Chaol estimates of human mouth (○) and gut (●) bacterial richness as a function of sample size. Error bars are 95% CIs and were calculated with the variance formula derived by Chao (8). The dashed lines are error bars for the mouth. The solid lines are error bars for the gut.
What do the CIs say about the Chao1 estimate? The CIs estimate the precision of the richness estimates. In other words, 95% of new samples of 264 clones from the same person's mouth are predicted to yield Chao1 estimates that fall within this range. Because the CIs overlap, one cannot reject the null hypothesis at the significance level of 0.05 that there is no difference between the richness of the mouth and gut communities. The CIs do not address how close the estimates are to the true total richness (i.e., bias) or whether these samples are representative of other people's mouths or guts.
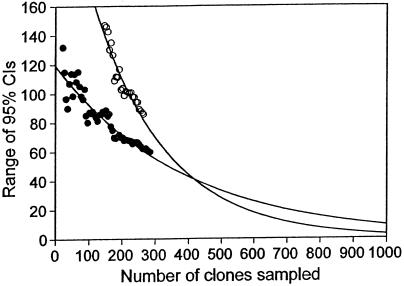
Another question is how much more sampling is needed to detect a significant difference between two estimates, which in this case differ by only 12 OTUs. The range of the CIs initially increases with sample size, peaks, and then decreases exponentially. To obtain a rough idea of how much further sampling would be needed to detect a statistically significant difference, we estimated the size of the CIs for larger samples by extrapolating from the decreasing portion of these curves. Negative exponential curves for both the mouth [f(x) = 270e−0.0046x] and gut [f(x) = 120e−0.0026x] data fit well (r2 = 0.90 and r2 = 0.87, respectively). From these curves, it appears that a sample of about 1,000 clones (four times the original number) would be needed to detect a significant difference between these communities (Fig. 5).
FIG. 5.
Average size of the 95% CIs of Chaol estimates for bacteria in the human mouth (○) and gut (●) as sample size increases. These CIs are the same as in Fig. 4, but only the decreasing portions of the CIs are plotted. The curves are fitted negative exponential curves [mouth, f(x) = 270e−0.0046x, r2 = 0.90; gut, f(x) = 120e−0.0026x, r2 = 0.87].
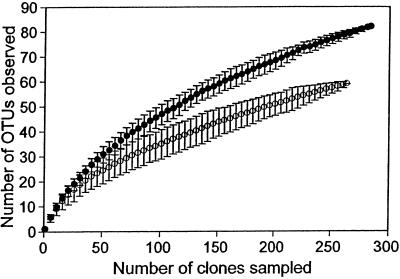
Rarefaction curves yield the same pattern of relative diversity as Chao1; significantly more OTUs are observed in the gut sample than the mouth sample (Fig. 6). At the highest shared sample size (264 clones), 79 OTUs are observed in the gut versus 59 OTUs in the mouth, and the 95% CIs do not overlap. As discussed in the previous section, however, rarefaction curves do not address the precision of the observed species richness. Thus, although the rarefaction curves suggest that the gut community is more diverse than the mouth community, we cannot address the statistical significance of this evidence with rarefaction curves.
FIG. 6.
Rarefaction curves of observed OTU richness in human mouth (○) and gut (●) bacterial samples. The error bars are 95% CIs and were calculated from the variance of the number of OTUs drawn in 100 randomizations at each sample size.
Aquatic mesocosms.
Bohannan and Leibold (unpublished data) sampled bacterial diversity from three outdoor aquatic mesocosms designed to mimic small ponds. The mesocosms varied along a gradient of increasing primary productivity and decreasing eukaryotic algal diversity, and all received the same inoculum. DNA was extracted from samples from each mesocosm, and a region of 16S rDNA was PCR amplified with Bacteria-specific primers, the amplicons were cloned, and the clones were sequenced. The sequences were grouped into OTUs using a definition of 95% similarity.
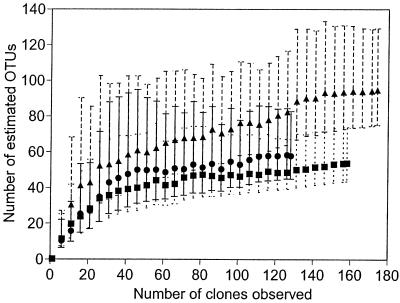
Bohannan and Leibold sequenced 158, 128, and 174 clones from the low-, intermediate-, and high-productivity mesocosms, respectively. The Chao1 estimates suggest that OTU richness varies positively with productivity. The lowest productivity pond contained 54 OTUs (95% CIs, 42 and 80), the intermediate pond contained 58 OTUs (43 and 90), and the high-productivity pond contained an estimated 95 OTUs (73 and 140). The richness of the high- and low-productivity ponds is significantly different at the 0.10 level (Fig. 7). Furthermore, the Chao1 estimates for the high-productivity pond have not yet stabilized (Fig. 7), suggesting that further sampling will result in a greater difference in richness between the ponds with low and high productivity.
FIG. 7.
Chaol estimates of bacterial OTU richness in low- (■), intermediate- (●), and high- (▴) productivity ponds. Error bars are 90% CIs and were calculated with the variance formula derived by Chao (8). The dotted, solid, and dashed bars are error bars for the low-, intermediate-, and high-productivity mesocosms, respectively.
Scottish soil.
The most diverse data set that we analyzed is for terrestrial soil. McCaig et al. (39) collected soil samples from two grazed grasslands, allowing us to make a direct comparison of microbial diversity between these two habitats. One grassland was previously reseeded and fertilized (improved), and the other was not (unimproved). As in the studies described above, bacterial 16S rDNA was PCR amplified and cloned.
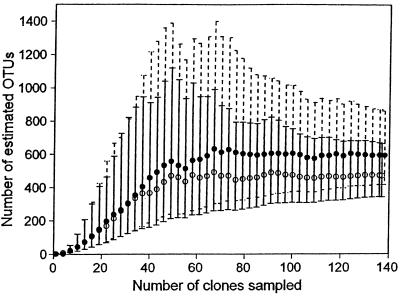
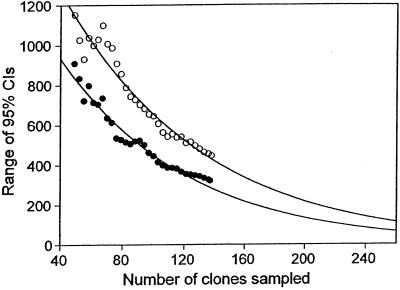
McCaig et al. sequenced 137 clones from the improved soil and 138 clones from the unimproved soil. By their OTU definition of <3% sequence difference, they identified 113 OTUs in the improved habitat and 117 in the unimproved habitat. The Chao1 estimates level off in both habitats at about 70 clones. Bacterial richness appears to be higher in the unimproved habitat (590 OTUs) than in the improved habitat (467 OTU), but the difference is not significant (Fig. 8). As before, we can approximate how much further sampling is needed to detect a significant difference by extrapolating the range of the CIs at larger sample sizes. Negative exponential curves fit very well for the improved [f(x) = 1,500e−0.012x, r2 = 0.96] and unimproved [f(x) = 2,000e−0.011x, r2 = 0.94] soil samples. Thus, if these estimates remain stable with more sampling, about 250 clones are needed to detect a significant difference at the 0.05 level (Fig. 9).
FIG. 8.
Chaol estimates of bacterial OTU richness in improved (○) and unimproved (●) soil as a function of sample size. Error bars are 95% CIs and were calculated with the variance formula derived by Chao (8). The solid lines are error bars for the improved sample. The dashed lines are error bars for the unimproved sample.
FIG. 9.
Average size of the 95% CIs of Chaol estimates for the improved (○) and unimproved (●) soil as the number of clones sampled increases. These CIs are the same as in Fig. 8, but only the decreasing portions of the CIs are plotted. The curves are fitted negative exponential curves [improved, f(x) = 1,500e−0.012x, r2 = 0.96; unimproved, f(x) = 2,000e−0.011x, R2 = 0.94].
DISCUSSION
Comparisons of accumulation curves and rank-abundance plots demonstrate that some bacterial communities have been sampled as well as some macroorganism communities. Therefore, evaluating microbial diversity with statistical approaches available for macroorganisms seems feasible. We estimated and compared microbial richness in a variety of habitats and found that although the estimators depend on sample size, most of the richness estimates stabilized with the sample sizes available. We also made rough estimates of the sample sizes needed to detect significant differences in diversity between comparable samples.
Of course, these statistical approaches have their limitations. For example, diversity comparisons require clear OTU definitions. Often microbial “species” are defined by a cutoff of percent genetic similarity, leading some authors to charge that microbial diversity studies adopt arbitrary species definitions (62). This problem is not limited to microorganisms, however. In fact, the debate over species definitions in eukaryotic organisms has persisted for decades (16, 18, 37, 38), and some suggest that even in sexual organisms, “the prevalence of the clearly defined species is a myth” (21).
Similarly, most of these approaches require data on the relative frequencies of different OTUs, and many studies have revealed that sampling biases accompany genetic surveys of microbial diversity. For example, the abundances of amplified genes in PCRs may not reflect the relative abundances of template DNA because of differences in primer binding and elongation efficiency (52, 55, 67). Larger organisms differ in their ease of detection as well, and hence samples may not be representative of the species frequencies in a community. For example, butterfly species differ in their attraction to bait traps (29), and bird species' vocalizations are unequally detectable (58).
The fact that most questions about the structure and function of communities require relative comparisons overcomes many of the problems with species definitions and sampling biases. As long as the measurement unit is defined and held constant, diversity can be compared among sites or treatments. Likewise, to minimize the effect of sampling biases, multiple techniques or genes can be employed to increase the robustness of relative comparisons (44).
Further work is needed to investigate the general applicability of these approaches for microbial diversity studies. Ideally, large data sets should be gathered to evaluate better the bias and precision of different nonparametric estimators, such as Chao1 and ACE. The performance of richness estimators should also be measured in terms of their ability to predict the true ordering of richness among samples. Large data sets are also needed to investigate how often microbial accumulation curves cross with additional sampling. If the accumulation curves cross only infrequently, then, in combination with methods such as bootstrapping (20), rarefaction curves may be a valuable way to compare the relative diversity of communities.
Even without exhaustive surveys of microbial communities, computer simulations may provide useful insights. Simulated communities have already been used to compare the bias and precision of some diversity estimators (3, 27, 31, 68, 71). These studies could be extended to examine the ability of different estimators to predict the correct order of richness among samples and the conditions under which rarefaction curves are likely to cross. Of course, simulation studies cannot be used as a substitute for real data, as they require input on realistic species abundance distributions of microbial communities.
Although our discussion has been directed towards data collected from clone libraries, genetic techniques that do not depend on cloning also offer promising opportunities for quickly analyzing community diversity. For instance, denaturing gradient gel electrophoresis (DGGE) patterns of amplified 16s rDNA have been used as estimates of microbial diversity (42, 44). Incidence-based nonparametric estimators (R. Colwell, User's Guide to EstimateS 5 [http://viceroy.eeb.uconn.edu/estimates]), such as the jackknife and bootstrap (60, 70), use presence-absence data and could be used with DGGE data to estimate total richness. Likewise, oligonucleotide probes can be used to detect the presence of a subset of microbial diversity in a sample (28). Once the specific probes have been developed, many samples can be analyzed relatively quickly, and incidence estimators could be adapted to extrapolate these patterns to the entire community.
In conclusion, while microbiologists should be cautious about sampling biases and use clear OTU definitions, our results suggest that comparisons among estimates of microbial diversity are possible. Nonparametric estimators show particular promise for microbial data and in some habitats may require sample sizes of only 200 to 1,000 clones to detect richness differences of only tens of species. While daunting less than a decade ago, sequencing this number of clones is reasonable with the development of high-throughput sequencing technology. Augmenting this new technology with statistical approaches borrowed from “macrobial” biologists offers a powerful means to study the ecology and evolution of microbial diversity in natural environments.
ACKNOWLEDGMENTS
We thank Ian Kroes, Paul Lepp, and David Relman; Allison McCaig, Jim Prosser, and the Scottish Executive Rural Affairs Department; and Antonia Suau, Joël Doré, and coworkers for sharing unpublished data. We also thank Robert Colwell, Craig Criddle, Gregory Gilbert, and Aaron Hirsh for comments on earlier drafts and Mark Tanaka, Lauren Ancel, and Michael Lachmann for useful discussions. B.B. is especially grateful to Dan Janzen and the supporters of the NSF/CRUSA workshop on microbial biocomplexity, at which the idea for this paper originated.
This work was supported by a National Science Foundation award (DEB-9907797) to B.B.
REFERENCES
- 1.Achenbach L A, Coates J D. Disparity between bacterial phylogeny and physiology. ASM News. 2000;66:714–715. [Google Scholar]
- 2.Amann R I, Ludwig W, Schleifer K-H. Phylogenetic identification and in situ detection of individual microbial cells without cultivation. Microbiol Rev. 1995;59:143–169. doi: 10.1128/mr.59.1.143-169.1995. [DOI] [PMC free article] [PubMed] [Google Scholar]
- 3.Baltanas A. On the use of some methods for the estimation of species richness. Oikos. 1992;65:484–492. [Google Scholar]
- 4.Bills G F, Polishook J D. Abundance and diversity of microfungi in leaf-litter of a lowland rain-forest in Costa Rica. Mycologia. 1994;86:187–198. [Google Scholar]
- 5.Borneman J, Skroch P W, O'Sullivan K M, Palus J A, Rumjanek N G, Jansen J L, Nienhuis J, Triplett E W. Molecular microbial diversity of an agricultural soil in Wisconsin. Appl Environ Microbiol. 1996;62:1935–1943. doi: 10.1128/aem.62.6.1935-1943.1996. [DOI] [PMC free article] [PubMed] [Google Scholar]
- 6.Borneman J, Triplett E W. Molecular microbial diversity in soils from Eastern Amazonia: evidence for unusual microorganisms and microbial population shifts associated with deforestation. Appl Environ Microbiol. 1997;63:2647–2653. doi: 10.1128/aem.63.7.2647-2653.1997. [DOI] [PMC free article] [PubMed] [Google Scholar]
- 7.Bulmer M G. On fitting the Poisson lognormal distribution to species abundance data. Biometrics. 1974;30:101–110. [Google Scholar]
- 8.Chao A. Estimating the population size for capture-recapture data with unequal catchability. Biometrics. 1987;43:783–791. [PubMed] [Google Scholar]
- 9.Chao A. Non-parametric estimation of the number of classes in a population. Scand J Stat. 1984;11:265–270. [Google Scholar]
- 10.Chao A, Lee S-M. Estimating the number of classes via sample coverage. J Am Stat Assoc. 1992;87:210–217. [Google Scholar]
- 11.Chao A, Ma M-C, Yang M C K. Stopping rules and estimation for recapture debugging with unequal failure rates. Biometrics. 1993;43:783–791. [Google Scholar]
- 12.Chazdon R L, Colwell R K, Denslow J S, Guariguata M R. Statistical methods for estimating species richness of woody regeneration in primary and secondary rain forests of northeastern Costa Rica. In: Dallmeier F, Comiskey J A, editors. Forest biodiversity reseach, monitoring, and modeling: conceptual background and old World case studies. Paris, France: Parthenon; 1998. pp. 285–309. [Google Scholar]
- 13.Clench H. How to make regional lists of butterflies: Some thoughts. J Lepid Soc. 1979;33:216–231. [Google Scholar]
- 14.Colwell R K, Coddington J A. Estimating terrestrial biodiversity through extrapolation. Phil Trans R Soc London B. 1994;345:101–118. doi: 10.1098/rstb.1994.0091. [DOI] [PubMed] [Google Scholar]
- 15.Condit R, Hubbell S P, Lafrankie J V, Sukumar R, Manokaran N, Foster R B, Asthon P S. Species-area and species-individual relationships for tropical trees: a comparison of three 50-ha plots. J Ecol. 1996;84:549–562. [Google Scholar]
- 16.Coyne J A, Orr H A, Futuyma D J. Do we need a new species concept? Syst Zool. 1988;37:190–200. [Google Scholar]
- 17.DeVries P J, Murray D, Lande R. Species diversity in vertical, horizontal, and temporal dimensions of a fruit-feeding butterfly community in an Ecuadorian rainforest. Biol J Linnean Soc. 1997;62:343–364. [Google Scholar]
- 18.Dobzhansky T. A critique of the species concept in biology. Phil Sci. 1935;2:344–355. [Google Scholar]
- 19.Dunbar J, Takala S, Barnes S M, Davis J A, Kuske C R. Levels of bacterial community diversity in four arid soils compared by cultivation and 16S rRNA gene cloning. Appl Environ Microbiol. 1999;65:1662–1669. doi: 10.1128/aem.65.4.1662-1669.1999. [DOI] [PMC free article] [PubMed] [Google Scholar]
- 20.Efron B, Tibshirani R. An introduction to the bootstrap. New York, N.Y: Chapman & Hall; 1993. [Google Scholar]
- 21.Ehrlich P R. Has the biological species concept outlived its usefulness? Syst Zool. 1961;10:167–176. [Google Scholar]
- 22.Erwin T L. Tropical forests: their richness in Coleoptera and other arthropod species. Coleopt Bull. 1982;36:74–82. [Google Scholar]
- 23.Gaston K J. Species richness: measure and measurement. In: Gaston K J, editor. Biodiversity: a biology of numbers and difference. Cambridge, England: Blackwell; 1996. pp. 77–113. [Google Scholar]
- 24.Harte J, Kinzig A, Green J. Self-similarity in the distribution and abundance of species. Science. 1999;284:334–336. doi: 10.1126/science.284.5412.334. [DOI] [PubMed] [Google Scholar]
- 25.Heck K L, Belle G v, Simberloff D. Explicit calculation of the rarefaction diversity measurement and the determination of sufficient sample size. Ecology. 1975;56:1459–1461. [Google Scholar]
- 26.Hellmann J J, Fowler G W. Bias, precision, and accuracy of four measures of species richness. Ecol Appl. 1999;9:824–834. [Google Scholar]
- 27.Heltshe J F, Forrester N E. Estimating species richness using the jackknife procedure. Biometrics. 1983;39:1–11. [PubMed] [Google Scholar]
- 28.Heuer H, Hartung K, Wieland G, Kramer I, Smalla K. Polynicleotide probes that target a hypervariable region of 16S rRNA genes to identify bacterial isolates corresponding to bands of community fingerprints. Appl Environ Microbiol. 1999;65:1045–1049. doi: 10.1128/aem.65.3.1045-1049.1999. [DOI] [PMC free article] [PubMed] [Google Scholar]
- 29.Hughes J B, Daily G C, Ehrlich P R. Use of fruit bait traps for monitoring of butterflies (Lepidoptera: Nymphalidae) Rev Biol Trop. 1998;46:697–704. [Google Scholar]
- 30.Hughes R G. Theories and models of species abundance. Am Nat. 1986;128:897–899. [Google Scholar]
- 31.Keating K A, Quinn J F, Ivie M A, Ivie L L. Estimating the effectiveness of further sampling in species inventories. Ecol Appl. 1998;8:1239–1249. [Google Scholar]
- 32.Krebs C J. Ecological methodology. New York, N.Y: Harper and Row; 1989. [Google Scholar]
- 33.Kroes I, Lepp P W, Relman D A. Bacterial diversity within the human subgingival crevice. Proc Natl Acad Sci USA. 1999;96:14547–14552. doi: 10.1073/pnas.96.25.14547. [DOI] [PMC free article] [PubMed] [Google Scholar]
- 34.Lande R, DeVries P J, Walla T R. When species accumulation curves intersect: implications for ranking diversity using small samples. Oikos. 2000;89:601–605. [Google Scholar]
- 35.Liu W T, Marsh T L, CHeng H, Forney L J. Characterization of microbial diversity by determining terminal restriction fragment length polymorphisms of genes encoding 16S rRNA. Appl Environ Microbiol. 1997;63:4516–4522. doi: 10.1128/aem.63.11.4516-4522.1997. [DOI] [PMC free article] [PubMed] [Google Scholar]
- 36.Magurran A E. Ecological diversity and its measurement. Princeton, N.J: Princeton University; 1995. [Google Scholar]
- 37.Masters J C, Spencer H G. Why we need a new genetic species concept. Syst Zool. 1989;30:270–279. [Google Scholar]
- 38.Mayr E. Systematics and the origin of species. New York, N.Y: Columbia University Press; 1940. [Google Scholar]
- 39.McCaig A E, Glover L, Prosser J I. Molecular analysis of bacterial community structure and diversity in unimproved and improved upland grass pastures. Appl Environ Microbiol. 1999;65:1721–1730. doi: 10.1128/aem.65.4.1721-1730.1999. [DOI] [PMC free article] [PubMed] [Google Scholar]
- 40.Moyer C L, Tiedje J M, Dobbs F C, Karl D M. Diversity of deep-sea hydrothermal vent Archaea from Loihi Seamount, Hawaii. Deep-Sea Res II. 1998;45:303–317. [Google Scholar]
- 41.Mullins T D, Britschgi T B, Krest R L, Giovannoni S J. Genetic comparisons reveal the same unknown bacterial lineages in Atlantic and Pacific bacterioplankton communities. Limnol Oceanogr. 1995;40:148–158. [Google Scholar]
- 42.Muyzer G. DGGE/TGGE a method for identifying genes from natural ecosystems. Curr Opin Microbiol. 1999;2:317–322. doi: 10.1016/S1369-5274(99)80055-1. [DOI] [PubMed] [Google Scholar]
- 43.Nübel U, Garcia-Pichel F, Kühl M, Muyzer G. Spatial scale and the diversity of benthic cyanobacteria and diatoms in a salina. Hydrobiologia. 1999;401:199–206. [Google Scholar]
- 44.Nübel U, Gracia-Pichel F, Kuhl M, Muyzer G. Quantifying microbial diversity: morphotypes, 16S rRNA genes, and carotenoids of oxygenic phototrophs in microbial mats. App Environ Microbiol. 1999;65:422–430. doi: 10.1128/aem.65.2.422-430.1999. [DOI] [PMC free article] [PubMed] [Google Scholar]
- 45.Nusslein K, Tiedje J M. Characterization of the dominant and rare members of a young Hawaiian soil bacterial community with small-subunit ribosomal DNA amplified from DNA fractionated on the basis of its guanine and cytosine composition. Appl Environ Microbiol. 1998;64:1283–1289. doi: 10.1128/aem.64.4.1283-1289.1998. [DOI] [PMC free article] [PubMed] [Google Scholar]
- 46.Pace N R, Stahl D A, Lane D J, Olsen G J. The analysis of natural microbial populations by ribosomal RNA sequences. Adv Microb Ecol. 1986;9:1–55. [Google Scholar]
- 47.Palmer M W. The estimation of species richness by extrapolation. Ecology. 1990;71:1195–1198. [Google Scholar]
- 48.Pielou E C. Ecological diversity. New York, N.Y: Wiley; 1975. [Google Scholar]
- 49.Preston F W. The commonness, and rarity, of species. Ecology. 1948;29:254–283. [Google Scholar]
- 50.Price P W. Insect ecology. New York, N.Y: Wiley; 1975. [Google Scholar]
- 51.Raaijmakers J G W. Biometrics 43:793–803. 1987. Statistical analysis of the Michaelis-Menten equation. [PubMed] [Google Scholar]
- 52.Raeymaekers L. A commentary on the practical applications of quantitative PCR. Genome Res. 1995;5:91–94. doi: 10.1101/gr.5.1.91. [DOI] [PubMed] [Google Scholar]
- 53.Rappé M S, Kemp P F, Giovannoni S J. Phylogenetic diversity of marine coastal picoplankton 16S rRNA genes cloned from the continental shelf off Cape Hatteras, North Carolina. Limnol Oceanogr. 1997;42:811–826. [Google Scholar]
- 54.Raven P H. The challenge of tropical biology. Bull ESA. 1983;Spring:4–12. [Google Scholar]
- 55.Reysenbach A-L, Giver L J, Wickham G S, Pace N R. Differential amplification of rRNA genes by polymerase chain reaction. Appl Environ Microbiol. 1992;58:3417–3418. doi: 10.1128/aem.58.10.3417-3418.1992. [DOI] [PMC free article] [PubMed] [Google Scholar]
- 56.Ricketts T H, Daily G C, Ehrlich P R, Fay J P. Countryside biogeography of moths in native and human-dominated habitats. Conserv Biol. 2001;15:378–388. [Google Scholar]
- 57.Samways M J. Insect conservation biology. London, England: Chapman & Hall; 1994. [Google Scholar]
- 58.Schieck J. Biased detection of bird vocalizations affects comparisons of bird abundance among forested habitats. Condor. 1997;99:179–190. [Google Scholar]
- 59.Seber G A F. The estimation of animal abundance and related parameters. London, England: Griffin; 1973. [Google Scholar]
- 60.Smith E P, Van Belle G. Nonparametric estimation of species richness. Biometrics. 1984;40:119–129. [Google Scholar]
- 61.Soberón J, Llorente J. The use of species accumulation functions for the prediction of species richness. Conserv Biol. 1993;7:480–488. [Google Scholar]
- 62.Staley J T. Biodiversity: are microbial species threatened? Curr Opin Biotechnol. 1997;8:340–345. doi: 10.1016/s0958-1669(97)80014-6. [DOI] [PubMed] [Google Scholar]
- 63.Stork N E, Adis J, Didham R K. Canopy arthropods. London, England: Chapman & Hall; 1997. [Google Scholar]
- 64.Strong D R, Lawton J H, Southwood R. Insects on plants: community patterns and mechanisms. Cambridge, Mass: Harvard University Press; 1984. [Google Scholar]
- 65.Suau A, Bonnet R, Sutren M, Godon J-J, Gibson G, Collins M D, Dore J. Direct analysis of genes encoding 16S rRNA from complex communities reveals many novel molecular species within the human gut. Appl Environ Microbiol. 1999;65:4799–4807. doi: 10.1128/aem.65.11.4799-4807.1999. [DOI] [PMC free article] [PubMed] [Google Scholar]
- 66.Sugihara G. Minimal community structure: an explanation of species abundance patterns. Am Nat. 1980;116:770–787. doi: 10.1086/283669. [DOI] [PubMed] [Google Scholar]
- 67.Suzuki M T, Giovannoni S J. Bias caused by template annealing in the amplification of mixtures of 16S rRNA genes by PCR. Appl Environ Microbiol. 1996;62:625–630. doi: 10.1128/aem.62.2.625-630.1996. [DOI] [PMC free article] [PubMed] [Google Scholar]
- 68.Walther B A, Morand S. Comparative performance of species richness estimation methods. Parasitology. 1998;116:395–405. doi: 10.1017/s0031182097002230. [DOI] [PubMed] [Google Scholar]
- 69.Watve M G, Gangal R M. Problems in measuring bacterial diversity and a possible solution. Appl Environ Microbiol. 1996;62:4299–4301. doi: 10.1128/aem.62.11.4299-4301.1996. [DOI] [PMC free article] [PubMed] [Google Scholar]
- 70.Zahl S. Jackknifing an index of diversity. Ecology. 1977;58:907–913. [Google Scholar]
- 71.Zelmer D A, Esch G W. Robust estimation of parasite component community richness. J Parasitol. 1999;85:592–594. [PubMed] [Google Scholar]


