

Abstract
This study was based on the contemporary proposal that distinct states of consciousness are quantifiable by neural complexity and critical dynamics. To test this hypothesis, it was aimed at comparing the electrophysiological correlates of three meditation conditions using nonlinear techniques from the complexity and criticality framework as well as power spectral density. Thirty participants highly proficient in meditation were measured with 64-channel electroencephalography (EEG) during one session consisting of a task-free baseline resting (eyes closed and eyes open), a reading condition, and three meditation conditions (thoughtless emptiness, presence monitoring, and focused attention). The data were analyzed applying analytical tools from criticality theory (detrended fluctuation analysis, neuronal avalanche analysis), complexity measures (multiscale entropy, Higuchi’s fractal dimension), and power spectral density. Task conditions were contrasted, and effect sizes were compared. Partial least square regression and receiver operating characteristics analysis were applied to determine the discrimination accuracy of each measure. Compared to resting with eyes closed, the meditation categories emptiness and focused attention showed higher values of entropy and fractal dimension. Long-range temporal correlations were declined in all meditation conditions. The critical exponent yielded the lowest values for focused attention and reading. The highest discrimination accuracy was found for the gamma band (0.83–0.98), the global power spectral density (0.78–0.96), and the sample entropy (0.86–0.90). Electrophysiological correlates of distinct meditation states were identified and the relationship between nonlinear complexity, critical brain dynamics, and spectral features was determined. The meditation states could be discriminated with nonlinear measures and quantified by the degree of neuronal complexity, long-range temporal correlations, and power law distributions in neuronal avalanches.
Keywords: complexity, self-organized criticality, meditation, states of consciousness, EEG
Introduction
Consciousness has fascinated humankind since its very beginning and still is a challenge for many researchers all over the world (Seth 2010). Regarding the quest for specifying processes that underpin normal human consciousness, the nonlinear dynamical system approach has brought forward a variety of hypotheses on the relation between dynamics of neural activity and consciousness experiences. Hereby, a contemporary proposal is that states of consciousness are quantifiable by the degree of neural complexity, i.e. the degree to which neurons interact across multiple scales in a neural system (Tononi and Edelman 1998; Sporns et al. 2000; Arsiwalla and Verschure 2018). Multiple new nonlinear time series methods and metrics for capturing the complexity of brain activity arose (Stam 2005). Some of these are applied to multiple time series and aim at capturing simultaneous segregation and integration between the time series (Rosenblum et al. 1996). Others, however, are applicable to single time series such as entropy or fractal dimension measures to quantify statistical similarity at different time scales, the amount of fluctuations and randomness in the signal, as well as fractal properties (Stam 2005; Kesić and Spasić 2016).
In recent years, special attention has been given to the hypothesis that neural dynamics might be governed by the phenomenon of self-organized criticality (SOC). This premise is based on theoretical and experimental work in physics, which has shown that the multiscale dynamics of a complex system can be characterized by the spatial and temporal statistics of avalanches branching through the system. These statistics reveal whether the system is in a fully random or a fully ordered state, or whether it is in a critical state, i.e. in a complex state at the edge between order and disorder (Bak et al. 1987; Cocchi et al. 2017). Critical state dynamics are especially appealing as these were associated with optimized network functions of information processing such as input susceptibility, maximized dynamic range, storage capacity as well as computational power (Shew et al. 2011; Shew and Plenz 2013). Despite substantial critique and controversies against the SOC theory, concerning issues such as unprecise terminology, the lack of evidence for a genuine control parameter, and the overall significance of power laws (Beggs and Timme 2012; Wilting and Priesemann 2019; Destexhe and Touboul 2021), a fair amount of research pointed out signatures of criticality such as a scale-free distribution of neuronal avalanches and the presence of long-range temporal correlations (LRTC) in neuronal oscillations in human EEG, MEG and fMRI data (Linkenkaer-Hansen et al. 2001; Tagliazucchi et al. 2012; Shriki et al. 2013). Thus, critical dynamics were proposed as general gauges of information processing and features of healthy brain dynamics (Massobrio et al. 2015; Zimmern 2020; Fekete et al. 2021). Also, longstanding theories of consciousness such as the Integrated Information Theory developed by Giulio Tononi were associated with criticality (Tononi 2004; Popiel et al. 2020). A few studies demonstrated an explicit relationship between criticality and the amount of integrated information (Φ) (Kim and Lee 2019; Popiel et al. 2020). Interestingly, it was suggested that critical dynamics maximize Φ (Tagliazucchi 2017).
Thus, the framework of criticality and complexity seems promising for capturing signatures of distinct states of consciousness based on electrophysiological data. Interestingly, such metrices could be suitable to characterize the optimal brain state in terms of maximized information processing functions, which might correspond to altered states of consciousness as described in the field of transpersonal psychology (Vaitl et al. 2005; Garcia‐Romeu and Tart 2013). Here, among others, one specific induction method depicts the practice of meditation, which has been shown to increase the depth of information processing and enhance allocation of attentional resources (Slagter et al. 2007; van Leeuwen et al. 2012).
Whereas some studies provided first insights regarding neuronal complexity during meditation (Deolindo et al. 2020), findings on the relation between critical dynamics and meditation are scarce (Irrmischer et al. 2018; Dürschmid et al. 2020). So far only the meditation category ‘focused attention’ was considered (Travis and Shear 2010). In addition, the spectrum of measures proposed as consciousness indices is broad and multiple nonlinear approaches exist to extract complexity features from neurophysiological signals (Stam 2005; Arsiwalla and Verschure 2018; Sarasso et al. 2021). Further, even though the importance of applying a combination of nonlinear methods was highlighted, most of the studies investigating states of consciousness as a function of neural complexity only considered one or two measures (Burns and Rajan 2015).
Therefore, the aim of this study was 2-fold: (i) to characterize the electrophysiological correlates related to altered states of consciousness using different nonlinear techniques based on the criticality and complexity framework, respectively and (ii) to compare the discriminability of conditions using nonlinear methods to the standard method using spectral decomposition. For this purpose, highly experienced participants engaged in three meditation practices, namely ‘presence monitoring’, ‘thoughtless emptiness’, and ‘focused attention’ according to classification categories established by Travis and Shear (Travis and Shear 2010). A task-free resting state with opened and closed eyes as well as a reading condition served as control. To reveal differences between the states, the EEG data were analyzed by applying analytical tools from criticality theory [detrended fluctuation analysis (DFA), neuronal avalanche analysis], complexity measures [multiscale entropy (MSE) and Higuchi’s fractal dimension (HFD)] as well as power spectral density (PSD).
Materials and methods
Data acquisition and participants
An EEG data set has been collected from 30 participants (mean age 47 years, 11 females/19 males) with a meditation experience of at least 5 years of practice or more than 1000 h of total meditation time. On average, participants had meditated for 20 years and 6498 h (Hinterberger et al. 2014). The session consisted of three different tasks. It started with an initial baseline recording comprising a resting state with eyes open (5 min), a resting state with eyes closed (5 min), and reading a neutral text (5 min). This was followed by three specific meditative tasks for a duration of 2 min each during which participants kept their eyes closed:
Presence monitoring (instruction: ‘Try to be in a state of high presence at the place you are in this room at each moment of time.’)
Thoughtless emptiness (instruction: ‘Try to maintain the state of emptiness from all thought as well as possible.’)
Focused attention (instruction: ‘Direct your attention on a spot in the middle of the forehead above your eyes.’)
Events, feelings, emotions, thoughts, and properties of the session were summarized in a written report after the sessions (Hinterberger et al. 2014).
Data processing
Matlab (MathWorks, Natrick, USA) was used for data processing. A schematic overview of the analysis process is given in Fig. 1. Data was sampled at 250 samples/sec in a range from DC to 70 Hz with a notch filter at 50 Hz. After detrending the 64 EEG channels a correction for eye movement was done using a linear correction algorithm (Hinterberger et al. 2003).
Figure 1.
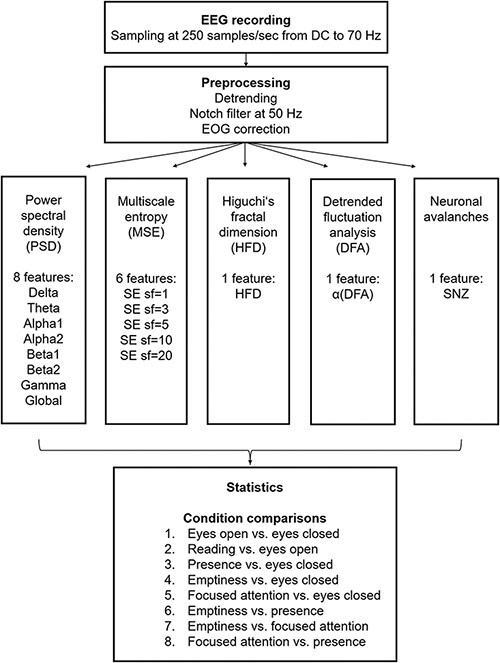
Scheme of the analysis workflow. SE = sample entropy, sf = scale factor
Power spectral density (PSD)
A power spectrum time series was calculated using the Fast Fourier Transform (FFT) for the following frequency bands: Delta: 1–3.5 Hz, theta: 4–7.5 Hz, alpha 1: 8–10 Hz, alpha 2: 10.5–12 Hz, beta 1: 12.5–15 Hz, beta 2: 15.5–25 Hz, gamma: 25.5–45 Hz, global: 1–45 Hz. To obtain a measure of the PSD FFT values were squared and all FFT bins within a frequency band range were averaged. EEG PSD was calculated for each participant, condition, electrode, and frequency band.
Fractal dimension (HFD)
Fractal dimension was calculated using Higuchi’s algorithm (Higuchi 1988). The algorithm constructs  new time series for
  from a starting time
series of
from a starting time
series of  samples (
 ):
):
 |
(1) |
where  indicates the initial time sample and
 denotes the time interval. The average
length
denotes the time interval. The average
length  of each of the time
series
of each of the time
series  is computed as follows:
 |
(2) |
where  indicates the total length of the
original data series.
indicates the total length of the
original data series.  is a normalization factor.
The calculation is repeated for  ranging from 1 to
 ., resulting in a sum of average
lengths
., resulting in a sum of average
lengths  :
:
 |
(3) |
A fractal curve follows the relationship:
 |
(4) |
Hence, when plotting  against
  ,
HFD can be estimated as the slope using a least squares linear best-fitting procedure:
,
HFD can be estimated as the slope using a least squares linear best-fitting procedure:
 |
(5) |
where  depicts the number of
  values and
Numerical values of HFD have the lower and upper limits of 1 and 2, respectively.
Considering a curve that represents the amplitude of a given time series signal as a
function of time on a 2D plane, a simple curve has a dimension equal to 1 and a plane
has a dimension equal to 2. HFD can be imaged as a measure of the ‘degree of filling
out’ the plane by the curve and hence, its complexity (Klonowski 2007). Accordingly, HFD close to one would represent a smooth curve
with low complexity, whereas HFD = 2 would correspond to a complex curve, such as white
noise practically filling 100% of the plane. Important to note, HFD gives no information
of the system’s nature generating the signal, e.g. it is not determinable whether the
system behaves deterministic, chaotic, or stochastic. Instead, HFD depicts a tool to
demonstrate relative changes in the signals’ complexity, for instance, before and after
an intervention (Klonowski 2007). The value of
 , the maximum number of
subseries composed from the original, was determined by examining the data and plotting
the fractal dimension over a range of k. For k greater
than
, the maximum number of
subseries composed from the original, was determined by examining the data and plotting
the fractal dimension over a range of k. For k greater
than  the fractal dimension reaches a
saturation point (Kesić and Spasić 2016). In this
work that was the case for
the fractal dimension reaches a
saturation point (Kesić and Spasić 2016). In this
work that was the case for  = 5.
= 5.
Neuronal avalanches
For the neuronal avalanche analysis, the Neural Complexity and Criticality (NCC)
toolbox was used (Marshall et al.
2016). First, the signal from each electrode was z-scored. A
threshold of ±1.5 SD was applied (Shriki
et al. 2013). Negative and positive excursions beyond the
threshold were identified as concrete events. The time series obtained from each
electrode was discretized with time bins of the duration Δt = 5s. Neuronal avalanches
were defined as a contiguous sequence of time bins of activity preceded, ending with at
least one time bin of quiescence. Avalanche properties such as duration  (number of active time bins), the size
 (total number of events), and the shape
(number of events at each time at each time bin) were determined using the build-in
function sizegivdurwls.m. A hallmark that a neural network operates
near a critical point is given by a power law scaling of avalanche size distribution
(
(total number of events), and the shape
(number of events at each time at each time bin) were determined using the build-in
function sizegivdurwls.m. A hallmark that a neural network operates
near a critical point is given by a power law scaling of avalanche size distribution
( ), duration distribution
(
), duration distribution
( ), and average size conditioned
on given duration data (
), and average size conditioned
on given duration data ( ) (Friedman et al. 2012; Timme et al. 2016):
 |
(6) |
 |
(7) |
 |
(8) |
 |
(9) |
The scaling parameter  and its standard
deviation were calculated using the weighted least squares method.
and its standard
deviation were calculated using the weighted least squares method.
Multiscale entropy (MSE)
For the computation of the MSE analysis, the algorithm described by Costa and
colleagues (2005) was used (Costa
et al. 2005). Given a one-dimensional discrete time series
 of length, the analysis is based on the construction of a coarse-grained time series
 ,
determined by the scale factor
,
determined by the scale factor  , which specifies the
number of data points averaged within nonoverlapping windows of length
, which specifies the
number of data points averaged within nonoverlapping windows of length  .
.
 |
Thus, for sf = 1, the time series  is the
original time series. The length of each coarse-grained time series is equal to the
original time series divided by the scale factor
is the
original time series. The length of each coarse-grained time series is equal to the
original time series divided by the scale factor  (Costa et al. 2005).
Subsequently, the sample entropy for each coarse-grained time series is calculated according to equation 10:
 |
(10) |
where  = data points of the time series
 ,
and
,
and  = length of the vector sequences

 .
depicts the tolerated distance level, a percentage of the standard deviation serving as
a similarity criterion.
.
depicts the tolerated distance level, a percentage of the standard deviation serving as
a similarity criterion.  defines the probability
that other vectors are similar to vector
defines the probability
that other vectors are similar to vector  matching for
 points, i.e. the number of vectors
satisfying
points, i.e. the number of vectors
satisfying  ,
where
,
where  is the Euclidean distance and thus,
that any two vectors are within
is the Euclidean distance and thus,
that any two vectors are within  of each other:
 |
(11) |
For the template length  a value of 2 was
chosen and the similarity criteria
a value of 2 was
chosen and the similarity criteria  was
set to 0.2. MSE was calculated for six different time scales (1, 3, 5, 7, 10, and 20)
over 5-s time windows. Thus, this analysis resulted in six parameters termed SE sf = 1,
SE sf = 3, SE sf = 5, SE sf = 7, SE sf = 10, and SE sf = 20.
was
set to 0.2. MSE was calculated for six different time scales (1, 3, 5, 7, 10, and 20)
over 5-s time windows. Thus, this analysis resulted in six parameters termed SE sf = 1,
SE sf = 3, SE sf = 5, SE sf = 7, SE sf = 10, and SE sf = 20.
Detrended fluctuation analysis (DFA)
For the computation of the DFA an algorithm described by Colombo and colleagues (2016) was used (Colombo et al. 2016). The parameter α represents fluctuations of the signal at different time scales determining the statistical self-affinity of a signal (Hardstone et al. 2012):
 |
(12) |
where  and
and  are values of a
1-dimensional process at time windows of length
are values of a
1-dimensional process at time windows of length  and
t, respectively. L depicts the window length factor
and H denotes the Hurst parameter, a dimensionless estimator of
self-affinity. First, the cumulative sum of the time series
and
t, respectively. L depicts the window length factor
and H denotes the Hurst parameter, a dimensionless estimator of
self-affinity. First, the cumulative sum of the time series  was calculated:
 |
(13) |
where  is the mean of the time
series. Then, the signal profile was divided into a set of nonoverlapping separate time
boxes of length Δ
is the mean of the time
series. Then, the signal profile was divided into a set of nonoverlapping separate time
boxes of length Δ . Subsequently, in
each segmentation the data was locally fit to a polynomial
. Subsequently, in
each segmentation the data was locally fit to a polynomial  . The
local polynomial trends fit within each box were subtracted and the root-mean-square of
the residuals
. The
local polynomial trends fit within each box were subtracted and the root-mean-square of
the residuals  (‘fluctuations’) was calculated:
 |
(14) |
The detrend order, specifying the degree of polynomials was set to 2. The local detrending was repeated for 50 automatically determined box sizes. The mean fluctuation per window size was plotted against the window size on a logarithmic scale. The scaling exponent α was estimated as the slope of the least squares fit line The resulting DFA exponent α can be interpreted as an estimation of the Hurst parameter. If 0< α< 0.5, the process is of stationary nature, exhibits anticorrelations and has a memory. In the case of 0.5< α< 1, the process is stationary, exhibits positive correlations and has a memory. A random process with no memory is governed by α= 0.5, whereas when 1< α< 2, then the process is nonstationary, meaning that the signal’s statistical characteristics change with time. Stationary processes can be modeled as fractional Gaussian noise with H = α and nonstationary processes can be modeled as fractional Brownian motion with H= α −1 (Hardstone et al. 2012).
Comparison between conditions
The following eight comparisons were calculated. First, the baseline conditions were compared. Second, the three different meditation states were contrasted against resting with eyes closed. Third, the meditation conditions were compared against each other.
Eyes open vs. eyes closed
Reading vs. eyes open
Presence vs. eyes closed
Emptiness vs. eyes closed
Focused attention vs. eyes closed
Emptiness vs. presence
Emptiness vs. focused attention
Focused attention vs. presence
Statistics
First, to determine whether the resulting features are significantly influenced by the task conditions, a Kruskal–Wallis test was calculated for the temporal means of each feature averaged over electrodes, participants, and conditions. For a comparison between states, effect sizes of the temporal mean of each feature for the respective condition were calculated for each electrode defined as standardized mean differences (Cohen’s d) (Cohen 2013). Effect sizes of all participants were submitted to a paired two-tailed t-test calculated across participants and features. Considering 17 extracted EEG features and 8 comparisons, this results in 153 variables (Fig. 1). These were corrected for multiple comparisons using false discovery rate (FDR) adjustment, which gives the proportion of false discoveries among all discoveries (Benjamini and Hochberg 1995). FDR was applied across conditions and features. Significance was set at P < 0.05.
To calculate correlations between the features, Spearman’s rank correlation was applied after determining that the distribution was not appropriate for parametric testing by the Shapiro–Wilk test. Correlations were calculated from the median of the time series across participants after averaging over channels for each condition, respectively.
To analyze the discrimination performance, partial least squares regression (PLS) was
performed for each feature, comparisons, and participant. PLS regression allows modeling
and predicting multiple response variables  (mean-centered
 matrix) from explanatory variables
(mean-centered
matrix) from explanatory variables
(mean-centered  matrix). The
concept is similar to the Principal Component Analysis (PCA). However, instead of
choosing components with a maximum variance of
matrix). The
concept is similar to the Principal Component Analysis (PCA). However, instead of
choosing components with a maximum variance of  , PLS creates components
(orthogonal score vectors) by maximizing the covariance between different sets of
variables (Rosipal and Krämer 2006). Hence, PLS
components describe maximum correlations between predictor and response variables.
Several variants of PLS exist such as the nonlinear iterative partial least squares
(NIPALS) approach, PLS1, PLS2, and the Kernel Algorithm (Höskuldsson 1988; Alin 2009). Here, the
straightforward implementation of a statistically inspired modification of the PLS
method (SIMPLS) algorithm was used. This approach was introduced by De Jong (1993) to
avoid deflation of the centered matrices and
, PLS creates components
(orthogonal score vectors) by maximizing the covariance between different sets of
variables (Rosipal and Krämer 2006). Hence, PLS
components describe maximum correlations between predictor and response variables.
Several variants of PLS exist such as the nonlinear iterative partial least squares
(NIPALS) approach, PLS1, PLS2, and the Kernel Algorithm (Höskuldsson 1988; Alin 2009). Here, the
straightforward implementation of a statistically inspired modification of the PLS
method (SIMPLS) algorithm was used. This approach was introduced by De Jong (1993) to
avoid deflation of the centered matrices and  , and instead, execute
deflation in a covariance matrix. To note, SIMPLS is equal to the PLS1 but has been
shown to differ from PLS2 when applied to the multidimensional matrix
, and instead, execute
deflation in a covariance matrix. To note, SIMPLS is equal to the PLS1 but has been
shown to differ from PLS2 when applied to the multidimensional matrix  (de Jong 1993).
Here, the ( ) matrix of zero-mean predictor
variables
) matrix of zero-mean predictor
variables  and the
  matrix zero-mean
response variables
matrix zero-mean
response variables  are
decomposed into:
are
decomposed into:
 |
(15) |
 |
(16) |
where
 ,
, ,
, and
and  ,
, ,
, are matrices of the
extracted score vectors (components), P and Q are orthogonal loading matrices and E, F
represent matrices of residuals, e.g. error terms, for
are matrices of the
extracted score vectors (components), P and Q are orthogonal loading matrices and E, F
represent matrices of residuals, e.g. error terms, for  and
and  , respectively (Rosipal and Krämer 2006). The SIMPLS approach allows
directly finding the weight vectors
, respectively (Rosipal and Krämer 2006). The SIMPLS approach allows
directly finding the weight vectors  ,
such that the sample covariance between the vector scores
,
such that the sample covariance between the vector scores  and
and  ,
,  is maximized (Zahariah et al.
2021):
is maximized (Zahariah et al.
2021):
 |
(17) |
For the solution, the orthogonal constraints of  and
and
 are
required (Zahariah et al.
2021).
are
required (Zahariah et al.
2021).
PLS regression was calculated using the Matlab build-in function
plsregress.m. The algorithm centers  and
and  by subtracting the column
means and subsequently, computes the singular value decomposition (SVD). PLS regression
was performed with 10 components of the responses in
by subtracting the column
means and subsequently, computes the singular value decomposition (SVD). PLS regression
was performed with 10 components of the responses in  on the predictors in
 . The predictor scores were
then submitted to a receiver operating characteristics (ROC) analysis and the area under
the curve (AUC) was determined to estimate the accuracy of the predictors (Hanley and McNeil 1982). Significance was set at
P < 0.05.
. The predictor scores were
then submitted to a receiver operating characteristics (ROC) analysis and the area under
the curve (AUC) was determined to estimate the accuracy of the predictors (Hanley and McNeil 1982). Significance was set at
P < 0.05.
Results
Global comparisons
To test whether features of neuronal complexity and power spectra are significantly influenced by the conditions, a Kruskal–Wallis test was performed. The analysis revealed a significant main effect for state on a P < 0.001 level concerning SE sf = 1, SE sf = 7, SE sf = 10, SE sf = 20, DFA and SNZ. For the PSD, significant effects were found for delta and alpha 1 (Table 1).
Table 1.
Chi-square values for each measures resulting from the Kruskal–Wallis test calculated over all conditions
| Chi-square | P-value | |
|---|---|---|
| Delta | 39.017** | <0.001 |
| Theta | 10.218 | 0.069 |
| Alpha 1 | 21.866** | <0.001 |
| Alpha 2 | 17.015* | 0.005 |
| Beta 1 | 1.279 | 0.937 |
| Beta 2 | 1.928 | 0.858 |
| Gamma | 18.318* | 0.003 |
| Global | 5.888 | 0.217 |
| SE sf = 1 | 56.819** | <0.001 |
| SE sf = 3 | 18.414* | 0.003 |
| SE sf = 5 | 7.160 | 0.209 |
| SE sf = 7 | 42.887** | <0.001 |
| SE sf = 10 | 64.481** | <0.001 |
| SE sf = 20 | 24.057** | <0.001 |
| HFD | 20.132* | 0.001 |
| α (DFA) | 43.170** | <0.001 |
| SNZ | 53.423** | <0.001 |
P < 0.001.,
P < 0.01.
For state comparisons, effect sizes were estimated for each complexity feature and frequency band. Significant differences were determined by a two-tailed t-test corrected for multiple comparisons by the false discovery rate. The resulting t-values are shown in Supplementary Fig. 1. The resting state with eyes open was associated with higher complexity in comparison to resting with eyes closed. Here, largest effect size was found for SE sf = 1 (d = 1.47) and SE sf = 10 (d = 0.93), whereby the HFD yielded a low effect size (d = 0.33). The DFA as an index of long-range temporal correlations (LRTC) was significantly higher in the eyes open resting condition with moderate effect size (d = 0.73), whereas the critical scaling exponent was reduced compared to eyes closed with a large effect size (d = −0.96). Further, alpha 1 and alpha 2 decreased during eyes open compared to eyes closed with small to moderate effect sizes (d = −0.58 and d = −0.37).
For the presence meditation condition, the increase of SE sf = 1 and HFD did not reach statistical significance. However, LRTC were decreased shown by the DFA exponent yielding a medium effect size (d = −0.49, P < 0.001) in comparison to resting with eyes closed. Delta and theta band PSD were significantly reduced with a small effect size (d = −0.33; d = −0.22). In contrast, comparing emptiness with the eyes closed resting state resulted in slightly higher complexity with a small effect size as shown by the HFD (d = 0.23), whereby less LRTC were measured with the DFA, also with a small effect size (d = −0.37). Delta (d = −0.38), theta (d = −0.25) and beta 1 band PSD (d = −0.12) were reduced. A similar pattern was observed in the comparison focused attention vs. eyes closed. Here, the neuronal complexity was higher as captured by SE sf = 1 (d = 0.61) and SE sf = 3 (d = 0.48) with moderate effect sizes. The DFA and the critical exponent were reduced with small effect sizes (d = −0.28 and d = −0.26). Further, a decrease in delta (d = −0.36) and theta band power (d = −0.21) was observed, whereas gamma band power was significantly enhanced (d = 0.32).
Contrasting the meditation states against each other revealed slightly higher complexity in emptiness compared to presence, whereas the global PSD was lower (d = −0.28). Also, alpha 1, alpha 2, beta 1, and beta 2 band power was reduced. However, in comparison with the focused attention meditation, the state of emptiness was associated with reduced complexity according to SE sf = 1 (d = −0.33) and SE sf = 3 (d = −0.24) as well as reduced gamma band power (d = −0.28) with small effect sizes. Moreover, focused attention was characterized by higher complexity compared to presence as captured by SE sf = 1, SE sf = 3, SE sf = 5, SE sf = 7 and SE sf = 10, whereas alpha 1 band power was significantly lower during focused attention compared to presence (d = −0.27). Also here, the SNZ was lower during focused attention yielding a small effect size of d = −0.32 (Fig. 2). The critical scaling exponent yielded lower values for focused attention than emptiness and presence. SNZ values were further reduced during the reading condition compared to the meditation conditions (Fig. 3). The topographical plots of the condition comparisons are illustrated in Supplementary Fig. 2.
Figure 2.
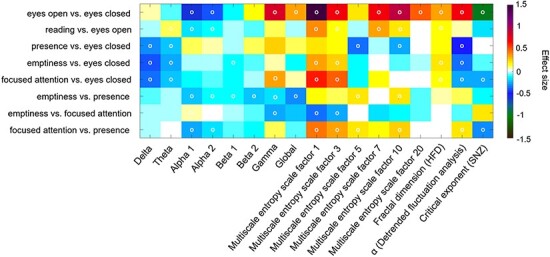
Color-coded differences of outcome parameters shown as effect sizes (Cohen’s d) of the condition comparisons on a global level averaged over all electrodes. Fields marked with a white circle were significant on the 0.05 level after FDR adjustment
Figure 3.
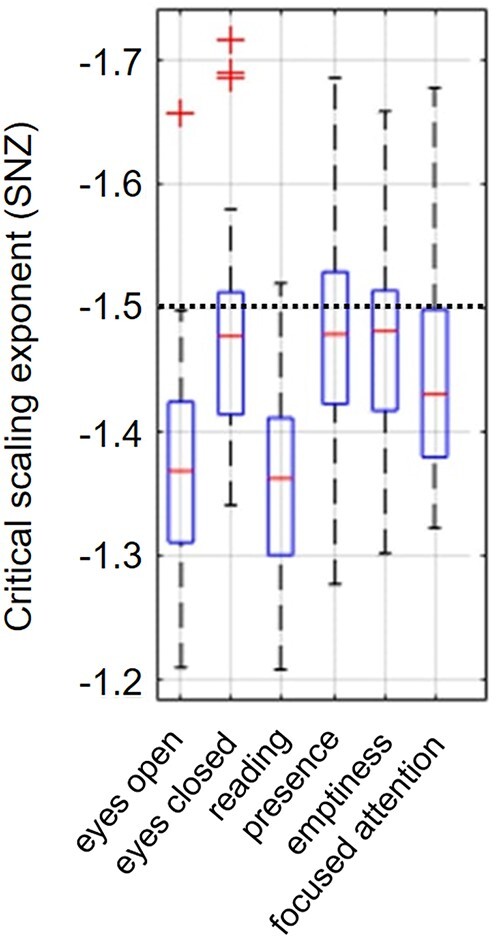
Mean values of the critical scaling exponent for each condition. The black dotted horizontal line depicts the theoretical power law slope of the critical point (Wilting and Priesemann 2019)
Correlations between complexity, criticality, and spectral features
Correlations were calculated from the median of the time series across participants after averaging over channels for each condition, respectively. Here, it becomes evident that the SNZ was significantly negatively correlated with the sample entropy, the scaling exponent resulting from the DFA as well as the HFD in each condition. The scaling exponent from the DFA showed highest negative correlations with the alpha 1 and alpha 2 frequency bands. The correlations remained robust across conditions (Supplementary Tables 1–6).
Discrimination analysis
To determine the discrimination accuracy, ROC analysis was applied. Regarding the frequency bands, highest accuracy was found for the gamma band (0.83–0.98) followed by the global PSD (0.78–0.96) (Table 2). The sample entropy was slightly superior to the HFD and DFA analysis in discriminating the meditation conditions (0.86–0.90 vs. 0.73–0.75 and 0.74.-0.77) (Table 3).
Table 2.
Accuracy of the frequency bands in classification determined by partial least square regression and ROC analysis
| Accuracy | ‘Delta’ | ‘Theta’ | ‘Alpha1’ | ‘Alpha2’ | ‘Beta 1’ | ‘Beta 2’ | ‘Gamma’ | ‘Global’ |
|---|---|---|---|---|---|---|---|---|
| ‘Eyes open vs. eyes closed’ | 0.68 | 0.70 | 0.74 | 0.71 | 0.70 | 0.83 | 0.94 | 0.91 |
| ‘Reading vs. eyes open’ | 0.66 | 0.68 | 0.66 | 0.65 | 0.66 | 0.79 | 0.90 | 0.87 |
| ‘Eyes open vs. presence’ | 0.76 | 0.70 | 0.77 | 0.75 | 0.72 | 0.88 | 0.96 | 0.94 |
| ‘Eyes open vs. emptiness’ | 0.76 | 0.70 | 0.75 | 0.73 | 0.72 | 0.88 | 0.97 | 0.94 |
| ‘Eyes open vs. focused attention’ | 0.76 | 0.71 | 0.74 | 0.73 | 0.71 | 0.87 | 0.96 | 0.93 |
| ‘Eyes closed vs. reading’ | 0.67 | 0.74 | 0.77 | 0.73 | 0.72 | 0.86 | 0.96 | 0.94 |
| ‘Presence vs. eyes closed’ | 0.71 | 0.64 | 0.65 | 0.63 | 0.68 | 0.77 | 0.92 | 0.89 |
| ‘Emptiness vs. eyes closed’ | 0.72 | 0.65 | 0.63 | 0.63 | 0.66 | 0.75 | 0.90 | 0.86 |
| ‘Focused attention vs. eyes closed’ | 0.73 | 0.66 | 0.63 | 0.63 | 0.67 | 0.77 | 0.91 | 0.88 |
| ‘Reading vs. presence’ | 0.74 | 0.75 | 0.81 | 0.78 | 0.76 | 0.89 | 0.97 | 0.96 |
| ‘Reading vs. emptiness’ | 0.75 | 0.75 | 0.79 | 0.76 | 0.75 | 0.90 | 0.98 | 0.96 |
| ‘Reading vs. focused attention’ | 0.75 | 0.76 | 0.77 | 0.75 | 0.74 | 0.90 | 0.97 | 0.96 |
| ‘Emptiness vs. presence’ | 0.62 | 0.61 | 0.62 | 0.62 | 0.63 | 0.68 | 0.84 | 0.78 |
| ‘Emptiness vs. focused attention’ | 0.62 | 0.61 | 0.62 | 0.61 | 0.64 | 0.70 | 0.83 | 0.78 |
| ‘Focused attention vs. presence’ | 0.63 | 0.62 | 0.65 | 0.64 | 0.67 | 0.75 | 0.88 | 0.83 |
Table 3.
Accuracy of the complexity and criticality features in classification determined by partial least square regression and ROC analysis
| Accuracy | SE | SE sf = 3 | SE sf = 5 | SE sf = 7 | SE sf = 10 | SE sf = 20 | HFD | α(DFA) |
|---|---|---|---|---|---|---|---|---|
| ‘Eyes open vs. eyes closed’ | 0.94 | 0.94 | 0.92 | 0.91 | 0.89 | 0.88 | 0.78 | 0.84 |
| ‘Reading vs. eyes open’ | 0.92 | 0.91 | 0.89 | 0.90 | 0.85 | 0.84 | 0.76 | 0.78 |
| ‘Eyes open vs. presence’ | 0.95 | 0.97 | 0.95 | 0.95 | 0.94 | 0.90 | 0.83 | 0.91 |
| ‘Eyes open vs. emptiness’ | 0.96 | 0.97 | 0.95 | 0.95 | 0.92 | 0.90 | 0.82 | 0.90 |
| Eyes open vs. focused attention’ | 0.96 | 0.96 | 0.95 | 0.95 | 0.91 | 0.90 | 0.81 | 0.90 |
| ‘Eyes closed vs. reading’ | 0.96 | 0.96 | 0.95 | 0.95 | 0.91 | 0.91 | 0.83 | 0.86 |
| ‘Presence vs. eyes closed’ | 0.91 | 0.92 | 0.88 | 0.88 | 0.83 | 0.84 | 0.75 | 0.79 |
| ‘Emptiness vs. eyes closed’ | 0.90 | 0.91 | 0.89 | 0.87 | 0.80 | 0.83 | 0.74 | 0.78 |
| ‘Focused attention vs. eyes closed’ | 0.92 | 0.93 | 0.90 | 0.89 | 0.81 | 0.84 | 0.74 | 0.76 |
| ‘Reading vs. presence’ | 0.97 | 0.98 | 0.97 | 0.97 | 0.95 | 0.93 | 0.87 | 0.92 |
| ‘Reading vs. Emptiness’ | 0.98 | 0.98 | 0.97 | 0.97 | 0.95 | 0.94 | 0.86 | 0.92 |
| Reading vs ‘Focused attention’ | 0.98 | 0.96 | 0.97 | 0.96 | 0.94 | 0.92 | 0.86 | 0.91 |
| ‘Emptiness vs. presence’ | 0.86 | 0.89 | 0.86 | 0.84 | 0.79 | 0.82 | 0.73 | 0.74 |
| ‘Emptiness vs. focused attention’ | 0.86 | 0.90 | 0.88 | 0.88 | 0.79 | 0.82 | 0.73 | 0.76 |
| ‘Focused attention vs. presence’ | 0.90 | 0.92 | 0.90 | 0.89 | 0.83 | 0.84 | 0.75 | 0.77 |
Discussion
Several theories suggest that the complexity of brain dynamics is a fundamental property of consciousness (Tononi 2004; Oizumi et al. 2014; Carhart-Harris 2018; Sarasso et al. 2021). For instance, the ground-breaking work of Tononi and Edelman focusing on functional integration and differentiation provided a useful provisionally taxonomy for empirical metrics to index conscious states (Tononi and Edelman 1998). Nowadays different theories of consciousness, even though starting from different premises, embraced and incorporated an explicit complexity-related framework (Sarasso et al. 2021). Such empirical measures suitable to determine states of consciousness could be important, inter alia, for clinical diagnostics and therapy (Seth et al. 2006; Arsiwalla and Verschure 2018; Demertzi et al. 2019; Zimmern 2020). Therefore, this study was based on the proposal that distinct states of consciousness are quantifiable by complexity and criticality measures serving as an index of the brain’s information processing capacity. Here, a task-free baseline resting, a reading condition and three meditation conditions were analyzed with four nonlinear methods as well as PSD. Effect sizes were compared to determine to what degree these measures reflect changes in the state of wakeful consciousness.
Similarities between meditation states
The results revealed significantly reduced LRTC in all three meditation conditions compared to the resting state. Also, Irrmischer et al. showed that meditation practitioners exhibit weaker LRTC during a focused attention meditation compared to rest by applying DFA to EEG data. The suppression of LRTCs could not be detected in participants without previous meditation experience. The authors interpreted the results as a shift toward a subcritical regime and argued that the reduced autocorrelation within the signal may be associated with fewer distractions from the task. Furthermore, the ability to attenuate LRTC has been associated with trait absorption (i.e. the individual’s capacity for engaging attentional resources in sensory and imaginative experiences) (Irrmischer et al. 2018). Considering that distinct meditation types share common aspects such as the refrain from mental conceptualization, categorial thinking, or episodic memory, the attenuation of LRTC might be interpreted as a down-regulation of certain mental processing activities. Interestingly, one study explored the relationship between LRTCs and the subjective sense of self suggesting that more temporal consistency is associated with better-synthesized identity (Sugimura et al. 2021). In this view, one could speculate that less LRTC might correspond to a dissolution of the sense of self, as often experienced by mindfulness training practitioners (Nave et al. 2021).
Differences between meditation states
Among the meditation tasks, the critical scaling exponent yielded lowest values for focused attention. Contrasting the meditation states with resting further revealed that only focused attention was associated with significant differences among the meditation tasks. Besides constant monitoring, the focused attention meditation, in contrast to presence and emptiness, requires executive control in terms of detecting phases of mind wandering, where attention is directed elsewhere. Interestingly, these findings may indicate a link between focused attention and a shift to a subcritical regime. In line with these results, Fagerholm et al. analyzed neuronal avalanches during a visuomotor cognitive finger-tapping task in comparison to rest associating the task state and increased attentional load with a shift toward subcritical dynamics (Fagerholm et al. 2015). Further, Tomen and colleagues associated marginally subcritical dynamics with enhanced stimulus discriminability under attention. In their network model, entropy was maximized at the subcritical border under the assumption of a coarse observation scale (Tomen et al. 2014). To note, also another MEG study carried out with novices found that avalanche dynamics shifted during meditation, which led the authors to conclude that self-regulated attention can serve as a control parameter of criticality in scale-free brain dynamics. In their analysis, the power-law exponent changed from values more negative than −1.5 to values close to −1.5, and thus, from a supercritical to critical dynamics (Dürschmid et al. 2020). The difference might be explainable by the fact, that the presented study was conducted with experienced meditators, who might require less effort to focus their attention.
Furthermore, higher neuronal complexity was found during the meditation conditions emptiness and focused attention compared to resting with eyes closed as captured by the sample entropy and HFD values. There are some studies in the literature supporting our finding of higher complexity during meditative states compared to resting. For instance, Kakamanua et al. analyzed EEG data of participants with different proficiencies during a Vipassana meditation and reported increased HFD and permutation entropy in teachers and novices (Kakumanu et al. 2018). In addition, Huang and Lo estimated a higher complexity index, especially at occipital, temporal and anterior areas during a Zen-meditation in experienced practitioners compared to a control group resting for the same amount of time (Huang and Lo 2009). Further, increased fractal dimension as determined by Sevcik’s method was found in a calming meditation task (Vyšata et al. 2014). Also, Vivot et al. analyzed an EEG dataset of experienced meditators following three different traditions. The meditation styles included Himalayan Yoga and Vipassana, which can be classified as focused attention, as well as Isha Yoga, classifiable as open monitoring. The authors reported an increase in the sample entropy during all practices (Martínez Vivot et al. 2020), whereas here, the complexity increase did not reach significance for the presence task.
Relationship between criticality, complexity, and spectral features
Additionally, our analysis showed significant correlations between the complexity, criticality, and spectral features. Here, the critical exponent was significantly negatively correlated with the sample entropy, the HFD and the scaling exponent of the DFA consistently across the conditions. These finding is especially important, considering that the concepts of complexity and criticality are often used equivalently. Thus, the results show that post hoc interpretations of stronger LRTC as neural dynamics closer to the critical point (Poil et al. 2012) and subcritical dynamics as reduced information processing (Irrmischer et al. 2018) require some caution. This aspect further bears implications for consciousness theories, which incorporated an complexity-related framework (Sarasso et al. 2021). For instance, in his entropic brain hypothesis Carhart-Harris proposes that the entropy of brain activity indexes the informational richness of conscious states and equates higher entropic states with more flexible cognition and a shift toward supercritical dynamics (Carhart-Harris et al. 2014; Carhart-Harris 2018). In addition, the Integrated Information Theory as well as the global workspace theory (Dehaene 2001), even though addressing distinct aspects of consciousness, were both associated with criticality (Werner 2007, 2009; Tagliazucchi 2017; Kim and Lee 2019; Popiel et al. 2020). Therefore, meticulously investigating the relationship between different complexity and criticality measures as a function of states of consciousness enables putting the recent theories to experimental testing ground.
To date, the relationship between the complexity of EEG signals and their spectral properties is not fully understood (Frohlich et al. 2021). The discrimination analysis revealed that the sample entropy, the HFD and the DFA yielded an accuracy over 70% in discriminating the conditions. Also, the global PSD and the gamma band reached an accuracy of more than 75%. Addressing the question to what extent nonlinear techniques capture phenomena that could not be assessed by spectral analysis, Mediano and colleagues performed a decomposition of spectral and phasic differences in the Lempel–Ziv complexity of a MEG dataset between a task and rest condition, reporting that the effect is mostly driven by spectral changes (Mediano et al. 2021). Further attempts have been made to determine whether observed complexity changes go beyond what would be expected from changes in the power spectrum. For instance, Schartner et al. (2015) measured lower dynamical complexity during non-rapid eye movement sleep compared to rapid eye movement sleep and wakeful rest. The differences could not be solely attributed to PSD changes between the conditions (Schartner et al. 2015). It has been emphasized that each complexity measure gives additional information about the underlying data (Burns and Rajan 2015) and hence, the combination of EEG complexity and traditional measures such as PSD are deemed as fruitful for capturing signatures of consciousness (Frohlich et al. 2021).
This study has several limitations. First, previous research has shown that meditation expertise notably affects electrophysiological correlates. To avoid trait effect biases, only highly experienced meditators with an average of 20 years and 6498 h of practice were included. However, the practice duration and the proficiency are not necessarily proportional. Whereas all participants were able to follow the instruction and reached the meditative states according to their reports, no trait effects measures were included. Also, for the scope of this study complexity and criticality was considered as a global correlate of the state of consciousness, even though theoretical frameworks suggest a multidimensionality including behavioral and cognitive aspects for the conceptualization of global states of consciousness (Bayne et al. 2016).
In conclusion, electrophysiological differences of distinct meditation states were identified and the relationship between nonlinear complexity, critical brain dynamics, and spectral features was determined. The meditation states could be discriminated with nonlinear measures and quantified by the degree of neuronal complexity, LRTC, and power law distributions in neuronal avalanches.
Supplementary Material
Contributor Information
Nike Walter, Department of Psychosomatic Medicine, Section of Applied Consciousness Sciences, University Hospital of Regensburg, Franz-Josef-Strauß Allee 11, Regensburg 93059, Germany.
Thilo Hinterberger, Department of Psychosomatic Medicine, Section of Applied Consciousness Sciences, University Hospital of Regensburg, Franz-Josef-Strauß Allee 11, Regensburg 93059, Germany.
Supplementary data
Supplementary data is available at NCONSC online.
Funding
No funding was received for this study.
Conflict of interest statement
The authors declare no conflict of interest.
Data availability
The datasets generated and analyzed in the current study are available from the corresponding author on reasonable request.
References
- Alin A. Comparison of PLS algorithms when number of objects is much larger than number of variables. Stat Papers 2009;50:711–20. [Google Scholar]
- Arsiwalla XD, Verschure P. Measuring the complexity of consciousness. Front Neurosci 2018;12:424. [DOI] [PMC free article] [PubMed] [Google Scholar]
- Bak P, Tang C, Wiesenfeld K. Self-organized criticality: an explanation of the 1/f noise. Phys Rev Lett 1987;59:381–4. [DOI] [PubMed] [Google Scholar]
- Bayne T, Hohwy J, Owen AM. Are there levels of consciousness? Trends Cogn Sci 2016;20:405–13. [DOI] [PubMed] [Google Scholar]
- Beggs JM, Timme N. Being critical of criticality in the brain. Front Physiol 2012;3:163. [DOI] [PMC free article] [PubMed] [Google Scholar]
- Benjamini Y, Hochberg Y. Controlling the false discovery rate: a practical and powerful approach to multiple testing. J R Stat Soc 1995;51:289–300. [Google Scholar]
- Burns T, Rajan R. Combining complexity measures of EEG data: multiplying measures reveal previously hidden information. F1000Research 2015;4:137. [DOI] [PMC free article] [PubMed] [Google Scholar]
- Carhart-Harris RL, Leech R, Hellyer PJ et al. The entropic brain: a theory of conscious states informed by neuroimaging research with psychedelic drugs. Front Hum Neurosci 2014;8:20. [DOI] [PMC free article] [PubMed] [Google Scholar]
- Carhart-Harris RL. The entropic brain - revisited. Neuropharmacology 2018;142:167–78. [DOI] [PubMed] [Google Scholar]
- Cocchi L, Gollo LL, Zalesky A et al. Criticality in the brain: a synthesis of neurobiology, models and cognition. Prog Neurobiol 2017;158:132–52. [DOI] [PubMed] [Google Scholar]
- Cohen J. Statistical Power Analysis for the Behavioral Sciences. Oxfordshire: Routledge, 2013. [Google Scholar]
- Colombo MA, Wei Y, Ramautar JR et al. More severe insomnia complaints in people with stronger long-range temporal correlations in wake resting-state EEG. Front Physiol 2016;7:576. [DOI] [PMC free article] [PubMed] [Google Scholar]
- Costa M, Goldberger AL, Peng C-K. Multiscale entropy analysis of biological signals. Phys Rev E Stat Nonlin Soft Matter Phys 2005;71:21906. [DOI] [PubMed] [Google Scholar]
- de Jong S. SIMPLS: an alternative approach to partial least squares regression. Chemometr Intell Lab Syst 1993;18:251–63. [Google Scholar]
- Dehaene S. Towards a cognitive neuroscience of consciousness: basic evidence and a workspace framework. Cognition 2001;79:1–37. [DOI] [PubMed] [Google Scholar]
- Demertzi A, Tagliazucchi E, Dehaene S et al. Human consciousness is supported by dynamic complex patterns of brain signal coordination. Sci Adv 2019;5:eaat7603. [DOI] [PMC free article] [PubMed] [Google Scholar]
- Deolindo CS, Ribeiro MW, Aratanha MA et al. A critical analysis on characterizing the meditation experience through the electroencephalogram. Front Syst Neurosci 2020;14:53. [DOI] [PMC free article] [PubMed] [Google Scholar]
- Destexhe A, Touboul JD. Is there sufficient evidence for criticality in cortical systems? eNeuro 2021;8:ENEURO.0551-20.2021.doi: 10.1523/ENEURO.0551-20.2021. [DOI] [PMC free article] [PubMed] [Google Scholar]
- Dürschmid S, Reichert C, Walter N et al. Self-regulated critical brain dynamics originate from high frequency-band activity in the MEG. PLoS One 2020;15:e0233589. [DOI] [PMC free article] [PubMed] [Google Scholar]
- Fagerholm ED, Lorenz R, Scott G et al. Cascades and cognitive state: focused attention incurs subcritical dynamics. J Neurosci 2015;35:4626–34. [DOI] [PMC free article] [PubMed] [Google Scholar]
- Fekete T, Hinrichs H, Sitt JD et al. Multiscale criticality measures as general-purpose gauges of proper brain function. Sci Rep 2021;11:14441. [DOI] [PMC free article] [PubMed] [Google Scholar]
- Friedman N, Ito S, Brinkman BA et al. Universal critical dynamics in high resolution neuronal avalanche data. Phys Rev Lett 2012;108:208102. [DOI] [PubMed] [Google Scholar]
- Frohlich J, Toker D, Monti MM. Consciousness among delta waves: a paradox? Brain: J Neurol 2021;144:2257–77. [DOI] [PubMed] [Google Scholar]
- Garcia‐Romeu AP, Tart CT. Altered states of consciousness and transpersonal psychology. In: Friedman HL, Hartelius G (eds.), The Wiley‐Blackwell Handbook of Transpersonal Psychology. Hoboken: Wiley, 2013, 121–40. [Google Scholar]
- Hanley JA, McNeil BJ. The meaning and use of the area under a receiver operating characteristic (ROC) curve. Radiology 1982;143:29–36. [DOI] [PubMed] [Google Scholar]
- Hardstone R, Poil SS, Schiavone G et al. Detrended fluctuation analysis: a scale-free view on neuronal oscillations. Front Physiol 2012;3:450. [DOI] [PMC free article] [PubMed] [Google Scholar]
- Higuchi T. Approach to an irregular time series on the basis of the fractal theory. Physica D 1988;31:277–83. [Google Scholar]
- Hinterberger T, Kübler A, Kaiser J et al. A brain–computer interface (BCI) for the locked-in: comparison of different EEG classifications for the thought translation device. Clin Neurophysiol 2003;114:416–25. [DOI] [PubMed] [Google Scholar]
- Hinterberger T, Schmidt S, Kamei T et al. Decreased electrophysiological activity represents the conscious state of emptiness in meditation. Front Psychol 2014;5:99. [DOI] [PMC free article] [PubMed] [Google Scholar]
- Höskuldsson A. PLS regression methods. J Chemom 1988;2:211–28. [Google Scholar]
- Huang H-Y, Lo P-C. EEG dynamics of experienced Zen meditation practitioners probed by complexity index and spectral measure. J Med Eng Technol 2009;33:314–21. [DOI] [PubMed] [Google Scholar]
- Irrmischer M, Houtman SJ, Mansvelder HD et al. Controlling the temporal structure of brain oscillations by focused attention meditation. Hum Brain Mapp 2018;39:1825–38. [DOI] [PMC free article] [PubMed] [Google Scholar]
- Kakumanu RJ, Nair AK, Venugopal R et al. Dissociating meditation proficiency and experience dependent EEG changes during traditional Vipassana meditation practice. Biol Psychol 2018;135:65–75. [DOI] [PubMed] [Google Scholar]
- Kesić S, Spasić SZ. Application of Higuchi’s fractal dimension from basic to clinical neurophysiology: a review. Comput Methods Programs Biomed 2016;133:55–70. [DOI] [PubMed] [Google Scholar]
- Kim H, Lee U. Criticality as a determinant of integrated information Φ in human brain networks. Entropy 2019;21:981. [Google Scholar]
- Klonowski W. From conformons to human brains: an informal overview of nonlinear dynamics and its applications in biomedicine. Nonlinear Biomed Phys 2007;1:5. [DOI] [PMC free article] [PubMed] [Google Scholar]
- Linkenkaer-Hansen K, Nikouline VV, Palva JM et al. Long-range temporal correlations and scaling behavior in human brain oscillations. J Neurosci 2001;21:1370–7. [DOI] [PMC free article] [PubMed] [Google Scholar]
- Marshall N, Timme NM, Bennett N et al. Analysis of power laws, shape collapses, and neural complexity: new techniques and MATLAB support via the NCC toolbox. Front Physiol 2016;7:250. [DOI] [PMC free article] [PubMed] [Google Scholar]
- Martínez Vivot R, Pallavicini C, Zamberlan F et al. Meditation increases the entropy of brain oscillatory activity. Neuroscience 2020;431:40–51. [DOI] [PubMed] [Google Scholar]
- Massobrio P, Arcangelis LD, Pasquale V et al. Criticality as a signature of healthy neural systems. Front Syst Neurosci 2015;9:22. [DOI] [PMC free article] [PubMed] [Google Scholar]
- Mediano PAM, Rosas FE, Barrett AB et al. Decomposing spectral and phasic differences in nonlinear features between datasets. Phys Rev Lett 2021;127:124101. [DOI] [PubMed] [Google Scholar]
- Nave O, Trautwein FM, Ataria Y et al. Self-boundary dissolution in meditation: a phenomenological investigation. Brain Sci 2021;11:819.doi: 10.3390/brainsci11060819. [DOI] [PMC free article] [PubMed] [Google Scholar]
- Oizumi M, Albantakis L, Tononi G. From the phenomenology to the mechanisms of consciousness: integrated information theory 3.0. PLoS Comput Biol 2014;10:e1003588. [DOI] [PMC free article] [PubMed] [Google Scholar]
- Poil -S-S, Hardstone R, Mansvelder HD et al. Critical-state dynamics of avalanches and oscillations jointly emerge from balanced excitation/inhibition in neuronal networks. J Neurosci 2012;32:9817–23. [DOI] [PMC free article] [PubMed] [Google Scholar]
- Popiel NJM, Khajehabdollahi S, Abeyasinghe PM et al. The emergence of integrated information, complexity, and ‘consciousness’ at criticality. Entropy (Basel, Switzerland) 2020;22:339. [DOI] [PMC free article] [PubMed] [Google Scholar]
- Rosenblum MG, Pikovsky AS, Kurths J. Phase synchronization of chaotic oscillators. Phys Rev Lett 1996;76:1804–7. [DOI] [PubMed] [Google Scholar]
- Rosipal R, Krämer N. Overview and recent advances in partial least squares. In: Saunders C, Grobelnik M, Gunn S et al. (eds.), Subspace, Latent Structure and Feature Selection. Berlin Heidelberg: Springer, 2006, 34–51. [Google Scholar]
- Sarasso S, Casali AG, Casarotto S et al. Consciousness and complexity: a consilience of evidence. Neurosci Conscious 2021;7:1–24.doi: 10.1093/nc/niab023. [DOI] [PMC free article] [PubMed] [Google Scholar]
- Schartner M, Seth A, Noirhomme Q et al. Complexity of multi-dimensional spontaneous EEG decreases during propofol induced general anaesthesia. PLoS One 2015;10:e0133532. [DOI] [PMC free article] [PubMed] [Google Scholar]
- Seth AK. The grand challenge of consciousness. Front Psychol 2010;1:5. [DOI] [PMC free article] [PubMed] [Google Scholar]
- Seth AK, Izhikevich E, Reeke GN et al. Theories and measures of consciousness: an extended framework. Proc Natl Acad Sci U S A 2006;103:10799–804. [DOI] [PMC free article] [PubMed] [Google Scholar]
- Shew WL, Plenz D. The functional benefits of criticality in the cortex. Neuroscientist 2013;19:88–100. [DOI] [PubMed] [Google Scholar]
- Shew WL, Yang H, Yu S et al. Information capacity and transmission are maximized in balanced cortical networks with neuronal avalanches. J Neurosci 2011;31:55–63. [DOI] [PMC free article] [PubMed] [Google Scholar]
- Shriki O, Alstott J, Carver F et al. Neuronal avalanches in the resting MEG of the human brain. J Neurosci 2013;33:7079–90. [DOI] [PMC free article] [PubMed] [Google Scholar]
- Slagter HA, Lutz A, Greischar LL et al. Mental training affects distribution of limited brain resources. PLoS Biol 2007;5:e138. [DOI] [PMC free article] [PubMed] [Google Scholar]
- Sporns O, Tononi G, Edelman G. Connectivity and complexity: the relationship between neuroanatomy and brain dynamics. Neural Networks 2000;13:909–22. [DOI] [PubMed] [Google Scholar]
- Stam CJ. Nonlinear dynamical analysis of EEG and MEG: review of an emerging field. Clin Neurophysiol 2005;116:2266–301. [DOI] [PubMed] [Google Scholar]
- Sugimura K, Iwasa Y, Kobayashi R et al. Association between long-range temporal correlations in intrinsic EEG activity and subjective sense of identity. Sci Rep 2021;11:422. [DOI] [PMC free article] [PubMed] [Google Scholar]
- Tagliazucchi E. The signatures of conscious access and its phenomenology are consistent with large-scale brain communication at criticality. Conscious Cogn 2017;55:136–47. [DOI] [PubMed] [Google Scholar]
- Tagliazucchi E, Balenzuela P, Fraiman D et al. Criticality in large-scale brain FMRI dynamics unveiled by a novel point process analysis. Front Physiol 2012;3:15. [DOI] [PMC free article] [PubMed] [Google Scholar]
- Timme NM, Marshall NJ, Bennett N et al. Criticality maximizes complexity in neural tissue. Front Physiol 2016;7:425. [DOI] [PMC free article] [PubMed] [Google Scholar]
- Tomen N, Rotermund D, Ernst U. Marginally subcritical dynamics explain enhanced stimulus discriminability under attention. Front Syst Neurosci 2014;8:151. [DOI] [PMC free article] [PubMed] [Google Scholar]
- Tononi G. An information integration theory of consciousness. BMC Neurosci 2004;5:42. [DOI] [PMC free article] [PubMed] [Google Scholar]
- Tononi G, Edelman GM. Consciousness and complexity. Science (New York, N Y ) 1998;282:1846–51. [DOI] [PubMed] [Google Scholar]
- Travis F, Shear J. Focused attention, open monitoring and automatic self-transcending: categories to organize meditations from Vedic, Buddhist and Chinese traditions. Conscious Cogn 2010;19:1110–8. [DOI] [PubMed] [Google Scholar]
- Vaitl D, Birbaumer N, Gruzelier J et al. Psychobiology of altered states of consciousness. Psychol Bull 2005;131:98–127. [DOI] [PubMed] [Google Scholar]
- van Leeuwen S, Singer W, Melloni L. Meditation increases the depth of information processing and improves the allocation of attention in space. Front Hum Neurosci 2012;6:133. [DOI] [PMC free article] [PubMed] [Google Scholar]
- Vyšata O, Schätz M, Kopal J et al. Non-linear EEG measures in meditation. JBiSE 2014;7:731–8. [Google Scholar]
- Werner G. Brain dynamics across levels of organization. J Physiol Paris 2007;101:273–9. [DOI] [PubMed] [Google Scholar]
- Werner G. Consciousness related neural events viewed as brain state space transitions. Cogn Neurodyn 2009;3:83–95. [DOI] [PMC free article] [PubMed] [Google Scholar]
- Wilting J, Priesemann V. 25 years of criticality in neuroscience - established results, open controversies, novel concepts. Curr Opin Neurobiol 2019;58:105–11. [DOI] [PubMed] [Google Scholar]
- Zahariah S, Midi H, Mustafa MS. An improvised SIMPLS estimator based on MRCD-PCA weighting function and its application to real data. Symmetry 2021;13:2211. [Google Scholar]
- Zimmern V. Why brain criticality is clinically relevant: a scoping review. Front Neural Circuits 2020;14:54. [DOI] [PMC free article] [PubMed] [Google Scholar]
Associated Data
This section collects any data citations, data availability statements, or supplementary materials included in this article.
Supplementary Materials
Data Availability Statement
The datasets generated and analyzed in the current study are available from the corresponding author on reasonable request.