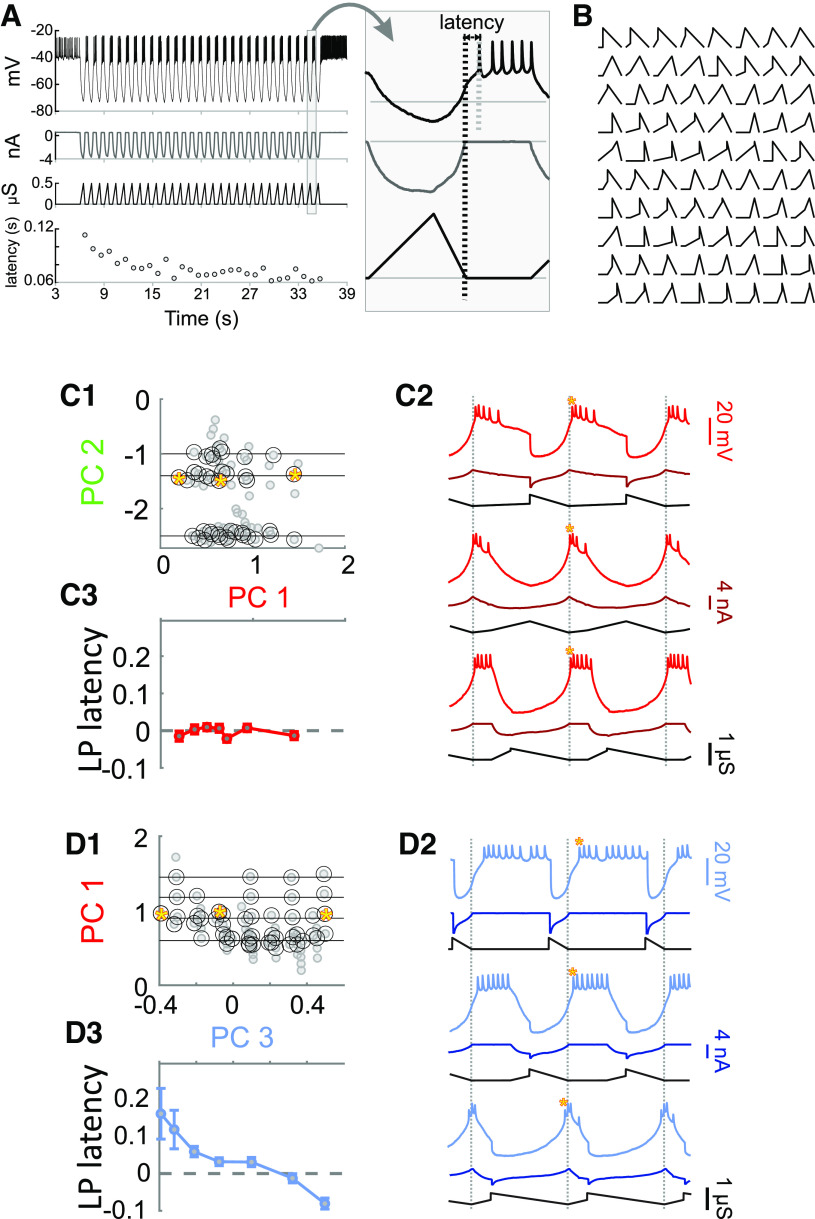
Figure 8.
Using dynamic clamp to inject a periodic synaptic conductance waveform into the synaptically-isolated LP neuron to measure the latency of LP burst onset. A, A predetermined conductance waveform (one of 80) is injected into the synaptically-isolated LP neuron as an inhibitory synapse for 30 cycles at a cycle period of 1 s. The latency of the LP burst onset, measured form the end of the conductance waveform (long vertical dashed line in inset), reaches a steady state value after several cycles. Inset shows the last cycle. B, A total of 80 synaptic conductance waveforms were used periodic dynamic clamp injection in each LP neuron, as described in A. C, An example analysis of the sensitivity of LP burst onset latency to changes in synaptic waveform shape along PC1, while PC2 remains constant (but other PCs vary freely). C1, The 80 synaptic waveforms (gray filled circles) used in dynamic clamp experiments were sorted by projecting the shape down to the PC1-PC2 plane. Pairs of waveforms (black circles) that fell along horizontal lines of constant PC2 (and were apart by at least 0.05 in PC1 units) were chosen for sensitivity analysis. C2, Example responses of the LP neuron to dynamic clamp injection of synaptic conductance waveforms marked by the yellow stars in C1. C3, The change in LP burst latency (see A) as a function of the change in PC1 value (in bins of 0.1), averaged across constant PC2. The slope of this change (Δlatency/ΔPC) is used as a measure of sensitivity. D, Same as C, but changing the waveform along PC3 while keeping PC1 constant.

