Abstract
The survival response of Lactococcus lactis during long-term starvation was investigated. The cells were cultured with different levels of glucose (the sole energy source) and either were kept in the resultant spent medium or transferred to fresh medium (without glucose) for up to 2 years. The survival of the cells during starvation was not dependent on the nature of transition phase, as expected, but on the nature of medium in which the cells were kept. The proliferation of cells, despite the apparent lack of glucose, could have been due to some cells being able to utilize the small amounts of peptides still present in the spent medium or to use energy sources provided by the breakup of dead cells. The 1- and 2-year-old cultures contained cells with vastly changed morphotypes. When these isolates were examined, it was revealed that the original plasmids present in the parent were rearranged in a certain way, and an entirely new plasmid was generated. Changes were also evident in the chromosomal DNA and in gene expression. Furthermore, all of the isolates exhibited a growth advantage relative to the parent cells when grown in energy-limiting media. When they were tested against different types of stresses, they exhibited a higher resistance against the bile salt and hydrogen peroxide stresses compared to the parent. Because of the similar changes observed in the 2-year-old isolates, a similar survival strategy may be operational in those cells that survive for that length of time.
When faced with a nutrient-limiting situation (i.e., starvation), bacterial cells respond by undergoing numerous changes that facilitate survival during starvation (13, 22, 24). The response to starvation varies considerably from species to species. Some bacteria respond to starvation by undergoing differentiation (i.e., sporulation). Spores can remain dormant for long periods of starvation, and they are usually unaffected by the prevalent environmental factors or stresses (25, 31). Nondifferentiating bacteria respond to starvation in a less dramatic way, and the only obvious morphological change appears to be a gradual reduction in the cell size (14). However, they too undergo significant physiological changes, and these changes allow them to survive long periods of starvation and to withstand stresses (6, 10, 11, 16, 23). However, unlike spores, nondifferentiating cells still maintain a low level of metabolism during starvation (10).
During long periods of starvation, spontaneous mutations would be likely to occur, and the starvation condition may provide the necessary selection pressure for certain mutant cells to proliferate. It has been shown that mutant cells of Escherichia coli readily arose during starvation and that different mutant cells coexisted in the same starving cultures (5, 30). Mutations giving rise to heterogeneous populations were shown to be random by the fact that the same cells cultured under an identical initial condition resulted in different mutant cells. It has been shown that when cells from a 10-day-old culture were mixed with cells from a 1-day old culture, the cells from the 10-day-old culture outcompeted the cells from the 1-day-old culture and eventually overtook the whole culture as the only viable cells in that culture. It has been proposed that the cells from the 10-day-old culture possess what are termed growth-advantage-in-stationary-phase (GASP) properties (5, 30). The survival of cells during starvation is therefore not only affected by the inherent changes that occur when cells enter stationary phase, but also by spontaneous mutations that occur naturally during starvation.
It has been proposed that the nature of the period prior to the onset of starvation may also affect how cells respond to starvation (15). The period between the log phase and stationary phase is referred to as the transition phase, and the nature of the transition phase is dependent on the amount of nutrient in the culturing media. Large amounts of nutrient (e.g., glucose) support relatively fast growth and high cell densities and allow accumulation of end products. In cultures grown to high cell densities, the transition phase is sudden and rapid because of the rapid exhaustion of nutrient. In addition, the accumulation of end products restricts growth and therefore contributes to the rapid transition phase. However, limiting amounts of nutrient (e.g., phytone peptone) permit slow growth, low cell densities, and only slight accumulation of end products. Under such circumstances, the transition phase is gradual and protracted. Such a transition phase may allow cells to assess the nutrient-limiting situation and to respond in readiness for the inevitable starvation.
Lactococcus lactis is commercially an important group of bacteria because of its extensive usage in the manufacture of dairy products and production of antimicrobials used as natural food preservatives (9). A possible application of L. lactis is now being extended to the area of medicine, as a vaccine delivery vehicle to the gastrointestinal tract (29). These cells, however, have to encounter nutrient-limiting situations and various stresses during the industrial processes and during passage through the gastrointestinal tract, and their viability and activity could be seriously affected by such conditions. A greater understanding of how some cells survive starvation is of interest and may lead to development of strategies for improved application of these cells both industrially and therapeutically. In this communication, the survival response of L. lactis during long-term starvation was studied. The effect of starvation on cell survival and on mutant populations was investigated. The isolates that had survived 1 and 2 years of starvation were examined in terms of plasmid and chromosomal DNA, gene expression, and morphology. The investigation into the effect of starvation on plasmid DNA is of value because of the important commercial traits encoded on plasmids in L. lactis. The isolates were also tested for any growth advantage under energy-limiting conditions and for any improved response against different stresses.
MATERIALS AND METHODS
Bacterial strain, media, and growth.
The strain used was Lactococcus lactis subsp. lactis LL41-1 (CRC Culture Collection). It was grown at 30°C in M17 buffered medium (pH 7.15) (26) supplemented with the standard 0.5% glucose (M17GStd). In the glucose-limiting experiments, 0.025% glucose (M17GLim) was used. For growth analysis, an overnight culture was inoculated into M17GStd and M17GLim (100 ml) at an optical density at 600 nm (OD600) of approximately 0.1, and samples were collected hourly for OD600 determination. For generation of working liquid cultures, a single colony was used from a freshly prepared plate culture, which had been streaked with a stock culture.
Monitoring CFU following cultivation in different media.
The strain was cultivated in M17GStd (100 ml), and once the stationary phase was reached, the number of CFU was determined every 4 days for the first 50 days and then every 50 days thereafter. This procedure was done by serially diluting the samples (100 μl) in saline and plating the cells onto M17GStd plates. In a second experiment, M17GLim (100 ml) was used instead of M17GStd. In a third experiment, cells were grown to stationary phase in M17GStd (100 ml), and then the cells were harvested by centrifugation and transferred into M17 (no glucose) (100 ml). For long-term starvation, the cultures were maintained at 30°C unaerated and stored in 250-ml bottles in the dark.
Microscopy.
Cells from plate colonies were spread sparingly onto microscope slides, stained with crystal violet, and examined with a phase-contrast microscope (Olympus BH) at ×100 magnification. The images were captured with a camera attached to the microscope. Statistical analysis of the data was performed with Student's t test, and statistical significance was accepted at the P < 0.05 level of probability.
Plasmid DNA isolation and Southern hybridization.
Plasmid DNA was isolated by a method previously described (1) and was resolved on a 0.8% agarose gel at 80 V for 4 h. Southern hybridization was done with a nonradioactive enhanced chemiluminescence (ECL) labeling system from Amersham following the manufacturer's instructions.
Preparation of chromosomal DNA and PFGE.
Cells were grown in M17GStd (10 ml) until the OD600 was ∼0.6. At this point, chloramphenicol was added to the culture at a final concentration of 100 μg/ml, and the culture was further incubated for 1 h. The cells (1.5 ml) were harvested by centrifugation and washed once in 1 M NaCl–10 mM Tris-Cl (pH 7.6). The cells were then resuspended in 150 μl of the same buffer and kept at 50°C. An equal volume of 2% agarose (Bio-Rad) prepared in the same buffer was mixed with the cells and poured into a 100-μl casting mold. It was kept at 4°C for 10 min for the agarose plugs to set. Then, the plugs were transferred into 1 ml of 30 mM Tris–25 mM EDTA–250 mM NaCl (pH 8.0) containing 20 mg of lysozyme and 58 μl of 1 M sucrose and incubated at 37°C for 4 h. After the incubation, 40 μl of 20% sodium dodecyl sulfate (SDS) (final concentration of 0.8%) was added, and the mixture was incubated at 60°C for 30 min. Then, 150 μl of proteinase K (Roche) at a final concentration of 2 mg/ml was added, and the mixture was incubated at 50°C overnight. The plugs were washed twice in 20 ml of 10 mM Tris–10 mM EDTA and once in 10 mM Tris–1 mM EDTA, each time for 2 h by gentle swirling at room temperature. Plugs (100 μl) were digested with 4 μl of SmaI (Roche) (10 U/μl), 30 μl of 10× reaction buffer, and 166 μl of H2O at 25°C overnight. They were loaded into the wells of a 1% agarose gel (100 ml). Pulsed-field gel electrophoresis (PFGE) was performed with the CHEF DR-II apparatus (Bio-Rad) at the following parameters: voltage, 6 V/cm; switching time, 1 s initial and 20 s final; running time, 18 h; and running temperature, 14°C. The running buffer was 0.5× Tris-borate EDTA TBE (2 liters).
Preparation and analysis of protein.
Cells were grown in M17GStd (10 ml) until the stationary phase and then were diluted down to give a final OD600 of 1.0. They were chilled in ice-water and harvested by centrifugation. They were resuspended in 20 mM Na2HPO4 (1.5 ml) and then dispensed into a small test tube (12 by 75 mm) containing 2 g of sterile glass beads (150 to 212 μm in diameter) (Sigma). It was vortexed at the highest setting for 30 s and then chilled in ice-water for 1 min until the total vortexing time was 6 min. The glass beads were allowed to settle to the bottom, and the supernatant was transferred to a microcentrifuge tube, which was centrifuged at 12,000 rpm for 15 min at 4°C. The supernatant was transferred to a new tube and stored at −20°C until analysis. The protein isolated was electrophoresed with SDS-polyacrylamide gel electrophoresis (PAGE) gel (4 to 15% Tris-HCl) (Bio-Rad) at 125 V for 75 min. The gel was stained with Coomassie brilliant blue (G-250) (21).
Growth response studies.
The isolates and the parent were inoculated into M17GStd, M17GLim, and M17(no glucose) medium (100 ml) at an initial OD600 of 0.02, and samples were collected hourly for OD600 determination. The relative percent maximum OD (ODmax) was calculated by dividing the ODmax of each isolate by the ODmax of the parent for each medium. Each experiment was done in triplicate, and representative and mean results are shown. For growth responses on different sugars, samples were streaked for single colonies on M17 containing 0.5% lactose, maltose, or ribose. Bromcresol purple (0.004%) was also added as a pH indicator.
Assessment of stress response.
The following stresses were used: acid stress, M17GStd at pH 2.8 (adjusted with hydrochloric acid); bile salt stress, M17GStd containing 0.1% bile salt (sodium cholate and sodium deoxycholate [1:1]) (Sigma); heat stress, M17GStd at 49°C; and hydrogen peroxide stress, M17GStd containing 3 mM H2O2. The isolates, as well as the parent, were grown to mid-log phase, and a time zero sample was collected. The cells were immediately harvested, resuspended in M17GStd containing each of the stresses, and incubated at 30°C for 1 h. In the case of heat stress, the cells were incubated at 49°C instead of 30°C. A 1-h sample was collected from each culture. The number CFU of each sample was determined, and the percentage of survival was determined by dividing CFU at 1 h by CFU at time zero. Each experiment was done in triplicate, and mean results are shown.
RESULTS
Growth kinetics in standard and glucose-limiting media.
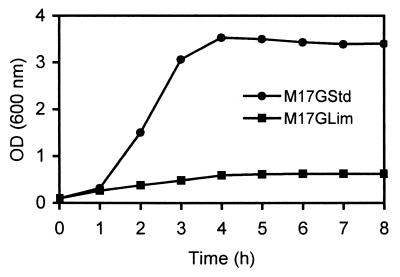
The growth of L. lactis LL41-1 in standard (M17GStd) and glucose-limiting (M17GLim) media was analyzed (Fig. 1). The aim was to examine the effect of altering the level of glucose on the nature of the transition phase. The M17GStd medium supported rapid growth to a maximum OD600 of 3.4. In contrast, the M17GLim medium supported slow growth to a maximum OD600 of only 0.62. In the M17GStd medium, the transition phase between the log and stationary phases was sudden and short, whereas in the M17GLim medium, it was gradual and protracted.
FIG. 1.
Growth of L. lactis in standard medium (M17GStd) and glucose-limiting medium (M17GLim).
Survival of cells during long-term starvation.
The survival of cells that were grown and maintained under different conditions was investigated. In the first case, the cells were grown in M17GStd and were kept in the resultant spent medium. In the second case, the cells were grown in M17GStd, and once the stationary phase was reached, they were harvested and transferred into fresh M17 (no glucose). Finally, in the third case, the cells were grown in M17GLim and were kept in the resultant spent medium. The number of viable cells (in terms of CFU) was determined for up to 350 days. For each case, the experiment was performed in triplicate.
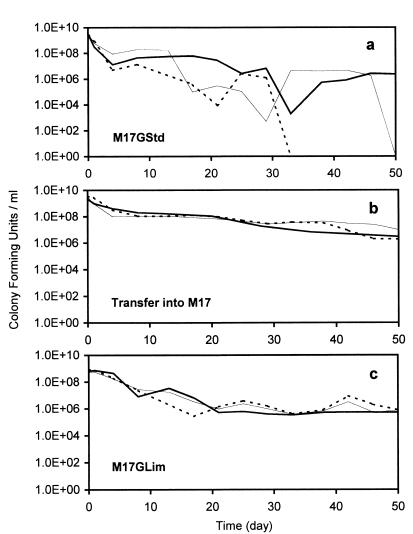
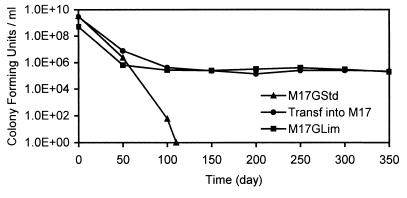
In the first case, the number of viable cells decreased in the first 4 days in all three of the triplicate cultures (Fig. 2a). Following that point, the number of viable cells fluctuated considerably and was variable in the three cultures. There were no viable cells at 33 days in one culture, 50 days in another (Fig. 2a), and 110 days in the third (Fig. 3). The pH of each culture at those times was 5.1. To test the effect, if any, of this pH on cell survival, the freshly prepared cells from another M17GStd culture were transferred into fresh M17 (no glucose) adjusted to pH 5.1 (with hydrochloric acid), and the number of viable cells was determined. The number of viable cells of this culture remained relatively high for the 350 days it was monitored (data not shown).
FIG. 2.
Survival of cells during starvation for 50 days. The cells were first cultured to the stationary phase in M17GStd and were kept in the resultant spent medium (a), first cultured to stationary phase in M17GStd and then transferred into M17(no glucose) (b), or first cultured to stationary phase in M17GLim and kept in the resultant spent medium (c). Each experiment was done in triplicate, and the results of each of the triplicate experiments are shown.
FIG. 3.
Survival of cells during starvation for 350 days. One of each type of culture (Fig. 2) was maintained for 350 days.
In the second case [M17GStd culture transferred to M17 (no glucose)], the number of viable cells decreased gradually in all three triplicate cultures, and at 50 days, the numbers of CFU were still relatively high (Fig. 2b). The pH at 50 days was 6.8. One of the cultures was maintained further, and at 350 days, the number of viable cells was 2.2 × 10⁵ CFU/ml (Fig. 3). In the third case, the number of viable cells decreased over time, although slight fluctuations were evident in all three triplicate cultures (Fig. 2c). The overall decrease was small, and at 50 days, the number of viable cells was still relatively high. The pH at 50 days was 6.5. One of the cultures was maintained further, and at 350 days, the number of viable cells was 2.0 × 10⁵ CFU/ml.
Starvation-associated changes to colony morphology and cell size.
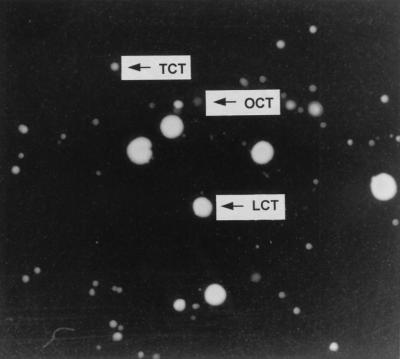
The M17GLim culture at 1 year was plated out onto M17GStd plates for single colonies, and after 4 days of incubation, three distinctive colony morphotypes were evident (Fig. 4). The most numerous type was the tiny colony type (TCT), followed by the large colony type (LCT), and then the opaque colony type (OCT). The OCT was slightly bigger than the average-size TCT and a shade lighter. The TCT/LCT/OCT ratio was approximately 60:10:1. Freshly grown parent cells formed large and uniform-size colonies. The size of LCT resembled that of the parent colonies. When the same plates were incubated for a further 7 days, all colony morphotypes remained unchanged. Two of each type were randomly chosen and streaked out for single colonies four times on the same medium. Following the subculturings, the colony morphotypes, in general, were still intact; however, both TCT isolates and OCT isolates became slightly larger than when they were first plated. Nevertheless, they were still smaller than the LCT. The six isolates were stocked in glycerol and stored at −20°C. After the storage, the colony morphotypes remained unchanged.
FIG. 4.
Different colony morphotypes of cells from the 1-year-old M17GLim culture. The culture was spread plated on M17GStd solid medium and incubated for 4 days.
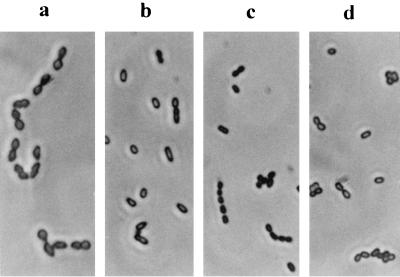
The isolates were examined under a phase-contrast microscope at a ×100 magnification (Fig. 5). Freshly prepared parent cells were also examined. All isolate cells were significantly smaller than the parent cells, despite the fact that they were “enriched” in M17GStd prior to the microscopic examination. Among the three colony morphotypes, the LCT was slightly bigger than the OCT, and the TCT was noticeably the smallest.
FIG. 5.
Cell morphology of each colony type isolated from the 1-year-old M17GLim culture (magnification, ×100). Freshly prepared parent cells (a) were compared to the three colony types, the LCT (b), the TCT (c), and the OCT (d).
The same M17GLim culture was further maintained, and at 2 years, it was plated out onto M17GStd plates. After 4 days of incubation, tiny colonies appeared at frequency of 2.3 × 10³ CFU/ml. All colonies were similar in size and appearance. Four colonies were randomly chosen, and they were streaked out for single colonies five times on the same medium. With each subculturing, the four isolates required 4 days to form the tiny colonies. These isolates were much smaller than the TCT isolates from the 1-year-old culture. The isolates were stocked in glycerol and stored at −20°C.
Effect of starvation on the plasmid DNA.
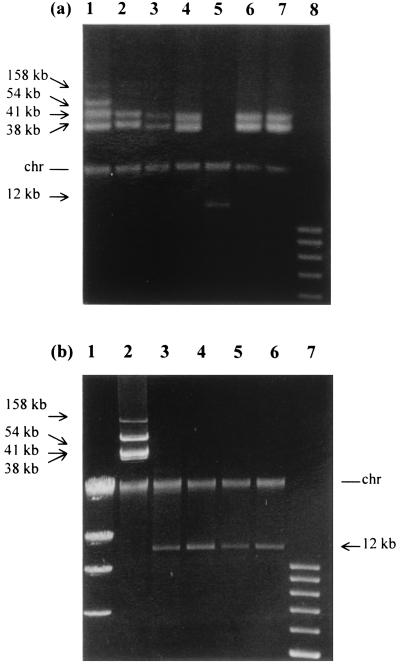
Plasmid DNA isolation was performed on all isolates (i.e., two isolates of each colony morphotype from the 1-year-old M17GLim culture [Fig. 6a] and the four isolates from the 2-year-old M17GLim culture [Fig. 6b]). Plasmid DNA was also isolated from freshly prepared parent cells. The parent cells contained four plasmids, and their sizes were 158, 54, 41, and 38 kb. The two LCT isolates possessed the 41- and 38-kb plasmids and had lost the other two larger plasmids. Likewise, one of the TCT isolates possessed the 41- and 38-kb plasmids and had lost the other two larger plasmids. However, the other TCT isolate lacked all four original plasmids, but possessed a 12-kb plasmid that did not correspond in size to any of the original plasmids. The two OCT isolates possessed only the 41- and 38-kb plasmids. All four 2-year-old isolates had lost all four original plasmids and possessed only the 12-kb plasmid. The plasmids in each isolate were all stably maintained following several subculturings in M17GStd and also following stocking and storage at −20°C.
FIG. 6.
Plasmid profile of freshly prepared parent cells and the 1- and 2-year-old isolates. (a) Parent cells (lane 1), 1-year-old LCT isolates (lanes 2 and 3), 1-year-old TCT isolates (lanes 4 and 5), 1-year-old OCT isolates (lanes 6 and 7), and a plasmid standard ladder (lane 8) are shown. (b) λ-HindIII standard (lane 1), parent cells (lane 2), 2-year-old isolates (lanes 3 to 6), and a plasmid standard ladder (lane 7) are shown. The chromosomal band present in all DNA preparations is labeled “chr.”
Southern hybridization analysis of the 12-kb plasmid.
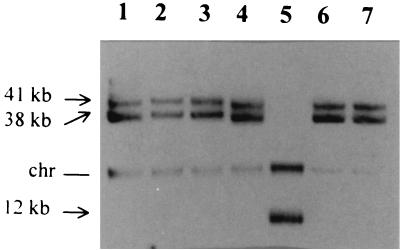
The 12-kb plasmid from a 2-year-old isolate was used as a probe against the plasmid DNA of the 1-year-old isolates (Fig. 7). The plasmid DNA of the parent strain was used as a control. Positive signals were obtained for the 41- and 38-kb plasmids wherever present. Hybridization to the 12-kb plasmid was observed in the TCT isolate (lane 5), and it also appeared to hybridize to the chromosome in that isolate. Hybridization to the 2-year-old isolates was similar to that observed in the TCT isolate in lane 5 (data not shown).
FIG. 7.
Southern hybridization with the 12-kb-plasmid probe against the plasmid DNA of freshly prepared parent cells and the 1-year-old isolates. Parent cells (lane 1), the 1-year-old LCT isolates (lanes 2 and 3), the 1-year-old TCT isolates (lanes 4 and 5), and the 1-year-old OCT isolates (lanes 6 and 7) are shown. The chromosomal band present in all DNA preparations is marked with “chr.”
PFGE of chromosomal DNA.
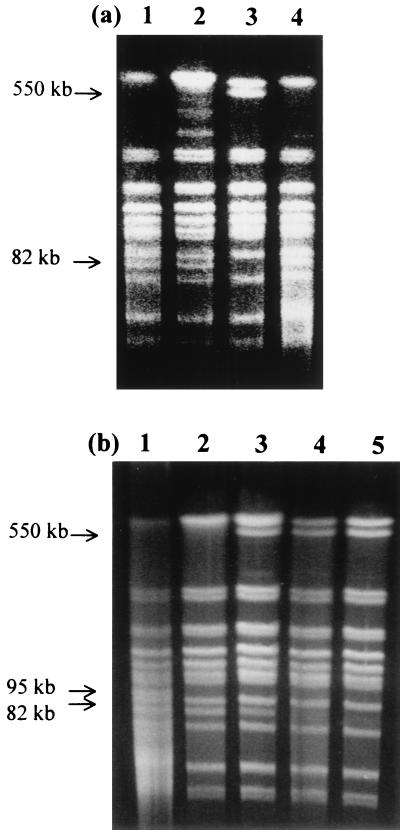
Chromosomal DNA of the 1-year-old (Fig. 8a) and the 2-year-old (Fig. 8b) isolates was digested with SmaI and was subjected to PFGE. Most of the fragments in the isolates matched the size of those in the parent. However, there were a few exceptions. The 82-kb fragment present in the parent was missing in the 1-year-old TCT isolate and in two of the 2-year-old isolates. A 550-kb fragment absent in the parent was present in one of the TCT isolates and in three of the 2-year-old isolates. A 95-kb fragment present in the parent was absent in all of the 2-year-old isolates.
FIG. 8.
PFGE of DNA fragments from freshly prepared parent cells and the 1- and 2-year-old isolates. The chromosomal DNA from each was isolated, digested with SmaI, and subjected to PFGE. (a) Parent cells (lane 1), the 1-year-old LCT isolate (lane 2), the 1-year-old TCT isolate (lane 3), and the 1-year-old OCT isolate (lane 4) are shown. (b) Parent cells (lane 1) and 2-year-old isolates (lanes 2 to 5) are shown.
Protein analysis.
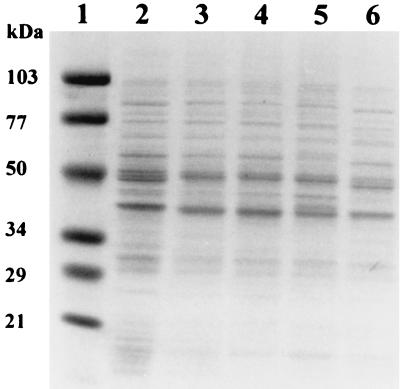
Total protein was prepared from the isolates and was compared to that of the parent. A similar number of cells of each strain were used in the protein preparation. The protein profile of the isolates was similar to that of the parent; however, the overall level of protein expressed appeared to be lower in all of the isolates than in the parent, the 2-year-old isolate being the lowest (Fig. 9). A few of the proteins present in the parent appeared to be missing in the isolates: i.e., the 44-kDa protein was missing in all the isolates, the 46-kDa protein was missing only in the 2-year-old isolate, and the 48-kDa protein was present only in the 2-year-old isolate. A number of proteins not present in the parent appeared in the isolates: i.e., the 96-kDa protein of TCT, the 62- and 42-kDa proteins of OCT, and the 72-kDa of the 2-year-old isolate.
FIG. 9.
Total protein isolated from freshly prepared parent cells and the 1- and 2-year-old isolates. Parent cells (lane 2), the 1-year-old LCT isolate (lane 3), the 1-year-old TCT isolate (lane 4), the 1-year-old OCT isolate (lane 5), and the 2-year-old isolate (lane 6) are shown. A protein standard is shown in lane 1.
Growth response under different energy levels.
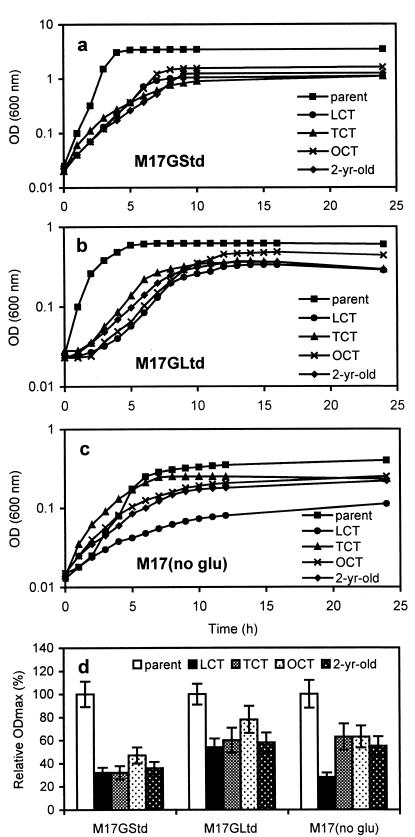
The growth of the isolates under different energy (glucose) levels was investigated and was compared to that of the parent (Fig. 10a, b, and c). At 0.5% glucose (M17GStd), the parent grew faster and to a higher ODmax than the isolates. Despite the abundance of nutrients, including glucose in the medium, the isolates were unable to grow as well as the parent, and all reached the stationary phase by 10 h. Another measurement was taken at 48 h, and the OD reading remained unchanged from that at 24 h. At 0.025% glucose (M17GLim), the growth of all strains was reduced, and at 0% glucose, it was reduced even further. However, the growth of each isolate relative to that of the parent was higher for both M17GLim and M17(no glucose) compared to M17GStd (Fig. 10d). One exception was the LCT in the M17(no glucose) medium. In a separate study, the isolates and the parent were tested for growth response on M17 containing lactose, maltose, or ribose as the sole energy source. The parent can grow by using all three. However, none of the isolates could grow by using any of the energy sources.
FIG. 10.
Growth of parent cells and the 1- and 2-year-old isolates under different energy (glucose) levels. Panels a through c show results with 0.5% glucose (a), 0.025% glucose (b), and no glucose (c). (d) ODmax of each isolate relative to that of the parent at each glucose level.
Stress response.
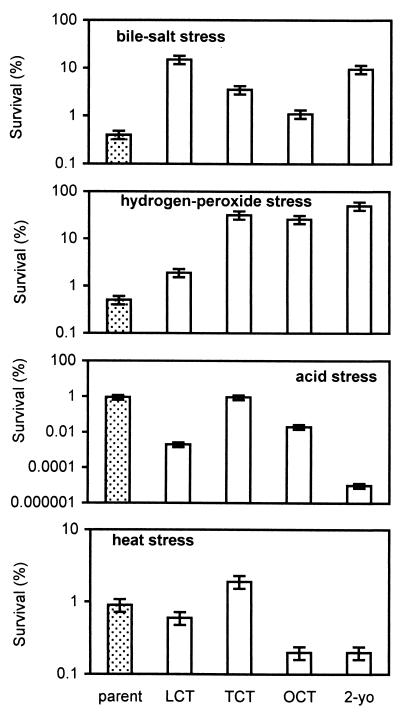
The stress response of the isolates was examined to see whether it had been altered by starvation. The cells were grown to mid-log phase and were directly exposed to each of the four severe stresses. The survival was compared to that of the parent (Fig. 11). Against both the bile salt stress and the hydrogen peroxide stress, all of the isolates exhibited superior survival compared to the parent. However, against the acid stress and the heat stress, all of the isolates, except the TCT, exhibited inferior survival compared to the parent. The extent of increase or decrease in survival, compared to that of the parent, varied depending on the stress applied. The TCT displayed the highest overall resistance against the four stresses. The 2-year-old isolate showed relatively high resistance against the bile salt stress and the hydrogen peroxide stress, whereas against the acid stress and the heat stress, it showed relatively low resistance.
FIG. 11.
Response of each isolate and the parent to the bile salt, hydrogen peroxide, acid, and heat stresses. 2-yo., 2-year-old isolate.
DISCUSSION
The medium in which the cells were kept had a significant effect on the survival of cells during long-term starvation, as was shown in the comparison between the M17(no glucose) medium and the M17GStd spent medium. In the M17(no glucose) medium, the number of viable cells decreased gradually and was still relatively high at 350 days, whereas in the M17GStd spent medium, there were no viable cells by 110 days. Unlike the cells that were kept in the M17GStd spent medium, the cells that were transferred into the M17(no glucose) medium would not have been exposed to the harmful end products. The cells that were kept in the M17GLim spent medium exhibited a pattern of survival similar to that of the M17(no glucose) medium. The level of end products in the M17GLim spent medium would be expected to be low, because of the low level of growth supported by this medium. The level of end products is also indicated by the measurement of pH. The pH was 6.8 for the M17(no glucose) medium, pH 6.5 for the M17GLim spent medium, and only 5.1 for the M17GStd spent medium. The pH of 5.1 itself, however, was shown not to be the cause of the rapid viability decline observed in the M17GStd spent medium. Furthermore, cells at stationary phase would be expected to be inherently resistant to such a pH level (7, 12, 16).
L. lactis is homofermentative, and under the usual conditions, including the one used in this study, glucose is converted to the single end product lactic acid via the Embden-Meyerhof glycolytic pathway (27). Therefore, lactic acid in the spent medium would likely have been a key factor effecting survival of cells during long-term starvation. Other end products resulting from metabolism of other substrates in the medium are in low concentrations in the spent medium and therefore would be unlikely to assert a strong influence on the cell survival. Furthermore, lactic acid has been identified in spent medium as the end product that effects growth, and at 6%, it stops growth altogether (2).
The nature of the transition phase between the log and stationary phases has been proposed to have an effect on the survival of cells during long-term starvation (15). It is understood that a gradual and protracted transition phase allows cells to respond to the nutrient-limiting situation, preparing themselves for imminent starvation. The transition phase in the M17GStd cultures was relatively sudden and short, whereas in the M17GLim cultures, it was relatively gradual and protracted. However, despite the sudden and short transition phase of the M17GStd cultures, once the cells were transferred into fresh M17(no glucose), they were able to survive as well as those that underwent a gradual and protracted transition phase, as was the case with the M17GLim cultures. It therefore appears that with L. lactis cultures, the nature of the transition phase is not significant in effecting survival of cells during long-term starvation.
Apart from the detrimental effect of spent medium on survival of cells during long-term starvation, the spent medium may have provided selection pressure for growth of mutant populations. This may explain why there were large fluctuations in the M17GStd cultures, small fluctuations in the M17GLim cultures, and virtually no fluctuations in the transferred cultures. For mutant cells to grow under such an unfavorable condition, they must possess an ability to withstand the lactic acid present in the spent medium and also possess an ability to utilize an energy source other than the depleted glucose. It appears that the mutant populations arose randomly, because each M17GStd culture with an identical initial condition produced vastly different fluctuations. It is known that during starvation there is an inherent decrease in replication fidelity and repair activity, such as the DNA mismatch repair system (19). If such a system is compromised, then there would be an increase in the mutation frequency, leading to a greater genetic variability. There is growing evidence that bacterial cells during long-term starvation undergo continuous mutational changes resulting in heterogeneous populations (5, 8). A bacterial culture during long-term starvation cannot be seen as static or stationary, but as dynamic in terms of cell number and cell type.
Generation of new alleles or alteration of gene expression would be potentially advantageous during starvation, during which an intense competition for energy exists. Possession of appropriate new alleles or variation of gene expression may allow cells to utilize energy sources that could not be utilized before and/or utilize any existing energy source much more efficiently. The M17G medium exhausted for glucose would still contain small amounts of nutrients, such as polypeptides and oligopeptides, and they may provide an alternative source of energy for those cells that could use them. L. lactis cannot accumulate carbonaceous storage compounds, such as glycogen, and therefore the energy has to come from outside of the cell (i.e., spent medium). An energy source may come from the breakup of many dead cells in spent media (4, 20).
When the freshly prepared isolates were grown under energy-limiting and energy-nonlimiting conditions and compared to the growth of the parent under the same conditions, the isolates were able to grow to a higher OD relative to the parent in the energy-limiting conditions than in the energy-nonlimiting condition. The growth of the isolates was less affected by the apparent lack of energy in the medium compared to that of the parent. It can be said that the isolates displayed a growth advantage under the energy-limiting condition. Moreover, unlike the parent, the isolates appeared not to be totally dependent on the level of energy present in the medium, because despite the abundant energy remaining in the M17GStd medium, the isolates were not able to grow to the same cell densities as the parent.
A strategy bacterial cells use to conserve energy during starvation is the reduction of cell size. The reduced form has been observed for several bacterial species (14), and the longer the starvation period, the smaller the cells become, until they reach a minimum size (18). In this study, the isolates had become significantly smaller than the freshly grown parent cells. Reduction in the plasmid number could be another strategy used by L. lactis to conserve energy during starvation. It would be much more energy conservative to maintain fewer plasmids. The parent cells normally possess four plasmids; however, the 1-year-old isolates possessed a maximum of two plasmids, and all of the 2-year-old isolates possessed only one plasmid. The two biggest plasmids were missing in all of the isolates examined. Plasmid stability during starvation has also been reported with other bacterial species. It has been shown that in E. coli (3), Aeromonas salmonicida (17), and Klebsiella spp. (28), the number of plasmids possessed by the cells also decreased during starvation; however, in some cases, all plasmids were stably maintained for extremely long periods of starvation. Introduced plasmids were readily lost, as expected, once the selection pressure was removed.
What was interesting was the fact that 12-kb plasmid, possessed by all of the 2-year-old isolates and by the 1-year-old TCT isolate, did not correspond in size to any of the original plasmids. Not only the number of plasmids was reduced with starvation, but also a “new” plasmid was generated. Hybridization analyses indicate that the plasmid may have originated from a recombination of the 41- and 38-kb plasmids. A positive hybridization signal was also evident with the chromosomal DNA of the 12-kb plasmid-carrying TCT isolate, indicating that those two plasmids or components of the two plasmids may have integrated into the chromosome. Positive hybridization signals were not evident with the 158- and 54-kb plasmids, and perhaps these two plasmids were not part of the survival strategy. This is further supported by the fact that these two plasmids were lost earlier than the 41- and 38-kb plasmids.
The new plasmid may contain indispensable traits that are necessary for survival during long-term starvation. It is not known whether whole genes or segments of genes from the original plasmids were used in generating the new plasmid. It is possible that segments of genes were shuffled to create “new” genes or to alter expression of existing genes. All four randomly chosen isolates from the 2-year-old culture possessed the 12-kb plasmid. Because the same-size plasmid was present in all of the 2-year-old isolates examined, the DNA rearrangement and the resultant plasmid observed could be a result of the same inherent program operating in those cells. Apart from the changes to the plasmid DNA, it was shown that the chromosomal DNA was also altered in the isolates. Likewise, it has been shown that the chromosomal DNA of E. coli changed when subjected to long-term starvation (5). The changes that had taken place in the isolates were also evident in the gene expressed and in the inability to utilize lactose, maltose, or ribose. Another change, which could be important in the survival during starvation, was the increased resistance against the bile salt and hydrogen peroxide stresses. However, the isolates displayed variable response against the acid and heat stresses.
Significant cellular changes invariably occur when cells enter the stationary phase, which is caused primarily by starvation. The change process appears fixed in some bacterial species and variable in others. In differentiating bacteria, the differentiation process is under the control of an inherent program and therefore follows a single path resulting in the same end form (i.e., in sporulation, cells are transformed into spores). In nondifferentiating bacteria, the process of change during starvation appears to vary from cell to cell, as observed in the M17GLim culture, where the same cells at the beginning of starvation proceeded to different end forms. Some were transformed into TCT cells, whereas others were transformed into OCT cells, and some possessed two plasmids, whereas others possessed a new plasmid. It appears that for nondifferentiating bacteria, the starvation-induced changes are not restricted to a single path as is the case with differentiating bacteria. Perhaps, the starvation change process in nondifferentiating bacteria is not solely determined by the starvation alone, but can be influenced by other factors (i.e., environmental stimuli or other factors undefined). If this is the case, would it be possible to effect the starvation change process by exposing the starving culture to an external element? Perhaps a different condition could be introduced at the beginning of starvation to coerce the cells into a certain starvation change process. The different conditions introduced could result in cells developing vastly different phenotypes. Greater understanding of how starving cells undergo change may facilitate new strategies for development of cell lines with advantageous traits. It may also lead to manipulation of the control of genes specific to the starvation situation.
ACKNOWLEDGMENT
This work was supported by the Cooperative Research Centre for Food Industry Innovation of Australia.
REFERENCES
- 1.Anderson D G, McKay L L. Simple and rapid method for isolating large plasmid DNA from lactic streptococci. Appl Environ Microbiol. 1983;46:549–552. doi: 10.1128/aem.46.3.549-552.1983. [DOI] [PMC free article] [PubMed] [Google Scholar]
- 2.Bibal B, Goma G, Vayssier Y, Pareilleux A. Influence of pH, lactose and lactic acid on the growth kinetics of Streptococcus cremoris, a kinetic study. Appl Microbiol Biotechnol. 1988;28:340–344. [Google Scholar]
- 3.Byrd J J, Colwell R R. Maintenance of plasmids pBR322 and pUC8 in nonculturable Escherichia coli in the marine environment. Appl Environ Microbiol. 1990;56:2104–2107. doi: 10.1128/aem.56.7.2104-2107.1990. [DOI] [PMC free article] [PubMed] [Google Scholar]
- 4.Druilhet R E, Sobek J M. Starvation survival of Salmonella enteritidis. J Bacteriol. 1976;125:119–124. doi: 10.1128/jb.125.1.119-124.1976. [DOI] [PMC free article] [PubMed] [Google Scholar]
- 5.Finkel S E, Kolter R. Evolution of microbial diversity during prolonged starvation. Proc Natl Acad Sci USA. 1999;96:4023–4027. doi: 10.1073/pnas.96.7.4023. [DOI] [PMC free article] [PubMed] [Google Scholar]
- 6.Foster J W, Spector M P. How Salmonella survive against the odds. Annu Rev Microbiol. 1995;49:145–174. doi: 10.1146/annurev.mi.49.100195.001045. [DOI] [PubMed] [Google Scholar]
- 7.Hecker M, Schumann W, Volker U. Heat-shock and general stress response in Bacillus subtilis. Mol Microbiol. 1996;19:417–428. doi: 10.1046/j.1365-2958.1996.396932.x. [DOI] [PubMed] [Google Scholar]
- 8.Helling R B, Vargas C N, Adams J. Evolution of Escherichia coli during growth in a constant environment. Genetics. 1987;116:349–358. doi: 10.1093/genetics/116.3.349. [DOI] [PMC free article] [PubMed] [Google Scholar]
- 9.Hurst A. Nisin. Adv Appl Microbiol. 1981;27:85–123. [Google Scholar]
- 10.Kjelleberg S, Albertson N, Flardh K, Holmquist L, Jouperjaan A, Marouga R, Ostling J, Svenblad B, Weichart D. How do nondifferentiating bacteria adapt to starvation. Antonie Leeuwenhoek. 1993;63:331–341. doi: 10.1007/BF00871228. [DOI] [PubMed] [Google Scholar]
- 11.Kolter R, Siegele D A, Tormo A. The stationary phase of the bacterial life-cycle. Annu Rev Microbiol. 1993;47:855–874. doi: 10.1146/annurev.mi.47.100193.004231. [DOI] [PubMed] [Google Scholar]
- 12.Loewen P C, Hengge-Aronis R. The role of the sigma factor ςs (KatF) in bacterial global regulation. Annu Rev Microbiol. 1994;48:53–80. doi: 10.1146/annurev.mi.48.100194.000413. [DOI] [PubMed] [Google Scholar]
- 13.Losick R, Shapiro L. Microbial development. Cold Spring Harbor, N.Y: Cold Spring Harbor Laboratory Press; 1984. [Google Scholar]
- 14.MacDonell M T, Hood M A. Isolation and characterization of ultramicrobacteria from a Gulf Coast estuary. Appl Environ Microbiol. 1982;43:566–571. doi: 10.1128/aem.43.3.566-571.1982. [DOI] [PMC free article] [PubMed] [Google Scholar]
- 15.Mason C A, Egli T. Dynamics of microbial growth in the decelerating and stationary phases of batch culture. In: Kjelleberg S, editor. Starvation in bacteria. New York, N.Y: Plenum Press; 1993. pp. 81–102. [Google Scholar]
- 16.Matin A. The molecular basis of carbon-starved-induced general resistance in Escherichia coli. Mol Microbiol. 1991;5:3–10. doi: 10.1111/j.1365-2958.1991.tb01819.x. [DOI] [PubMed] [Google Scholar]
- 17.Morgan J A W, Cranwell P A, Pickup R W. Survival of Aeromonas salmonicida in lake water. Appl Environ Microbiol. 1991;57:1777–1782. doi: 10.1128/aem.57.6.1777-1782.1991. [DOI] [PMC free article] [PubMed] [Google Scholar]
- 18.Novitsky J A, Morita R Y. Morphological characterization of small cells resulting from nutrient starvation in a psychrophilic marine vibrio. Appl Environ Microbiol. 1976;32:617–622. doi: 10.1128/aem.32.4.617-622.1976. [DOI] [PMC free article] [PubMed] [Google Scholar]
- 19.Priebe S D, Hadi S M, Greenberg B, Lacks S A. Nucleotide sequence of the hexA gene for DNA mismatch repair in Streptococcus pneumoniae and homology of hexA to mutS of Escherichia coli and Salmonella typhimurium. J Bacteriol. 1988;170:190–196. doi: 10.1128/jb.170.1.190-196.1988. [DOI] [PMC free article] [PubMed] [Google Scholar]
- 20.Ryan F J. Bacterial mutation in a stationary phase and the question of cell turnover. J Gen Microbiol. 1959;21:530–549. doi: 10.1099/00221287-21-3-530. [DOI] [PubMed] [Google Scholar]
- 21.Sambrook J, Fritsch E F, Maniatis T. Molecular cloning: a laboratory manual. 2nd ed. Cold Spring Harbor, N.Y: Cold Spring Harbor Laboratory Press; 1989. [Google Scholar]
- 22.Shapiro L, Kaiser D, Losick R. Development and behavior in bacteria. Cell. 1993;73:835–836. doi: 10.1016/0092-8674(93)90264-q. [DOI] [PubMed] [Google Scholar]
- 23.Siegele D A, Almiron M, Kolter R. Approaches to the study of survival and death in stationary-phase Escherichia coli. In: Kjelleberg S, editor. Starvation in bacteria. New York, N.Y: Plenum Press; 1993. pp. 151–169. [Google Scholar]
- 24.Smith I, Slepecky R A, Setlow P, editors. Regulation of prokaryotic development. Structural and functional analysis of bacterial sporulation and germination. Washington, D.C.: American Society for Microbiology; 1989. [Google Scholar]
- 25.Sonenshein A L. Metabolic regulation of sporulation and other stationary-phase phenomena. In: Smith I, Slepecky R A, Setlow P, editors. Regulation of prokaryotic development, structural and functional analysis of bacterial sporulation and germination. Washington, D.C.: American Society for Microbiology; 1989. pp. 109–130. [Google Scholar]
- 26.Terzaghi B E, Sandine W E. Improved medium for lactic streptococci and their bacteriophages. Appl Microbiol. 1975;29:807–813. doi: 10.1128/am.29.6.807-813.1975. [DOI] [PMC free article] [PubMed] [Google Scholar]
- 27.Thompson J, Thomas T D. Phosphoenolpyruvate and 2-phosphoglycerate: endogenous energy source(s) for sugar accumulation by starved cells of Streptococcus lactis. J Bacteriol. 1977;130:583–595. doi: 10.1128/jb.130.2.583-595.1977. [DOI] [PMC free article] [PubMed] [Google Scholar]
- 28.Trevors J T, van Elsas J D, Starodub M E, van Overbeek L S. Survival of and plasmid stability in Pseudomonas and Klebsiella spp. introduced into agricultural drainage water. Can J Microbiol. 1989;35:675–680. doi: 10.1139/m89-110. [DOI] [PubMed] [Google Scholar]
- 29.Wells J M, Robinson K, Chamberlain L M, Schofield K M, Le Page R W F. Lactic acid bacteria as vaccine delivery vehicles. Antonie Leeuwenhoek. 1996;70:317–330. doi: 10.1007/BF00395939. [DOI] [PubMed] [Google Scholar]
- 30.Zambrano M M, Siegele D A, Almiron M, Tormo A, Kolter R. Microbial competition: Escherichia coli mutants that take over stationary phase cultures. Science. 1993;259:1757–1760. doi: 10.1126/science.7681219. [DOI] [PubMed] [Google Scholar]
- 31.Zusman D R. Development program of Myxococcus xanthus. In: Rosenberg E, editor. Development and cell interactions. New York, N.Y: Springer; 1984. pp. 185–213. [Google Scholar]


