

Abstract
Objective
To develop a multivariable model assessing factors predicting a second‐dose response to eptinezumab treatment over weeks 13–24 in patients with migraine initially reporting a suboptimal response over weeks 1–12.
Background
Eptinezumab is a monoclonal antibody used for migraine prevention, administered every 12 weeks. In the PROMISE‐1 and PROMISE‐2 studies, the first‐dose response to eptinezumab treatment (≥50% monthly migraine day [MMD] reduction over weeks 1–12) occurred in ~50–60% of patients with episodic (EM) and chronic migraine (CM), respectively.
Methods
This post hoc analysis included patients with suboptimal first‐dose response (<50% MMD reduction over weeks 1–12) with EM and CM, with patient‐reported outcome data at weeks 12 and 24. Eptinezumab 100 and 300 mg doses were pooled.
Results
The analysis included 416/888 patients (46.8%) from PROMISE‐1 and 479/1072 patients (44.7%) from PROMISE‐2 with suboptimal first‐dose response. The proportion of suboptimal first‐dose responders who were second‐dose responders was 37.0% (71/192; eptinezumab) and 33.9% (42/124; placebo) in PROMISE‐1 and 28.8% (79/274) and 18.5% (38/205) in PROMISE‐2. Significant first‐dose predictors of second‐dose response were percent change in MMDs across weeks 1–12 (PROMISE‐1, odds ratio [OR]: 0.97, 95% confidence interval [CI]: 0.95, 0.98, p = 0.0001; PROMISE‐2, OR: 0.94, CI: 0.92, 0.96, p < 0.0001) and change in 6‐item Headache Impact Test (HIT‐6) total score (PROMISE‐2 only, OR: 0.92; CI: 0.87, 0.98; p = 0.027). In PROMISE‐1, the probability of second‐dose response ranged from 21.7% in patients with first‐dose 0% MMD change to 56.0% in patients with first‐dose 45% MMD reduction. In PROMISE‐2, depending on HIT‐6 total score, probability of second‐dose response ranged from 5.9–12.1% in patients with first‐dose 0% MMD change to 54.2%–72.3% in patients with first‐dose 45.0% MMD reduction.
Conclusion
Individuals with migraine not experiencing ≥50% MMD response to their first dose of eptinezumab may benefit from a second dose.
Keywords: chronic migraine, episodic migraine, eptinezumab, PROMISE‐1, PROMISE‐2, response
Abbreviations
- CI
confidence interval
- CM
chronic migraine
- eDiary
electronic diary
- EM
episodic migraine
- EQ‐5D‐5L VAS
EuroQol 5‐Dimensions 5‐Levels visual analog scale
- HIT‐6
6‐item Headache Impact Test
- MMD
monthly migraine day
- OR
odds ratio
- PE
parameter estimate
- PGIC
Patient Global Impression of Change
- PI‐MBS
patient‐identified most bothersome symptom
- SF‐36
36‐item Short‐Form Health Survey
INTRODUCTION
Patients with episodic (EM) and chronic migraine (CM) and their treating healthcare providers face complex treatment decisions. 1 Individuals with migraine experience migraine‐related disability and reduced quality of life, with impacts worsening with increasing migraine frequency. 2 , 3 Reducing the frequency of migraine attacks is a key goal of preventive treatment. Close to 40% of individuals with EM, and all of those with CM, are considered candidates for preventive migraine treatment 1 , 4 ; however, factors predicting patient response to preventive treatments have not been fully identified. Thus, patients and healthcare providers often rely on observation over time and trial and error to optimize treatment. 1 In particular, assessing the response to preventive treatment such as the calcitonin gene‐related peptide (CGRP)‐inhibitors may take 3–6 months, with emerging evidence suggesting that a patient's response to a first dose may differ from response to subsequent doses, with improvements possible. 1
Eptinezumab is an anti‐CGRP monoclonal antibody approved for the preventive treatment of migraine, administered in doses of 100 or 300 mg by intravenous (iv) infusion every 12 weeks. The phase 3 PROMISE‐1 and PROMISE‐2 studies assessed the efficacy and safety of eptinezumab in patients with EM and CM, respectively, administered every 12 weeks. 5 , 6 In both studies, the first dose of eptinezumab led to reductions in mean monthly migraine days (MMDs) over weeks 1–12. 5 , 6 A 50% reduction in migraine days relative to baseline is generally considered to be a positive response to treatment and a useful benchmark in both clinical trials and practice. 7 In both studies, treatment response, defined as an at least 50% reduction in MMDs, occurred in ~50%–60% of patients treated with eptinezumab over weeks 1–12. 5 , 6 In addition, this treatment response was observed on day 1 after dosing and was sustained across the entire treatment period. 8
The objective of this post hoc analysis of PROMISE‐1 and PROMISE‐2 data was to develop a multivariable prediction model to assess which factors among patients with migraine without an initial clinical improvement in response to treatment (defined as a <50% MMD response to a first eptinezumab infusion) predict a ≥50% MMD response to a second eptinezumab infusion. These results can inform expectations and guide treatment decisions for patients with a less than optimal response to their first preventive migraine treatment.
METHODS
Study design
PROMISE‐1 and PROMISE‐2 were both phase 3, multicenter studies, and both had a double‐blind, randomized, placebo‐controlled, parallel‐group design, with the full methods for both studies published previously. 5 , 6 Both studies were approved by independent ethics committees or institutional review boards for each study site. All clinical work was conducted in compliance with current Good Clinical Practices as referenced in the International Conference on Harmonisation of Technical Requirements for Registration of Pharmaceuticals for Human Use guidelines, local regulatory requirements, and the principles of the Declaration of Helsinki. All patients enrolled in the study provided written informed consent prior to participation, and both studies are registered on ClinicalTrials.gov (NCT02559895 [PROMISE‐1]; NCT02974153 [PROMISE‐2]). In brief, the PROMISE‐1 study enrolled adults aged 18–75 years diagnosed with migraine at or before age 50 years and with a history of migraine for at least 1 year that included fewer than 15 headache days per month and at least 4 migraine days per month in the 3 months before screening. Following a 4‐week screening period, patients were randomized in a 1:1:1:1 ratio to receive up to four treatments of eptinezumab 30, 100, or 300 mg, or placebo, administered intravenously on day 0, week 12, week 24, and week 36, with 12 scheduled visits (screening day and weeks 4, 8, 12, 16, 20, 24, 28, 36, 48, and 56). The 56 weeks were divided into a fully blinded primary efficacy and safety period (through week 24) and a long‐term safety period (through week 56). The PROMISE‐2 study enrolled adults aged 18–65 years diagnosed with migraine at ≤50 years of age who had a history of CM for ≥1 year before study screening that included between 15 and 26 headache days and at least 8 migraine days during the 28‐day screening period. Following a 4‐week screening period, patients were randomized in a 1:1:1 ratio to receive eptinezumab 100 mg, eptinezumab 300 mg, or placebo, administered intravenously on day 0 and at week 12, where the total study duration was 32 weeks, with 10 scheduled visits (screening, day 0, and weeks 2, 4, 8, 12, 16, 20, 24, and 32). 6 In both studies, change from baseline in MMDs over weeks 1‒12 was the primary efficacy endpoint, and proportion of patients with ≥50% reduction in MMDs was a key secondary endpoint.
Outcome measures
Patients completed a daily headache electronic diary (eDiary) to document headache and migraine and completed several well‐validated patient‐reported outcome instruments from the time of screening through week 48 (PROMISE‐1) and week 24 (PROMISE‐2). Two generic health‐related quality of life instruments were completed in both PROMISE‐1 and PROMISE‐2: the 36‐item Short‐Form Health Survey (SF‐36, v2.0) 9 and the EuroQol 5‐Dimensions 5‐Levels visual analog scale (EQ‐5D‐5L VAS). 10 The Patient Global Impression of Change (PGIC) 11 and patient‐identified most bothersome symptom (PI‐MBS) 12 measures were completed in the PROMISE‐2 study only. In addition, patients in PROMISE‐2 completed the 6‐item Headache Impact Test (HIT‐6, v1.0), 13 , 14 which measures the impact of headaches on daily function and has been validated across EM and CM populations. HIT‐6 scores range from 36‒78, with an at least 6‐point decrease in score considered meaningful to patients with CM. 15 Normalization was used to address missing migraine data in the primary efficacy analysis. If the eDiary was completed for 21 days out of a 4‐week interval, the observed frequency was normalized to 28 days by multiplying by the inverse of the completion rate. If the eDiary was completed for <21 days of a 4‐week interval, the results were calculated as a weighted function of the observed data for the current interval and the results from the previous interval, with the weight proportional to how many days the eDiary had been completed.
Post hoc analysis
The current post hoc analysis was limited to patients who were suboptimal responders over weeks 1–12 and who had patient‐reported outcome data available at weeks 12 and 24. Suboptimal responders were defined as patients with a <50% reduction from baseline in MMDs over weeks 1–12; responders were defined as patients with a ≥50% reduction from baseline in MMDs over weeks 1–12. Data from the two studies were analyzed separately. For each study, data from the eptinezumab 100 and 300 mg dose arms were pooled. The eptinezumab 100 and 300 mg doses have generally similar efficacy and safety profiles, and are expected to behave similarly, with pooling the populations providing a larger sample size for increased precision of estimation. Specifically, the 50% responder rate for 300 mg increased from the first to the second infusion by 9.0% and 2.6% for PROMISE‐1 and ‐2, respectively, and for 100 mg by 12.2% and 3.4% (Figure 1). Data for the eptinezumab 30 mg treatment arm were not included in the pooled population as it was only utilized in the PROMISE‐1 study and is not an approved dose. The following clinically helpful or common practice endpoints, measured over weeks 1‒12, were assessed as potential predictors of response status over weeks 13‒24, using logistic regression analysis: percent change in MMDs, change in SF‐36 scale scores, change in EQ‐5D‐5L VAS, and change in percent of severe pain headache. In addition, the following were evaluated for PROMISE‐2 only: change from baseline in HIT‐6 total score, change in PGIC, and change from baseline in severity of PI‐MBS. The full model included all potential predictor variables at week 12/weeks 1–12. A stepwise procedure was used to identify parameters. The stepwise selection procedure used 5% entry and 10% retention criteria. Values of p are two‐sided, with values below 0.05 considered significant. All analyses were conducted with SAS software (SAS Institute, Inc, Cary, NC) version 9.2 or higher.
FIGURE 1.

Percentage of patients with ≥50% migraine response by weeks 1–12 and weeks 13–24 and treatment group in (A) PROMISE‐1 (episodic migraine) and (B) PROMISE‐2 (chronic migraine)
RESULTS
Second‐dose responders
A total of 416 patients (46.8% of treated participants) with EM (PROMISE‐1) and 479 patients (44.7% of treated participants) with CM (PROMISE‐2) had a suboptimal <50% MMD response across weeks 1–12 and had patient‐reported outcome data available at weeks 12 and 24. In patients with EM, the proportion of suboptimal responders to the first eptinezumab infusion across weeks 1–12 who were responders to the second eptinezumab infusion across weeks 13–24 was 38.0% (38/100), 37.6% (38/101), and 36.3% (33/91) with eptinezumab 30, 100, and 300 mg, respectively, and was 37.0% (71/192) for the pooled eptinezumab 100 and 300 mg doses. The corresponding rate with placebo was 33.9% (42/124). In patients with CM, the proportion of suboptimal responders to the first eptinezumab infusion across weeks 1–12 who were responders to the second eptinezumab infusion across weeks 13–24 was 28.7% (41/143), and 29.0% (38/131) with eptinezumab 100 and 300 mg, respectively, and was 28.8% (79/274) for the pooled eptinezumab dose levels. The corresponding rate with placebo was 18.5% (38/205). The median additional decrease in patients treated with eptinezumab in MMDs post second infusion (weeks 13–24) was 13.9% (mean = 13.3%) for patients with EM and 6.5% (mean = 7.9%) for patients with CM; thus, 25% of those non‐responders after the first dose saw an additional decrease of over 25% (38.2% and 26.7%, respectively) (Figure 2). The HIT‐6 responder rate (≥6‐point score decrease) at week 12 in patients with CM overall was 47.2% (168/356) and 56.0% (196/350) with eptinezumab 100 and 300 mg, respectively, and was 36.3% (133/366) with placebo. In suboptimal first‐dose responders, the HIT‐6 responder rate at week 12 was 22.5% (34/151) and 29.6% (40/135) with eptinezumab 100 and 300 mg, respectively, and was 23.4% (52/222) with placebo.
FIGURE 2.

Difference in monthly migraine days between infusion 1 (weeks 1–12) and 2 (weeks 13–24) for infusion 1 non‐responders by study (PROMISE‐1, episodic migraine; PROMISE‐2, chronic migraine). MMD, monthly migraine days
First‐dose predictors of second‐dose response
The full logistic regression analysis (model including all possible predictors) of pooled data from the eptinezumab 100 and 300 mg treatment groups demonstrated that percent change in MMDs across weeks 1–12 was a significant first‐infusion predictor of second‐infusion ≥50% MMD response in patients with EM and CM; change in HIT‐6 total score, which was assessed only in patients with CM, was an additional significant first‐dose predictor of second‐infusion response (Table 1). Thus, the final stepwise logistic regression analysis included one predictor for patients with EM (percent change in MMDs, odds ratio [OR]: 0.97; 95% confidence interval [CI]: 0.95, 0.98; parameter estimate [PE]; −0.03; p < 0.0001) and two predictors for patients with CM (percent change in MMDs, OR: 0.94; CI: 0.92, 0.96; PE: −0.07; p < 0.001) and change in HIT‐6 total score (OR: 0.92; CI: 0.87, 0.98; PE: −0.08; p = 0.007).
TABLE 1.
Potential first‐infusion predictors of second‐infusion ≥50% MMD response in patients who had a <50% MMD response across weeks 1–12, using full logistic regression analysis (eptinezumab 100 and 300 mg treatment groups, pooled data)
| Infusion 1 predictor at week 12/over weeks 1–12 | PROMISE‐1 (EM) | PROMISE‐2 (CM) | ||||
|---|---|---|---|---|---|---|
| Odds ratio (95% CI) | Parameter estimate | p‐value | Odds ratio (95% CI) | Parameter estimate | p‐value | |
| Percent change in MMDs | 0.97 (0.95, 0.98) | −0.03 | 0.0001 | 0.94 (0.92, 0.96) | −0.06 | <0.0001 |
| Change in HIT‐6 total score | N/A | N/A | N/A | 0.92 (0.86, 0.99) | −0.08 | 0.027 |
| PGIC | N/A | N/A | N/A | 1.50 (0.84, 2.69) | 0.41 | 0.170 |
| Change in SF‐36 bodily pain | 1.04 (0.99, 1.10) | 0.04 | 0.113 | 1.00 (0.95, 1.05) | −0.004 | 0.859 |
| Change in SF‐36 mental health | 0.99 (0.94, 1.05) | −0.01 | 0.796 | 0.99 (0.93, 1.04) | −0.01 | 0.625 |
| Change in SF‐36 role‒emotional | 0.96 (0.91, 1.01) | −0.04 | 0.115 | 1.00 (0.95, 1.04) | −0.003 | 0.882 |
| Change in SF‐36 role‒physical | 1.01 (0.95, 1.07) | 0.01 | 0.772 | 0.98 (0.93, 1.04) | −0.02 | 0.544 |
| Change in SF‐36 social functioning | 1.00 (0.95, 1.05) | −0.001 | 0.958 | 1.00 (0.95, 1.05) | −0.002 | 0.950 |
| Change in SF‐36 vitality | 1.04 (0.98, 1.11) | 0.04 | 0.188 | 0.99 (0.93, 1.05) | −0.01 | 0.686 |
| Change in EQ‐5D‐5L VAS | 1.00 (0.97, 1.03) | −0.002 | 0.888 | 1.01 (0.99, 1.03) | 0.01 | 0.427 |
| Change in percent of headaches with severe pain | 1.02 (1.00, 1.03) | 0.02 | 0.031 | 0.99 (0.97, 1.00) | −0.02 | 0.098 |
Abbreviations: CI, confidence interval; CM, chronic migraine; EM, episodic migraine; EQ‐5D‐5L VAS, EuroQol 5‐Dimensions 5‐Levels visual analog scale; HIT‐6, 6‐item Headache Impact Test; N/A, not applicable (i.e., instrument not captured in PROMISE‐1); PGIC, Patient Global Impression of Change; PI‐MBS, patient‐identified most bothersome symptom; MMD, monthly migraine day; SF‐36, 36‐item Short‐Form Health Survey (v2.0).
Probability of second‐dose response based on first‐dose predictors
Stepwise modelling results of probability of second‐dose response based on first‐dose predictors in patients with EM and CM are shown in Tables 2 and 3, respectively, and are presented graphically in Figures 3 and 4. The modelling equations can be found in Supplement 1 in the Supporting Information.
TABLE 2.
Probability of second‐infusion ≥50% MMD response based on first‐infusion predictors in the PROMISE‐1 study (EM)
| Infusion 1 predictor | Infusion 2 response probability | |
|---|---|---|
| Percent change in MMDs | Probability of ≥50% MMD response | 95% confidence interval |
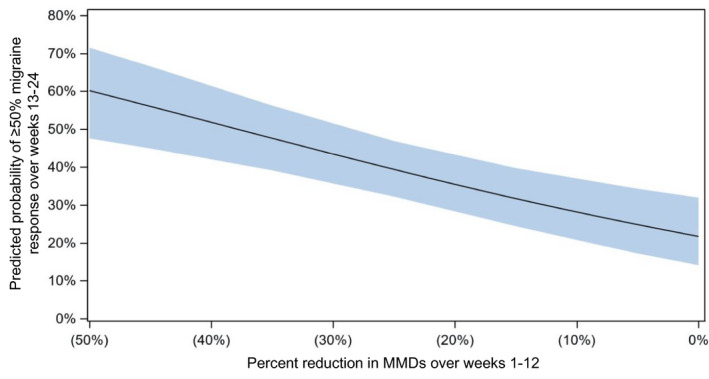
| 0% | 21.7% | 14.1%, 32.0% |
| −5% | 24.8% | 17.2%, 34.3% |
| −15% | 31.6% | 24.4%, 39.7% |
| −25% | 39.3% | 32.2%, 46.9% |
| −35% | 47.6% | 39.1%, 56.2% |
| −45% | 56.0% | 44.9%, 66.6% |
Abbreviations: EM, episodic migraine; MMD, monthly migraine day.
TABLE 3.
Probability of second‐infusion ≥50% MMD response based on first‐infusion predictors in the PROMISE‐2 (CM) study
| Infusion 1 predictor | Infusion 2 response probability | ||
|---|---|---|---|
| Percent change in MMDs | Change in HIT‐6 total score | Probability of ≥50% MMD response | 95% confidence interval |
| 0% | 0 | 5.9% | 3.0%, 11.3% |
| 0% | −6 | 9.1% | 4.8%, 16.8% |
| 0% | −10 | 12.1% | 5.9%, 23.1% |
| −5% | 0 | 8.0% | 4.4%, 13.9% |
| −5% | −6 | 12.2% | 7.1%, 20.3% |
| −5% | −10 | 16.1% | 8.7%, 27.7% |
| −15% | 0 | 14.3% | 9.3%, 21.2% |
| −15% | −6 | 21.1% | 14.7%, 29.5% |
| −15% | −10 | 26.9% | 17.5%, 39.0% |
| −25% | 0 | 24.2% | 17.6%, 32.4% |
| −25% | −6 | 34.0% | 26.9%, 41.9% |
| −25% | −10 | 41.4% | 30.8%, 52.9% |
| −35% | 0 | 38.1% | 28.7%, 48.4% |
| −35% | −6 | 49.7% | 41.3%, 58.2% |
| −35% | −10 | 57.6% | 46.3%, 68.2% |
| −45% | 0 | 54.2% | 41.1%, 66.7% |
| −45% | −6 | 65.6% | 54.8%, 75.0% |
| −45% | −10 | 72.3% | 60.4%, 81.7% |
Abbreviations: CM, chronic migraine; HIT‐6, 6‐item Headache Impact Test; MMD, monthly migraine day.
FIGURE 3.
Probability (with 95% confidence interval) of second‐infusion (weeks 13–24) ≥50% monthly migraine day response based on first‐infusion (weeks 1–12) predictors in the PROMISE‐1 study (episodic migraine). EM, episodic migraine; MMD, monthly migraine days
FIGURE 4.

Probability (with 95% confidence interval) of second‐infusion (weeks 13–24) ≥50% monthly migraine day response based on first‐infusion (weeks 1–12) predictors in the PROMISE‐2 study (chronic migraine), for (A) 6‐item Headache Impact Test (HIT‐6) change =0, (B) HIT‐6 change = –6, (C) HIT‐6 change = –10. CM, chronic migraine; MMD, monthly migraine days
DISCUSSION
The PROMISE‐1 and PROMISE‐2 studies assessed eptinezumab treatment for patients with EM and CM, respectively. A key secondary endpoint in both studies was the proportion of patients who had a ≥50% reduction in MMDs over weeks 1–12. Approximately 50–60% of patients with EM and CM responded to the first dose of eptinezumab with a ≥50% MMD reduction. 5 , 6 Healthcare providers and their patients in everyday clinical practice may want to know the likelihood of response with a second dose of eptinezumab for patients with initial suboptimal response to a first dose of eptinezumab. In this post hoc analysis of pooled eptinezumab 100 and 300 mg dose data from the PROMISE‐1 (EM) and PROMISE‐2 (CM) studies, among patients who did not respond with a ≥50% MMD reduction to their first eptinezumab infusion, about one‐third (37.0% of those with EM and 28.8% of those with CM) were ≥50% MMD responders to their second eptinezumab dose. Percent change in MMDs was demonstrated to be a significant first‐dose predictor of second‐dose response for individuals with EM, and percent change in MMDs and change in HIT‐6 total score (assessed in PROMISE‐2 only) were shown to be significant first‐dose predictors of second‐dose response for patients with CM.
To help patients and their healthcare providers make collaborative, individualized treatment decisions, easy‐to‐use reference tables were generated showing the likelihood of response according to first‐dose predictors. For patients with EM who experience no change in MMDs in response to the first dose, the probability of having a ≥50% MMD response to a second dose was approximately 20%. Hence, even patients with no change in MMD after their first dose have a one‐in‐five chance of responding to a second dose of eptinezumab. The probability of being a ≥50% MMD responder to the second dose increases to about 60% as a patient's percent change in MMDs after the first dose nears 50%. For patients with CM who experience no change in MMDs in response to the first dose, depending on change in HIT‐6 total score, the probability of having a ≥50% MMD response to a second dose was approximately 5%–10% and increased to about 60%–80% as a patient's percent change in MMDs after the first dose nears 50%. Although the outcomes were dichotomized into response and suboptimal response according to a ≥50% MMD reduction, real‐life outcomes with migraine are not binary and patients may consider a lower MMD reduction meaningful, particularly if coupled with improvements in patient‐reported outcomes measuring quality of life or disability. In addition, we do not have data on pain intensity scores, or change in response to acute migraine abortive medications, which may also be relevant to patients’ perception of benefit.
This post hoc analysis has several potential limitations. The analysis was conducted with no placebo adjustment, and performed under the assumption that patients treated with eptinezumab in the real world would respond similarly to those treated with eptinezumab in the clinical trial setting. Indeed, a marked proportion of patients in the placebo group who had a <50% MMD response to their first treatment were ≥50% MMD responders to their second placebo dose, especially in patients with EM (PROMISE‐1, 33.9%; PROMISE‐2, 18.5%). Patient expectations of a novel treatment, the amount of patient contact with migraine care experts throughout the trials, and the high percentage of patients in both trials receiving treatment rather than placebo may have contributed to the high placebo response. 16 , 17 , 18 , 19 , 20 , 21 PROMISE‐1 and PROMISE‐2 were fixed‐dose studies; thus the potential effects of dose adjustment on likelihood of second‐dose response could not be assessed in this post hoc analysis.
CONCLUSION
Individuals with migraine who do not experience a ≥50% MMD response to their first dose of eptinezumab may benefit from a second dose of eptinezumab. For patients with EM or CM who have no change in MMDs after their first eptinezumab dose, the likelihood of having a ≥50% MMD response to a second dose is approximately 20% and 5–10%, respectively, and the likelihood increases with increasing percent change in MMDs after the first dose. Easy‐to‐use reference tables can aid collaborative decision‐making for patients with migraine and their healthcare providers.
CONFLICT OF INTEREST
LM has served as a consultant, advisory board member, and/or speaker for Abbvie, AEVI, Alkermes, Allergan, Amgen, Aptinyx, Arbor, Axsome, AZTherapies, Bayer, Biogen, Biohaven, Bionomics, BlackThorn, CoLucid, Daiichi Sankyo, Dr. Reddy's, Eli Lilly, Esperion, Intarcia, Intra‐Cellular, Ironshore, Janssen, Labrys Biologic, Lundbeck, Mitsubishi, Mylan, NLS Pharma, Nektar, Nestle Pamlab, Neuralstem, Neurocrine, Novartis, Novo Nordisk, ObsEva, Otsuka, Palatin, Pfizer, Regeneron, Rhodes, Shionogi, Shire, Sunovion, Supernus, Takeda, TauRx, and Teva. JDS has served on advisory boards for Aeon, Allergan, Amgen, Biohaven, electroCore, Impel, Lilly, Lundbeck, Novartis, Promius, Revance, Teva, and Upsher‐Smith; and has received compensation for speaking from Allergan, Amgen, Biohaven, electroCore, Eli Lilly, Lundbeck, Novartis, Promius, Teva, and Upsher‐Smith. CA, EB, and AO are full‐time employees of H. Lundbeck A/S or one of its subsidiary companies. RC was an employee of Lundbeck or one of its subsidiary companies at the time of study and manuscript development. JH is an employee of Pacific Northwest Statistical Consulting, Inc., a contracted service provider of biostatistical resources for H. Lundbeck A/S.
AUTHOR CONTRIBUTIONS
Study concept and design: Carlton Anderson, Elizabeth Brunner, Roger Cady. Acquisition of data: Jack D. Schim, Lora McGill. Analysis and interpretation of data: Jack D. Schim, Carlton Anderson, Elizabeth Brunner, Joe Hirman, Roger Cady, Lora McGill. Drafting of the manuscript: Jack D. Schim, Carlton Anderson, Elizabeth Brunner, Joe Hirman, Annette Ogbru, Roger Cady, Lora McGill. Revising it for intellectual content: Jack D. Schim, Carlton Anderson, Elizabeth Brunner, Joe Hirman, Annette Ogbru, Roger Cady, Lora McGill. Final approval of the completed manuscript: Jack D. Schim, Carlton Anderson, Elizabeth Brunner, Joe Hirman, Annette Ogbru, Roger Cady, Lora McGill.
CLINICAL TRIALS REGISTRATION NUMBERS
ClinicalTrials.gov Identifiers: NCT02559895, NCT02974153.
Supporting information
Supplementary Material
ACKNOWLEDGMENTS
The authors thank Anja Becher, PhD, Nicole Coolbaugh, CMPP, and Philip Sjostedt, BPharm, of The Medicine Group (New Hope, PA, USA), for providing medical writing support, which was funded by H. Lundbeck A/S (Copenhagen, Denmark) in accordance with Good Publication Practice guidelines.
Schim JD, Anderson C, Brunner E, et al. Likelihood of response with subsequent dosing for patients with migraine and initial suboptimal response with eptinezumab: A post hoc analysis of two placebo‐controlled randomized clinical trials. Headache. 2022;62:558–565. doi: 10.1111/head.14302
Funding information
This analysis and publication was funded by Lundbeck LLC (Deerfield, IL, USA).
REFERENCES
- 1. Ailani J, Burch RC, Robbins MS; Board of Directors of the American Headache Society . The American Headache Society Consensus Statement: update on integrating new migraine treatments into clinical practice. Headache. 2021;61:1021‐1039. [DOI] [PubMed] [Google Scholar]
- 2. Adams AM, Serrano D, Buse DC, et al. The impact of chronic migraine: the Chronic Migraine Epidemiology and Outcomes (CaMEO) Study methods and baseline results. Cephalalgia. 2015;35:563‐578. [DOI] [PMC free article] [PubMed] [Google Scholar]
- 3. Leonardi M, Raggi A, Bussone G, D'Amico D. Health‐related quality of life, disability and severity of disease in patients with migraine attending to a specialty headache center. Headache. 2010;50:1576‐1586. [DOI] [PubMed] [Google Scholar]
- 4. Lipton RB, Bigal ME, Diamond M, et al. Migraine prevalence, disease burden, and the need for preventive therapy. Neurology. 2007;68:343‐349. [DOI] [PubMed] [Google Scholar]
- 5. Ashina M, Saper J, Cady R, et al. Eptinezumab in episodic migraine: a randomized, double‐blind, placebo‐controlled study (PROMISE‐1). Cephalalgia. 2020;40:241‐254. [DOI] [PMC free article] [PubMed] [Google Scholar]
- 6. Lipton RB, Goadsby PJ, Smith J, et al. Efficacy and safety of eptinezumab in patients with chronic migraine: PROMISE‐2. Neurology. 2020;94:e1365‐e1377. [DOI] [PMC free article] [PubMed] [Google Scholar]
- 7. American Headache Society . The American Headache Society position statement on integrating new migraine treatments into clinical practice. Headache. 2019;59:1‐18. [DOI] [PubMed] [Google Scholar]
- 8. Dodick DW, Gottschalk C, Cady R, Hirman J, Smith J, Snapinn S. Eptinezumab demonstrated efficacy in sustained prevention of episodic and chronic migraine beginning on day 1 after dosing. Headache. 2020;60:2220‐2231. [DOI] [PMC free article] [PubMed] [Google Scholar]
- 9. Ware J, Kosinski M, Bjorner J, Turner‐Bowker D, Gandek B, Maruish M. User's Manual for the SF‐36v2® Health Survey. 2nd ed. QualityMetric Incorporated; 2007. [Google Scholar]
- 10. Herdman M, Gudex C, Lloyd A, et al. Development and preliminary testing of the new five‐level version of EQ‐5D (EQ‐5D‐5L). Qual Life Res. 2011;20:1727‐1736. [DOI] [PMC free article] [PubMed] [Google Scholar]
- 11. Guy W. Clinical Global Impressions (028‐CGI). In: Guy W, ed. ECDEU Assessment Manual for Psychopharmacology. U.S. Dept. of Health, Education, and Welfare, Public Health Service, Alcohol, Drug Abuse, and Mental Health Administration; 1976. [Google Scholar]
- 12. Lipton RB, Dodick DW, Ailani J, McGill L, Hirman J, Cady R. Patient‐identified most bothersome symptom in preventive migraine treatment with eptinezumab: a novel patient‐centered outcome. Headache. 2021;61:766‐776. [DOI] [PMC free article] [PubMed] [Google Scholar]
- 13. Kosinski M, Bayliss MS, Bjorner JB, et al. A six‐item short‐form survey for measuring headache impact: the HIT‐6. Qual Life Res. 2003;12:963‐974. [DOI] [PubMed] [Google Scholar]
- 14. Yang M, Rendas‐Baum R, Varon SF, Kosinski M. Validation of the Headache Impact Test (HIT‐6™) across episodic and chronic migraine. Cephalalgia. 2011;31:357‐367. [DOI] [PMC free article] [PubMed] [Google Scholar]
- 15. Houts CR, Wirth RJ, McGinley JS, Cady R, Lipton RB. Determining thresholds for meaningful change for the Headache Impact Test (HIT‐6) total and item‐specific scores in chronic migraine. Headache. 2020;60:2003‐2013. [DOI] [PMC free article] [PubMed] [Google Scholar]
- 16. Couch JR Jr. Placebo effect and clinical trials in migraine therapy. Neuroepidemiology. 1987;6:178‐185. [DOI] [PubMed] [Google Scholar]
- 17. Pollo A, Amanzio M, Arslanian A, Casadio C, Maggi G, Benedetti F. Response expectancies in placebo analgesia and their clinical relevance. Pain. 2001;93:77‐84. [DOI] [PubMed] [Google Scholar]
- 18. Antonaci F, Chimento P, Diener HC, Sances G, Bono G. Lessons from placebo effects in migraine treatment. J Headache Pain. 2007;8:63‐66. [DOI] [PMC free article] [PubMed] [Google Scholar]
- 19. de Craen AJ, Tijssen JG, de Gans J, Kleijnen J. Placebo effect in the acute treatment of migraine: subcutaneous placebos are better than oral placebos. J Neurol. 2000;247:183‐188. [DOI] [PubMed] [Google Scholar]
- 20. Kam‐Hansen S, Jakubowski M, Kelley JM, et al. Altered placebo and drug labeling changes the outcome of episodic migraine attacks. Sci Transl Med. 2014;6:218ra5. [DOI] [PMC free article] [PubMed] [Google Scholar]
- 21. Benedetti F. Placebo effects: from the neurobiological paradigm to translational implications. Neuron. 2014;84:623‐637. [DOI] [PubMed] [Google Scholar]
Associated Data
This section collects any data citations, data availability statements, or supplementary materials included in this article.
Supplementary Materials
Supplementary Material