Abstract
True seals (phocids) have achieved a global distribution by crossing the equator multiple times in their evolutionary history. This is remarkable, as warm tropical waters are regarded as a barrier to marine mammal dispersal and—following Bergmann's rule—may have limited crossings to small‐bodied species only. Here, we show that ancestral phocids were medium sized and did not obviously follow Bergmann's rule. Instead, they ranged across a broad spectrum of environmental temperatures, without undergoing shifts in temperature‐ or size‐related evolutionary rates following dispersals across the equator. We conclude that the tropics have not constrained phocid biogeography.
Keywords: Antitropical distribution, Bergmann's rule, biogeography, body size, Phocidae, sea surface temperature
The global distribution of true seals reflects their success as secondarily aquatic tetrapods. Since returning to the water, they have evolved a wide range of body sizes (Churchill et al. 2015), adapted to thermoregulation in aquatic environments (Liwanag et al. 2012), and dispersed around the globe (Berta et al. 2015). Their current range includes both polar regions and the tropics (Berta et al. 2018; Fig. 1), resulting in conflicting hypotheses as to whether they originated in a cold (Fulton and Strobeck 2010; Davies 1958a, 1958b) or warm environment (Repenning et al. 1979; Deméré et al. 2003; Fyler et al. 2005; Mason et al. 2020).
Figure 1.
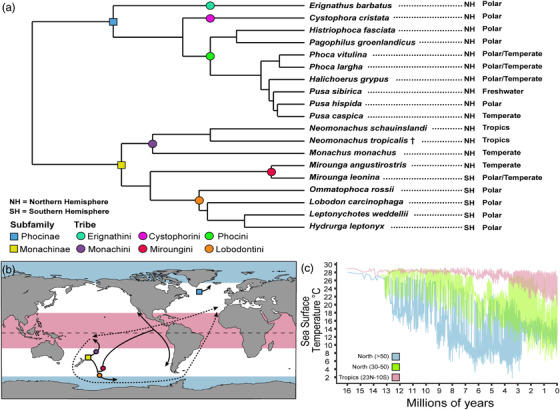
Biogeography of crown Phocidae. (a) Phylogeny of extant true seals (Rule et al. 2021b) with geographic distributions. (b) Dispersals for crown‐phocids (modified from Rule et al. 2020a), with the tropics in light red and polar environments in light blue. (c) Variation of Sea Surface Temperature by latitude through time (Herbert et al. 2016), demonstrating consistently high temperatures in the tropics, and broader Sea Surface Temperatures across latitudes closer to the present.
Modern marine mammals are mostly cold adapted, with their relatively large size and blubber insulation putting them at risk of overheating in warm environments (Davies 1958a, 1963; Holt et al. 2020). Consequently, they are thought to follow Bergmann's rule (Bergmann 1847), which postulates an inverse relationship between body size and environmental temperature (Sepúlveda et al. 2013; Torres‐Romero et al. 2016; Adamczak et al. 2020). If so, warm tropical waters should be home to relatively small body forms only, whereas larger species might be expected to show antitropical distributions (Holt et al. 2020).
True seals arose in the Northern Hemisphere (Fulton and Strobeck 2010; Fig. 1). Their earliest (Miocene—Pliocene) Southern Hemisphere representatives are notably small (Rule et al. 2021a). This perhaps indicates restricted cross‐equatorial dispersal consistent with Bergmann's rule, as the latitudinal thermal gradient was present throughout the Neogene (Fig. 1c). Yet phocids appear to have crossed the tropics several times during their evolutionary history (Rule et al. 2020a; Fig. 1), in stark contrast to the single major southern dispersal of their otariid cousins, the fur seals and sea lions (Yonezawa et al. 2009; Churchill et al. 2014). Here, we test phocid dispersal capabilities by testing whether (i) equatorial crossings were accompanied by notable shifts in body size and/or environmental temperature, and (ii) Bergmann's rule truly applies to them.
Materials and Methods
We based our study on the phylogeny of Rule et al. (2020a, 2021b), excluding tips with no phenotypic and/or environmental data. Analyses were carried out in RStudio version 1.2.1335 (R Version 3.6.0) using the packages “ape,” “phytools,” “geiger,” “ratematrix,” “nlme,” and “RRphylo” (Paradis et al. 2004; Revell 2012; Pennell et al. 2014; Caetano and Harmon 2017; Pinheiro et al. 2017; Castiglione et al. 2018). Taxa resolved as ancestors in the original tree were assigned artificial branch lengths of 0.01 million years to enable analyses to run.
Maximum and minimum total body lengths for each specimen were taken from the literature (Stirling 1971; King 1983; Modig 1996; Andersen et al. 1999; Bininda‐Emonds and Gittleman 2000; Samaranch and Gonzalez 2000; Lindenfors et al. 2002; Laws et al. 2003; Rogers 2009; Churchill et al. 2015; Valenzuela‐Toro et al. 2016; Dewaele et al. 2017; Rule et al. 2020b, 2021a; Tables A3, A4) or, where unavailable (for 12 out of 17 extinct taxa), maximum total body length was estimated following Rule et al. (2020b; Tables A1, A2). All length data were then log10 transformed prior to analysis. For extant species, we used the minimum, median, and maximum sea surface temperature (SST) of their entire geographic range (IUCN Red List) as a proxy for environmental temperature (Appendix). For extinct taxa, median SST estimates aligning with the tip age and geographic region of the fossils in question were taken from the literature (Dowsett and Wiggs 1992; Barrick et al. 1993; Warne 2005; Amiot et al. 2008; Dowsett et al. 2012; Herbert et al. 2016). We used median SST (Tables A5, A6) to enable direct comparisons between extant and extinct phocids, and to account for migratory movements meant to avoid seasonal extremes.
We examined the evolution of maximum total body length and median sea surface temperature (Table 1) for (i) extant species only, (ii) extant + extinct species minus ancestors (to rule out the possibility of ultrashort branch lengths producing artificial shifts), and (iii) the complete phylogeny via “RRphylo” (Castiglione et al. 2019a, 2018,b). For extant species only, we also analyzed minimum total body length, and minimum and maximum SST, to test the effects of extremes on the evolutionary analyses. Ancestral states of both traits (log10 total body length and SST) were estimated for the extant and complete datasets only. We tested for evolutionary rate shifts using the auto‐recognize feature of the search.shift function (Castiglione et al. 2018). Finally, we used the function overfitRR to measure the uncertainty associated with our RRphylo results.
Table 1.
Summary statistics on datasets analyses. TBL = log10 total body length, SST = sea surface temperature
| Dataset | N | Mean | Median | Minimum | Maximum | Standard Deviation |
|---|---|---|---|---|---|---|
| Maximum TBL extant + extinct | 36 | 2.31 | 2.29 | 1.83 | 2.75 | 0.17 |
| Maximum TBL minus ancestors | 26 | 2.37 | 2.37 | 2.11 | 2.75 | 0.15 |
| Maximum TBL extant only | 19 | 2.37 | 2.37 | 2.11 | 2.75 | 0.17 |
| Minimum TBL extant only | 19 | 2.32 | 2.33 | 2.52 | 2.52 | 0.13 |
| Median SST extant + extinct | 32 | 13.60 | 14.40 | 4.00 | 27.00 | 7.01 |
| Median SST minus ancestors | 26 | 12.32 | 12.00 | 4.00 | 27.00 | 7.02 |
| Minimum SST extant only | 19 | 3.47 | 0.00 | 0.00 | 24.00 | 7.63 |
| Median SST extant only | 19 | 10.37 | 7.50 | 4.00 | 27.00 | 7.12 |
| Maximum SST extant only | 19 | 17.37 | 15.00 | 8.00 | 30.00 | 8.01 |
We ran two sets of analyses to test for a possible relationship between log10 total body length and sea surface temperature (i.e., Bergmann's rule). First, we regressed maximum log10 total body length against median SST via a linear regression and phylogenetic generalized least squares. Second, we tested for correlated evolution via a Bayesian Markov chain Monte Carlo (MCMC) analysis of evolutionary rate matrices, as implemented in the package “ratematrix” (Caetano and Harmon 2017). We ran two chains for 1,000,000 generations, sampling every 1000 generations and discarding the first 25% as burn‐in. We checked the acceptance ratio for the two chain logs, and tested for convergence between them. When convergence was achieved, we merged the two MCMC chains and plotted the rate matrix to test for an evolutionary correlation between the two traits.
Results
For the evolutionary rate shift analyses, including ancestors in the phylogeny did not result in additional evolutionary shifts (Tables 3, 4), and the results of the extant + extinct evolutionary rate analyses were better supported than the extant only analyses (Tables 2, A7; Fig. A1). Extant‐only ancestral state estimations suggest that archaic phocines were far smaller (1.97−2.12 m) than monachines (2.56−2.93 m), with their last common ancestor being 2.32−2.50 m (Fig. 2). Phocids as a whole appear adapted to cold water (<12°C), with only monk seals being tolerant of warmer environments (Fig. 3). Taking into account fossil taxa reveals a more even pattern, with ancestral phocids, phocines, and monachines all showing a similar range of body lengths (1.64−2.25 m) and environmental temperatures (∼19°C) (Fig. 4).
Table 3.
Results of the search.shift analysis of log10 total body length (TBL) in RRphylo. Only significant results are shown; for full results, see Supporting Information. ARD = Average Rate Difference
| Extinct + Extant maximum TBL | ||
|---|---|---|
| Clade | ARD | P‐value |
| D. emyri + D. claytoni + Kawas + Motunau | –0.019 | <0.01 |
| D. claytoni + Kawas + Motunau | –0.022 | <0.01 |
| Minus ancestors maximum TBL | ||
| Clade | ARD | P‐value |
| Monachini | –0.011 | <0.01 |
| Extant only maximum TBL | ||
| Clade | ARD | P‐value |
| Lobodontini + Miroungini | –0.008 | <0.03 |
| Extant only minimum TBL | ||
| Clade | ARD | P‐value |
| Monachinae | –0.006 | <0.01 |
Table 4.
Results of the search.shift analysis of sea surface temperature (SST) in RRphylo. Only significant results are shown; for full results, see Supporting Information. ARD = Average Rate Difference
| Minus ancestors median SST | ||
|---|---|---|
| Clade | ARD | P‐value |
| Homiphoca + Hadrokirus + Piscophoca + Acrophoca | –0.369 | <0.02 |
| Extant only maximum SST | ||
| Clade | ARD | P‐value |
| Lobodontini | –0.658 | <0.01 |
| Lobodontini + Mirounga | –0.482 | <0.03 |
| Extant only minimum SST | ||
| Clade | ARD | P‐value |
| Cystophora + Phocini | –0.594 | <0.01 |
| Phocini | –0.522 | <0.01 |
| Halichoerus + Phoca + Pusa | –0.387 | <0.01 |
| Pusa | –0.370 | 0.03 |
Table 2.
OverfitRR results for the 95% confidence intervals of the root value obtained by the RRphylo analysis. TBL = log10 total body length
| Dataset | Root Value | 2.5% CI | 97.5% CI |
|---|---|---|---|
| Extant + extinct maximum TBL | 2.35 | 2.35 | 2.36 |
| Minus ancestors maximum TBL | 2.36 | 2.36 | 2.36 |
| Extant only minimum TBL | 2.37 | 2.16 | 2.38 |
| Extant only maximum TBL | 2.4 | 2.2 | 2.42 |
| Extant + extinct median SST | 19.21 | 16.79 | 19.28 |
| Minus ancestors median SST | 14.18 | 14.62 | 14.81 |
| Extant only Minimum SST | 1.74 | 0.18 | 0.4 |
| Extant only Median SST | 7.15 | 5.21 | 25.8 |
| Extant only maximum SST | 12.58 | 10.12 | 27.62 |
Figure 2.
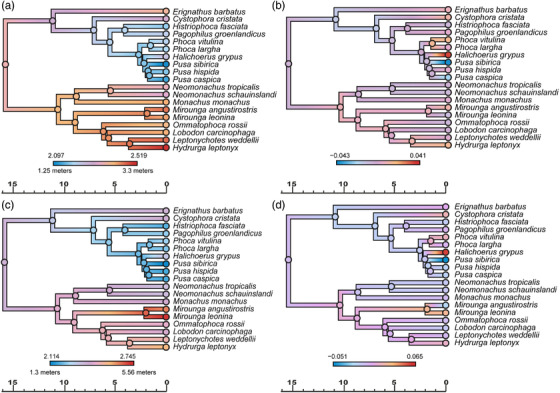
Evolution of body size in extant true seals estimated by RRphylo analysis, using phylogeny from Rule et al. (2021b). (a) Ancestral state estimation and (b) evolutionary rates for Log10 minimum total body length. (c) Ancestral state estimation and (d) evolutionary rates for Log10 maximum total body length. Timescales in millions of years.
Figure 3.
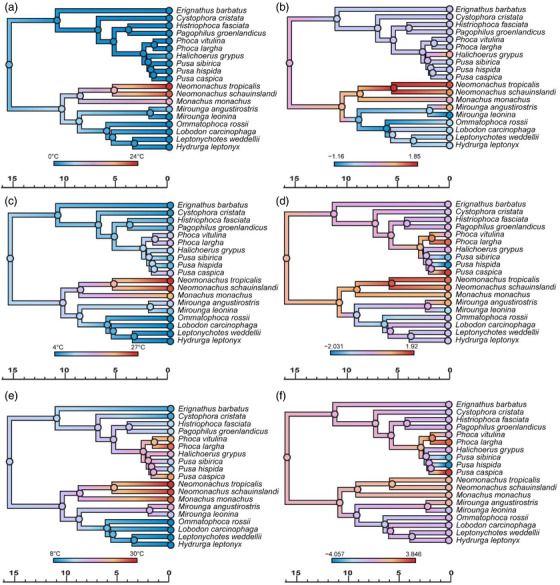
Evolution of sea surface temperature (SST) in extant true seals estimated by RRphylo analysis, using phylogeny from Rule et al. (2021b). Ancestral state estimation (a) and evolutionary rates (b) for minimum SST. Ancestral state estimation (c) and evolutionary rates (d) for median SST. Ancestral state estimation (e) and evolutionary rates (f) for maximum SST. Timescales in millions of years.
Figure 4.
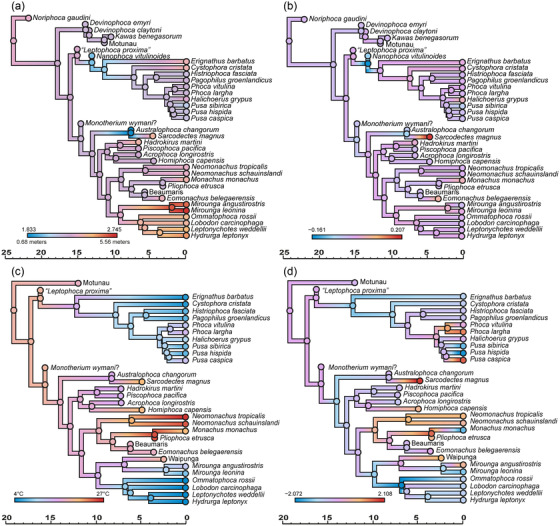
Evolution of body size and SST in extant and extinct true seals estimated by RRphylo analysis, using phylogeny from Rule et al. (2021b). Ancestral state estimation (a) and evolutionary rates (b) for log10 total body length. Ancestral state estimation (c) and evolutionary rates (d) for median SST. Timescales in millions of years.
Both the extant (Fig. 2) and the extant + extinct (Fig. 4) datasets show little variation in evolutionary rates for log10 total body length. Nevertheless, significant decreases in the rate of body size evolution characterize Antarctic seals (lobodontins) + elephant seals (ARD [Actual Rate Difference]: −0.008), and monk seals (ARD: −0.006) in the extant‐only datasets, and stem phocids in the extant + extinct dataset (ARDs: −0.019 and −0.022; Table 3). There was more variation in evolutionary rates for sea surface temperature within the monachine clade than the phocine clade (Figs. 3, 4). The extant data furthermore suggest rate decreases associated with a shift toward colder minimum SSTs for Phocinae and colder maximum SSTs for Monachinae; however, these significant evolutionary rate decreases disappear when fossils are included (Table 4).
Neither the linear regression (P = 0.23) nor the PGLS (P = 0.75) show any relationship between body length and environmental temperature (Fig. 5; Tables A8, A9). For the evolutionary rate matrix analysis, convergence was achieved between the two MCMC chains after 1,000,000 generations (Figs. A2, A3, A4, A5, A6; Tables A10, A11). The posterior distribution of the evolutionary rate matrices (Figs. 6, A7) of the merged MCMC chains shows no evolutionary correlation between log10 total body length and sea surface temperature.
Figure 5.
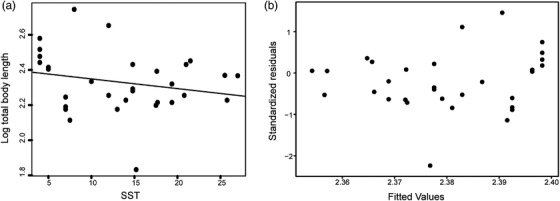
Regression analyses for log total body length and median SST in extant and extinct true seals. (a) Linear regression of log10 total body length versus median SST (adjusted R 2 = 0.017, P‐value = 0.226). (b) Phylogenetic generalized least squares regression for log10 total body length versus median SST (P‐value = 0.753).
Figure 6.
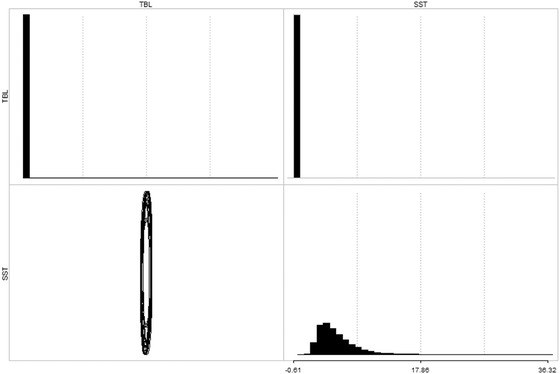
Posterior distribution of the evolutionary rate matrices for the merged MCMC chains. Histograms show the posterior distribution of evolutionary rate variance values for log10 total body length (TBL, top left) and sea surface temperature (SST, bottom right); and pairwise evolutionary covariance values between log total body length and sea surface temperature (top right). Ellipses (bottom left) are 50 bivariate distributions randomly sampled from the posterior distribution. The vertical orientation of the ellipses demonstrates that there is no evolutionary correlation between log10 total body length and sea surface temperature. The elongated shape of the ellipses demonstrates that log10 total body length has faster evolutionary rates than sea surface temperature.
Discussion
EVOLUTION OF BODY SIZE AND SST IN TRUE SEALS
Previous studies disagreed on whether early phocids were small (Churchill et al. 2015) or large (Wyss 1994). In isolation, our extant phylogeny supports intermediate ancestral sizes (Fig. 2), which is also supported when fossil taxa are taken into account (Fig. 4). Both phocines and monachines waxed and waned in size over time (Wyss 1994; Churchill et al. 2015; Valenzuela‐Toro et al. 2016; Dewaele et al. 2017; Rule et al. 2020b, 2021a), and between them gave rise to both the smallest (0.68 m) and the largest (>5 m) seals known to date. Our results suggest that these extremes represent derived conditions.
Extant‐only ancestral state estimations of SST (Fig. 3) support a cold‐water origin of true seals (Davies 1958a, 1958b; Fulton and Strobeck 2010), as opposed to a more temperate range when fossils are included (Fig. 4). The latter suggests separate origins for the cold‐water adaptations of phocines and Antarctic seals (Repenning et al. 1979; Deméré et al. 2003; Fyler et al. 2005; Mason et al. 2020), with pagophily likely arising in response to Plio‐Pleistocene cooling. Likewise, the tropical affinities of monk seals appear to be a derived condition. Overall, the modern contrast between polar and tropical phocids appears relictual, and largely reflects local extinctions of phocids at mid‐latitudes during the late Neogene (Avery and Klein 2011; Valenzuela‐Toro et al. 2013; Pimiento et al. 2017; Dewaele et al. 2018; Rule et al. 2019).
Trait evolution is best assessed based on phylogenies including both extant and extinct taxa (Quental and Marshall 2010). This is supported by our findings, with extant + extinct datasets producing different, and more robust, results than those comprising living species only. Previous studies focusing on extant phocids likely underestimated their past ecological diversity (Davies 1958a, 1958b; Fyler et al. 2005; Fulton and Strobeck 2010; Mason et al. 2020), which in turn may have prevented a more widespread extinction of the group during the late Neogene (Knope et al. 2020).
THERMAL BARRIERS TO DISPERSAL
True seals repeatedly crossed the tropics in the course of their evolution (Rule et al. 2020a), even though they are thought to hinder marine mammal dispersal (Davies 1963; Holt et al. 2020). A warm‐water equatorial barrier could explain the small size of the oldest true seals from the Southern Hemisphere (Rule et al. 2020b, 2021a), but surprisingly is not evident in our evolutionary rate shift analysis. Overall, equatorial crossings for true seals are thus not obviously constrained by body size.
No shifts in SST were detected once extinct seals were taken into account (Table 4). Therefore, phocids appear tolerant of a broad range of environmental temperatures, which plausibly enabled them to invade both the tropics and polar environments with relative ease.
BERGMANN'S RULE
Bergmann's rule is thought to restrict the body size of marine mammals at lower latitudes (Torres‐Romero et al. 2016; Adamczak et al. 2020), which may limit cross‐equatorial dispersals. The rule applies to fur seals and sea lions (Sepúlveda et al. 2013) but seemingly not phocids, with our regressions and evolutionary rate matrix analysis showing no relationship between total body length and SST (Figs. 5, 6; Tables A8, A9). Body size evolution in true seals was thus not obviously driven by temperature, and instead may reflect nutrient availability and/or feeding ecology (Dewaele et al. 2017, 2018; Rule et al. 2021a).
GLOBAL DISPERSAL OF TRUE SEALS
Unlike fur seals, sea lions, and walruses—all of which remained restricted to the North Pacific for much of their evolution—true seals have long enjoyed a global distribution (Berta et al. 2018; Velez‐Juarbe and Valenzuela‐Toro 2019). Broad temperature tolerances may help to explain this pattern, with true seals being able to invade new environments relatively easily. By contrast, fur seals and sea lions only crossed into the Southern Hemisphere following Pliocene cooling and an attendant increase in productivity along the equator (Churchill et al. 2014). The same cooling event produced sea‐level fluctuations that impacted coastal habitats (with lowered sea levels eliminating shallow coastal waters) and likely disrupted the global distribution of phocids by driving their replacement with otariids at southern temperate latitudes (Boessenecker 2013; Valenzuela‐Toro et al. 2013; Govender 2015; Pimiento et al. 2017; Rule et al. 2019). This idea is again consistent with our results, which suggest that—contrary to earlier suggestions (Ray 1976)—changing climates likely did not exceed the temperature tolerances of phocids as such. This suggests that phocids will be affected by physical oceanic and ecological changes from future climatic change, rather than directly by changes in temperature.
AUTHOR CONTRIBUTIONS
JPR, FGM, ARE, and JWA conceived and designed the study. JPR collected the data. JPR and FGM analyzed the data. JPR drafted the initial version of the manuscript. All authors contributed to and approved the final versions of the manuscript.
CONFLICT OF INTEREST
The authors declare no conflict of interest.
DATA ARCHIVING
Additional datasets and results are available as Supporting Information. The R‐script (https://doi.org/10.6084/m9.figshare.13515458), input files (https://doi.org/10.6084/m9.figshare.13515461), and output data (https://doi.org/10.6084/m9.figshare.13515470) are available on the Figshare repository. Fossils used in this study are deposited in the following permanent and accessible institutions: Museum of New Zealand Te Papa Tongarewa, Canterbury Museum, Museo Paleontológico ‘Egidio Feruglio’, Museums Victoria, Muséum national d'Histoire naturelle, and Smithsonian Institution National Museum of Natural History
Associate Editor: G. Hurst
Handling Editor: A. McAdam
Supporting information
Supporting Information
ACKNOWLEDGMENTS
JPR was funded by the Australian Government Research Training Program (RTP), the Robert Blackwood Partnership Award, and a Monash Postgraduate Publication Award. Travel to museums was funded by the Biomedical Discovery Institute and Department of Anatomy and Developmental Biology of Monash University, and a Monash University Graduate Research Travel Grant. Thanks to C. de Muizon for helpful discussions on the body size of extinct seals. We would also like to thank T. Pollock and W. M. G. Parker for helpful discussions and assistance with the analysis, as well as A. Tennyson and T. Schultz (Museum of New Zealand Te Papa Tongarewa); R. P. Scofield and T. Elder (Canterbury Museum); E. Ruigomez (Museo Paleontológico ‘Egidio Feruglio’); T. Ziegler (Museums Victoria); C. de Muizon and G. Billet (Muséum national d'Histoire naturelle); and D. Bohaska and N. Pyenson (Smithsonian Institution National Museum of Natural History) for access to specimens under their care. The quality of this manuscript was improved thanks to feedback from the associate editor T. Ezard and two anonymous reviewers, and also R. M. D. Beck and J. Velez‐Juarbe, who provided comments for a previous version of this manuscript as a thesis chapter.
Open access publishing facilitated by Monash University, as part of the Wiley ‐ Monash University agreement via the Council of Australian University Librarians.
[Correction added on 13 MAY 2022, after first online publication: CAUL funding statement has been added.]
Body Size Estimations
Table A1.
Equations used for total body length estimations of extinct taxa
| Acronym | Definition | Equation | Reference |
|---|---|---|---|
| BZB | Bizygomatic width | 1.03 × Log(#) + 1.10 | Churchill et al. 2014 |
| CW | Width across canines | 0.72 × Log(#) + 1.83 | Churchill et al. 2014 |
| HOC | Height of occipital shield | 1.30 × Log(#) + 1.28 | Churchill et al. 2014 |
| LB | Length of tympanic bulla | 0.75 × Log(#) + 1.91 | Churchill et al. 2014 |
| LUPC | Length of upper postcanine toothrow | 0.96 × Log(#) + 1.64 | Churchill et al. 2014 |
| LUTR | Length of upper toothrow | 1.00 × Log(#) + 1.50 | Churchill et al. 2014 |
| OCB | Width across occipital condyles | 1.54 × Log(#) + 1.02 | Churchill et al. 2014 |
| PL | Palate length | 0.96 × Log(#) + 1.32 | Churchill et al. 2014 |
| WB | Width of tympanic bulla | 1.08 × Log(#) + 1.58 | Churchill et al. 2014 |
| P. sibirica % estimate | Humerus 8.12% total body length in Pusa sibirica | # / 0.0812 | Dewaele et al. 2017 |
| P. vitulina % estimate | Humerus 7.76% total body length in Phoca vitulina | # / 0.077 6 | Dewaele et al. 2017 |
| O. rossii % estimate | Humerus 5.95% total body length in Ommatophoca rossii | # / 0.0595 | Dewaele et al. 2017 |
| L. weddellii % estimate | Humerus 6.5% total body length in Leptonychotes weddellii | # / 0.065 | Dewaele et al. 2017 |
Table A2.
Estimations for total body length of extinct taxa
| Taxa | Specimen | Equation Used | Measurement (mm) | Value from Equation | Estimate (mm) | Average Estimate (mm) | Notes |
|---|---|---|---|---|---|---|---|
| Noriphoca gaudini | MSNUN 123 | BZB | 184.00 | 3.43 | 2708.71 | 2288.15 | Measurement data taken from Dewaele et al. (2018) |
| LUPC | 83.00 | 3.48 | 3036.09 | ||||
| CW | 61.00 | 3.12 | 1304.48 | ||||
| PL | 122.00 | 3.32 | 2103.32 | ||||
| Devinophoca emyri | USNM 553684 | BZB | 127.70 | 3.27 | 1859.42 | 1638.92 | Measurement data taken from Koretsky and Rahmat (2015) |
| WB | 35.70 | 3.26 | 1806.68 | ||||
| LUPC | 46.90 | 3.24 | 1755.20 | ||||
| LB | 33.60 | 3.05 | 1134.37 | ||||
| Devinophoca claytoni | Z14523 | BZB | 124.00 | 3.26 | 1803.95 | 1682.74 | Measurement data taken from Koretsky and Holec (2002) |
| WB | 49.30 | 3.41 | 2560.20 | ||||
| LUPC | 49.00 | 3.26 | 1830.58 | ||||
| CW | 40.00 | 2.98 | 962.68 | ||||
| LB | 38.50 | 3.10 | 1256.31 | ||||
| Motunau | CM Zfa333 | LB | 37.74 | 3.09 | 1237.66 | 1637.47 | – |
| WB | 39.90 | 3.31 | 2037.28 | ||||
| Leptophoca proxima | CMM‐V‐2021 | All Subsets | CW(33.05), OCB(51.43) | 3.32 | 2094.43 | 2094.43 | – |
| Nanophoca vitulinoides | IRSNB M2276c, IRSNB 1063‐M242, IRSNB M2278, IRSNB M2271, IRSNB M2276d, IRSNB 1105‐M239 | P. sibirica % estimate | – | – | 920.00 | 982.50 | Total body length estimates for taken from Dewaele et al. (2017). Due to N. vitulinoides being a phocine, only phocine estimates were used. |
| P. vitulina % estimate | – | – | 1045.00 | ||||
| Monotherium wymani | USNM 214909 | WB | 41.40 | 3.33 | 2120.12 | 1638.60 | USNM 214909 is a cast of MCZ 8741 |
| LB | 34.50 | 3.06 | 1157.08 | ||||
| Hadrokirus martini | MNHN.F.SAS 1627 | All Subsets | CW(52.70), OCB(56.90) | 3.43 | 2698.73 | 2698.73 | Measurement data taken from Amson and Muizon (2014) |
| Sarcodectes magnus | USNM 475486 | LUTR | 109.76 | 3.54 | 3470.92 | 2831.29 | – |
| LUPC | 91.32 | 3.52 | 3327.69 | ||||
| USNM 181601 | WB | 53.91 | 3.45 | 2819.70 | |||
| LB | 51.42 | 3.19 | 1560.81 | ||||
| USNM 534034 | O. rossii hum/body length | 180.44 | – | 3032.61 | |||
| L. weddellii hum/body length | – | 2776.00 | |||||
| Pliophoca etrusca | MSNUP I‐13993 | CW | 44.00 | 3.01 | 1031.06 | 1684.99 | Measurement data taken from Berta et al. (2015) |
| O. rossii hum/body length | 125.00 | – | 2100.84 | ||||
| L. weddellii hum/body length | – | 1923.08 | |||||
| Beaumaris | NMV P160399 | LB | 35.66 | 3.07 | 1186.14 | 1580.86 | – |
| WB | 38.78 | 3.30 | 1975.59 | ||||
| Eomonachus belegaerensis | NMNZ S.046692 | BZB | 131.12 | 3.28 | 1910.73 | 2467.96 | – |
| WB | 39.77 | 3.31 | 2030.11 | ||||
| LB | 31.24 | 3.03 | 1074.07 | ||||
| OCB | 51.05 | 3.65 | 4470.06 | ||||
| HOC | 66.02 | 3.65 | 4421.59 | ||||
| NMNZ S.047276 | LB | 35.85 | 3.08 | 1190.88 | |||
| WB | 38.58 | 3.29 | 1964.59 | ||||
| NMNZ S.047422 | OCB | 52.07 | 3.66 | 4608.34 | |||
| LB | 32.67 | 3.05 | 1110.74 | ||||
| WB | 38.18 | 3.29 | 1942.60 | ||||
| LUPC | 63.05 | 3.37 | 2331.83 | ||||
| CM 2020.74.1 | LUTR | 80.20 | 3.40 | 2536.15 | |||
| LUPC | 67.56 | 3.40 | 2491.74 |
Table A3.
Average of estimates of total body length for extinct taxa taken from the literature, or calculated in this study
| Taxon | Body Length (m) Averaged Estimates | Source and Method |
|---|---|---|
| Noriphoca gaudini | 2.29 | Churchill et al. (2015) (CW, PL, BZB, LUPC) |
| Devinophoca emyri | 1.64 | Churchill et al. (2015) (BZB, WB, LUPC, LB) |
| Devinophoca claytoni † | 1.68 | Churchill et al. (2015) (BZB, WB, LUPC, CW, LB) |
| Kawas benegasorum † | 1.63 | Rule et al. (2020a) |
| CM ZFa333 Motunau † | 1.64 | Churchill et al. (2015) (LB, WB) |
| Leptophoca proxima † | 2.09 | Churchill et al. (2015) (All subsets) |
| Nanophoca vitulinoides † | 0.98 | Dewaele et al. (2017) (Modified for this study using Phocinae humeri percentages only) |
| Monotherium wymani † | 1.64 | Churchill et al. (2015) (WB, LB) |
| Homiphoca capensis † | 1.80 | Churchill et al. (2015) |
| Piscophoca pacifica † | 1.96 | Churchill et al. (2015) |
| Acrophoca longirostris † | 1.91 | Churchill et al. (2015) |
| Hadrokirus martini † | 2.70 | Churchill et al. (2015) (All subsets) |
| Australophoca changorum † | 0.68 | Valenzuela‐Toro et al. (2016) |
| Sarcodectes magnus † | 2.83 | Churchill et al. (2015) and Rule et al. (2020b) (LUTR, LUPC, WB, LB) and Dewaele et al. (2017) (Monachinae humeri percentages only) |
| Pliophoca etrusca † | 1.69 | Churchill et al. (2015) (CW) and Dewaele et al. (2017) (Monachinae humeri percentages only) |
| NMV P160399 Beaumaris † | 1.58 | Churchill et al. (2015) (WB, LB) |
| Eomonachus belegaerensis † | 2.47 | Churchill et al. (2015) (BZB, WB, LB, OCB, HOC, LUPC, LUTR) |
Table A4.
Total body length of extant taxa taken from the literature
| Taxon | Maximum Body Length (m) | Maximum Male Body Length (m) | Maximum Female Body Length (m) | Reference |
|---|---|---|---|---|
| Erignathus barbatus | 2.54 | 2.54 | 2.42 | Andersen et al. (1999) |
| Cystophora cristata | 2.6 | 2.6 | 2.06 | Bininda‐Emonds and Gittleman (2000) |
| Histriophoca fasciata | 1.55 | 1.53 | 1.55 | Bininda‐Emonds and Gittleman (2000) |
| Pagophilus groenlandicus | 1.76 | 1.76 | 1.69 | Bininda‐Emonds and Gittleman (2000) |
| Phoca largha | 1.69 | 1.69 | 1.59 | Bininda‐Emonds and Gittleman (2000) |
| Phoca vitulina | 1.80 | 1.8 | 1.65 | Lindenfors et al. (2002) |
| Halichoerus grypus | 2.16 | 2.16 | 1.8 | Bininda‐Emonds and Gittleman (2000) |
| Pusa capsica | 1.50 | 1.5 | 1.36 | Bininda‐Emonds and Gittleman (2000) |
| Pusa sibirica | 1.30 | 1.3 | 1.25 | Bininda‐Emonds and Gittleman (2000) |
| Pusa hispida | 1.5 | 1.5 | 1.5 | King (1983) |
| Monachus monachus | 2.7 | 2.7 | 2.65 | Samaranch and Gonzalez (2000) (male), Bininda‐Emonds and Gittleman (2000) (female) |
| Neomonachus schauinslandi | 2.34 | 2.14 | 2.43 | Bininda‐Emonds and Gittleman (2000) |
| Neomonachus tropicalis | 2.33 | 2.33 | 2.26 | Bininda‐Emonds and Gittleman (2000) (male) |
| Mirounga leonina | 5.56 | 5.56 | 2.70 | Modig (1996) (male), Bininda‐Emonds and Gittleman (2000) (female) |
| Mirounga angustirostris | 4.50 | 4.50 | 2.95 | Bininda‐Emonds and Gittleman (2000) |
| Lobodon carcinophagus | 2.77 | 2.64 | 2.77 | Laws et al. (2003) |
| Ommatophoca rossii | 3 | 3.00 | 2.50 | King (1983) |
| Hydrurga leptonyx | 3.8 | 3.3 | 3.8 | Rogers (2009) |
| Leptonychotes weddellii | 3.29 | 2.97 | 3.29 | King (1983), Stirling (1971) (female) |
Sea Surface Temperature data
Table A5.
Sea Surface Temperature data for extant taxa from NOAA Earth System Research Laboratory database
| Taxon | Winter SST | Summer SST | Median SST |
|---|---|---|---|
| Erignathus barbatus | 0–2 | 8–10 | 5 |
| Cystophora cristata | 0–2 | 8–10 | 5 |
| Histriophoca fasciata | 0–2 | 12–14 | 7 |
| Pagophilus groenlandicus | 0–2 | 12–14 | 7 |
| Phoca largha | 0–2 | 26–28 | 14 |
| Phoca vitulina | 0–2 | 22–24 | 12 |
| Halichoerus grypus | 2–4 | 18–20 | 10 |
| Pusa caspica | 0–2 | 24–26 | 13 |
| Pusa sibirica | 0–2 | 15 | 7.5 |
| Pusa hispida | 0–2 | 12–14 | 7 |
| Monachus monachus | 14–16 | 26–28 | 21 |
| Neomonachus schauinslandi | 22–24 | 28–29 | 25.5 |
| Neomonachus tropicalis | 24–26 | 29–30 | 27 |
| Mirounga leonina | 0–2 | 10–16 | 8 |
| Mirounga angustirostris | 4–6 | 18–20 | 12 |
| Lobodon carcinophagus | 0–2 | 6–8 | 4 |
| Ommatophoca rossii | 0–2 | 6–8 | 4 |
| Hydrurga leptonyx | 0–2 | 6–8 | 4 |
| Leptonychotes weddellii | 0–2 | 6–8 | 4 |
Table A6.
Sea surface temperature (SST) estimate from the area and locality of fossil taxa
| Taxon | SST | Data | Reference |
|---|---|---|---|
| Monotherium wymani | 14.7–24 (Median 19.35) | Skeletal Oxygen Isotope | Barrick et al. (1993) |
| Leptophoca proxima | 14.7–24 (Median 19.35) | Skeletal Oxygen Isotope | Barrick et al. (1993) |
| Australophoca changorum | 15.2 | Skeletal Oxygen Isotope | Amiot et al. (2008) |
| Hadrokirus martini | 14.8 | Skeletal Oxygen Isotope | Amiot et al. (2008) |
| Acrophoca longirostris | 14.8 | Skeletal Oxygen Isotope | Amiot et al. (2008) |
| Piscophoca pacifica | 14.8 | Skeletal Oxygen Isotope | Amiot et al. (2008) |
| Sarcodectes magnus | 21.5 | Biostratigraphy | Dowsett and Wiggs (1992), Dowsett et al. (2012) |
| Beaumaris | 15–20 (Median 17.5) | Biostratigraphy | Warne 2005 |
| Eomonachus belegaerensis | 17.6 | Biostratigraphy | Dowsett et al. (2012) |
| Motunau | 17.68 | Isotope (oxygen and carbon) | Herbert et al. (2016) |
| Waipunga | 19.06 | Isotope (oxygen and carbon) | Herbert et al. (2016) |
| Pliophoca etrusca | 25.76 | Isotope (oxygen and carbon) | Herbert et al. (2016) |
| Homiphoca capensis | 20.79 | Isotope (oxygen and carbon) | Herbert et al. (2016) |
RRphylo Results
Figure A1.
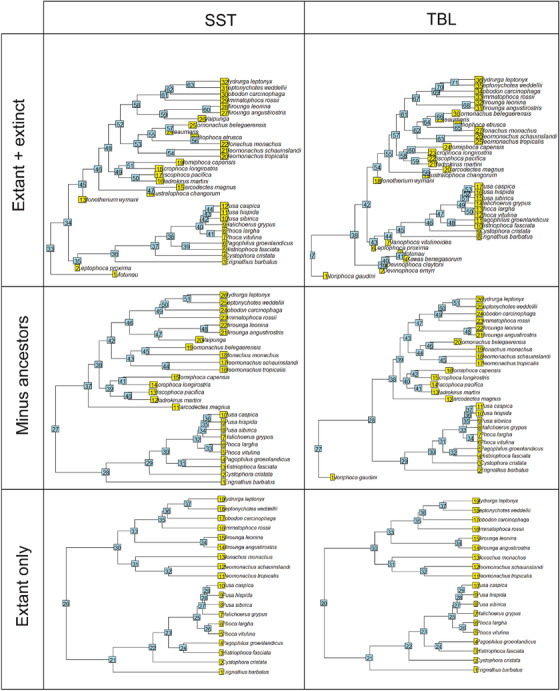
Clade numbers for overfitRR analysis of all datasets in Table A7.
Table A7.
OverfitRR analysis of search.shift results, with 100 ancestral state estimation regression simulations. For each clade, values for p.shift+ and p.shift– are the percentage of simulations that obtained statistically significant (P‐value < 0.05) positive or negative evolutionary rate shifts. “All clades” reports results assuming all nodes evolved under a single rate
| Phylogeny | Clade | p.shift+ | p.shift– |
|---|---|---|---|
| Extant + extinct maximum TBL | All clades | 0.4 | 0 |
| 43 | 0.4 | 0.1 | |
| 44 | 0.4 | 0.1 | |
| 45 | 0.4 | 0.1 | |
| 46 | 0.4 | 0.1 | |
| 47 | 0.4 | 0 | |
| 49 | 0.4 | 0 | |
| 57 | 0.4 | 0 | |
| 61 | 0.4 | 0 | |
| 62 | 0.4 | 0 | |
| 67 | 0.5 | 0 | |
| Minus ancestor maximum TBL | All clades | 0.13 | 0 |
| 35 | 0.77 | 0 | |
| 44 | 0 | 0.92 | |
| Extant only minimum TBL | All clades | 0.04 | 0 |
| 27 | 0.61 | 0 | |
| 30 | 0 | 0.23 | |
| Extant only maximum TBL | 27 | 0.85 | 0 |
| Extant + extinct median SST | All clades | 0.89 | 0 |
| 52 | 0.97 | 0 | |
| 43 | 0.18 | 0.01 | |
| Minus ancestors median SST | All clades | 0.57 | 0 |
| 35 | 0.1 | 0.01 | |
| 39 | 0 | 0 | |
| 42 | 1 | 0 | |
| Extant only minimum SST | All clades | 0.01 | 0.12 |
| 22 | 0 | 0.92 | |
| 31 | 0.76 | 0 | |
| Extant only median SST | All clades | 0.74 | 0 |
| 28 | 0.53 | 0.01 | |
| 31 | 0.6 | 0 | |
| Extant only maximum SST | All clades | 0.12 | 0.02 |
| 28 | 0.62 | 0 | |
| 35 | 0 | 0.69 |
Regression Results
Table A8.
Linear regression of log total body length and sea surface temperature tolerance for Phocidae. DF = degrees of freedom
| Extant + Extinct | Extant Only | ||||||
|---|---|---|---|---|---|---|---|
| TBL ∼ SST | Lrg TBL ∼ Max SST | Lrg TBL ∼ Med SST | Lrg TBL ∼ Min SST | Sml TBL ∼ Max SST | Sml TBL ∼ Med SST | Sml TBL ∼ Min SST | |
| Min | –0.49 | –0.27 | –0.27 | –0.26 | –0.23 | –0.22 | –0.21 |
| Q1 | –0.10 | –0.12 | –0.14 | –0.13 | –0.09 | –0.11 | –0.10 |
| Median | –0.02 | –0.001 | 0.03 | –0.03 | 0.33 | 0.03 | –0.03 |
| Q3 | 0.11 | 0.08 | 0.09 | 0.09 | 0.10 | 0.11 | 0.10 |
| Max | 0.39 | 0.36 | 0.36 | 0.38 | 0.17 | 0.20 | 0.21 |
| Intercept | 2.41 | 2.47 | 2.4 | 2.37 | 2.40 | 2.33 | 2.31 |
| Slope | –0.01 | –0.006 | –0.003 | 0.002 | –0.005 | –0.001 | 0.003 |
| Standard Error | 0.01 | 0.005 | 0.006 | 0.006 | 0.004 | 0.004 | 0.004 |
| T‐value | –1.24 | –1.13 | –0.47 | 0.27 | –1.29 | –0.27 | 0.77 |
| P‐value | 0.23 | 0.28 | 0.65 | 0.79 | 0.22 | 0.79 | 0.45 |
| Residual standard error | 0.17, 29 DF | 0.17, 17 DF | 0.18, 17 DF | 0.18, 17 DF | 0.13, 17 DF | 0.13, 17 DF | 0.13 |
| Multiple R 2 | 0.05 | 0.07 | 0.01 | 0.004 | 0.09 | 0.004 | 0.03 |
| Adjusted R 2 | 0.02 | 0.02 | –0.05 | –0.05 | 0.04 | –0.05 | –0.02 |
| F‐statistic | 1.53, 1, and 29 DF | 1.27, 1, and 17 DF | 0.22, 1, and 17 DF | 0.07, 1, and 17 DF | 1.65, 1, and 17 DF | 0.07, 1, and 17 DF | 0.59, 1, and 17 DF |
| P‐value | 0.23 | 0.28 | 0.65 | 0.79 | 0.22 | 0.79 | 0.45 |
Table A9.
Phylogenetic generalised least squares regression of log total body length and sea surface temperature tolerance for Phocidae
| Extant + Extinct | Extant Only | ||||||
|---|---|---|---|---|---|---|---|
| TBL ∼ SST | Lrg TBL ∼ Max SST | Lrg TBL ∼ Med SST | Lrg TBL ∼ Min SST | Sml TBL ∼ Max SST | Sml TBL ∼ Med SST | Sml TBL ∼ Min SST | |
| AIC | –22.43 | –25.97 | –26.54 | –26.71 | –40.04 | –40.16 | –39.94 |
| BIC | –18.13 | –23.14 | –23.71 | –23.88 | –37.21 | –37.33 | –37.10 |
| Log likelihood | 14.21 | 15.99 | 16.27 | 16.36 | 23.02 | 23.08 | 22.97 |
| Min | –2.24 | –1.88 | –1.98 | –2.06 | –2.34 | –2.39 | –2.36 |
| Q1 | –0.63 | –1.06 | –1.12 | –1.28 | –1.22 | –1.28 | –1.38 |
| Median | –0.22 | –0.17 | –0.13 | –0.14 | –0.10 | 0.02 | –0.09 |
| Q3 | 0.20 | 0.28 | 0.31 | 0.34 | 0.62 | 0.59 | 0.62 |
| Max | 1.46 | 2.08 | 2.05 | 1.97 | 1.42 | 1.39 | 1.46 |
| Intercept | 2.41 | 2.43 | 2.46 | 2.44 | 2.37 | 2.37 | 2.36 |
| Slope | –0.002 | –0.001 | –0.004 | –0.005 | –0.001 | –0.002 | –0.001 |
| Standard error | 0.006 | 0.004 | 0.005 | 0.005 | 0.003 | 0.004 | 0.004 |
| T‐value | –0.32 | –0.32 | –0.79 | –0.88 | –0.37 | –0.50 | –0.21 |
| P‐value | 0.75 | 0.75 | 0.44 | 0.39 | 0.71 | 0.63 | 0.84 |
| Residual standard error | 0.24 | 0.16 | 0.16 | 0.16 | 0.11 | 0.11 | 0.11 |
| Degrees of freedom | 31 total, 29 residual | 19 total, 17 residual | 19 total, 17 residual | 19 total, 17 residual | 19 total, 17 residual | 19 total, 17 residual | 19 total, 17 residual |
Ratematrix Results
Table A10.
Evolutionary rate matrix for extant + extinct taxa using the package ratematrix. TBL = total body length, SST = sea surface temperature
| TBL | SST | |
|---|---|---|
| TBL | 0.008157 | 0.019207 |
| SST | 0.019207 | 4.289097 |
Figure A2.
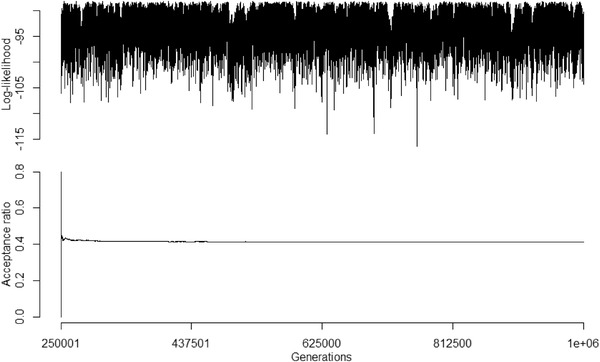
Log‐likelihood trace plot and acceptance ratio of first evolutionary rate matrix MCMC chain. MCMC chain ran for 1 million generations, with the first 25% discarded as burnin and sampling every 1000 generations. Acceptance ratio for the MCMC chain was ∼0.41 (correlation = 0.62; standard deviation = 0.15; root = 0.93).
Figure A3.
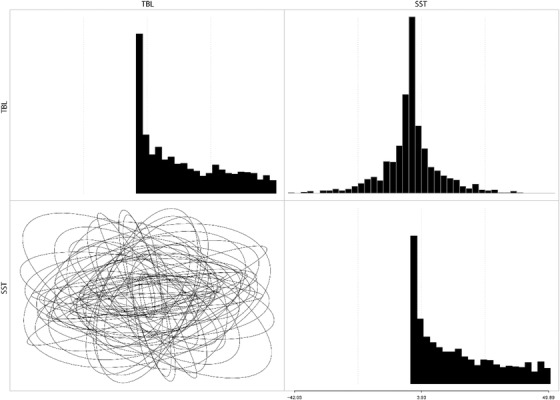
The prior distribution of the first evolutionary rate matrix MCMC chain.
Figure A4.
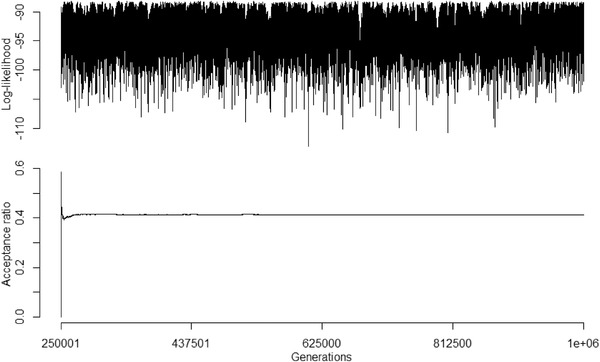
Log‐likelihood trace plot and acceptance ratio of the second evolutionary rate matrix MCMC chain. MCMC chain ran for 1 million generations, with the first 25% discarded as burnin and sampling every 1000 generations. Acceptance ratio for the MCMC chain was ∼0.41 (correlation = 0.62; standard deviation = 0.15; root = 0.93).
Figure A5.
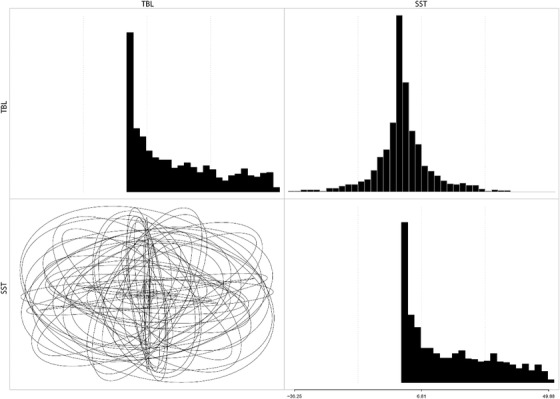
The prior distribution of the second evolutionary rate matrix MCMC chain.
Figure A6.
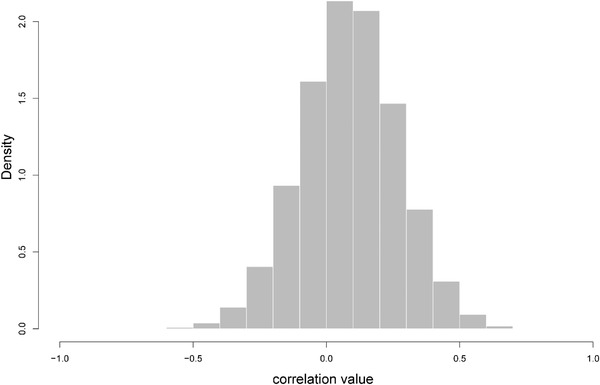
Histogram of the posterior distribution of evolutionary correlation among log total body length and sea surface temperature, extracted from the two merged MCMC chains. Minimum = −0.68; 1st quartile = −0.03; Median = 0.09; Mean = 0.09; 3rd quartile = 0.21; Maximum = 0.79.
Figure A7.
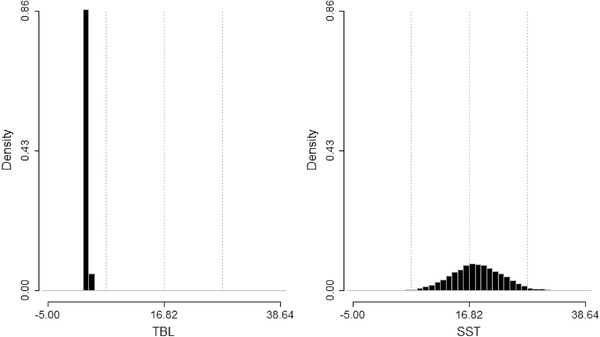
Posterior distribution of root values for log total body length (TBL) and sea surface temperature (SST) sampled from the merged MCMC chains.
Table A11.
Gleman's R convergence check between the two ratematrix MCMC chains, with potential scale reduction factors for the root values and evolutionary rate matrices, and effective sample size
| Point Estimate | Upper Confidence Interval | Effective Sample Size | |
|---|---|---|---|
| TBL root | 1.00 | 1.00 | 251.54 |
| SST root | 1.01 | 1.03 | 302.44 |
| Matrix TBL‐TBL | 1.00 | 1.00 | 57,230.45 |
| Matrix TBL‐SST | 1.00 | 1.00 | 44,030.33 |
| Matrix SST‐TBL | 1.00 | 1.00 | 44,030.33 |
| Matrix SST‐SST | 1.00 | 1.00 | 61,000.78 |
LITERATURE CITED
- Adamczak, S.K. , Pabst, D.A. , McLellan, W.A. & Thorne, L.H. (2020) Do bigger bodies require bigger radiators? Insights into thermal ecology from closely related marine mammal species and implications for ecogeographic rules. J. Biogeogr., 47, 1193–1206. [Google Scholar]
- Amiot, R. , Göhlich, U.B. , Lecuyer, C. , De Muizon, C. , Cappetta, H. , Fourel, F. , Héran, M.‐A. & Martineau, F. (2008) Oxygen isotope compositions of phosphate from Middle Miocene–Early Pliocene marine vertebrates of Peru. Palaeogeogr. Palaeoclimatol. Palaeoecol., 264, 85–92. [Google Scholar]
- Amson, E. & Muizon, C.D. (2014) A new durophagous phocid (Mammalia: Carnivora) from the late Neogene of Peru and considerations on monachine seals phylogeny. Journal of Systematic Palaeontology, 12, 523‐548. [Google Scholar]
- Andersen, M. , Hjelset, A. , Gjertz, I. , Lydersen, C. & Gulliksen, B. (1999) Growth, age at sexual maturity and condition in bearded seals (Erignathus barbatus) from Svalbard, Norway. Polar Biol., 21, 179–185. [Google Scholar]
- Avery, G. & Klein, R.G. (2011) Review of fossil phocid and otariid seals from the southern and western coasts of South Africa. Trans. R. Soc. S. Afr., 66, 14–24. [Google Scholar]
- Barrick, R.E. , Fischer, A.G. & Bohaska, D.J. (1993) Paleotemperatures versus sea level: oxygen isotope signal from fish bone phosphate of the Miocene Calvert Cliffs, Maryland. Paleoceanography, 8, 845–858. [Google Scholar]
- Bergmann, C. (1847) Uber die Verhaltnisse der Warmeokonomie der Thiere zuihrer Grosse. Gott. Stud., 1, 595‐708. [Google Scholar]
- Berta, A. , Churchill, M. & Boessenecker, R.W. (2018) The origin and evolutionary biology of pinnipeds: seals, sea lions, and walruses. Ann. Rev. Earth Planet. Sci., 46, 203–228. [Google Scholar]
- Berta, A. , Sumich, J.L. & Kovacs, K.M. (2015) Marine mammals: evolutionary biology. 3rd ed. Academic Press, Cambridge, MA. [Google Scholar]
- Bininda‐Emonds, O.R. & Gittleman, J.L. (2000) Are pinnipeds functionally different from fissiped carnivores? The importance of phylogenetic comparative analyses. Evolution, 54, 1011‐1023. [DOI] [PubMed] [Google Scholar]
- Boessenecker, R.W. (2013) A new marine vertebrate assemblage from the Late Neogene Purisima Formation in Central California, part II: pinnipeds and cetaceans. Geodiversitas, 35, 815‐940. [Google Scholar]
- Caetano, D.S. & Harmon, L.J. (2017) ratematrix: an R package for studying evolutionary integration among several traits on phylogenetic trees. Methods in Ecology and Evolution, 8, 1920‐1927. [Google Scholar]
- Castiglione, S. , Serio, C. , Mondanaro, A. , Di Febbraro, M. , Profico, A. , Girardi, G. & Raia, P. (2019a) Simultaneous detection of macroevolutionary patterns in phenotypic means and rate of change with and within phylogenetic trees including extinct species. PloS one, 14, e0210101. [DOI] [PMC free article] [PubMed] [Google Scholar]
- Castiglione, S. , Serio, C. , Tamagnini, D. , Melchionna, M. , Mondanaro, A. , Di Febbraro, M. , Profico, A. , Piras, P. , Barattolo, F. & Raia, P. (2019b) A new, fast method to search for morphological convergence with shape data. PLoS One, 14, e0226949. [DOI] [PMC free article] [PubMed] [Google Scholar]
- Castiglione, S. , Tesone, G. , Piccolo, M. , Melchionna, M. , Mondanaro, A. , Serio, C. , Di Febbraro, M. & Raia, P. (2018) A new method for testing evolutionary rate variation and shifts in phenotypic evolution. Methods in Ecology and Evolution, 9, 974‐983. [Google Scholar]
- Churchill, M. , Boessenecker, R.W. & Clementz, M.T. (2014) Colonization of the Southern Hemisphere by fur seals and sea lions (Carnivora: Otariidae) revealed by combined evidence phylogenetic and Bayesian biogeographical analysis. Zoological Journal of the Linnean Society, 172, 200‐225. [Google Scholar]
- Churchill, M. , Clementz, M.T. & Kohno, N. (2015) Cope's rule and the evolution of body size in Pinnipedimorpha (Mammalia: Carnivora). Evolution, 69, 201‐215. [DOI] [PubMed] [Google Scholar]
- Davies, J. (1958a) The Pinnipedia: an essay in zoogeography. Geographical Review, 48, 474‐493. [Google Scholar]
- Davies, J. (1958b) Pleistocene geography and the distribution of northern pinnipeds. Ecology, 39, 97‐113. [Google Scholar]
- Davies, J. (1963) The antitropical factor in cetacean speciation. Evolution, 17, 107‐116. [Google Scholar]
- Deméré, T.A. , Berta, A. & Adam, P.J. (2003) Pinnipedimorph evolutionary biogeography. Bull. Am. Mus. Nat. Hist., 279, 32–76. [Google Scholar]
- Dewaele, L. , Amson, E. , Lambert, O. & Louwye, S. (2017) Reappraisal of the extinct seal “Phoca” vitulinoides from the Neogene of the North Sea Basin, with bearing on its geological age, phylogenetic affinities, and locomotion. PeerJ, 5, e3316. [DOI] [PMC free article] [PubMed] [Google Scholar]
- Dewaele, L. , Lambert, O. & Louwye, S. (2018) A late surviving Pliocene seal from high latitudes of the North Atlantic realm: the latest monachine seal on the southern margin of the North Sea. PeerJ, 6, e5734. [DOI] [PMC free article] [PubMed] [Google Scholar]
- Dowsett, H.J. & Wiggs, L.B. (1992) Planktonic foraminiferal assemblage of the Yorktown Formation, Virginia, USA. Micropaleontology, 38, 75‐86. [Google Scholar]
- Dowsett, H.J. , Robinson, M.M. , Haywood, A.M. , Hill, D.J. , Dolan, A.M. , Stoll, D.K. , Chan, W.‐L. , Abe‐Ouchi, A. , Chandler, M.A. & Rosenbloom, N.A. (2012) Assessing confidence in Pliocene sea surface temperatures to evaluate predictive models. Nature Climate Change, 2, 365‐371. [Google Scholar]
- Fulton, T.L. & Strobeck, C. (2010) Multiple fossil calibrations, nuclear loci and mitochondrial genomes provide new insight into biogeography and divergence timing for true seals (Phocidae, Pinnipedia). Journal of Biogeography, 37, 814‐829. [Google Scholar]
- Fyler, C.A. , Reeder, T.W. , Berta, A. , Antonelis, G. , Aguilar, A. & Androukaki, E. (2005) Historical biogeography and phylogeny of monachine seals (Pinnipedia : Phocidae) based on mitochondrial and nuclear DNA data. Journal of Biogeography, 32, 1267‐1279. [Google Scholar]
- Govender, R. (2015) Preliminary phylogenetics and biogeographic history of the Pliocene seal, Homiphoca capensis from Langebaanweg, South Africa. Transactions of the Royal Society of South Africa, 70, 25‐39. [Google Scholar]
- Herbert, T.D. , Lawrence, K.T. , Tzanova, A. , Peterson, L.C. , Caballero‐Gill, R. & Kelly, C.S. (2016) Late Miocene global cooling and the rise of modern ecosystems. Nature Geoscience, 9, 843‐847. [Google Scholar]
- Holt, B. , Marx, F.G. , Fritz, S.A. , Lessard, J.‐P. & Rahbek, C. (2020) Evolutionary diversification in the marine realm: a global case study with marine mammals. Frontiers of Biogeography, 12, e45184. [Google Scholar]
- King, J. (1983) Seals of the world. Oxford Univ. Press, Oxford, U.K. [Google Scholar]
- Koretsky, I.A. & Holec, P. P. (2002) A primitive seal (Mammalia: Phocidae) from the early middle Miocene of Central Paratethys. Smithson. Contrib. Paleobiol, 93, 163–178. [Google Scholar]
- Koretsky, I.A. & Rahmat, S.J. (2015) A new species of the subfamily Devinophocinae (Carnivora, Phocidae) from the Central Paratethys. Res. Paleontol. Stratigrap., 121, 31–47. [Google Scholar]
- Knope, M.L. , Bush, A.M. , Frishkoff, L.O. , Heim, N.A. & Payne, J.L. (2020) Ecologically diverse clades dominate the oceans via extinction resistance. Science, 367, 1035‐1038. [DOI] [PubMed] [Google Scholar]
- Laws, R. , Baird, A. & Bryden, M. (2003) Size and growth of the crabeater seal Lobodon carcinophagus (Mammalia: Carnivora). Journal of Zoology, 259, 103‐108. [Google Scholar]
- Lindenfors, P. , Tullberg, B.S. & Biuw, M. (2002) Phylogenetic analyses of sexual selection and sexual size dimorphism in pinnipeds. Behavioral Ecology and Sociobiology, 52, 188‐193. [Google Scholar]
- Liwanag, H.E. , Berta, A. , Costa, D.P. , Budge, S.M. & Williams, T.M. (2012) Morphological and thermal properties of mammalian insulation: the evolutionary transition to blubber in pinnipeds. Biological Journal of the Linnean Society, 107, 774‐787. [Google Scholar]
- Mason, M.J. , Wenger, L.M. , Hammer, Ø. & Blix, A.S. (2020) Structure and function of respiratory turbinates in phocid seals. Polar Biology, 43, 157‐173. [Google Scholar]
- Modig, A. (1996) Effects of body size and harem size on male reproductive behaviour in the southern elephant seal. Animal Behaviour, 51, 1295‐1306. [Google Scholar]
- Paradis, E. , Claude, J. & Strimmer, K. (2004) APE: analyses of phylogenetics and evolution in R language. Bioinformatics, 20, 289‐290. [DOI] [PubMed] [Google Scholar]
- Pennell, M.W. , Eastman, J.M. , Slater, G.J. , Brown, J.W. , Uyeda, J.C. , FitzJohn, R.G. , Alfaro, M.E. & Harmon, L.J. (2014) geiger v2. 0: an expanded suite of methods for fitting macroevolutionary models to phylogenetic trees. Bioinformatics, 30, 2216‐2218. [DOI] [PubMed] [Google Scholar]
- Pimiento, C. , Griffin, J.N. , Clements, C.F. , Silvestro, D. , Varela, S. , Uhen, M.D. & Jaramillo, C. (2017) The Pliocene marine megafauna extinction and its impact on functional diversity. Nature ecology & evolution, 1, 1100–1106. [DOI] [PubMed] [Google Scholar]
- Pinheiro, J. , Bates, D. , DebRoy, S. , Sarkar, D. , Heisterkamp, S. , Van Willigen, B. & Maintainer, R. (2017) ‘nlme’: linear and nonlinear mixed effects models, version 3. R package.
- Quental, T.B. & Marshall, C.R. (2010) Diversity dynamics: molecular phylogenies need the fossil record. Trends in ecology & evolution, 25, 434‐441. [DOI] [PubMed] [Google Scholar]
- Ray, C.E. (1976) Geography of phocid evolution. Systematic Biology, 25, 391‐406. [Google Scholar]
- Repenning, C.A. , Ray, C.E. & Grigorescu, D. (1979) Pinniped biogeography. Historical biogeography, plate tectonics, and the changing environment,, 357‐369. [Google Scholar]
- Revell, L.J. (2012) phytools: an R package for phylogenetic comparative biology (and other things). Methods in ecology and evolution, 3, 217‐223. [Google Scholar]
- Rogers, T.L. (2009) Leopard seal: Hydrurga leptonyx . Pp. 673–674 in Perrin W. F., Würsig B. & Thewissen J. G. M., eds. Encyclopedia of marine mammals. Elsevier, Amsterdam, The Netherlands. [Google Scholar]
- Rule, J.P. , Hocking, D.P. & Fitzgerald, E.M.G. (2019) Pliocene monachine seal (Pinnipedia: Phocidae) from Australia constrains timing of pinniped turnover in the Southern Hemisphere. Journal of Vertebrate Paleontology, 39, e1734015. [Google Scholar]
- Rule, J.P. , Adams, J.W. , Marx, F.G. , Evans, A.R. , Tennyson, A.J. , Scofield, R.P. & Fitzgerald, E.M. (2020a) First monk seal from the Southern Hemisphere rewrites the evolutionary history of true seals. Proceedings of the Royal Society B, 287, 20202318. [DOI] [PMC free article] [PubMed] [Google Scholar]
- Rule, J.P. , Adams, J.W. , Rovinsky, D.S. , Hocking, D.P. , Evans, A.R. & Fitzgerald, E.M. (2020b) A new large‐bodied Pliocene seal with unusual cutting teeth. Royal Society Open Science, 7, 201591. [DOI] [PMC free article] [PubMed] [Google Scholar]
- Rule, J.P. , Adams, J.W. & Fitzgerald, E.M. (2021a) Colonization of the ancient southern oceans by small‐sized Phocidae: new evidence from Australia. Zoological Journal of the Linnean Society, 191, 1160–1180. [Google Scholar]
- Rule, J.P. , Adams, J.W. , Marx, F.G. , Evans, A.R. , Tennyson, A.J. , Scofield, R.P. & Fitzgerald, E.M. (2021b) Correction to: first monk seal from the Southern Hemisphere rewrites the evolutionary history of true seals. Proceedings of the Royal Society B, 288, 20211858. [DOI] [PMC free article] [PubMed] [Google Scholar]
- Samaranch, R. & Gonzalez, L. (2000) Changes in morphology with age in Mediterranean monk seals (Monachus monachus). Marine mammal science, 16, 141‐157. [Google Scholar]
- Sepúlveda, M. , Oliva, D. , Duran, L.R. , Urra, A. , Pedraza, S.N. , Majluf, P. , Goodall, N. & Crespo, E.A. (2013) Testing Bergmann's rule and the Rosenzweig hypothesis with craniometric studies of the South American sea lion. Oecologia, 171, 809‐817. [DOI] [PubMed] [Google Scholar]
- Stirling, I. (1971) Leptonychotes weddelli. Mammalian Species, 19, 1‐5. [Google Scholar]
- Torres‐Romero, E.J. , Morales‐Castilla, I. & Olalla‐Tárraga, M.Á. (2016) Bergmann's rule in the oceans? Temperature strongly correlates with global interspecific patterns of body size in marine mammals. Global Ecology and Biogeography, 25, 1206‐1215. [Google Scholar]
- Valenzuela‐Toro, A.M. , Gutstein, C.S. , Varas‐Malca, R.M. , Suarez, M.E. & Pyenson, N.D. (2013) Pinniped turnover in the South Pacific Ocean: new evidence from the Plio‐Pleistocene of the Atacama Desert. Chile. Journal of Vertebrate Paleontology, 33, 216‐223. [Google Scholar]
- Valenzuela‐Toro, A.M. , Pyenson, N.D. , Gutstein, C.S. & Suarez, M.E. (2016) A new dwarf seal from the late Neogene of South America and the evolution of pinnipeds in the Southern Hemisphere. Pap Palaeontol, 2, 101‐115. [Google Scholar]
- Velez‐Juarbe, J. & Valenzuela‐Toro, A.M. (2019) Oldest record of monk seals from the North Pacific and biogeographic implications. Biology letters, 15, 20190108. [DOI] [PMC free article] [PubMed] [Google Scholar]
- Warne, M.T. (2005) The global Mio–Pliocene climatic equability and coastal ostracod faunas of southeast Australia. Palaeogeography, palaeoclimatology, palaeoecology, 225, 248‐265. [Google Scholar]
- Wyss, A.R. (1994) The evolution of body size in phocids: some ontogenetic and phylogenetic observations. Pp. 69–75 in Berta A. & Deméré T. A., eds. Contributions in marine mammal paleontology honoring Frank C. Whitmore Jr. Forgotten Books, Lond. [Google Scholar]
- Yonezawa, T. , Kohno, N. & Hasegawa, M. (2009) The monophyletic origin of sea lions and fur seals (Carnivora; Otariidae) in the Southern Hemisphere. Gene, 441, 89‐99. [DOI] [PubMed] [Google Scholar]
Associated Data
This section collects any data citations, data availability statements, or supplementary materials included in this article.
Supplementary Materials
Supporting Information
Data Availability Statement
Additional datasets and results are available as Supporting Information. The R‐script (https://doi.org/10.6084/m9.figshare.13515458), input files (https://doi.org/10.6084/m9.figshare.13515461), and output data (https://doi.org/10.6084/m9.figshare.13515470) are available on the Figshare repository. Fossils used in this study are deposited in the following permanent and accessible institutions: Museum of New Zealand Te Papa Tongarewa, Canterbury Museum, Museo Paleontológico ‘Egidio Feruglio’, Museums Victoria, Muséum national d'Histoire naturelle, and Smithsonian Institution National Museum of Natural History


