Abstract
Water-soluble sulfated polysaccharides extracted from Ulva intestinalis and fractionated using DEAE Sepharose fast flow column to identify their molecular properties and macrophage cells stimulating activities. Crude and fractions (F1 and F2) were formed of neutral sugars (58.7–74.7%), sulfates (6.2–24.5%), uronic acids (4.9–5.9%) and proteins (3.2–10.4%). Different levels of sugar constituents including rhamnose (30.1–39.1%), glucose (39.0–48.4%), galactose (0.0–15.8%), xylose (8.5–11.3) and arabinose (0.0–5.1%). The molecular weight (Mw) of crude and fractionated polysaccharides ranged from 87.1 × 10³ to 194.1 × 10³ (g/mol). Crude polysaccharides were not toxic to RAW264.7 cells and fractions induced cell proliferation. Fraction F1 stimulated RAW264.7 cells to release considerable amounts of nitric oxide, IL-1β, TNF-α, IL-6, IL-10 and IL-12 cytokines. The main backbone of the most immunostimulating polysaccharide (F1) was consisted of mixed linkages of (1 → 2)-linked rhamnose and (1 → 2)-linked glucose residues.
Keywords: Ulva intestinalis, Sulfated polysaccharides, Ulvan, Molecular weight, Immunostimulating activity
1. Introduction
Green seaweeds are one of the three major divisions of marine macro algae, along with brown and red seaweeds, which synthesize sulfated polysaccharides. These polysaccharides that play an important structural role in green seaweeds are located in the intercellular space and fibrillar matrix of the cell wall where they bind with cellulose, proteins and other polysaccharides through ionic interactions and hydrogen bonding [1]. Some of the structurally elucidated sulfated polysaccharides from green seaweeds are ulvans from Ulva and Enteromorpha, rhamnans from Monostroma and arabino-galactans and mannans from Codium [2–4].
Among these polysaccharides, ulvans were established to be formed of rhamnose, xylose, glucuronic acid and sulfate in the early studies [5,6]. Different levels of mannose, arabinose and galactose have been found in species such as E. clathrate and E. linza [7,8]. The rhamnose constituents are determined to be chiefly connected through glycosidic linkages including α-(1 →2)-, α-(1 →3)-and α-(1 →4)-linked Rha with branches of α-(1 →2,4)-linked Rha [9,3]. As a distinctive feature of this type of polysaccharides, sulfate esters mostly occur at C-3 and/or C-2 positions of Rha or C-2 of Xyl units [9,10]. In addition to variability in chemical composition of ulvan polysaccharides, their molecular weights also showed a great amount of difference ranging from 150 to 2000 × 103 g/mol [11]. These broad variations in the chemical structure of ulvans may basically rise from differences in species, harvesting region and growth conditions of the selected seaweeds [12]. Besides, the protocol of choice to isolate the polysaccharide and the following analytical methods are determinant in the final elucidated structure. The biological activities of sulfated polysaccharides which might differ from one species to another is closely in relation to one or more of their structural characteristics including monosaccharide composition, amount and position of sulfate esters, uronic acids and molecular weights [12]. The structural diversity of ulvan polysaccharides has enabled them to exert a variety of therapeutic activities such as antioxidant, anti-hyperlipidemic, anticancer, immunomodulatory [8,13,14]. Sulfated polysaccharides have a great potential to boost immune system via activating macrophages, T cells, B cells, natural killer cells (NK) and cytotoxic T cells [15]. For instance, sulfated polysaccharides from Codium fragile were found to be potent immune-stimulating polymers which activated both macrophage cells through NF-KB and MAPK pathways, and NK cells through the expression of activating receptor, NKp30 [16,17].
Although, there is a growing number of researches conducted on the immunomodulatory activities of sulfated polysaccharides from green seaweeds, the extent of their activities greatly varies among different species and the structure–activity correlations are missing. Therefore, the current study aims to investigate the macrophage stimulating capacity of water-soluble sulfated polysaccharides from Ulva intestinalis and find its relationship with structural and molecular properties of the purified polysaccharides.
2. Materials and methods
2.1. Materials
U. intestinalis was collected from the coast Noor, Iran. Then, fresh alga was washed with tap water and dried at 60 °C. The dried alga was pulverized using a blender, sieved (<0.5 mm) and stored in plastic bags at −20 °C. RPMI-1640 medium and fetal bovine serum (FBS) used in cell culture were purchased from Lonza (Walkersville, MD, USA). All other chemicals and reagents were of analytical grade.
2.2. Isolation of crude polysaccharide
Initially, 20 g of seaweed powder was treated with ethanol (80% EtOH, 200 mL) under constant stirring overnight at ambient temperature to remove lipids, pigments and low molecular weight compounds. The mixture was centrifuged at 10 °C and 8000 rpm for 10 min and supernatants were discarded. The residue was rinsed with acetone and dried at room temperature in a fume hood. Distilled water (400 mL) was added into depigmented powder (20 g) and the extraction was carried out at 65 °C with stirring for 2 h. The supernatants were collected after centrifugation at 10 °C and 10,000 rpm for 10 min. The extraction was carried out twice and the supernatants were combined and concentrated by evaporation under reduced pressure at 60 °C. The polysaccharide precipitation was carried out using EtOH (99%) to obtain a final EtOH concentration of 70%. The mixture was kept at 4 °C overnight and the precipitate was obtained after centrifugation at 10 °C and 10,000 rpm for 10 min. The polysaccharide precipitates were washed and dehydrated with 99% EtOH, acetone, and then dried at room temperature. The yield of isolated polysaccharide was calculated in relation to the depigmented powder obtained after 80% EtOH treatment.
2.3. Polysaccharide fractionation
The crude polysaccharides were fractionated on DEAE Sepharose fast flow column (17-0709-01; GE Healthcare BioScience AB, Uppsala, Sweden). To prepare the sample, 250 mg of crude polysaccharides were dissolved in distilled water (10 mL) at 65 °C for 15 min. The solution was filtered using a 3.0-μm filter and then injected into the column which was later eluted with distilled water and a stepwise NaCl gradient (0.5–2 M). All fractions were determined with the phenol-H2SO4 assay by measuring the absorbance at 490 nm. The carbohydrate-positive fractions were pooled together, concentrated, dialyzed and lyophilized. Two fractions obtained were designated as F1 and F2.
2.4. Chemical composition of polysaccharides
The amount of neutral sugars of the polysaccharides was determined by the phenol–sulfuric acid method using d-glucose as a standard [18]. The amount of protein was determined by the Lowry method [19] using a DC protein assay kit (Bio-Rad, CA, USA). Uronic acid content was determined by a sulfamate/m-hydroxydiphenyl assay using glucuronic acid as a standard [20]. The polysaccharides were hydrolyzed with 0.5 M HCl and then BaCl2 gelatin method using K2SO4 as a standard was used to measure the amount of sulfate [21].
2.5. Monosaccharide composition of polysaccharides
Initially, the polysaccharides were hydrolyzed with 4 M TFA at 100 °C for 6 h. Then, the hydrolysates were reduced in water using NaBD4 and acetylated with acetic anhydride. The final derivatives were analyzed by a gas chromatography–mass spectrometry (GC–MS) (6890N/MSD5973, Agilent Technologies, Santa Clara, CA) equipped with HP-5MS capillary column (30 m × 0.25 mm × 0.25 μm) (Agilent Technologies, Santa Clara, CA).
2.6. Glycosidic linkage analysis
The Ciucanu and Kerek method [22] was used to identify the glycosidic linkages of the polysaccharides. The polysaccharides (3 mg) were solubilized in 0.5 mL DMSO (dimethylsulfoxide) under nitrogen and methylation was performed with 0.3 mL CH3I and NaOH (20 mg). Then, acid hydrolysis was carried out on the methylated samples with 4 M TFA at 100 °C for 6 h. The reduction of hydrolysates was conducted in distilled water with NaBD4 and acetic anhydride was used for acetylation. The partially methylated alditol acetate derivatives were injected into a gas chromatography mass spectrometry (GC–MS) system (6890 N/MSD 5973, Agilent Technologies, Santa Clara, CA) equipped with HP-5MS capillary column (30 m 0.25 mm 0.25 μm) (Agilent Technologies, Santa Clara, CA). Helium was used as the carrier gas at a constant flow rate of 1.2 mL/min. The temperature program of the oven was as follows: from 160 to 210 °C for 10 min and then to 240 °C for 10 min. The temperature gradient was 5 °C/min and the inlet temperature was kept constant at 250 °C. The mass range was set to measure between 35 and 450 m/z.
2.7. ATR-FTIR analysis
Fourier transform infrared (FT-IR) spectra of polysaccharides were obtained to determine the functional groups. The samples were scanned at wavenumbers ranging from 500 to 4000 cm−1 at a resolution of 2 cm−1 using a Tensor 27 spectrometer (Bruker Instruments, Billerica, USA). Polysaccharides were mixed with KBr as a 0.5–1 mm thick film and analyzed by ATR-FTIR using absorbance mode.
2.8. Determination of molecular properties
Polysaccharides were dissolved in distilled water (2 mg/mL) and heated for 30 s in a microwave bomb prior to molecular measurement (#4872; Parr Instrument Co., Moline, IL, USA). The samples were immediately filtered through a cellulose acetate membrane (3.0 μm pore size; Whatman International). A high performance size exclusion chromatography column (TSK G5000 PW, 7.5 × 600 mm; Toso Biosep, Montgomeryville, PA, USA) linked to a UV detector (Waters, 2487), multi-angle laser light scattering (HELEOS; Wyatt Technology Corp, Santa Barbara, CA, USA) and refractive index detection (Waters, 2414) system (HPSEC-UV-MALLS-RI) were used to analyze the molecular characteristics. The mobile phase was composed of an aqueous solution of 0.15 M NaNO3 and 0.02% NaN3 with the flow rate of 0.4 mL/min. Bovine serum albumin (BSA) was employed to determine the volume delays among the UV, MALLS and RI detectors [23].
ASTRA 5.3 software (Wyatt Technology Corp.) was used to calculate the weight average molecular weight (Mw), radius of gyration (Rg) and polydispersity. The specific volume of gyration (SVg) was calculated based on the following equation [24]:
in which N is Avogadro’s number (6.02 × 10²³/mol) and the units for SVg, Mw and Rg were cm3/g, g/mol and nm respectively.
2.9. RAW264.7 macrophage proliferation and nitric oxide production assays
RAW264.7 macrophage cells in an RPMI-1640 medium containing 10% FBS were plated in a 96-well microplate (1 × 10⁴ cells/well, 100-μL volume; ATCC). The cells were incubated with 100 μL of the polysaccharides at different concentrations (10, 25 and 50 μg/mL) in triplicate. The cell cultures were kept in humidified atmosphere containing 5% CO2 at 37 °C for 72 h. Then, the WST-1 solution (20 μL) was added to the wells and the solution was further incubated for 4 h at 37 °C. The optical density was measured at 450 nm using a microplate reader (EL-800; BioTek Instruments, Winooski, VT, USA). The absorbance (A) was translated into a macrophage proliferation ratio (%) = At/Ac × 100, where At and Ac are the absorbance of the test group and control group, respectively.
The nitric oxide (NO) released by macrophages into culture supernatants was measured as an indicator of immunoenhancing activity of alginates. RAW264.7 cells were plated in a 96-well plate (1 × 10⁵ cells/well) and incubated in the presence of polysaccharides (10, 25 and 50 μg/mL) and LPS (1.0 μg/mL) at 37 °C for 18 h. The amount of NO production was measured using the Griess reaction [25]. NaNO2 (1–200 μM in culture medium) was used as reference to quantify the amount of NO produced by macrophages.
2.10. Reverse transcription-polymerase chain reaction (RT-PCR)
Polysaccharides or LPS were added to RAW264.7 cells (1 × 10⁵ cells/well) and incubated at 37 °C for 18 h. The TRIzol reagent (Invitrogen, Carlsbad, CA, USA) was used to extract the total RNA from RAW264.7 cells according to the manufacturer’s protocol. After quantification of RNA concentration using a spectrophotometer, construction of cDNA was performed with an oligo-(dT)20 primer and Superscript III RT (Invitrogen, Carlsbad, CA, USA). PCR amplification was then performed by GoTaq Flexi DNA Polymerase (Promega, Madison, WI, USA) and specific primers. The primers used were as follows: iNOS, 5′-CCCTTCCGAAGTTTCTGGCAGCAGC-3′ (forward) and 5′-GGCTGTCAGAGCCTCGTGGCTTTGG-3′ (reverse); IL-1β, 5′ ATGGCAACTATTCCTGAACTCAACT-3′ (forward) and 5′-CAGGACAGGTATAGATTCTTTCCTTT-3′ (reverse); IL-6, 5′-TTCCTCTCTGCAAGAGACT-3′ (forward) and 5′-TGTATCTCTCTGAAGGACT-3′ (reverse); IL-10, 5′-TACCTGGTAGAAGTGATGCC-3′ (forward) and 5′-CATCATGTATGCTTCTATGC-3′ (reverse); TNF-α, 5′-ATGAGCACAGAAAGCATGATC-3′ (forward) and 5′-TACAGG CTTGTCACTCGAATT-3′ (reverse); IL-12, 5′-CCACAAAGGAGGCGAGACTC-3′ (forward) and 5′-CTCT-ACGAGGAACGCACCTT-3′ (reverse)and β-actin, 5′-TGGAATCCTGTGGCATCCATGAAAC-3′ (forward) and 5′-TAAAACGCAGCTCAGTAACAGTCCG-3′ (reverse). Reverse transcriptase amplification was conducted with an initial denaturation at 94 °C for 3 min, 30 cycles of denaturation (94 °C for 30 s), annealing (56 °C for 40 s) and extension (72 °C for 1 min), and then a final extension step at 72 °C for 10 min. The electrophoresis of the PCR products was run on a 1% agarose gel and visualized by ethidium bromide staining.
2.11. Statistical analyses
All experiments were conducted in triplicate (n = 3) and statistical analysis performed using SPSS software (Version 16; SPSS Inc., Chicago, IL, USA). Significant differences were identified by one-way analysis of variance (ANOVA) and Duncan’s multiple-range test. A probability value of p < 0.05 was considered to be statistically significant.
3. Results and discussions
3.1. Chemical composition
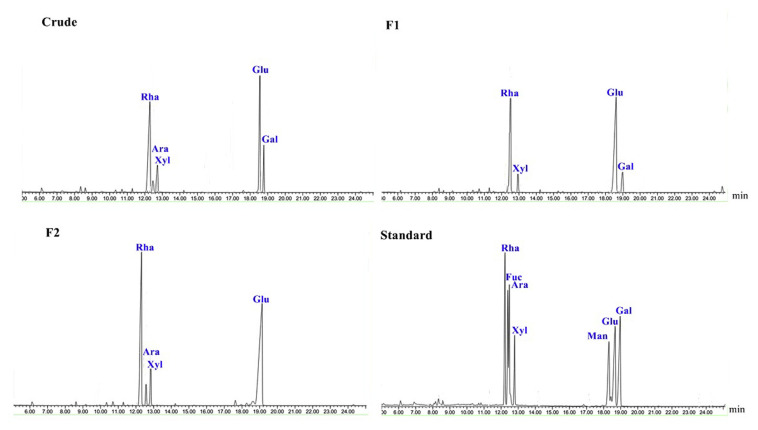
The yields and chemical compositions of the polysaccharides from U. intestinalis are shown in Table 1. The extraction yield for crude polysaccharides was found to be 12.0% which was higher than that of Ulva clathrata (7.7%) and lower than that of Ulva pertusa (14.2%) [13,26]. The yield of polysaccharides reported in green seaweeds is very diverse and fall in a wide range of 8.0–18.3% [27–29]. The chains of crude polysaccharides were mostly made of neutral sugars (58.7%) substituted with a relatively large amount of sulfate esters (18.4%). Proteins (10.4%) and uronic acids (5.84%) occurred at minor amounts in the extracted polysaccharide. The proximate composition of polysaccharides from green seaweeds has shown a wide variation for carbohydrates (38.6–61.4%), sulfates (19.4–34.0%), uronic acids (6.5–35.0%) and proteins (0.3–17.0%) [30–32]. The analysis of monosaccharide composition revealed that glucose (40.88%) and rhamnose (30.18%) formed the major sugar constituents of the crude polysaccharides whereas galactose (15.79%), xylose (8.53%) and arabinose (4.61%) were detected at lower amounts (Fig. 1).
Table 1.
Yield and chemical composition of the polysaccharide from U. intestinalis.
| Chemicals | Crude | F1 | F2 |
|---|---|---|---|
| Yield (%) | 12.0 | 40.8 ± 1.90 | 59.1 ± 1.90 |
| Neutral sugars (%) | 58.7 ± 0.41 | 74.7 ± 1.55 | 68.4 ± 0.75 |
| Protein (%) | 10.4 ± 0.55 | 3.25 ± 0.15 | – |
| Sulfate (%) | 18.4 ± 0.14 | 6.25 ± 0.45 | 24.5 ± 0.39 |
| Uronic acid (%) | 5.84 ± 0.04 | 5.95 ± 0.06 | 4.90 ± 0.30 |
| Monosaccharide composition (%) | |||
| Rhamnose | 30.18 ± 0.48 | 39.13 ± 0.01 | 35.19 ± 0.72 |
| Arabinose | 4.61 ± 0.76 | – | 5.10 ± 0.06 |
| Xylose | 8.53 ± 0.30 | 10.47 ± 0.63 | 11.31 ± 0.16 |
| Glucose | 40.88 ± 0.53 | 39.05 ± 0.19 | 48.39 ± 0.94 |
| Galactose | 15.79 ± 0.04 | 11.35 ± 0.45 | – |
Fig. 1.
GC chromatograms of monosaccharides of crude, F1 and F2 polysaccharides from U. intestinalis.
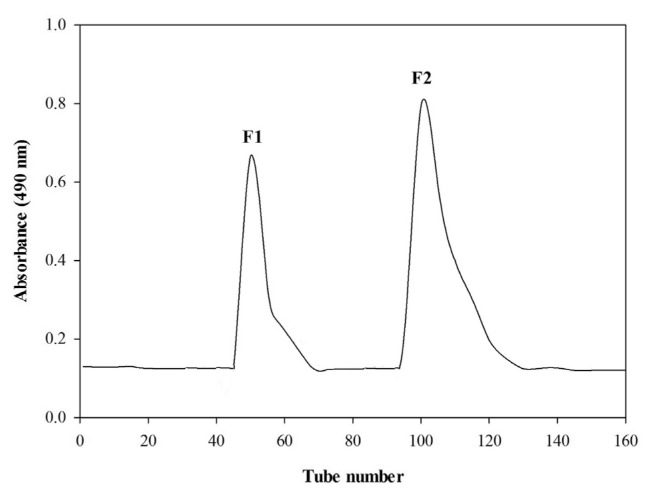
The fractionation of crude polysaccharides using DEAE Sepharose Fast Flow column resulted in two fractions namely F1 (40.8%) and F2 (59.1%) (Fig. 2). The composition of fraction F1 was found to be notably different from that of crude polysaccharide and contained more neutral sugars (74.7%) with less sulfates (6.25%) and proteins (3.25%). Conversely, fraction F2 composed of higher sulfates (24.5%) with no proteins. The sugar chain of fraction F1 was almost equally formed of rhamnose (39.13%) and glucose (39.05%) monosaccharides with no arabinose. Fraction F2, on the other hand, had no galactose and glucose (48.39%) was found to be significantly higher than rhamnose (35.19%). A great amount of glucose, nearly as high as rhamnose, has been previously reported in the polysaccharide structure of U. intestinalis extracted at 80 °C for 24 h [33].
Fig. 2.
The elution profile of polysaccharides from U. intestinalis on DEAE Sepharose fast flow column.
3.2. Molecular properties of crude polysaccharides and fractions
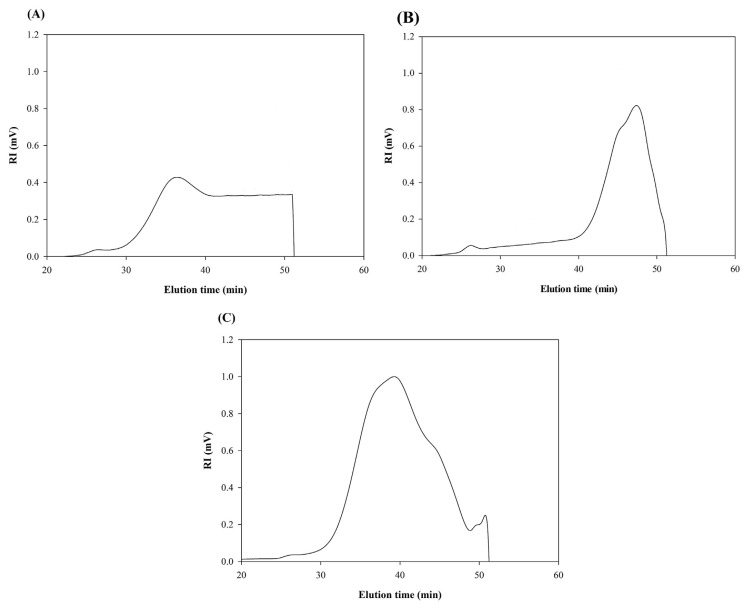
The molecular characteristics of the crude and fractionated polysaccharides were determined by multi angle laser light scattering technique (MALLS) using a high performance size exclusion column (HPSEC). The refractive index (RI) chromatograms of crude polysaccharide and fractions F1 and F2 are presented in Fig. 3A–C. As shown in Fig. 3A, the molecules of the crude polysaccharides were eluted from SEC column between elution times of 30 and 52 min which indicated the wide molecular distribution of crude polysaccharides and their heterogeneous molecular nature. The weight average molecular weight (Mw) and radius of gyration (Rg) of the crude polysaccharide were 194.15 × 10³ g/mol and 42.8 nm, respectively (Table 2). In a different study, the Mw of polysaccharide isolated from U. intestinalis was found to be 300 × 103 g/mol [33]. These discrepancies in the Mw of the polysaccharides extracted from the same species could come from the differences in the extraction conditions and/or growing conditions of the seaweeds.
Fig. 3.
HPSEC chromatograms of crude (A), F1 (B) and F2 (C) polysaccharides determined using a TSK G5000 PW column at a flow rate of 0.4 mL/min.
Table 2.
Weight average molecular weight (Mw), radius of gyration (Rg) and specific volume of gyration (SVg) of polysaccharides from U. intestinalis.
| MW × 103 (g/mol) | Rg (nm) | SVg (cm3/g) | |
|---|---|---|---|
| Crude | 194.15 ± 1.06 | 42.8 ± 1.41 | 1.02 |
| F1 | 28.7 ± 2.12 | 57.3 ± 0.56 | 16.53 |
| F2 | 87.15 ± 3.18 | 67.7 ± 1.13 | 8.97 |
The RI chromatogram of fraction F1 was a single narrow peak eluting from SEC column between elution times of 40 and 52 min (Fig. 3B). Fraction F2 analysis showed a broader peak eluting between elution times of 30 and 52 min (Fig. 3C). The Mw of fraction F1 was significantly low (28.70 × 10³ g/mol) whereas that of fraction F2 was relatively higher (87.15 × 10³ g/mol). Besides, the measurement of Rg values showed smaller size of polysaccharide molecules for fraction F1 (57.3 nm) compared with that of fraction F2 (67.7 nm).
The Mw and Rg values of crude and fractions were used to calculate the specific volume of gyration (SVg). The SVg value is in fact the theoretical gyration volume per unit of molar mass and has an inverse relationship to the degree of molecular compactness. The SVg value of crude polysaccharide was 1.02 cm3/g; in contrast, the SVg value of fraction F1 was remarkably higher (16.53 cm3/g) (Table 2). The SVg value of fraction F2 was found to be 8.97 cm3/g. These results implied that the polysaccharides molecules of fractions F1 and F2 had less molecular compactness and more expanded conformational structures than those of crude polysaccharides.
3.3. Bioactivities of crude and fractions
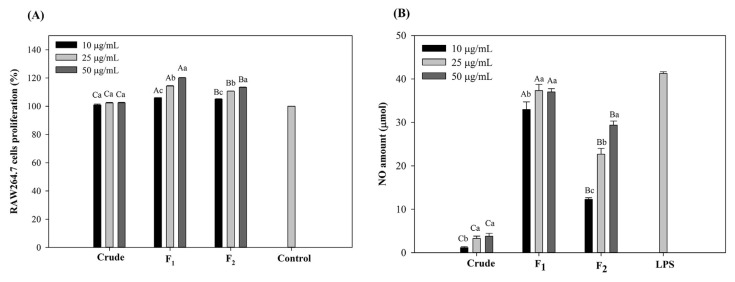
The cytotoxicity of the crude polysaccharides and fractionated polysaccharides was examined using RAW264.7 macrophage cell lines over the concentration range of 10–50 μg/mL. As presented in Fig. 4A, compared with the untreated cells (control), the viability of macrophage cells incubated with crude polysaccharide was more than 100%. When RAW264.7 cells were treated with fraction F1, significant proliferation up to 120% was observed at 50 μg/mL (p < 0.05). Fraction F2 was also nontoxic and could stimulate macrophage proliferation up to 115%.
Fig. 4.
Proliferation activity (A) and nitric oxide production (B) of the RAW264.7 macrophage cells after treatment with crude and fractionated polysaccharides. The letters a, b, c, d indicate a significant difference (p < 0.05) between the concentrations of the polysaccharides, with A, B, C, D indicating a significant difference (p < 0.05) between the polysaccharides at each concentration.
Macrophages play a key role in the response of immune system to cancer cells by releasing nitric oxide (NO) and cytokines [34]. Hence, in the present study, the level of nitric oxide (NO) produced from RAW264.7 cells after incubation with polysaccharides was measured as an indicator of immunostimulatory activity. When macrophage cells were incubated with crude polysaccharide, only less than 5 μmol of NO was released into culture medium (Fig. 4B). On the contrary with the crude polysaccharide, fraction F1 was able to significantly stimulate macrophage cells and produce a considerable amount of NO up to 38 μmol in a dose dependent manner (p < 0.05). Although it was lower than fraction F1, the addition of fraction F2 resulted in a great amount of NO released up to 30 μmol (50 μg/mL). The amount of NO released from macrophage cells after treatment with fractions was comparable to that of LPS (positive control). It has been previously reported that sulfated polysaccharides from Ulva rigida induced significantly high amount NO production which was proportionally related to their sulfate contents [35]. Such pattern, however, was not the case in the current study. Instead, it seemed that the lower molecular weight of fraction F1 was very pivotal for its high bioactivity. These results are in line with our previous findings where we showed the effectiveness of lower molecular weight polymer chains of other polysaccharides in inducing RAW264.7 macrophage cells [36,37]. The importance of molecular weight of polysaccharides on their immunostimulatory activities was also reported for polysaccharides from Aloe species where polymers with molecular weight of less than 400 kDa induced RAW264.7 cells to release more cytokines [38].
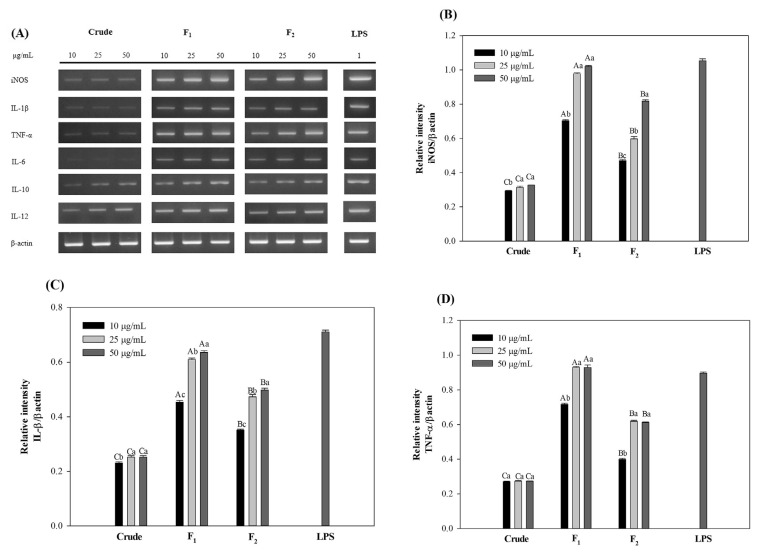
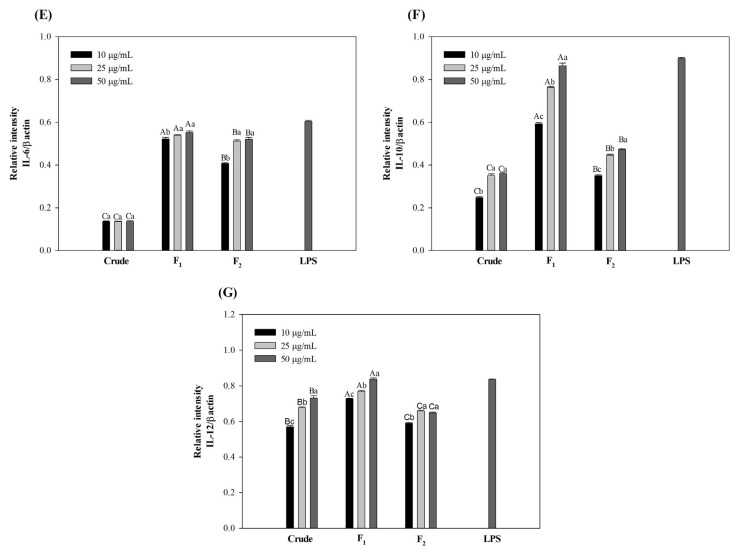
The effect of polysaccharides on the NO production of RAW264.7 cells was also investigated at molecular level by tracing the mRNA expression of inducible nitric oxide synthetase (iNOS) using electrophoresis of RT-PCR products. The PCR products prepared using the specific primers showed the expression of iNOS after polysaccharide treatments (Fig. 5A and B). In accordance with NO production, strong and distinctive bands were detected on the agarose gel for cells kept with fraction F2 which was as high as that of LPS at the highest concentration. This result suggested the up-regulation of iNOS mRNA and subsequent release of NO after polysaccharide stimulation. Accordingly, the mRNA expressions of proinflammatory cytokines were studied and the results showed the production of IL-1β, TNF-α, IL-6 and IL-12 cytokines which were consistent with NO levels (Fig. 5A, C–E and G). The pro-inflammatory cytokines are believed to be essential in protecting human body from infections and abnormal cells through the stimulation of immune system [39]. However, the excessive secretion of pro-inflammatory cytokines might cause severe inflammation symptoms and harmful effects. Herein, anti-inflammatory cytokines such as IL-10 play important roles in the immune system by initiating the adverse mechanism and preventing the detrimental effects of excessive macrophage activation [40]. In the current study, the mRNA expression of anti-inflammatory cytokines was also investigated and the results showed that the fractionated polysaccharides might also be able to inhibit the potential harmful effect of pro-inflammatory cytokines through the release of IL-10.
Fig. 5.
Effects of crude and fractionated polysaccharides on the mRNA expression of cytokines in RAW264.7 cells. The letters a, b, c, d indicate a significant difference (p < 0.05) between the concentrations of the cytokines and A, B, C, D indicate a significant difference (p < 0.05) between the polysaccharides at each concentration. β-actin was used as a control.
3.4. FT-IR analysis
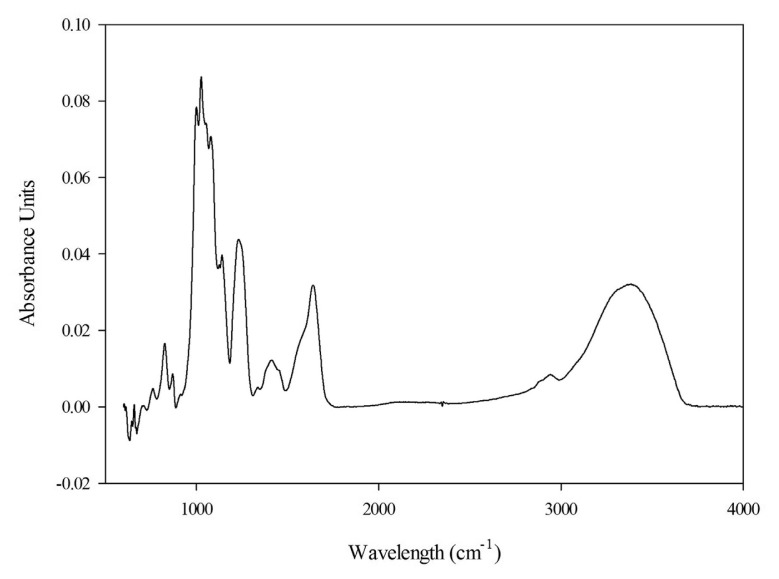
As a complementary mean to chemical analysis, FT-IR provides a rough identification of polysaccharides. The FT-IR spectrum of the most immunostimulating polysaccharide, fraction F1, is presented in Fig. 6. The spectrum of fraction F1 showed strong absorption bands in the range of 400–4000 cm−1. There were two regions of 800–1200 cm−1 and 3400 cm−1 with strong absorption signals which are the characteristic wavenumbers of polysaccharides [41]. The signals between 1000 cm−1 and 1200 cm−1 were attributed to the sugar ring and glycosidic bond C-O stretching vibrations [41]. Absorption signals of C-O stretching vibrations at 1164 cm−1, 1085 cm−1 and 1034 cm−1 indicated the pyranose configuration of the sugar structure [42]. The broad signal at 3433 cm−1 was attributed to the stretching vibrations of OH groups and a small signal at 2939 cm−1 was attributed to the stretching vibration of CH groups. In agreement with the other sulfated polysaccharides, two strong peaks were recorded at 851 cm−1 and 1250 cm−1 corresponding to stretching vibration of S–O and bending vibration of C–O–S of sulfate [26]. These results confirmed the presence of sulfate groups (6.25%) in the polysaccharide structure of fraction F1.
Fig. 6.
FT-IR spectrum of fraction F1 from U. intestinalis.
3.5. Glycosidic linkages of fraction F1
Fraction F1 was chosen as the strongest immunostimulating fraction for linkage analysis. Using the method developed by Ciucanu and Kerek [22], fraction F1 was premethylated, hydrolyzed, reduced and acetylated to produce partially methylated alditols. Table 3 presents types and ratios of different fraction F1 derivatives after GC–MS injection. The most abundant components of the fraction F1 were 3,4-di-O-methyl-Rha and 3,4,6-tri-O-methyl-Glu suggesting the presence of 1,2-linked rhamnose and 1,2-linked glucose glycosidic linkages. The polysaccharide chain also contained 1,4-linked rhamnose and 1,4-linked glucose residues suggested by the presence of 2,3-di-O-methyl-Rha and 2,3,6-tri-O-methyl-Glu products. The presence of 3-mono-O-methyl Rha and 3,5-di-O-methyl-Glu residues showed that some branches existed in the polysaccharide chain. Xylose and galactose sugars formed the non-reducing terminals of the polysaccharide chain.
Table 3.
Glycosidic linkage analysis of the polysaccharide from U. intestinalis.
| Retention time (min) | Methylation | Glycosidic linkage | Peak ratio (%) |
|---|---|---|---|
| 7.77 | 1,5-di-O-acetyl-2,3,4-tri-O-methyl-Xyl | Xyl-(1 → | 9.30 |
| 9.60 | 1,5-di-O-acetyl-2,3,4,6-tetra-O-methyl-Gal | Gal-(1 → | 10.42 |
| 9.96 | 1,2,5-tri-O-acetyl-3,4-di-O-methyl-Rha | →2)-Rha(1 → | 20.12 |
| 11.04 | 1,4,5-tri-O-acetyl-2,3-di-O-methyl-Rha | →4)-Rha(1 → | 12.10 |
| 11.20 | 1,2,5-tri-O-acetyl-3,4,6-tri-O-methyl-Glu | →2)-Glu-(1 → | 15.94 |
| 11.38 | 1,4,5-tri-O-acetyl-2,3,6-tri-O-methyl-Glu | →4)-Glu-(1 → | 9.32 |
| 11.67 | 1,2,4,5-tetra-O-acetyl-3,5-di-O-methyl-Glu | →2,4)-Glu-(1 → | 14.16 |
| 12.41 | 1,2,4,5-tetra-O-acetyl-3-mono-O-methyl-Rha | →2,4)-Rha-(1 → | 8.64 |
4. Conclusions
The water-soluble sulfated polysaccharides isolated from green alga U. intestinalis were fractionated into two distinct polysaccharide populations with different chemical compositions. Fraction F1 contained lower sulfates and proteins whereas fraction F2 had higher sulfate groups. The lowest molecular weight was determined for polysaccharide molecules of fraction F1 which also had the most expanded and loose conformation. Rhamnose and glucose formed the major parts of the polysaccharide chains of crude and fractionated polysaccharides where there were also minor amounts of arabinose, xylose and galactose sugars. Fraction F1 showed that it can effectively proliferates RAW264.7 macrophage cells and stimulates them to release nitric oxide and proinflammatory cytokines. The higher stimulatory activity of fraction F1 could be due to its lower molecular weights compared with crude and fraction F2. The (1 → 2)-linked rhamnose and (1 → 2)-linked glucose residues built the main backbone of fraction F1 with random branches at C-4.
REFERENCES
- 1. Lahaye M, Robic A. Structure and functional properties of Ulvan, a polysaccharide from green seaweeds. Biomacromolecules. 2007;8:1765–74. doi: 10.1021/bm061185q. [DOI] [PubMed] [Google Scholar]
- 2. Kim JK, Cho ML, Karnjanapratum S, Shin IS, You SG. In vitro and in vivo immunomodulatory activity of sulfated polysaccharides from Enteromorpha prolifera. Int J Biol Macromol. 2011;49:1051–8. doi: 10.1016/j.ijbiomac.2011.08.032. [DOI] [PubMed] [Google Scholar]
- 3. Tabarsa M, Lee SJ, You SG. Structural analysis of immunostimulating sulfated polysaccharides from Ulva pertusa. Carbohydr Res. 2012;361:141–7. doi: 10.1016/j.carres.2012.09.006. [DOI] [PubMed] [Google Scholar]
- 4. Li N, Mao W, Yan M, Liu X, Xia Z, Wang S, et al. Structural characterization and anticoagulant activity of a sulfated polysaccharide from the green alga Codium divaricatum. Carbohydr Polym. 2015;121:175–82. doi: 10.1016/j.carbpol.2014.12.036. [DOI] [PubMed] [Google Scholar]
- 5. Brading JWE, Georg-Plant MMT, Hardy DM. The polysaccharide from the alga Ulva lactuca: purification, hydrolysis, and methylation of the polysaccharide. J Chem Soc. 1954:319–24. [Google Scholar]
- 6. McKinnel JP, Percival E. Acid polysaccharide from green seaweed Ulva lactuca. J Chem Soc. 1962:2082–2083. [Google Scholar]
- 7. Qi H, Huang L, Liu X, Liu D, Zhang Q, Liu S. Antihyperlipidemic activity of high sulfate content derivative of polysaccharide extracted from Ulva pertusa (Chlorophyta) Carbohydr Polym. 2012;87:1637–40. [Google Scholar]
- 8. Zhang Z, Wang X, Zhao M, Yu S, Qi H. The immunological and antioxidant activities of polysaccharides extracted from Enteromorpha linza. Int J Biol Macromol. 2013;57:45–9. doi: 10.1016/j.ijbiomac.2013.03.006. [DOI] [PubMed] [Google Scholar]
- 9. Ray B. Polysaccharides from Enteromorpha compressa: isolation, purification and structural features. Carbohydr Polym. 2006;66:408–16. [Google Scholar]
- 10. Lahaye M, Ray B. Cell-wall polysaccharides from the marine green alga Ulva rigida (Ulvales, Chlorophyta)-NMR analysis of ulvan oligosaccharides. Carbohydr Res. 1996;283:161–73. doi: 10.1016/0008-6215(95)00407-6. [DOI] [PubMed] [Google Scholar]
- 11. Wang L, Wang X, Wu H, Liu R. Overview on biological activities and molecular characteristics of sulfated polysaccharides from marine green algae in recent years. Mar Drugs. 2014;12:4984–5020. doi: 10.3390/md12094984. [DOI] [PMC free article] [PubMed] [Google Scholar]
- 12. Jin W, Zhang W, Liang H, Zhang Q. The structure-activity relationship between marine algae polysaccharides and anti-complement activity. Mar Drugs. 2016;14:1–15. doi: 10.3390/md14010003. [DOI] [PMC free article] [PubMed] [Google Scholar]
- 13. Tabarsa M, Han JH, Kim CY, You SG. Molecular characteristics and immunomodulatory activities of water-soluble sulfated polysaccharides from Ulva pertusa. J Med Food. 2012;15:135–44. doi: 10.1089/jmf.2011.1716. [DOI] [PubMed] [Google Scholar]
- 14. Thanh TTT, Quach TMT, Nguyen TN, Luong DV, Bui ML, Tran TTV. Structure and cytotoxic activity of ulvan extracted from green seaweed Ulva lactuca. Int J Biol Macromol. 2016;93:695–702. doi: 10.1016/j.ijbiomac.2016.09.040. [DOI] [PubMed] [Google Scholar]
- 15. Wu L, Sun J, Su X, Yu Q, Yu Q, Zhang P. A review about the development of fucoidan in antitumor activity: Progress and challenges. Carbohydr Polym. 2016;154:96–111. doi: 10.1016/j.carbpol.2016.08.005. [DOI] [PubMed] [Google Scholar]
- 16. Tabarsa M, Park GM, Shin IS, Lee EJ, Kim JK, You SG. Structure-activity relationships of sulfated glycoproteins from Codium fragile on nitric oxide releasing capacity from RAW264. 7 cells. Mar Biotech. 2015;17:266–76. doi: 10.1007/s10126-015-9615-2. [DOI] [PubMed] [Google Scholar]
- 17. Surayot U, You SG. Structural effects of sulfated polysaccharides from Codium fragile on NK cell activation and cytotoxicity. Int J Biol Macromol. 2017;98:117–24. doi: 10.1016/j.ijbiomac.2017.01.108. [DOI] [PubMed] [Google Scholar]
- 18. Dubois M, Gilles KA, Hamilton JK, Rebers PA, Smith F. Colorimetric method for determination of sugars and related substances. Anal Chem. 1956;28:350–6. [Google Scholar]
- 19. Lowry OH, Rosebrough NJ, Farr AL, Randall RJ. Protein measurement with the Folin phenol reagent. J Biol Chem. 1951;193:265–75. [PubMed] [Google Scholar]
- 20. Filisetti-Cozzi TMCC, Carpita NC. Measurement of uronic acids without interference from neutral sugars. Anal Biochem. 1991;197:157–62. doi: 10.1016/0003-2697(91)90372-z. [DOI] [PubMed] [Google Scholar]
- 21. Dodgson KS, Price RG. A note on the determination of the ester sulphate content of sulphated polysaccharides. Biochem J. 1962;84:106–10. doi: 10.1042/bj0840106. [DOI] [PMC free article] [PubMed] [Google Scholar]
- 22. Ciucanu I, Kerek F. A simple and rapid method for the permethylation of carbohydrates. Carbohydr Res. 1984;13:209–17. [Google Scholar]
- 23. Anvari M, Tabarsa M, Cao R, You S, Joyner (Melito) HS, Behnam S, Rezaei M. Compositional characterization and rheological properties of an anionic gum from Alyssum homolocarpum seeds. Food Hydrocol. 2016;52:766–73. [Google Scholar]
- 24. You SG, Lim ST. Molecular characterization of corn starch using an aqueous HPSEC-MALLS-RI system under various dissolution and analytical conditions. Cereal Chem. 2000;77:303–8. [Google Scholar]
- 25. Green LC, Wanger DA, Glogowski J, Skipper PL, Wishnok JS, Tannenbaum SR. Analysis of nitrate, nitrite, and [15N] nitrate in biological fluids. Anal Biochem. 1982;126:131–6. doi: 10.1016/0003-2697(82)90118-x. [DOI] [PubMed] [Google Scholar]
- 26. Hernández-Garibay E, Zertuche-González JA, Pacheco-Ruíz I. Isolation and chemical characterization of algal polysaccharides from the green seaweed Ulva clathrata (Roth) C. Agardh J Appl Phycol. 2011;23:537–42. [Google Scholar]
- 27. Chattopadhyay K, Mandal P, Lerouge P, Driouich A, Ghosal P, Ray B. Sulphated polysaccharides from Indian samples of Enteromorpha compressa (Ulvales, Chlorophyta): isolation and structural features. Food Chem. 2007;104:928–35. [Google Scholar]
- 28. Robic A, Mouro CR, Sassi JF, Lerat Y, Lahaye M. Structure and interactions of ulvan in the cell wall of the marine green algae Ulva rotundata (Ulvales, Chlorophyceae) Carbohydr Polym. 2009;77:206–16. [Google Scholar]
- 29. Rahimi F, Tabarsa M, Rezaei M. Ulvan from green algae Ulva intestinalis: optimization of ultrasound-assisted extraction and antioxidant activity. J Appl Phycol. 2016;28:2979–90. [Google Scholar]
- 30. Karnjanapratum S, Tabarsa M, Cho ML, You SG. Characterization and immunomodulatory activities of sulfated polysaccharides from Capsosiphon fulvescens. Int J Biol Macromol. 2012;51:720–9. doi: 10.1016/j.ijbiomac.2012.07.006. [DOI] [PubMed] [Google Scholar]
- 31. Shao P, Shao J, Han L, Lv R, Sun P. Separation, preliminary characterization, and moisture-preserving activity of polysaccharides from Ulva fasciata. Int J Biol Macromol. 2015;72:924–30. doi: 10.1016/j.ijbiomac.2014.09.048. [DOI] [PubMed] [Google Scholar]
- 32. Tian H, Yin X, Zeng Q, Zhu L, Chen J. Isolation, structure, and surfactant properties of polysaccharides from Ulva lactuca L. from South China Sea. Int J Biol Macromol. 2015;79:577–82. doi: 10.1016/j.ijbiomac.2015.05.031. [DOI] [PubMed] [Google Scholar]
- 33. Peasura N, Laohakunjit N, Kerdchoechuen O, Wanlapa S. Characteristics and antioxidant of Ulva intestinalis sulphated polysaccharides extracted with different solvents. Int J Biol Macromol. 2015;81:912–9. doi: 10.1016/j.ijbiomac.2015.09.030. [DOI] [PubMed] [Google Scholar]
- 34. Ikekawa T, Saitoh H, Feng W, Zhang H, Li L, Mastsuzawa T. Antitumor activity of Hypsizygus marmoreus. I. antitumor activity of extracts and polysaccharides. Chem Pharm Bull. 1992;40:1954–7. doi: 10.1248/cpb.40.1954. [DOI] [PubMed] [Google Scholar]
- 35. Leiro JM, Castro R, Arranz JA, Lamas J. Immunomodulating activities of acidic sulphated polysaccharides obtained from the seaweed Ulva rigida C. Agardh Int Immunopharmacol. 2007;7:879–88. doi: 10.1016/j.intimp.2007.02.007. [DOI] [PubMed] [Google Scholar]
- 36. Borazjani NJ, Tabarsa M, You S, Rezaei M. Effects of extraction methods on molecular characteristics, antioxidant properties and immunomodulation of alginates from Sargassum angustifolium. Int J Biol Macromol. 2017;101:703–11. doi: 10.1016/j.ijbiomac.2017.03.128. [DOI] [PubMed] [Google Scholar]
- 37. Rostami Z, Tabarsa M, You S, Rezaei M. Relationship between molecular weights and biological properties of alginates extracted under different methods from Colpomenia peregrina. Process Biochem. 2017;58:289–97. [Google Scholar]
- 38. Im SA, Oh ST, Song S, Kim MR, Kim DS, Woo SS, et al. Identification of optimal molecular size of modified Aloe polysaccharides with maximum immunomodulatory activity. Int Immunopharmacol. 2005;2005(5):271–9. doi: 10.1016/j.intimp.2004.09.031. [DOI] [PubMed] [Google Scholar]
- 39. Jiao L, Li X, Li T, Jiang P, Zhang L, Wu M, et al. Characterization and anti-tumor activity of alkali-extracted polysaccharide from Enteromorpha intestinalis. Int Immunopharmacol. 2009;9:324–9. doi: 10.1016/j.intimp.2008.12.010. [DOI] [PubMed] [Google Scholar]
- 40. Choi J, Jung HJ, Lee KT, Park HJ. Antinociceptive and anti-inflammatory effects of the saponin and sapogenins obtained from the stem of Akebia quinata. J Med Food. 2005;8:78–85. doi: 10.1089/jmf.2005.8.78. [DOI] [PubMed] [Google Scholar]
- 41. Coimbra MA, Goncalves F, Barros AS, Delgadillo I. Fourier transform infrared spectroscopy and chemometric analysis of white wine polysaccharide extracts. J Agric Food Chem. 2002;50:3405–11. doi: 10.1021/jf020074p. [DOI] [PubMed] [Google Scholar]
- 42. Shao P, Chen X, Sun P. Chemical characterization, antioxidant and antitumor activity of sulfated polysaccharide from Sargassum horneri. Carbohydr Polym. 2014;105:260–9. doi: 10.1016/j.carbpol.2014.01.073. [DOI] [PubMed] [Google Scholar]


