Abstract
We report on the development and validation of a simple microarray method for the direct detection of intact 16S rRNA from unpurified soil extracts. Total RNAs from Geobacter chapellei and Desulfovibrio desulfuricans were hybridized to an oligonucleotide array consisting of universal and species-specific 16S rRNA probes. PCR-amplified products from Geobacter and Desulfovibrio were easily and specifically detected under a range of hybridization times, temperatures, and buffers. However, reproducible, specific hybridization and detection of intact rRNA could be accomplished only by using a chaperone-detector probe strategy. With this knowledge, assay conditions were developed for rRNA detection using a 2-h hybridization time at room temperature. Hybridization specificity and signal intensity were enhanced using fragmented RNA. Formamide was required in the hybridization buffer in order to achieve species-specific detection of intact rRNA. With the chaperone detection strategy, we were able to specifically hybridize and detect G. chapellei 16S rRNA directly from a total-RNA soil extract, without further purification or removal of soluble soil constituents. The detection sensitivity for G. chapellei 16S rRNA in soil extracts was at least 0.5 μg of total RNA, representing approximately 7.5 × 10⁶ Geobacter cell equivalents of RNA. These results suggest that it is now possible to apply microarray technology to the direct detection of microorganisms in environmental samples, without using PCR.
Nucleic acid microarrays, or DNA chips, represent the latest advance in molecular technology, providing unparalleled opportunities for multiplexed detection of nucleic acids. Originally designed for large-scale sequencing, clinical diagnostics, and genetic analyses (23, 29, 35, 37, 43), microarrays likewise offer tremendous potential for microbial community analysis, pathogen detection, and process monitoring in both basic and applied environmental science. Common approaches for microarray fabrication and analyses include cDNA and oligonucleotide probes affixed on planar, channel glass, gel element, and microbead surfaces (3, 6, 10, 15, 16, 18, 21, 24). Only recently, however, have microarray technologies been extended into the realm of environmental microbiology (11, 25, 38).
The relatively slow development and application of microarray methods for environmental microbiology is limited (in part) by the expense of microarray printing and imaging equipment. Likewise, use of microarrays and gene detection methods (in general) in many environmental applications is limited by (i) the time and labor required for manual sample handling, nucleic acid purification, and associated volume reduction, (ii) inefficient purification or concentration of nucleic acids at low target concentrations, especially in environmental samples, and (iii) the coextraction of inhibitory compounds that interfere with subsequent molecular manipulations, especially PCR (41). These considerations are especially relevant within the context of in-the-field or point-of-use applications, such as monitoring (in real time) microbial activity and community dynamics during engineered or intrinsic bioremediation (9). Hence, continued reliance on PCR amplification represents a significant bottleneck for the routine application and deployment of microarrays in environmental microbiology and highlights the need to develop sensitive and specific direct nucleic acid detection methods for environmental samples.
The U.S. Department of Energy (DOE) has a 50-year legacy of environmental contamination resulting from the production of nuclear weapons. The Natural and Accelerated Bioremediation Research (NABIR) program is currently supporting fundamental research to extend bioremediation processes to the most common and recalcitrant contaminant mixtures (i.e., metals and radionuclides) in soils, sediments, and groundwater. One of the objectives within the NABIR program is to develop innovative methods for measuring biodegradation rates, biotransformation processes, and microbial community dynamics for the purposes of microbial community characterization, process monitoring, and defining bioremediation end points in the field. On a practical level, this detection objective includes the following requirements: (i) to detect many different microorganisms simultaneously, (ii) to utilize a bioanalytical detection method that is conducive to automation and/or field-deployment, (iii) to monitor RNA as a qualitative indicator of microbial activity, and (iv) to quantify RNA levels and/or the extent of microbial activity. Microarrays represent one technology to meet these objectives. The purpose of this research was therefore to develop a microarray detection technique that is conducive to automated sample handling procedures (13) and direct detection of rRNA in environmental samples. Metal- and sulfate-reducing bacteria in the genera Geobacter and Desulfovibrio served as a model system, but the results and methods are generally applicable to the direct detection and characterization of 16S rRNA in other species and environments.
MATERIALS AND METHODS
Bacterial cultures.
Anaerobic cultures of Geobacter chapellei and Desulfovibrio desulfuricans were acquired from the Subsurface Microbial Culture Collection (SMCC). G. chapellei was grown as described in detail elsewhere (13). Culture conditions for D. desulfuricans are described on the SMCC website (http://caddis.esr.pdx.edu/smccw/) and in reference 8. Briefly, cells (10% inoculum) were cultivated in 100 ml of Medium C (per liter, 7.9 ml of sodium lactate syrup [60%], 4.5 g of Na2SO4, 0.06 g of CaCl2 · 2H2O, 0.3 g of sodium citrate, 1.0 g of NH4Cl, 0.5 g of KH2PO4, 2.0 g of MgSO4 · 7H2O, 1.0 g of yeast extract [Difco]; pH 7.2; degassed with N2 and sterilized by autoclaving). Sterilized growth medium was supplemented with 0.8 ml of FeSO4 solution (per 50 ml, 0.025 g of FeSO4 · 7H2O, 5 ml of 1 M H2SO4; degassed with N2 and filter sterilized) and 1 ml of reductant solution (per 50 ml, 0.5 g of sodium thioglycolate, 0.5 g of ascorbic acid; degassed with N2 and filter sterilized). Complete medium was anaerobically inoculated (10%, vol/vol) with starter culture. Cultures were incubated on a shaker platform in the dark at 30°C for 4 days prior to nucleic acid extraction.
PCR amplification.
Genomic DNA was purified from G. chapellei according to a standard cetyltrimethylammonium bromide (CTAB) procedure (4) and used as template for generating full-length 16S ribosomal DNA (rDNA) amplicons. We utilized a Qiagen (Valencia, Calif.) HotStar Polymerase kit, with each 50-μl reaction mixture containing 1× Qiagen buffer, 4 mM MgCl2, 200 μM each deoxynucleoside triphosphate (Promega), 0.2 μM each primer (Gbc-068F-bio [5′-biotin-CGCACGGGTGAGTAACGC] and Gbc-1472R-bio [5′-biotin-CCCAGTCACCGACCATTC]), 1.25 U of Qiagen HotStar Taq polymerase, and 5 ng of template DNA. PCR conditions included an initial denaturation at 95°C for 15 min, followed by 35 cycles of 94°C for 20 s, 50°C for 20 s, and 72°C for 150 s. Successful amplification was confirmed by analyzing PCR products on 1.2% agarose gels in 1× TAE (40 mM Tris-acetate, 2 mM Na2 EDTA) running buffer, both containing ethidium bromide (10 ng ml−1). Amplification products were hybridized directly to the microarray without further purification (see below).
RNA purification.
Total RNA was extracted from bacterial cultures with an RNAwiz kit according to the manufacturer's instructions (Ambion Inc., Austin, Tex.). Briefly, 50 ml of cell culture was collected by centrifugation and resuspended in 1 ml of RNAwiz reagent. Resuspended cells were then transferred to 2-ml microcentrifuge tubes containing 0.5 g of sterile glass beads (diameter, 0.1 mm), lysed by a bead beater (BioSpec Products, Inc, Bartlesville, Okla.) at 5,000 oscillations per s for 5 min, and incubated for 5 min at room temperature. Disrupted cells were extracted with 200 μl of chloroform for 10 min, and the phases were separated at 14,000 × g for 15 min. The aqueous layer was removed and transferred to a fresh 2-ml tube, diluted with 500 μl of diethyl pyrocarbonate (DEPC)-treated distilled H2O (dH2O), and precipitated with 1 ml of isopropanol for 10 min at room temperature. RNA was collected by centrifugation at 14,000 × g for 15 min, the supernatant was discarded, and the pellet was dried under a vacuum for 15 to 20 min. The resulting RNA pellets were resuspended in 100 μl of DEPC-dH2O and quantified by UV absorbance. The presence of 16S rRNA was confirmed by gel electrophoresis in 2% agarose and TAE running buffer.
RNA fragmentation.
Total RNA was fragmented by standard procedures (4). Briefly, 4 μl of fragmentation buffer (200 mM Tris, 500 mM potassium acetate, 150 mM magnesium acetate [pH 8.]; made with DEPC-treated water and filter sterilized) and 6 μg of total RNA were adjusted to a total volume of 20 μl in microarray hybridization buffer. RNA was incubated for 30 min at 95°C, cooled on ice, amended with chaperone-detector probes (below), adjusted to a total volume of 105 μl with hybridization buffer, and applied (35 μl) directly to replicate microarrays.
Soil extracts.
Environmental RNA extracts were prepared from a surface soil obtained from a wheat field in Whitman County, Wash. Sterile glass beads (0.5 g; 0.1 mm), 0.5 g of soil, 350 μl of extraction buffer (50 mM sodium acetate, 5 mM Na2 EDTA [pH 5.1]), 350 μl of 10% sodium dodecyl sulfate, and 700 μl of phenol-chloroform-isoamyl alcohol were combined in a 2-ml microcentrifuge tube and placed in a bead beater at 5,000 oscillations per s for 2 min. Samples were then incubated at 60°C for 10 min and extracted again for 2 min in the bead beater. Sediment, glass beads, and organic phases were separated by centrifugation, and the aqueous layer was precipitated with 0.25 volume equivalent of 10 M ammonia acetate and 0.7 volume equivalent of isopropanol. Tubes were incubated overnight at −20°C, and nucleic acids were collected by centrifugation at 14,000 × g for 30 min. The resulting (dark-brown) pellet was washed in 70% ethanol, dried under a vacuum, resuspended in hybridization buffer (4× SSPE [1× SSPE is 0.18 M NaCl, 10 mM NaH2PO4, and 1 mM EDTA {pH 7.7}]–2.5× Denhardt's solution [50× Denhardt's solution is 10 g of Ficoll 400 {Sigma, St. Louis, Mo.} liter−1, 10 g of polyvinylpyrrolidone (Sigma) liter−1, and 10 g of ultrapure bovine serum albumin {Ambion} liter−1], with or without 30% formamide), and stored at −20°C until use.
Microarray fabrication.
An alignment of Geobacter and Desulfovibrio 16S rRNA sequences was generated from GenBank and Ribosomal Database Project (RDP) (30) entries and used to develop a set of capture and detector probes for this study (Table 1). Probes were purchased from BioSource International (Camarillo, Calif.). Two regions of the Geobacter 16S rRNA sequence were investigated to test for regional effects on hybridization efficiency, hybridization specificity, and capture probe proximity to a detector probe.
TABLE 1.
Capture and chaperone detector probesa
| Capture probe or detector | Probe sequence (5′ to 3′) |
|---|---|
| Capture probes | |
| Geobacter chapellei-214 | AGACTCATCTGATGACAGAA |
| Geobacter arculus-214 | GGACCCATCCTGATACGGTA |
| Geobacter metallireducens-214 | GGACTCATCCAGTGACAAAA |
| Geobacter sulfurreducens-214 | GGACTCATCCGAAGACAGGA |
| Geobacter akaganeitreducens-214 | GGACTCATCCGATGTCGGGA |
| Geobacter chapellei-420 | CACAATACACTTCTTTCCCCTT |
| Geobacter arculus-420 | CCAGCCCCATTTCTTCCCTTCT |
| Geobacter metallireducens-420 | CCTCAATCACTTCTTCCCTCCC |
| Geobacter sulfurreducens-420 | TCTCAATCATTTCTTCCCTCCC |
| Desulfovibrio desulfuricans-997 | GGGAGGGTTCCGTGGATGTC |
| Desulfovibrio vulgaris-996 | GGGAGGGTCTTCCGGATGTC |
| Escherichia coli-466 | TCAATGAGCAAAGGTAT |
| Detector probes | |
| Geobacter-214 chaperone | Biotin-ACCAACTAGCTAATGGTACGC |
| Geobacter-420 chaperone | Biotin-GACAGAGCTTTACGACCCG |
| Desulfovibrio chaperone | AAACCTAGGTAAGGTTCTTC-biotin |
| Escherichia coli chaperone | ACTTTACTCCCTTCCTCC-biotin |
| Universal 519 | Biotin-CAGCAGCCGCGGTAATWC |
| Universal 915 | Biotin-GCCCCCGYCAATTYCT |
| Universal 1392 | Biotin-ACGGGCGGTGTGTRC |
The number after each probe name represents the approximate position of the complementary target region, utilizing G. chapellei or D. desulfuricans 16S rRNA numbering.
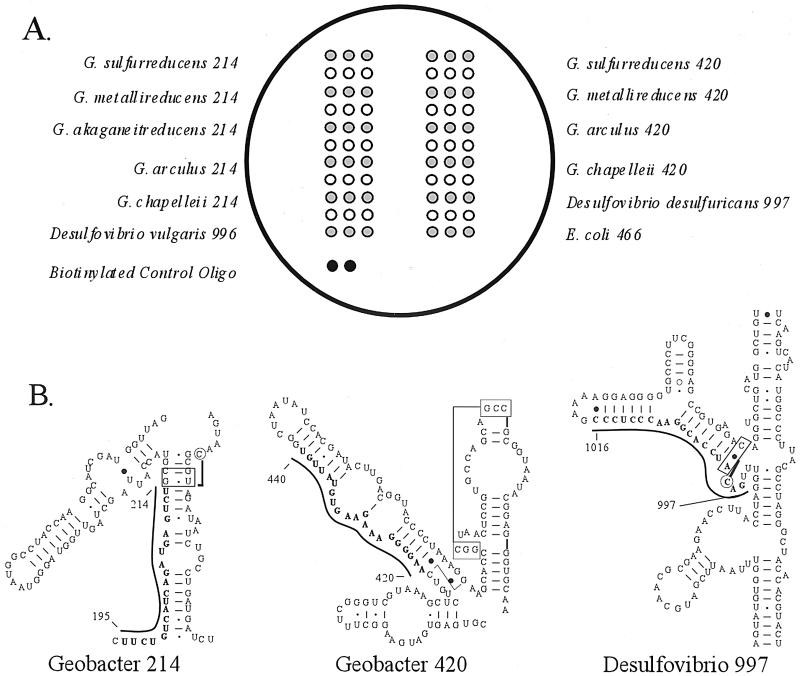
Arrays were fabricated as described in detail elsewhere (12). Briefly, 12-well Teflon-masked microscope slides (Erie Scientific, Portsmouth, N.H.) were hand washed with a mild cleanser, soaked in 3 N HCl for 30 min and in 3 N H2SO4 for 30 min, and rinsed in distilled water. Washed slides were dried under compressed N2, coated with 2% (vol/vol, in methanol) epoxy silane (3-glycidoxypropyltrimethoxysilane [Aldrich, Milwaukee, Wis.]), rinsed in methanol, and dried under compressed N2. Probes were printed in triplicate at an 80 to 90 μM concentration in 0.01% sodium dodecyl sulfate–50 mM NaOH (pH 12.7) using a Genetic Microsystems (now Affymetrix) 417 Arrayer, with the print pattern illustrated in Fig. 1. A biotin-labeled quality control (QC) oligonucleotide (5′-biotin-TTGTGGTGGTGTGGT-3′) was also printed in duplicate and acted both as a positive control for the signal development procedure and as a positional reference mark for imaging. After printing, the slides were baked for 30 min in a 130°C vacuum oven and stored at room temperature.
FIG. 1.
(A) Microarray print pattern. The number after the probe name represents the approximate position of the complementary target region, utilizing G. chapellei or D. desulfuricans 16S rRNA numbering. Open circles indicate the print locations of buffer blanks, which were used to assess capture probe carryover during the printing process. (B) Secondary-structure diagrams for G. chapellei and D. desulfuricans capture probes, based on the D. desulfuricans (accession number M34113) model of Guttell (26). Lines next to the diagrams indicate the positions of the capture probes.
Microarray hybridization and detection.
Numerous hybridization conditions and buffers were evaluated for rRNA or rDNA binding to the oligonucleotide arrays. Successful (specific) rRNA hybridization to the microarray was achieved only under the hybridization conditions described here. Whole or fragmented RNA was hybridized onto glass microarray slides for 2 h or overnight at room temperature (22 ± 2°C) or 4°C. Hybridization buffer consisted of 4× SSPE and 2.5× Denhardt's solution, with or without 30% formamide.
Intact RNA (from isolates or amended soil extracts) was heat denatured in hybridization buffer (with or without chaperone and/or detector probes at a final concentration of 140 nM) for 5 min at 95°C and snap cooled on ice. For most experiments, 2 μg of total RNA (intact or fragmented) was hybridized on duplicate arrays (35 μl per array). Hybridization proceeded for 2 h or overnight, the hybridization solution was aspirated off each array, and the slides were rinsed in 4× SSPE and vacuum dried. Variations on this basic protocol included buffers containing from 6 to 0.5× SSPE (total sodium concentrations, approximately 970 to 80 mM) and target concentrations ranging from 6 to 0.5 μg of total RNA (in clean buffer and amended soil extracts) to test for ionic-strength effects on hybridization sensitivity and specificity.
After drying, each well was incubated for 60 min at room temperature or 4°C in 35 μl of AMDEX streptavidin-alkaline phosphatase (SA-AP; Amersham-Pharmacia, Piscataway, N.J.) diluted 1:500 in hybridization buffer. The SA-AP was vacuum aspirated from the wells, the slides were rinsed in 1× ELF wash buffer (ELF-97 mRNA in situ hybridization kit; Molecular Probes, Eugene, Oreg.), and 20 μl of ELF-97 substrate was incubated on the slides for 60 min (1:100 in ELF developing buffer C). Alkaline phosphatase cleaves ELF-97 substrate to produce an insoluble, fluorescent crystal that remains affixed to the slide at the spot of hybridization. The soluble substrate solution was then aspirated from the slides, and the slides were washed in a solution of 50 mM NaCl, 0.1% Tween 20, and 10 mM Tris (pH 8) (ELF-97 Final Wash), followed by two rinses in dH2O. After drying, slides were imaged with a Fluor-S MultiImager (Bio-Rad, Hercules, Calif.) using the trans ethidium bromide illumination setting (290- to 365-nm-excitation, 520-nm-emission filter). The imager was equipped with a 28- to 200-mm DL Hyperzoom macro lens (Sigma, Rödermark, Germany) that was fitted with a +1 close-up lens. Images were exported as tagged-image format files, and the arrays were quantified according to relative optical density (OD) units with Phoretix array software (version 1.00; Phoretix International, Newcastle, United Kingdom). Once dry, ELF-97 crystals appeared to be stable and suitable for long-term storage and reimaging. For statistical purposes, each spot (three replicate spots per array) was considered an independent replicate. Average ODs (± standard errors) were then calculated from at least six replicate spots (two arrays) using Systat (version 9; SPSS Inc., Chicago, Ill.) software.
RESULTS
RNA labeling format and strategy.
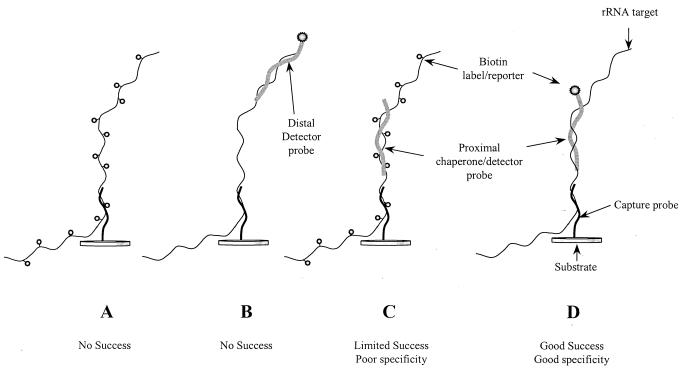
Several methods for the introduction and format of the detection label (biotin) were tested for direct 16S rRNA detection, as diagrammed in Fig. 2. Either multiple biotin labels were introduced along the RNA strand with a psoralen-biotin labeling chemistry (Fig. 2A and C) or single biotin detection labels were introduced as part of an auxiliary detector probe (Fig. 2B and D). For clarity, the proximal chaperone probes diagrammed in Fig. 2 are equivalent to “stacking” probes (32). However, we borrow the term “chaperone” from the realm of protein assembly (28) to indicate that the proximal chaperone probe is (presumably) serving to prevent “incorrect” structures (i.e., intramolecular secondary structure within the 16S rRNA target itself) from forming prior to hybridization on the array. If the chaperone also contains the detection label, then it serves the added function of a “detector” probe (M. D. Eggers, W. J. Balch, L. G. Mendoza, R. Gangadharan, A. K. Mallik, G. McMahon, M. E. Hogan, D. Xaio, T. R. Powdrill, B. Iverson, G. E. Fox, R. C. Willson, K. I. Maillard, J. L. Siefert, and N. Singh, presented at the 27th International Conference on Environmental Systems, Lake Tahoe, Nev., 1997).
FIG. 2.
Strategies for the introduction and format of biotin labels in target RNA. (A) Multiple biotin labels introduced along the RNA molecule with the psoralen-biotin labeling chemistry. (B) Distal detector probe, located >3 bases away from the capture probe. (C) A proximal (unlabeled) chaperone (bold strand) in conjunction with biotinylated RNA. (D) Proximal chaperone (within 1 to 3 bases of capture probe) containing a biotin detection label.
Chemical labeling methods and distal detector probes were ineffective regardless of hybridization temperature, time, or buffer compositions (data not shown). Biotinylated RNA (labeled in multiple positions with the psoralen-biotin labeling chemistry) coupled with a chaperone probe (Fig. 2C) did generate a positive hybridization signal on the array, but the hybridization specificity was poor and the resulting signal was weak (data not shown). By using a chaperone-detector probe with unlabeled RNA (Fig. 2D), however, we were able to achieve relatively sensitive absolute detection and limited cross-hybridization with nonspecific capture probes. The chaperone-detector method was therefore used to refine microarray hybridization conditions for sensitive and specific 16S rRNA analysis.
Proximity of chaperone-detector probes.
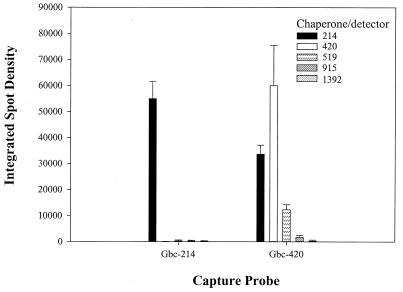
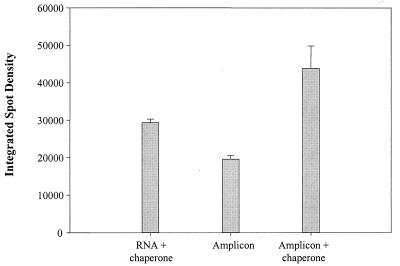
The proximity of the chaperone-detector probe to the capture probe was important for achieving positive hybridization to the microarray, as shown in Fig. 3. A signal was detected with the Gbc-420 capture probe and a nonproximal Gbc-214 detector probe which was not significantly (P = 0.150) different from the signal obtained with a proximal chaperone-detector. Further, the converse hybridization was ineffective (a Gbc-214 capture probe and a Gbc-420 detector probe). Importantly, hybridization and detection of a full-length (1,400-bp), biotinylated G. chapellei 16S rDNA PCR product did not require a chaperone (Fig. 4). Consequently, the proximal chaperone-detector probe strategy was used for the rest of this study, as described in Materials and Methods.
FIG. 3.
Requirement for proximal chaperone. Two micrograms of G. chapellei total RNA was hybridized overnight in 4× SSPE–2.5× Denhardt's solution–30% formamide buffer at room temperature to the microarray targeting positions 214 and 420 (Fig. 1). Detector probes located at different positions with respect to the capture oligonucleotide were hybridized simultaneously with the target RNA and microarray slide. Positive hybridization was detected with the Molecular Probes chemiluminescent substrate ELF-97and a Bio-Rad Fluor-S imager. Relative light units (OD ± standard error) were measured with Phoretix software. Results indicate that the chaperone-detector probe should bind immediately adjacent to the capture oligonucleotide, as shown in Fig. 2D.
FIG. 4.
Hybridization and detection of PCR amplicons relative to rRNA. Two micrograms of G. chapellei total RNA (approximately 2.4 × 10¹² copies of 16S rRNA) or 1012 copies of a full-length G. chapellei rDNA PCR product (1,400 bp) were hybridized to a microarray overnight at room temperature (4× SSPE, 2.5× Denhardt's solution, 30% formamide), with or without a proximal chaperone (targeting the 214 region). In the absence of a chaperone, no rRNA was detected, as described in the text. The increased signal for the amplicon-plus-chaperone hybridizations is most likely due to the additive effect of two biotin labels; one on the PCR amplicon and one on the proximal chaperone.
Factors affecting detection sensitivity.
Proximal chaperone-detector probes were designed to bind within 1 to 3 bases of the capture probe region (Table 1 and Fig. 1B). Capture probes were designed for species specificity, whereas chaperone-detector probes were designed to be (at least) genus specific. Every chaperone-detector probe listed in Table 1 was tested for cross-hybridization with nontarget RNA species, and no cross-reactivity was observed (data not shown). Likewise, the chaperone-detector probes alone did not hybridize to the microarray probes, and this was continuously verified by including a chaperone-only control for every hybridization experiment.
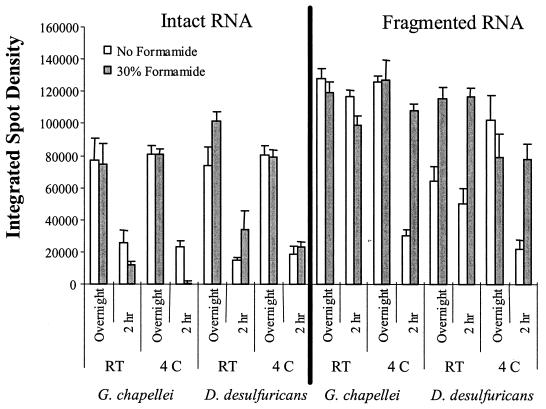
A five-dimensional experimental matrix consisting of hybridization time, temperature, formamide content, RNA fragmentation, and RNA source was tested to optimize 16S rRNA detection sensitivity. Results from these experiments are summarized in Fig. 5. In general, fragmented RNA produced a stronger signal than intact RNA, and fragmented RNA produced sufficient signal with a 2-h hybridization. Intact RNA required overnight hybridization to maximize signal intensity. The presence of 30% formamide in the hybridization buffer had the most profound effect on signal intensity for fragmented RNA hybridized for 2 h. An interesting and counterintuitive result from these experiments was that intact 16S rRNA was rarely (and only inconsistently) detected in a total-RNA background at hybridization temperatures above ambient temperatures (data not shown), even with the proximal chaperone-detector strategy employed here. Qualitatively, the best condition for 16S rRNA detection was fragmented RNA hybridized for 2 h at room temperature in a buffer containing 30% formamide. The best condition for intact RNA was identical except that the optimal hybridization time was overnight.
FIG. 5.
Optimizing 16S rRNA detection sensitivity. Two micrograms of total RNA was hybridized in 4× SSPE–2.5× Denhardt's solution (pH 7.7) under the conditions indicated.
Factors affecting hybridization specificity.
Hybridization signal intensity does not necessarily correlate with hybridization specificity. To examine the effects of buffer composition on hybridization specificity, additional buffer compositions were investigated. Fragmented or intact total RNAs from G. chapellei and D. desulfuricans were hybridized for 2 h or overnight (respectively) in 6, 4, 2, 1, or 0.5× SSPE containing 2.5× Denhardt's solution and 30% formamide. Both chaperones were tested individually with each RNA target to ensure that the chaperones alone were not responsible for generating a positive hybridization signal.
Reducing the hybridization stringency by increasing the SSPE concentration to 6× did not improve signal strength under any circumstance but instead increased the incidence of nonspecific hybridization for both intact and fragmented RNA (data not shown). Intact RNA hybridized for 2 h at room temperature produced weak but specific G. chapellei and D. desulfuricans signals in the 4× SSPE buffer (see Fig. 5), and hybridization signals were both strong and specific for both RNA targets at 1× SSPE. Fragmented RNA hybridized for 2 h at room temperature produced equivalent signals in 6, 4, and 2× SSPE, with a near-total loss of signal in 1× SSPE hybridization buffer.
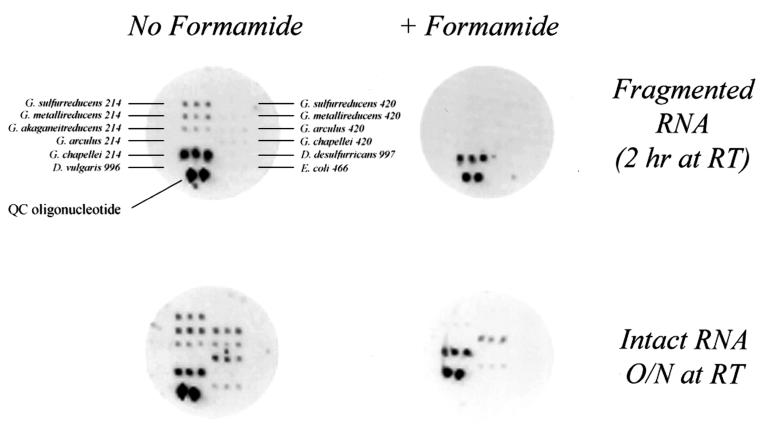
The most significant factor affecting hybridization specificity in these experiments was the presence or absence of 30% formamide in the hybridization buffer. Even though formamide did not (generally) improve signal intensity (Fig. 5), it was critical for species-specific hybridization and detection (Fig. 6). By utilizing 30% formamide in the hybridization buffer, species-specific hybridization was achieved even with intact rRNA (1,500 bases). Similar results were obtained for D. desulfuricans targets.
FIG. 6.
Optimizing 16S rRNA detection specificity. RNA was hybridized either in buffer that did not contain formamide (left) or in buffer containing 30% formamide (right), as described in the text. Fragmented total RNA was hybridized for 2 h at room temperature in the presence of the G. chapellei 214 chaperone-detector probe (top). Intact total RNA was hybridized overnight at room temperature (bottom).
Direct rRNA detection in amended soil extracts.
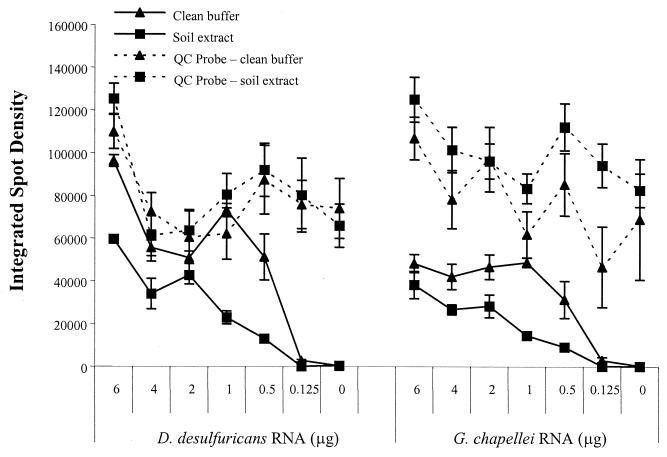
Successful hybridization and species-specific detection of intact rRNA (from a pool of total RNA) led us to investigate whether it was possible to directly detect rRNA in an unpurified soil extract with the microarray. Unpurified soil extracts and “clean” hybridization buffers were first seeded with decreasing amounts of G. chapellei or D. desulfuricans total RNA and then hybridized overnight at room temperature. For both RNA targets, the hybridization signal intensity was significantly reduced when a soil extract was present in the hybridization solution (P < 0.05) (Fig. 7). The array did not cross-hybridize to indigenous RNA in the soil extract (Fig. 7, 0 μg). The signal intensity from the biotinylated QC probe was unaffected by the presence of a soil extract, indicating that the soil extract was affecting RNA hybridization efficiency rather than enzymatic/fluorescent signal generation and subsequent image analysis. However, the signal intensity of the QC probes did vary from array to array and from day to day, illustrating the inherent variability in the analytical process (microarray fabrication, hybridization, detection). Regardless, adequate signal was produced with 0.5 μg of total RNA, representing approximately 7.5 × 10⁶ cell equivalents of each species. For simple presence-or-absence determinations, detection of intact rRNA was as effective in a soil extract as it was in a clean hybridization buffer over the target concentration range reported here.
FIG. 7.
Dilution series of G. chapellei and D. desulfuricans total RNAs seeded into standard hybridization buffer (clean buffer) or soil extracts and hybridized to glass microarray slides. No hybridization signal was obtained from soil extracts that were not artificially amended with Geobacter or Desulfovibrio RNA (0-μg data points).
DISCUSSION
Avoiding PCR.
Notwithstanding the obvious power and utility of PCR, fundamental uncertainties and errors associated with PCR (7, 17, 19, 20, 33, 36, 39, 40, 42) have significant and mainly negative implications for analysis of, and interpretation of data from, in situ microbial communities and environmental samples. Known biases and inhibitors are likely compounded with additional enzymatic manipulations, such as reverse transcription of RNA into cDNA prior to PCR amplification. The limitations of PCR (and reverse transcription-PCR) in an environmental context therefore extend to any detection method following target amplification, regardless of the sensitivity, specificity, or multiplexed detection capability of the sensor element. By extension, the full power and utility of microarrays to accurately and quantitatively ascribe phenotype and function to in situ microorganisms will therefore be realized only by developing techniques for the direct detection of nucleic acids from environmental samples. In this study, we focused on the detection of 16S rRNA from sulfate- and metal-reducing bacteria of specific interest to the bioremediation community, but the results and methods are generally applicable to other microorganisms and environments where 16S rRNA is a principal diagnostic target.
RNA labeling format and hybridization strategy.
The most common method for introducing a microarray detection label includes PCR or reverse transcription-PCR amplification of a target sequence with a labeled primer (e.g., biotin or a fluorescent dye). Reliance on PCR in this context is also a limitation for the development of field-deployable, near-real-time assessment or monitoring technologies, because it implies hardware and analytical processing technologies that are significant developmental challenges in their own right. Direct chemical labeling methods are available, including commercially available kits (e.g., those from Roche Molecular Biochemicals, Indianapolis, Ind.) and methods developed by individual investigators (see, e.g., references 5 and 25). Such methods are generally conducive to automation in fluidic systems that we have developed and utilized to purify nucleic acids directly from soil extracts (13), and they avoid the added complications of enzymes in this context (e.g., instability, shelf-life, nonspecific adsorption to tubing and fluid channels). In our hands, however, chemical labeling (without prior RNA fragmentation) was highly inconsistent for generating a specific 16S rRNA hybridization signal, regardless of the hybridization buffer. These (negative) results may be a function of the particular combination of methods employed here (i.e., planar glass surfaces; 16S rRNA targets; labeling and/or hybridization buffers and conditions), but they led us to explore alternative labeling and detection strategies that are also appropriate for unattended, field-deployable detection systems.
The proximal chaperone (or “stacking”) probe concept for nucleic acid hybridization and detection has been employed for other microarray experiments, especially those targeting the detection of single-nucleotide polymorphisms in PCR-amplified targets (6, 22, 27, 31, 32, 34; Eggers et al., 27th Int. Conf. Env. Syst.). One of the most striking results from this study, however, was the finding that 16S rDNA PCR amplicons did not require a chaperone or stacking probe for specific and sensitive detection (see, e.g., Fig. 4), whereas we were unable to achieve direct 16S rRNA hybridization and detection in the absence of a proximal chaperone probe. We postulate that the differential success of chaperone versus nonchaperone hybridization strategies is due to the increased stability of RNA-RNA duplexes and 16S rRNA secondary structure (steric hindrance) relative to DNA-DNA duplexes (rDNA secondary structure and steric hindrance) under the hybridization conditions used here.
It could be argued that the 420 capture probe–214 detector probe result in Fig. 3 (and Fig. 6) negates the secondar-structure hypothesis. Inspection of the 16S rRNA secondary structure in these regions, however, actually lends support to this hypothesis. The 420 region contains a relatively large stem-loop and bulge, whereas the 214 region does not (Fig. 1B). We postulate that the 214 chaperone, heat denatured with target rRNA prior to hybridization on the array, sufficiently destabilizes the 420 capture site to achieve some level of hybridization to the 420 capture probe, whereas the 420 chaperone does not sufficiently disrupt the stem of the 214 region to effect hybridization to the 214 capture probe. Notably, the other chaperone-detector probes did not exert a destabilizing effect on the 420 capture region. Thus, the 214 chaperone may have had a destabilizing effect on the tertiary structure, rather than the secondary structure, of the rRNA target. We therefore use the term “chaperone” probe (Eggers et al., 27th Int. Conf. Env. Syst.) instead of “stacking” or “auxiliary” probe in this specific case, denoting the functional attribute of a chaperone (steric relief and prevention of intramolecular secondary structure) above and beyond that of a stacking probe (increasing duplex stability).
We normally expect that altering hybridization stringency, either through temperature or ionic strength, will be sufficient to mitigate steric effects and achieve specific and sensitive hybridization. Our results run counter to this expectation. Of particular interest was our inability to consistently detect 16S rRNA at hybridization temperatures above ambient temperatures (even in the absence of formamide), even though we have successfully hybridized and captured Geobacter rRNA in solution phase experiments at temperatures ranging from 55 to 65°C (14). Functional genes and DNA targets are also routinely hybridized and detected on microarrays at elevated temperatures, including oligonucleotide microarrays fabricated according to the protocols used here (11). The reason for these results is not entirely clear, although our methods are consistent with those of Guschin et al., who also routinely perform hybridizations of fragmented rRNA to oligonucleotide microarrays at 4°C (25).
We originally expected that increased hybridization temperatures and/or lower salt concentrations would improve mismatch discrimination on the array, but neither variable improved microarray specificity or sensitivity for direct 16S rRNA detection. Rather, formamide was required to achieve species specificity (Fig. 6), even though it had relatively little effect on detection sensitivity (Fig. 5) regardless of the hybridization buffer, time, or temperature. This result is consistent with the stability of RNA-DNA duplexes and the secondary-structure hypothesis (see above).
The absolute detection limit of the microarray system described here was at least 0.5 μg of total RNA (Fig. 7), representing approximately 7.5 × 10⁶ cell equivalents of RNA or 109 to 1010 copies of 16S rRNA in the hybridization solution (target concentration, ≈50 to 500 pM). These detection limits were achieved even in an unpurified soil extract and are similar to those for microarray systems used to detect PCR amplicons. Because we used a relatively insensitive, nonproximal charge-coupled device detector (approximately 50 cm between the lens and microarray slide), we expect an improvement of at least 1 order of magnitude in detection sensitivity by imaging the microarray slides with a dedicated microarray scanner.
Equally important was the performance of the SA-AP ELF detection system in the amended soil experiments (Fig. 7). That is, microarray results can be compromised though interferences at the point of nucleic acid hybridization (Fig. 7) (1, 41) or detection. In fact, soluble substances frequently interfere with standard fluors, such as those used for in situ hybridization, TaqMan PCR, and microarrays (2). Thus, portable systems developed for microbial identification in environmental samples (5) must account for the effects of soluble substances both on hybridization efficiency and on reporter detection. Overcoming autofluorescence or fluorescence quenching at the point of detection places additional demands on the sample preparation process, manipulations that may or may not be conducive to field-deployable devices or systems. Our results represent the first report of direct microarray detection of nucleic acids from a nonaqueous environmental sample and provide a mechanism by which to greatly simplify the analytical process for biodetection in the field. They also illustrate the potential for using microarrays to directly investigate microbial community dynamics and metabolic activity in soils and sediments, without PCR.
ACKNOWLEDGMENTS
We thank Amy Zachara for technical assistance during these studies.
This work was supported by the U.S. DOE under the Assessment Element of the NABIR program. Pacific Northwest National Laboratory is operated for the U.S. DOE by Battelle Memorial Institute under contract DE-AC06-76RLO 1830.
REFERENCES
- 1.Alm E W, Zheng D, Raskin L. The presence of humic substances and DNA in RNA extracts affects hybridization results. Appl Environ Microbiol. 2000;66:4547–4554. doi: 10.1128/aem.66.10.4547-4554.2000. [DOI] [PMC free article] [PubMed] [Google Scholar]
- 2.Amann R I, Ludwig W, Schleifer K-H. Phylogenetic identification and in situ detection of individual microbial cells without cultivation. Microbiol Rev. 1995;59:143–169. doi: 10.1128/mr.59.1.143-169.1995. [DOI] [PMC free article] [PubMed] [Google Scholar]
- 3.Anthony R M, Brown T J, French G L. Rapid diagnosis of bacteremia by universal amplification of 23S ribosomal DNA followed by hybridization to an oligonucleotide array. J Clin Microbiol. 2000;38:781–788. doi: 10.1128/jcm.38.2.781-788.2000. [DOI] [PMC free article] [PubMed] [Google Scholar]
- 4.Ausubel F M, Brent R, Kingston R E, Moore D D, Seidman J G, Smith J A, Struhl K, editors. Current protocols in molecular biology. New York, N.Y: John Wiley & Sons, Inc.; 1995. [Google Scholar]
- 5.Bavykin S G, Akowski J P, Zakhariev V M, Barksy V E, Perov A N, Mirzabekov A D. Portable system for microbial sample preparation and oligonucleotide microarray analysis. Appl Environ Microbiol. 2001;67:922–928. doi: 10.1128/AEM.67.2.922-928.2001. [DOI] [PMC free article] [PubMed] [Google Scholar]
- 6.Beattie W G, Meng L, Turner S L, Varma R S, Dao D D, Beattie K L. Hybridization of DNA targets to glass-tethered oligonucleotide probes. Mol Biotechnol. 1995;4:213–225. doi: 10.1007/BF02779015. [DOI] [PubMed] [Google Scholar]
- 7.Becker S, Böger P, Oehlmann R, Ernst A. PCR bias in ecological analysis: a case study for quantitative Taq nuclease assays in analyses of microbial communities. Appl Environ Microbiol. 2000;66:4945–4953. doi: 10.1128/aem.66.11.4945-4953.2000. [DOI] [PMC free article] [PubMed] [Google Scholar]
- 8.Boone D R, Johnson R L, Liu Y. Diffusion of the interspecies electron carriers H2 and formate in methanogenic ecosystems and its implications in the measurement of Km for H2 or formate uptake. Appl Environ Microbiol. 1989;55:1735–1741. doi: 10.1128/aem.55.7.1735-1741.1989. [DOI] [PMC free article] [PubMed] [Google Scholar]
- 9.Brockman F J. Nucleic acid-based methods for monitoring the performance of in situ bioremediation. Mol Ecol. 1995;4:567–578. [Google Scholar]
- 10.Brown P O, Botstein D. Exploring the new world of the genome with DNA microarrays. Nat Genet. 1999;21:33–37. doi: 10.1038/4462. [DOI] [PubMed] [Google Scholar]
- 11.Call D R, Brockman F J, Chandler D P. Genotyping Escherichia coli O157:H7 using multiplexed PCR and low-density microarrays. Int J Food Microbiol. 2001;67:71–80. doi: 10.1016/s0168-1605(01)00437-8. [DOI] [PubMed] [Google Scholar]
- 12.Call D R, Chandler D P, Brockman F J. Fabrication of DNA microarrays using unmodified oligomer probes. BioTechniques. 2001;30:368–379. doi: 10.2144/01302tt06. [DOI] [PubMed] [Google Scholar]
- 13.Chandler D P, Schuck B L, Brockman F J, Bruckner-Lea C J. Automated nucleic acid isolation and purification from soil extracts using renewable affinity microcolumns in a sequential injection system. Talanta. 1999;49:969–983. doi: 10.1016/s0039-9140(99)00074-0. [DOI] [PubMed] [Google Scholar]
- 14.Chandler D P, Stults J R, Cebula S, Schuck B L, Weaver D W, Anderson K K, Egholm M, Brockman F J. Affinity purification of DNA and RNA from environmental samples with peptide nucleic acid (PNA) clamps. Appl Environ Microbiol. 2000;66:3438–3445. doi: 10.1128/aem.66.8.3438-3445.2000. [DOI] [PMC free article] [PubMed] [Google Scholar]
- 15.Chee M, Yang R, Hubbell E, Berno A, Huang X C, Stern D, Winkler J, Lockhart D J, Morris M S, Fodor S P A. Accessing genetic information with high-density DNA arrays. Science. 1996;274:610–614. doi: 10.1126/science.274.5287.610. [DOI] [PubMed] [Google Scholar]
- 16.Cheung V G, Morley M, Aguilar F, Massimi A, Kucherlapati R, Childs G. Making and reading microarrays. Nat Genet. 1999;21:15–19. doi: 10.1038/4439. [DOI] [PubMed] [Google Scholar]
- 17.Daniel E S, Haegert D G. Method to identify biases in PCR amplification of T-cell receptor variable region genes. BioTechniques. 1996;20:600–602. [PubMed] [Google Scholar]
- 18.Drmanac R, Drmanac S. cDNA screening by array hybridization. Methods Enzymol. 1999;303:165–179. doi: 10.1016/s0076-6879(99)03013-x. [DOI] [PubMed] [Google Scholar]
- 19.Farrelly V, Rainey F A, Stackebrandt E. Effect of genome size and rrn gene copy number on PCR amplification of 16S rRNA genes from a mixture of bacterial species. Appl Environ Microbiol. 1995;61:2798–2801. doi: 10.1128/aem.61.7.2798-2801.1995. [DOI] [PMC free article] [PubMed] [Google Scholar]
- 20.Ford J E, McHeyzer-Williams M G, Lieber M R. Chimeric molecules created by gene amplification interfere with the analysis of somatic hypermutation of murine immunoglobulin genes. Gene. 1994;142:279–283. doi: 10.1016/0378-1119(94)90275-5. [DOI] [PubMed] [Google Scholar]
- 21.Fulton R J, McDade R L, Smith P L, Kienker L J, Kettman J R., Jr Advanced multiplexed analysis with the FlowMetrix™ system. Clin Chem. 1997;43:1749–1756. [PubMed] [Google Scholar]
- 22.Gunderson K L, Huang X C, Morris M S, Lipshutz R J, Lockhart D J, Chee M S. Mutation detection by ligation to complete n-mer DNA arrays. Genome Res. 1998;8:1142–1153. doi: 10.1101/gr.8.11.1142. [DOI] [PubMed] [Google Scholar]
- 23.Guo Z G, Guilfoyle A, Thiel A J, Wang R, Smith L M. Direct fluorescence analysis of genetic polymorphisms by hybridization with oligonucleotide arrays on glass supports. Nucleic Acids Res. 1994;22:5456–5465. doi: 10.1093/nar/22.24.5456. [DOI] [PMC free article] [PubMed] [Google Scholar]
- 24.Guschin D, Yershov G, Zaslavsky A, Gemmell A, Shick V, Proudnikov D, Arenkov P, Mirzabekov A. Manual manufacturing of oligonucleotide, DNA and protein microchips. Anal Biochem. 1997;250:203–211. doi: 10.1006/abio.1997.2209. [DOI] [PubMed] [Google Scholar]
- 25.Guschin D Y, Mobarry B K, Proudnikov D, Stahl D A, Rittmann B E, Mirzabekov A D. Oligonucleotide microchips as genosensors for determinative and environmental studies in microbiology. Appl Environ Microbiol. 1997;63:2397–2402. doi: 10.1128/aem.63.6.2397-2402.1997. [DOI] [PMC free article] [PubMed] [Google Scholar]
- 26.Guttell R R. Collection of small subunit (16S- and 16S-like) ribosomal RNA structures. Nucleic Acids Res. 1994;22:3502–3507. doi: 10.1093/nar/22.17.3502. [DOI] [PMC free article] [PubMed] [Google Scholar]
- 27.Iannone M A, Taylor J D, Chen J, Li M-S, Rivers P, Slentz-Kesler K A, Weiner M P. Multiplexed single nucleotide polymorphism genotyping by oligonucleotide ligation and flow cytometry. Cytometry. 2000;39:131–140. [PubMed] [Google Scholar]
- 28.Lewin B. Genes IV. New York, N.Y: Oxford University Press; 1990. [Google Scholar]
- 29.Lockhart D J, Dong H, Byrne M C, Folletti M T, Gallo M V, Chee M S, Mittmann M, Wang C, Kobayashi M, Horton H, Brown E L. Expression monitoring by hybridization to high-density oligonucleotide arrays. Nat Biotechnol. 1996;14:1675–1680. doi: 10.1038/nbt1296-1675. [DOI] [PubMed] [Google Scholar]
- 30.Maidak B L, Cole J R, Parker C T, Jr, Garrity G M, Larsen N, Li B, Lilburn T G, McCaughey M J, Olsen G J, Overbeek R, Pramanik S, Schmidt T M, Tiedje J M, Woese C R. A new version of the RDP (Ribosomal Database Project) Nucleic Acids Res. 1999;27:171–173. doi: 10.1093/nar/27.1.171. [DOI] [PMC free article] [PubMed] [Google Scholar]
- 31.Maldonado-Rodriguez R, Espinosa-Lara M, Calixto-Suárez A, Beattie W G, Beattie K L. Hybridization of glass-tethered oligonucleotide probes to target strands preannealed with labeled auxiliary oligonucleotides. Mol Biotechnol. 1999;11:1–12. doi: 10.1007/BF02789172. [DOI] [PubMed] [Google Scholar]
- 32.Maldonado-Rodriguez R, Espinosa-Lara M, Loyoloa-Abitia P, Beattie W G, Beattie K L. Mutation detection by stacking hybridization on genosensor arrays. Mol Biotechnol. 1999;11:13–25. doi: 10.1007/BF02789173. [DOI] [PubMed] [Google Scholar]
- 33.Mathieu-Daudé F, Welsh J, Vogt T, McClelland M. DNA rehybridization during PCR: the ‘Cot effect’ and its consequences. Nucleic Acids Res. 1996;11:2080–2086. doi: 10.1093/nar/24.11.2080. [DOI] [PMC free article] [PubMed] [Google Scholar]
- 34.Parinov S, Barsky V, Yershov G, Kirillov E, Timofeev E, Belgovskiy A, Mirzabekov A. DNA sequencing by hybridization to microchip octa- and decanucleotides extended by stacked pentanucleotides. Nucleic Acids Res. 1996;24:2998–3004. doi: 10.1093/nar/24.15.2998. [DOI] [PMC free article] [PubMed] [Google Scholar]
- 35.Pease A C, Solas D, Sullivan E J, Cronin M T, Holmes C P, Fodor S P A. Light-generated oligonucleotide arrays for rapid DNA sequence analysis. Proc Natl Acad Sci USA. 1994;91:5022–5026. doi: 10.1073/pnas.91.11.5022. [DOI] [PMC free article] [PubMed] [Google Scholar]
- 36.Rainey F A, Ward N, Sly L I, Stackebrandt E. Dependence on the taxon composition of clone libraries for PCR amplified, naturally occurring 16S rDNA, on the primer pair and the cloning system used. Experientia. 1994;50:796–797. [Google Scholar]
- 37.Southern E M, Maskos U, Elder J K. Analyzing and comparing nucleic acid sequences by hybridization to arrays of oligonucleotides: evaluation using experimental models. Genomics. 1992;13:1008–1017. doi: 10.1016/0888-7543(92)90014-j. [DOI] [PubMed] [Google Scholar]
- 38.Spiro A, Lowe M, Brown D. A bead-based method for multiplexed identification and quantitation of DNA sequences using flow cytometry. Appl Environ Microbiol. 2000;66:4258–4265. doi: 10.1128/aem.66.10.4258-4265.2000. [DOI] [PMC free article] [PubMed] [Google Scholar]
- 39.Suzuki M, Rappé M S, Giovannoni S J. Kinetic bias in estimates of coastal picoplankton community structure obtained by measurement of small-subunit rRNA gene PCR amplicon length heterogeneity. Appl Environ Microbiol. 1998;64:4522–4529. doi: 10.1128/aem.64.11.4522-4529.1998. [DOI] [PMC free article] [PubMed] [Google Scholar]
- 40.Suzuki M T, Giovannoni S J. Bias caused by template annealing in the amplification of mixtures of 16S rRNA genes by PCR. Appl Environ Microbiol. 1996;62:625–630. doi: 10.1128/aem.62.2.625-630.1996. [DOI] [PMC free article] [PubMed] [Google Scholar]
- 41.Tebbe C C, Vahjen W. Interference of humic acids and DNA extracted directly from soil in detection and transformation of recombinant DNA from bacteria and yeast. Appl Environ Microbiol. 1993;59:2657–2665. doi: 10.1128/aem.59.8.2657-2665.1993. [DOI] [PMC free article] [PubMed] [Google Scholar]
- 42.von Wintzingerode F, Göbel U B, Stackebrandt E. Determination of microbial diversity in environmental samples: pitfalls of PCR-based rRNA analysis. FEMS Microbiol Rev. 1997;21:213–229. doi: 10.1111/j.1574-6976.1997.tb00351.x. [DOI] [PubMed] [Google Scholar]
- 43.Yershov G, Barsky V, Belgovskiy A, Kirillov E, Kreindlin E, Ivanov I, Parinov S, Guschin D, Drobishev A, Dubiley S, Mirzabekov A. DNA analysis and diagnostics on oligonucleotide microchips. Proc Natl Acad Sci USA. 1996;93:4913–4918. doi: 10.1073/pnas.93.10.4913. [DOI] [PMC free article] [PubMed] [Google Scholar]


