Abstract
A color image encryption algorithm based on double fractional order chaotic neural network (CNN), interlaced dynamic deoxyribonucleic acid (DNA) encoding and decoding, zigzag confusion, bidirectional bit-level diffusion and convolution operation is proposed. Firstly, two fractional order chaotic neural networks (CNNs) are proposed to explore the application of fractional order CNN in image encryption. Meanwhile, spectral entropy (SE) algorithm shows that the sequence generated by the proposed fractional order CNNs has better randomness. Secondly, a DNA encoding and decoding encryption scheme with evolutionary characteristics is adopted. In addition, convolution operation is utilized to improve the key sensitivity. Finally, simulation results and security analysis illustrate that the proposed algorithm has high security performance and can withstand classical cryptanalysis attacks.
Keywords: fractional order chaotic system, neural network, convolution operation, DNA encoding, image encryption
1. Introduction
The rapid development of information technology has greatly facilitated people’s daily life, but the information security issues caused by this method cannot be ignored. Digital image, which is one of the information carriers, is extensively used in medical, education, military and other fields. However, the security of image information is hard to guarantee due to the openness of the internet platform. If the problem of image information security cannot be solved, it will cause irreparable loss to military, education, medical, and other fields. Therefore, it is of great significance to design a safe and effective image encryption algorithm. A puzzling phenomenon is that image information has the characteristics of high data redundancy, strong pixel correlation, and large data capacity, which makes the traditional encryption algorithms unsuitable for image encryption [1,2]. In view of the above information characteristics of image, image encryption algorithms based on different technologies have been extensively researched, including chaos theory [3,4,5,6], deoxyribonucleic acid (DNA) encoding and calculation [7,8], cellular automata [9,10], etc.
Chaotic system applies to image encryption because of its similar characteristics with cryptography, such as ergodicity, initial value sensitivity, and aperiodicity [11,12]. Common chaotic systems include Logistic mapping, Henon mapping, Lorenz chaotic system, Hopfield neural network (HNN) chaotic system, etc. Among them, the HNN model was proposed by the American physicist Hopfield in 1982 [13]. This model can generate very complex behaviors, such as hyper-chaos, and chaos, etc. Moreover, due to the nonlinear activation function of neurons, this model has a strong nonlinear characteristic. Therefore, HNN has been extensively researched and applied in image encryption [14,15,16]. In addition, fractional calculus has more than 300 years of theoretical research history, but it was not applied in engineering, physics or applied mathematics until recent decades [17]. Some studies show that, when introducing a fractional differential operator into chaotic system, the system will produce more accurate and complex dynamic behavior, and have stronger randomness and unpredictability [17]. Meanwhile, in contrast to an integer order chaotic system, the order of a fractional order chaotic system can also be used as the key of the encryption algorithm.
DNA operation is extensively used in image encryption because of its high parallelism [18], which can improve the efficiency of encryption and decryption. However, DNA operation is, in essence, a von Neumann operation principle [19]; its operation rules are well-known. Chen et al. [20] investigated the properties of DNA encoding and found that some encryption schemes based on DNA encoding have different degrees of insecurity. The image encryption algorithms proposed in [21,22] adopt fixed DNA encoding rules, that is, the encoding rules are not related to plain image, which will reduce the security of the encryption algorithm. Therefore, we need to do something else to make DNA operation more unpredictable to ensure the security of encryption algorithm. In addition, bit-level diffusion can better hide the information from each bit plane of image than pixel-level diffusion. Lately, some bit-level image encryption algorithms were proposed [21,23,24]. In [21], a color image encryption algorithm based on DNA operation and chaos was proposed, which adopts the fixed DNA encoding rule. In [23], a color image encryption algorithm based on DNA encoding and double chaos system was proposed, which adopts dynamic DNA encoding. In [24], two unidirectional diffusion algorithms are mentioned. However, the unidirectional diffusion algorithm cannot propagate the subtle change of plain image to every pixel of encrypted image by a round diffusion operation.
On the basis of the previous analysis, we propose a color image encryption algorithm based on the double fractional order chaotic neural network (CNN), interlaced dynamic DNA encoding and decoding, zigzag confusion, bidirectional bit-level diffusion, and convolution operation. This paper contributes the following aspects:
-
(1)
Two fractional order CNNs are proposed. The chaotic performance analysis shows that a fractional order CNN has more complex chaotic behavior in comparison to the integer order CNN.
-
(2)
A new bidirectional bit-level diffusion algorithm is applied. The new bidirectional bit-level diffusion algorithm can hide the bit-plane information of plain image better.
-
(3)
An interlaced dynamic DNA encoding and decoding encryption scheme is adopted. This scheme has the evolution characteristic, which makes the encryption algorithm have higher security.
-
(4)
In the permutation algorithm, a convolution operation is used to associate the permutation process with plaintext information, which greatly enhances the key sensitivity and plaintext sensitivity of the algorithm.
The rest of the paper is organized as follows. In Section 2, the CNN is introduced and its dynamic characteristics are analyzed. In Section 3, some fundamental knowledge is given. Section 4 describes the proposed algorithm. Section 5 presents the simulation results. Security analyses are placed in Section 6. The conclusion is provided in Section 7.
2. CNN
2.1. Integer Order CNN
Based on the HNN model, [25] proposed a chaotic neuron model, whose definition is
| (1) |
In this paper, we let = 1 and n = 3, so the integral order CNN is
| (2) |
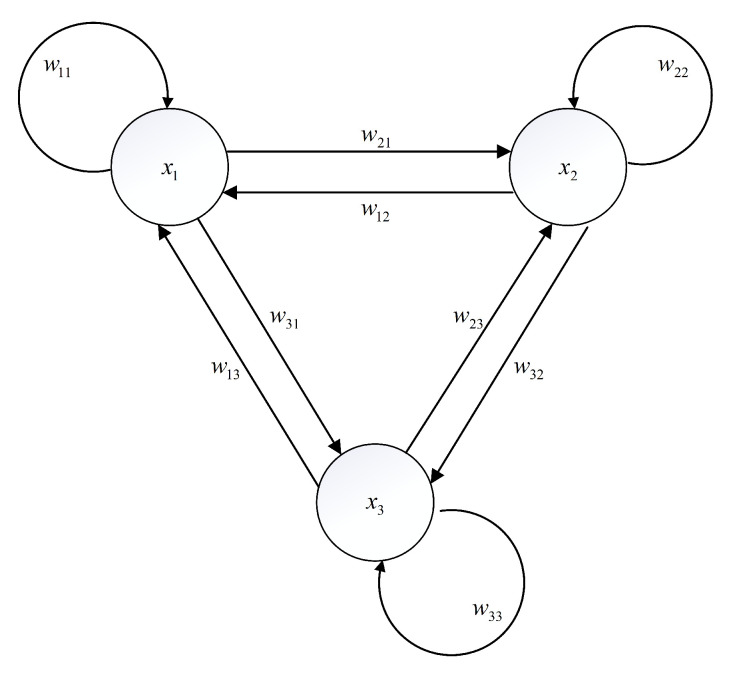
where . Figure 1 shows the connections between neurons in Equation (2). The connection weights , the conductance of membrane resistance and input current in Equation (2) are determined as
| (3) |
So Equation (2) can be defined as
| (4) |
Figure 1.
The connections between neurons in (2).
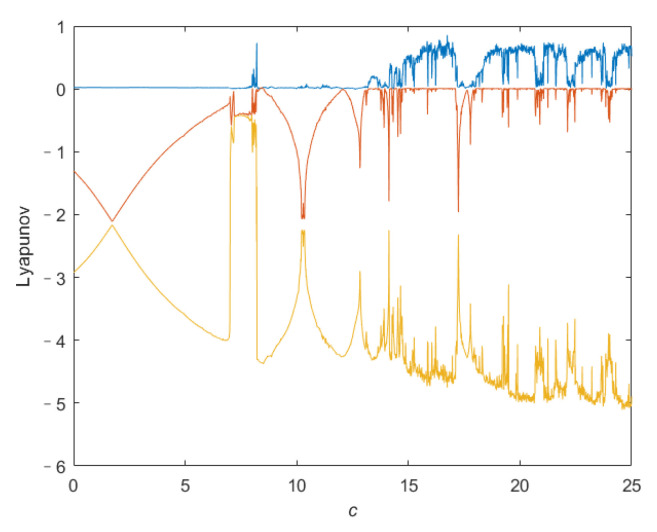
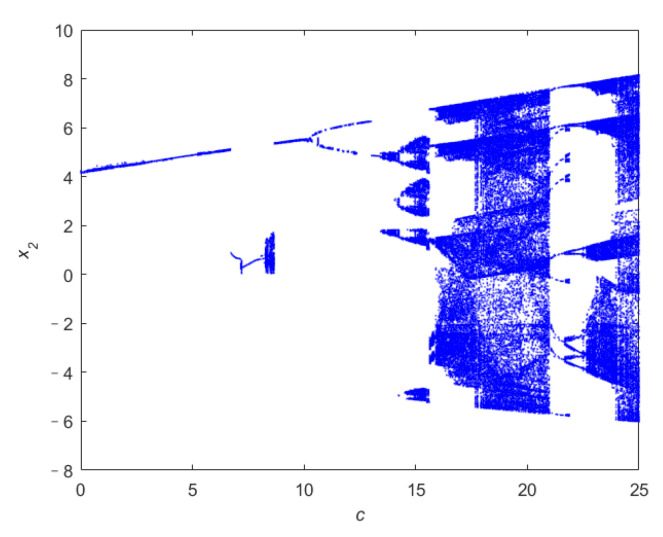
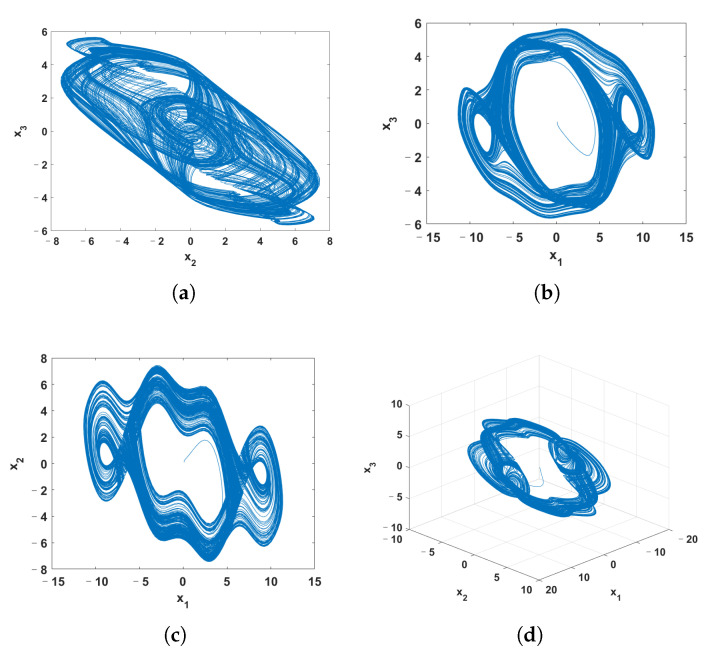
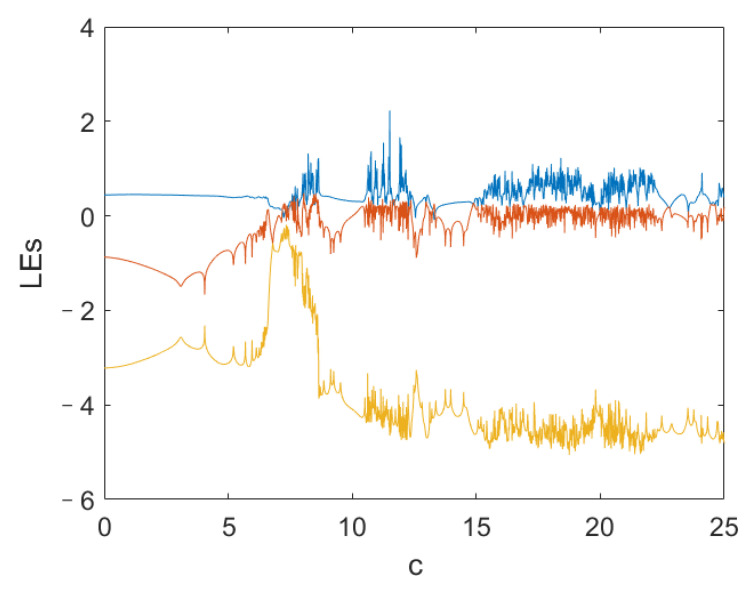
To confirm the chaotic characteristics of the system (4), we analyze its dynamic behavior. Figure 2 shows the relationship between the Lyapunov exponent (LE) of the system (4) and parameter c, where the LE is obtained by Euler method and Qatari Rial (QR) decomposition method. Figure 3 is the -axis bifurcation diagram of the system (4). Figure 3 shows that the system (4) enters into chaos by period doubling bifurcation. Figure 4 shows the phase portraits of system (4) when c = 20.
Figure 2.
LE spectrum of the system (4).
Figure 3.
The -axis bifurcation diagram of c.
Figure 4.
The phase portraits of system (4). (a) - plane; (b) - plane; (c) - plane; (d) perspective view.
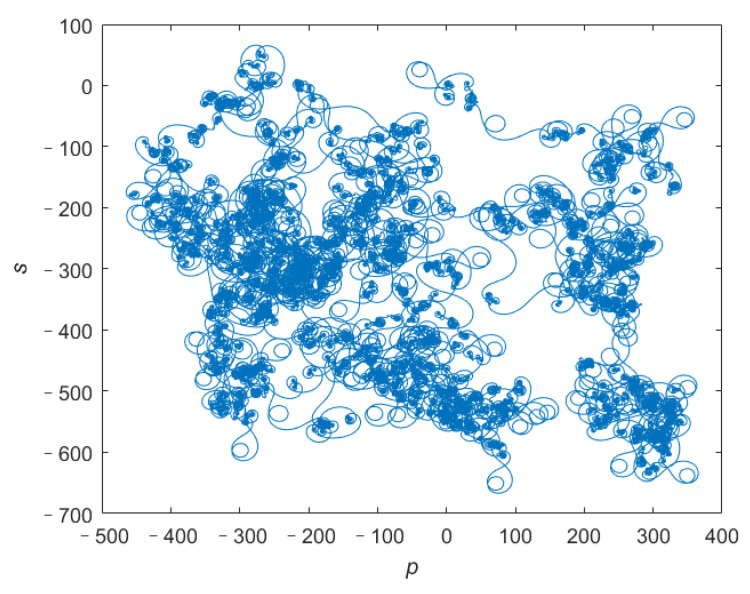
In addition, we use the 0–1 test [26] to further verify if the system (4) is chaotic. The trajectory of the (p, s) plane corresponds to Brownian motion when the parameter c of system (4) is 20, as shown in Figure 5. The trajectory of (p, s) plane of 0–1 test indicates that when parameter c is 20, the system (4) is chaotic.
Figure 5.
(p, s) plane of sequence with c = 20.
2.2. Fractional Order CNN
Fractional calculus has a number of definitions, among which Caputo, Riemann-Liouville and Grunwald-Letnikov definitions are the most commonly used. Since the fractional order differential equation defined by Caputo definition has the same initial condition form as an integer order differential equation [17], Caputo definition is adopted in this paper. The definition of Caputo fractional calculus is
| (5) |
where is Gamma function, which is
| (6) |
To improve the randomness of sequences generated by chaotic system, we generalize the system (4) to fractional order case and propose the fractional order CNN, which is defined as
| (7) |
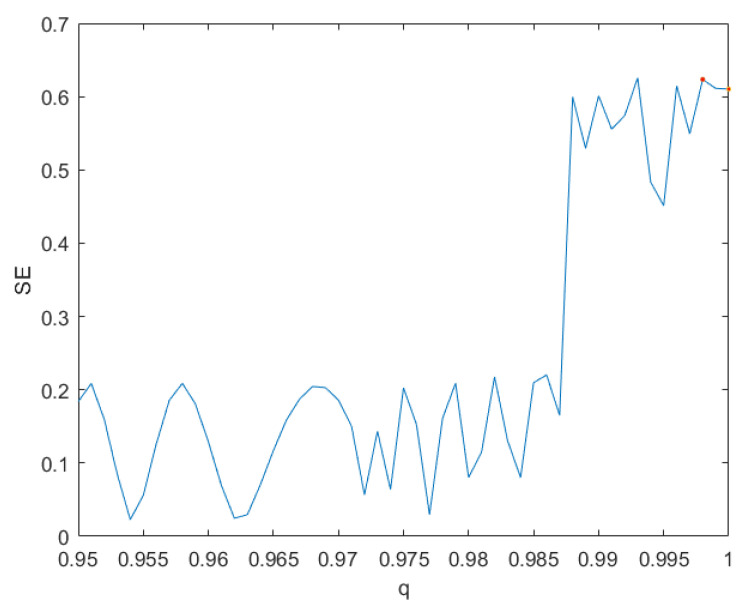
The complexity of chaotic systems refers to employing related algorithms to measure the possibility that the sequences generated by chaotic system approach random sequences [27]. The greater the complexity of chaotic system, the more random the sequences generated by chaotic systems are. Since spectral entropy (SE) algorithm [28] has the advantages of fewer parameters and higher accuracy, we use the SE algorithm to measure the complexity of the system (7) with parameter c = 20. Figure 6 shows the result, which illustrates that the complexity of system (7) with q = 0.998 and q = 1 (the system (4)) is 0.623 and 0.610, respectively. Obviously, the system (7) with q = 0.998 has higher complexity than the system (4).
Figure 6.
The complexity of system (7).
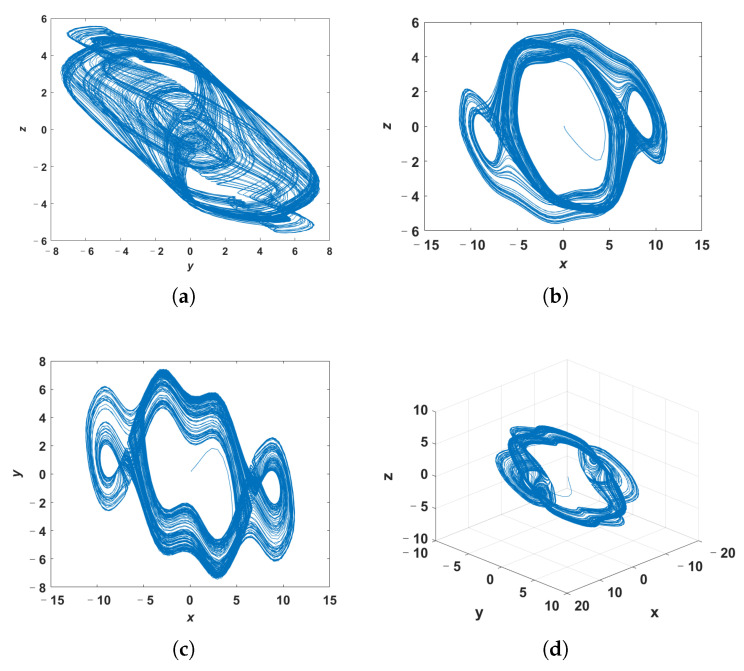
Since the high complexity of the system does not mean that the system is chaotic, we perform dynamic analysis on the system (7) with q = 0.998 and c = 20 to determine whether it is chaotic or not. The phase portraits of system (7) with q = 0.998 and c = 20 are shown in Figure 7, in which the system (7) is solved by the predictor-corrector method. Figure 8 presents the LE of the system (7) calculated by Wolf’s method, where the order q is 0.998. According to the phase portraits and the LE, it can be judged that when the parameter c is 20 and the order q is 0.998, the system (7) is chaotic. Based on the above results, it can be seen that the system (7) with q = 0.998 and c = 20 is chaotic and has a higher complexity than the system (4).
Figure 7.
The phase portraits of system (7). (a) y-z plane; (b) x-z plane; (c) x-y plane; (d) perspective view.
Figure 8.
LE spectrum of the system (7).
In [25], an integer order CNN is proposed. We also generalize it to the fractional order case, which can be described as
| (8) |
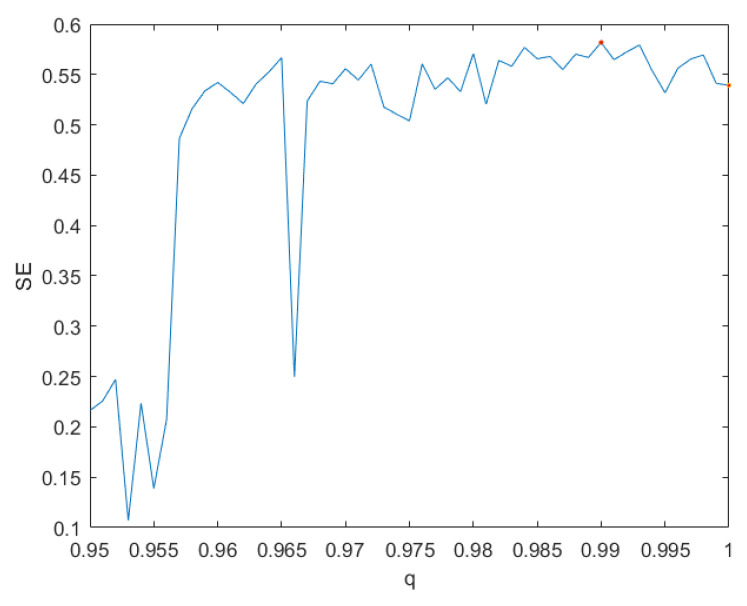
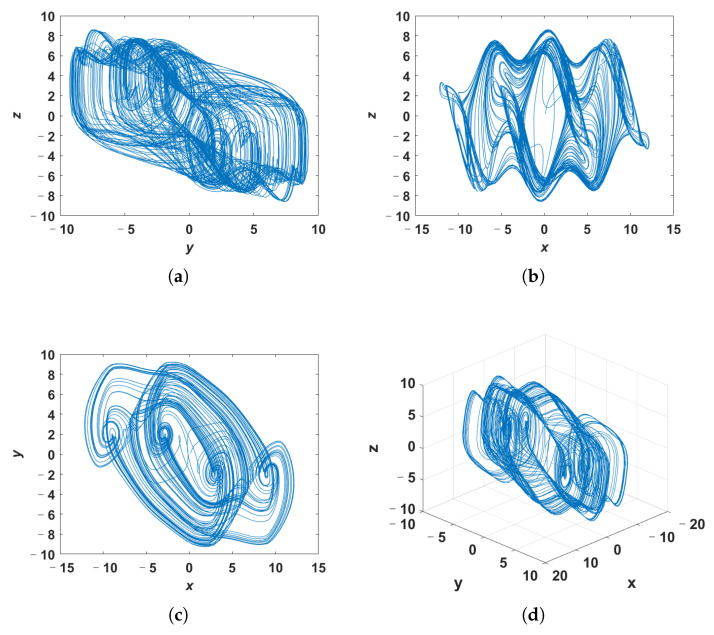
According to the previous method, we conducted dynamic analysis on system (8). Figure 9 gives the SE of system (8) and illustrates that the complexity of the system (8) with q = 0.99 is the highest. Therefore, the order q of the system (8) is determined to be 0.99. Figure 10 gives the phase portraits of the system (8) with q = 0.99. In addition, the maximum LE of the system (8) with q = 0.99 solved by Wolf’s method is greater than 0. Therefore, system (8) with q = 0.99 is chaotic and has high complexity.
Figure 9.
The complexity of system (8).
Figure 10.
The phase portraits of system (8). (a) y-z plane; (b) x-z plane; (c) x-y plane; (d) perspective view.
3. Fundamental Knowledge
3.1. Bit Plane Decomposition
An n-bit binary sequence can be used to represent any decimal value b that is not less than 0 [29], so an 8-bit binary sequence can be used to represent each pixel value of the image. In this paper, the three components of color image are decomposed into 8 bit planes respectively. The decomposition process is
| (9) |
3.2. DNA Sequence Operations
3.2.1. DNA Encoding and Decoding Rules
A(adenine), G (guanine), C (cytosine), and T (thymine) are the four basic nucleic acids that make up each DNA sequence, where G and C, T and A are complementary respectively [30]. 0 and 1 are complementary in binary computation, so the binary array 11 and 00, 10 and 01 are complementary. Because binary arrays and DNA have similar complementary properties, the binary arrays 00, 11, 01, and 10 can be encoded as C, A, G and T. Watson and Crick found that among the 24 coding rules, only 8 coding rules meet the complement requirements, which are listed in Table 1.
Table 1.
DNA encoding rule.
| Rule | 1 | 2 | 3 | 4 | 5 | 6 | 7 | 8 |
|---|---|---|---|---|---|---|---|---|
| A | 00 | 00 | 11 | 11 | 01 | 01 | 10 | 10 |
| G | 01 | 10 | 01 | 10 | 11 | 00 | 11 | 00 |
| C | 10 | 01 | 10 | 01 | 00 | 11 | 00 | 11 |
| T | 11 | 11 | 00 | 00 | 10 | 10 | 01 | 01 |
Different from other encryption algorithms, this paper dynamically selects two encoding rules for the encryption algorithm. Assume that the pixel value is 39, which can be expressed as [00100111], and the selected coding rules are rule 1 and rule 6. In encryption, [00100111] is encoded as [ACGT] according to rule 1. Then, [ACGT] is decoded as [01110010] according to rule 6. In decryption, [01110010] is encoded as [ACGT] according to rule 6, then [ACGT] is decoded as [00100111] according to rule 1. Thus, the interlaced dynamic DNA encoding and decoding encryption scheme has the characteristic of evolution, which can make DNA operation more unpredictable and reduce the insecurity caused by the fixed encoding rule.
3.2.2. DNA Operation
The DNA XOR operation is the XOR operation of binary number, so there are eight DNA XOR operations that correspond to DNA encoding rules. The DNA XOR operation that corresponds to encoding rule 2 is shown in Table 2.
Table 2.
DNA XOR operation.
| XOR | A | T | C | G |
|---|---|---|---|---|
| A | A | T | C | G |
| G | G | C | T | A |
| C | C | G | A | T |
| T | T | A | G | C |
3.3. Zigzag Confusion
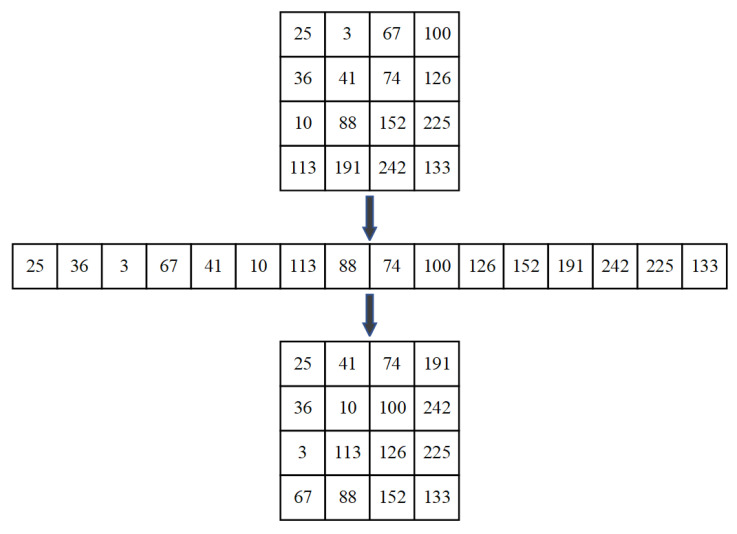
The path of the zigzag confusion is shown in Figure 11, which is different from the path of the general zigzag confusion. In this paper, zigzag confusion scans the elements in the matrix in Z order starting with the first element in the upper-left corner of the matrix, and rearranges the elements in columns into a matrix of the same size. In Figure 12, we give an example to help understand how the zigzag confusion works.
Figure 11.
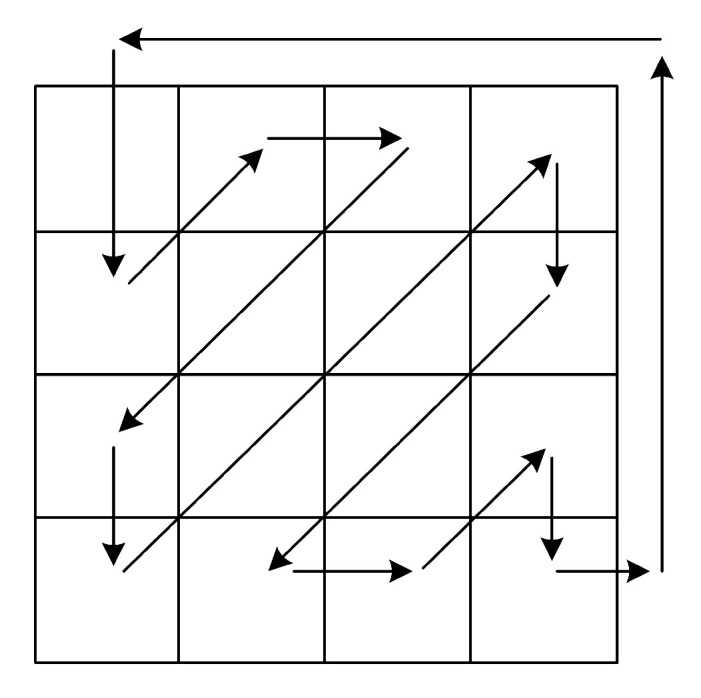
The path of the zigzag confusion.
Figure 12.
The example of zigzag confusion.
3.4. Convolution Operation
Convolution operation is widely used in the convolutional neural network, which is among the representative algorithms of deep learning and has excellent performance in computer vision, atmospheric science, natural language processing, and other fields. The definition of the convolution operation is
| (10) |
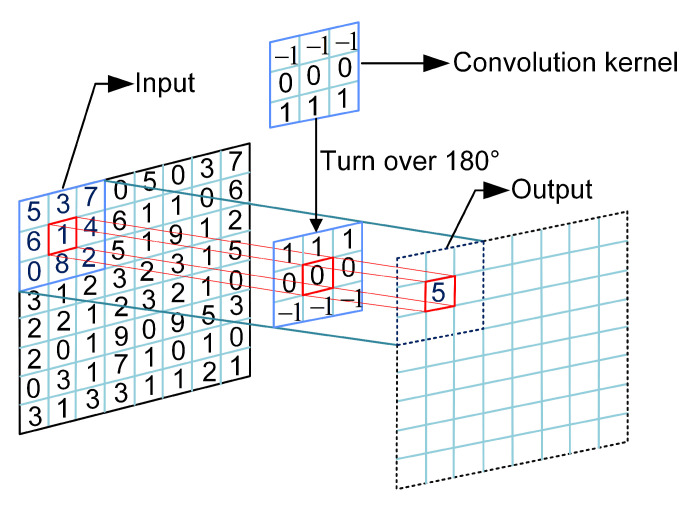
where h represents the output, f represents the input, g represents the convolution kernel. Figure 13 shows how the convolution works. In this paper, the convolution operation is used to calculate plaintext index, in which the chaotic sequence is the input and the hash value of plain image is the convolution kernel.
Figure 13.
Convolution operation.
4. The Proposed Image Encryption and Decryption Algorithm
4.1. Generating the Chaotic Matrices
The proposed fractional-order CNNs are used to generate chaotic matrices, and the following is the specific generating procedure for chaotic matrices.
Step 1: From the input color plain image P of size , a 256-bit hash value K is generated by using the secure hash algorithm (SHA-256), and K is converted to 32 numbers with every 8 bits as a group.
Step 2: Calculate the initial values of systems (7) and (8), as illustrated in Algorithm 1.
| Algorithm 1 Generating initial values of fractional order CNNs. |
| Input: |
| 1: ; |
| 2: ; |
| 3: ; |
| where ⊕ represents XOR operation. |
| Output: . |
Step 3: Firstly, perform 2000 pre-iterations for the systems (7) and (8) to avoid transient effects. Then, the systems (7) and (8) are iterated times respectively, where represents the nearest integer greater than or equal to b. The X, Y and Z sequences generated by the system (7) and the system (8) are spliced into and respectively (X followed by Y, and Y followed by Z). Finally, and are the first data of and respectively.
Step 4: Chaotic matrices , , , , , , and of size are generated by
| (11) |
4.2. Forward/Backward Bit-Level Diffusion
In the process of forward bit-level diffusion, we first XOR the lowest bit plane of image with the lowest bit plane of chaotic matrix, and then diffuse one by one from the lowest bit plane to the highest bit plane. In the process of backward bit-level diffusion, we first XOR the highest bit plane of image with the highest bit plane of chaotic matrix, and then diffuse them one by one from the highest bit plane to the lowest bit plane. Suppose Q is any component of color image and R is chaotic matrix. The following is the specific forward bit-level diffusion process.
Step 1: The Q and R are decomposed into 8 bit planes: , , , , , , , , , , , , , , and .
Step 2: The 8 bit planes of Q and R are turned into DNA matrices according to DNA encoding rule : , , , , , , and .
Step 3: The DNA matrices of Q are diffused through
| (12) |
where ⊕ represents DNA XOR operation corresponding to encoding rule .
Step 4: DNA matrix is decoded according to DNA decoding rule .
The backward bit-level diffusion can be obtained by replacing Equation (12) in forward bit-level diffusion with
| (13) |
where ⊕ represents DNA XOR operation corresponding to encoding rule .
4.3. Plaintext Associative Permutation
The process of plaintext associative permutation is as follows.
Step 1: The K is reshaped by column into a matrix, and the matrix is used as the convolution kernel to convolute with the chaotic matrix .
Step 2: Perform modular operation on the output of convolution operation to obtain matrix S, where M and N denote the size of the image I after forward bit-level diffusion.
Step 3: Arrange the elements that do not appear in S in the order of large to small to get sequence T.
Step 4: Scramble T with as the index.
Step 5: Replace the repeated elements in S with the elements in T, and then rearrange the image I with S as the index.
The operation details are given in Algorithm 2.
| Algorithm 2 The plaintext associative permutation. |
| Input: The image I, 256-bit hash value K, chaotic matrices and . |
|
| Output: . |
4.4. The Complete Encryption Process
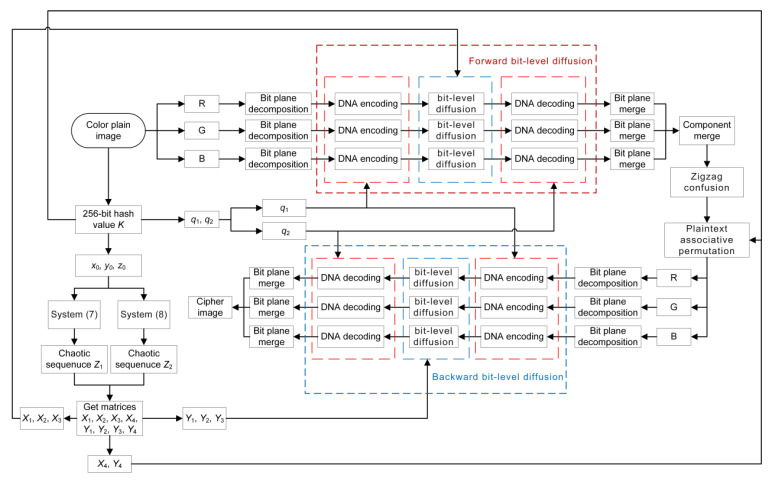
Figure 14 illustrates the encryption flow chart of the proposed algorithm. The following is the specific steps.
Figure 14.
The encryption flow chart.
Step 1: Input a color plain image and generate the key K and the chaotic matrices, as described in Section 4.1.
Step 2: Calculate and by
| (14) |
Step 3: The R, G, B components of the color image are decomposed into 8 bit planes, respectively.
Step 4: Chaotic matrices , and are used to perform forward bit-level diffusion on each component of the image, as described in Section 4.2.
Step 5: The bit planes of each component are merged, and then the three components of the image are merged.
Step 6: Perform zigzag confusion on the image as shown in Section 3.3, and then plaintext associative permutation is performed on the image as illustrated in Section 4.3.
Step 7: Repeat step 3, and then chaotic matrices , and are used to perform backward bit-level diffusion on each component of the image, as described in Section 4.2.
Step 8: Obtain the cipher image by repeating step 5.
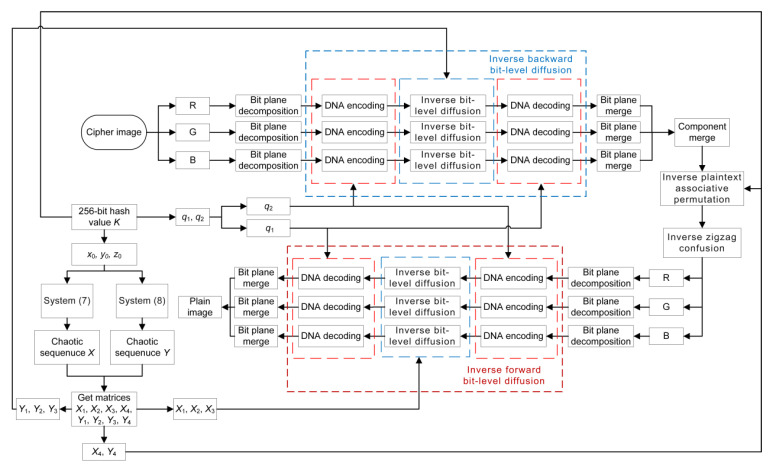
The decryption algorithm can be obtained by reverse operation of the encryption algorithm. Figure 15 shows the decryption algorithm flow chart.
Figure 15.
The decryption flow chart.
5. Simulation Results
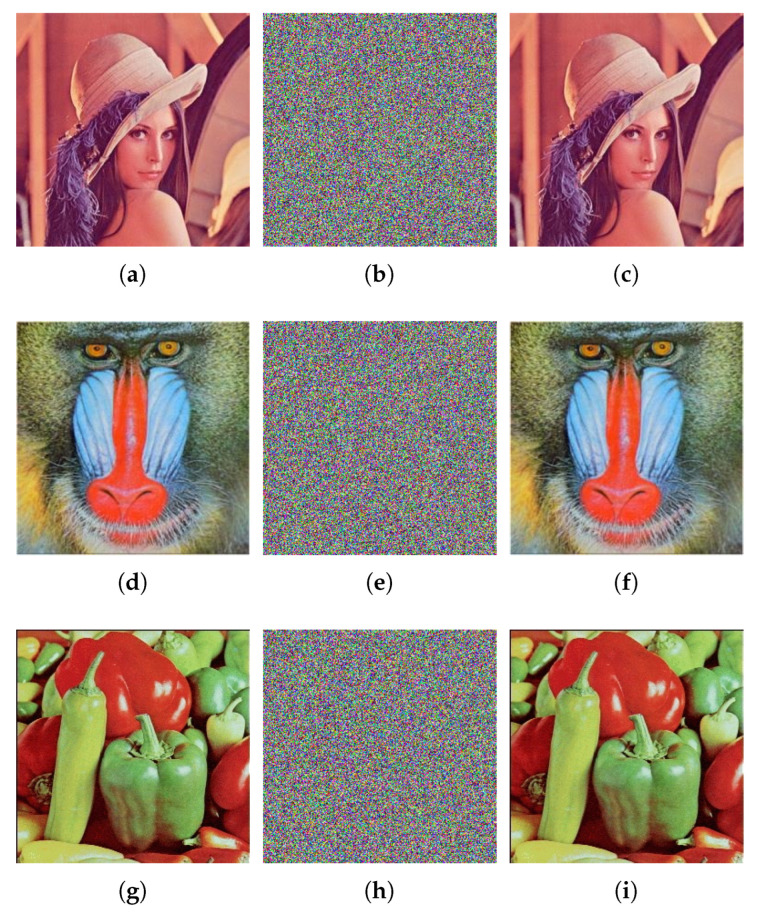
Figure 16 illustrates the simulation results. Obviously, the cipher images are like noise and cannot be recognizable. This means that, even if cipher images are intercepted in transit, valid information about plain images will not be leaked. In addition, the images decrypted by the correct key are visually identical to corresponding plain images. To quantitatively evaluate the quality of the decrypted images of the proposed algorithm, we introduce the Peak Signal-to-Noise Ratio (PSNR), which is defined as
| (15) |
where D and P represent the decrypted image and the plain image respectively, (i, j) are the position of pixel, M and N are the size of the images. The larger the PSNR value between the plain image and the decrypted image, the smaller the difference between them. When the decrypted image is completely the same as the plain image, the denominator in Equation (15) is 0, and the value of PSNR is infinity (Inf). The test results are shown in Table 3. It can be seen that the PSNR values between the decrypted image and the plain image are infinity. This indicates that the decrypted images are completely the same as the corresponding plain images. Therefore, the proposed algorithm performs well in terms of encryption and decryption.
Figure 16.
Encrypted and decrypted images. (a) Lena; (b) encrypted image of Lena; (c) decrypted image of Lena; (d) Baboon; (e) encrypted image of Baboon; (f) decrypted image of Baboon; (g) Pepper; (h) encrypted image of Pepper; (i) decrypted image of Pepper.
Table 3.
The PSNR value between decrypted image and plain image.
| Images | PSNR | ||
|---|---|---|---|
| R | G | B | |
| Lena | Inf | Inf | Inf |
| Baboon | Inf | Inf | Inf |
| Pepper | Inf | Inf | Inf |
6. Security Analyses
This section analyzes the following indicators to demonstrate the proposed algorithm’s security performance: key space, histogram, correlation of adjacent pixels, key sensitivity, differential attack, chosen/known-plaintext attack, information entropy, occlusion attack, and noise attack.
6.1. Key Space Analysis
Image encryption algorithms with key space smaller than are considered insecure [31]. The proposed algorithm’s key is composed of 256-bit binary hash values, and its key space size is , which is greater than . Consequently, the proposed algorithm can defend violent attacks.
6.2. Histogram Analysis
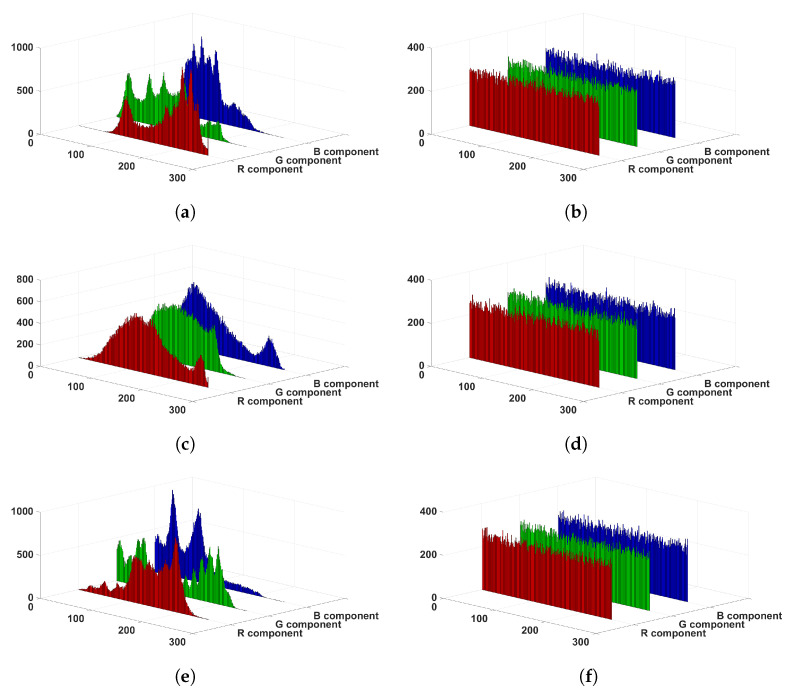
A histogram can provide an intuitive insight into the distribution characteristics of image pixel values, so we give the histograms of images, as shown in Figure 17. In contrast to the plain images, the pixel values of cipher images are distributed uniformly. This means that the attacker will not be able to obtain the information from the plain image via statistical analysis attack. In addition, to further examine the uniformity of histograms, chi-square test is introduced. It is defined as
| (16) |
where , and is the occurrence frequency of the pixel with the value of i. When the chi-square value is smaller than 293.2478, it means that the image histogram is approximately evenly distributed at the confidence level of 0.05 [32]. Table 4 shows that the cipher images’ chi-square values are all smaller than 293.2478, so the cipher images’ histograms are approximately evenly distributed. As a result, the proposed algorithm is capable of invalidating statistical attacks.
Figure 17.
Histogram results. (a) Lena; (b) cipher image of Lena; (c) Baboon; (d) cipher image of Baboon; (e) Pepper; (f) cipher image of Pepper.
Table 4.
Chi-square for plain image and its corresponding cipher image.
| Image | Plain Image | Cipher Image | ||||
|---|---|---|---|---|---|---|
| R | G | B | R | G | B | |
| Lena | 5.93 × 10 | 3.13 × 10 | 8.09 × 10 | 215.2266 | 224.8203 | 245.3828 |
| Baboon | 2.60 × 10 | 4.28 × 10 | 2.84 × 10 | 282.2500 | 244.5000 | 278.4063 |
| Pepper | 5.08 × 10 | 3.29 × 10 | 8.68 × 10 | 248.8594 | 207.5859 | 278.6061 |
6.3. Correlation Analysis of Adjacent Pixels
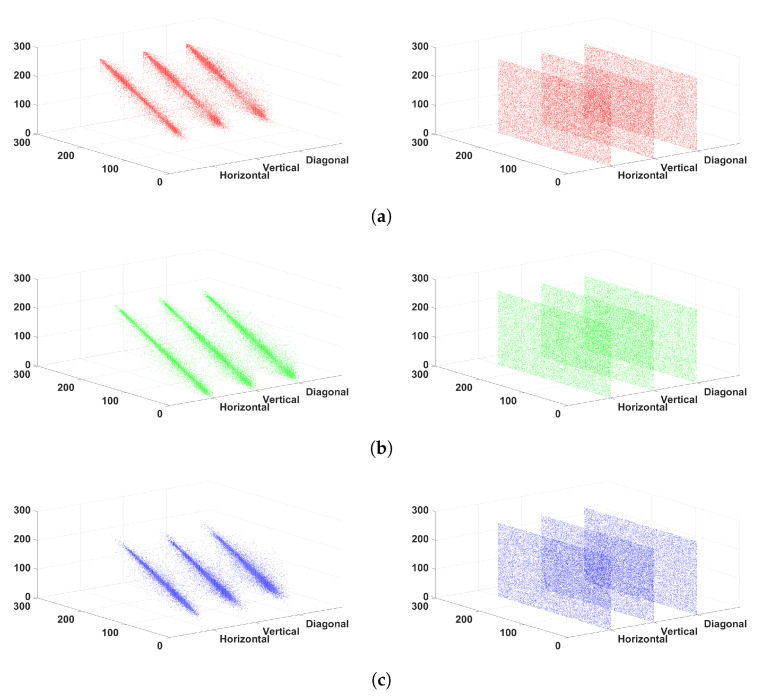
The correlation between adjacent pixels is closely related to whether the cipher image will be broken by statistical attack. The correlation between adjacent elements of cipher image should be as low as possible to prevent the cipher image from statistical attacks. In order to make the analysis result more reliable, 20,000 pairs of pixels are chosen at random and correlation coefficients are calculated through
| (17) |
where and are the gray values of the pixels and N is the number of pixel pairings that have been chosen.
Before and after encryption, the correlation coefficient between adjacent pixels clearly changes, and the cipher image’s correlation coefficients of adjacent pixels are near to 0, as seen in Table 5. Figure 18 displays the correlation scatterplots of the Lena image with and without encryption, where the left column is the correlation scatterplots of plain image, and the right column is the correlation scatterplots of cipher image. The adjacent pixel pairs in cipher images are evenly distributed in different components and directions, unlike in plain images.
Table 5.
The coefficients of correlation between adjacent pixels of the plain image and its corresponding cipher image.
| Image | Direction | Plain Image | Cipher Image | ||||
|---|---|---|---|---|---|---|---|
| R | G | B | R | G | B | ||
| Lena | Horizontal | 0.9706 | 0.9733 | 0.9452 | 0.0009 | −0.0012 | 0.0007 |
| Vertical | 0.9450 | 0.9450 | 0.8941 | −0.0005 | −0.0016 | −0.0010 | |
| Diagonal | 0.9187 | 0.9228 | 0.8578 | −0.0004 | −0.0009 | 0.0001 | |
| Baboon | Horizontal | 0.9407 | 0.9094 | 0.9496 | 0.0010 | −0.0003 | 0.0022 |
| Vertical | 0.9505 | 0.9194 | 0.9536 | 0.0023 | 0.0033 | 0.0023 | |
| Diagonal | 0.9060 | 0.8539 | 0.9145 | 0.0029 | −0.0030 | 0.0001 | |
| Pepper | Horizontal | 0.9242 | 0.9659 | 0.9275 | 0.0043 | 0.0019 | 0.0024 |
| Vertical | 0.9290 | 0.9646 | 0.9269 | −0.0006 | −0.0009 | −0.0001 | |
| Diagonal | 0.8766 | 0.9403 | 0.8783 | −0.0013 | 0.0026 | 0.0017 | |
Figure 18.
Correlation scatterplots of Lena image with and without encryption. (a) R component; (b) G component; (c) B component.
The comparisons between the proposed algorithm and other image encryption algorithms are placed in Table 6. By analyzing Table 6, it can be obtained that, as a whole, the proposed algorithm has smaller correlation coefficients compared with Refs. [33,34,35,36,37].
Table 6.
Comparison on coefficients of correlation for Lena image.
| Algorithm | Direction | R | G | B |
|---|---|---|---|---|
| Proposed | Horizontal | 0.0009 | −0.0012 | 0.0007 |
| Vertical | −0.0005 | −0.0016 | −0.0010 | |
| Diagonal | −0.0004 | −0.0009 | 0.0001 | |
| Ref. [33] | Horizontal | 0.0091 | −0.0012 | −0.0223 |
| Vertical | −0.0123 | 0.0047 | −0.0057 | |
| Diagonal | 0.0258 | 0.0188 | −0.0142 | |
| Ref. [34] | Horizontal | 0.0014 | 0.0033 | 0.0021 |
| Vertical | 0.0048 | −0.0006 | 0.0002 | |
| Diagonal | 0.0002 | 0.0048 | −0.0040 | |
| Ref. [35] | Horizontal | −0.0002 | −0.0015 | −0.0034 |
| Vertical | −0.0001 | 0.0041 | −0.0056 | |
| Diagonal | −0.0031 | −0.0004 | −0.0003 | |
| Ref. [36] | Horizontal | 0.0083 | −0.0054 | −0.0010 |
| Vertical | −0.0049 | 0.0100 | 0.0124 | |
| Diagonal | −0.0095 | −0.0017 | −0.0042 | |
| Ref. [37] | Horizontal | 0.0021 | 0.0053 | 0.0011 |
| Vertical | 0.0030 | −0.0002 | −0.0023 | |
| Diagonal | 0.0060 | 0.0034 | −0.0005 |
6.4. Key Sensitivity Analysis
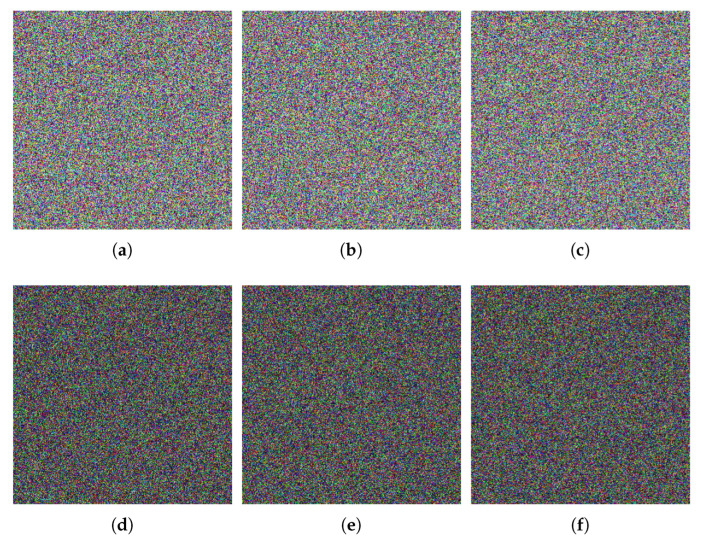
The key sensitivity of encryption algorithm is a vital metric to evaluate its security. Sensitivity of the key will be examined from two perspectives: the encryption and decryption process. The key K is obtained by performing SHA-256 on plain image, and the new key is obtained by randomly changing one bit of K using
| (18) |
In encryption process, encrypting the identical image with K and obtains two cipher images. Figure 19 shows the experimental results. Obviously, the subtraction images are noise-like images. Therefore, the cipher images encrypted with are not the same as the cipher images encrypted with K. Moreover, we introduce the number of pixels change rate (NPCR) and uniform average change intensity (UACI) to quantitatively analyze the differences between the two cipher images. The NPCR and UACI are defined as
| (19) |
According to Ref. [32], the ideal values of UACI and NPCR for two random 8-bit images are 33.4635% and 99.6094%, respectively. Clearly, the NPCR and UACI values are both near to the ideal values, as shown in Table 7.
Figure 19.
Key sensitivity test results during encryption. (a) Lena’s cipher image encrypted by ; (b) Baboon’s cipher image encrypted by ; (c) Pepper’s cipher image encrypted by ; (d) absolute value of (a) minus Figure 16b; (e) absolute value of (b) minus Figure 16e; (f) absolute value of (c) minus Figure 16h.
Table 7.
NPCR and UACI between the cipher image encrypted by K and the cipher image encrypted by .
| Image | NPCR (%) | UACI (%) | ||||
|---|---|---|---|---|---|---|
| R | G | B | R | G | B | |
| Lena | 99.6277 | 99.6140 | 99.5636 | 33.4383 | 33.4221 | 33.4527 |
| Baboon | 99.6338 | 99.5865 | 99.5636 | 33.3224 | 33.6109 | 33.4995 |
| Pepper | 99.5636 | 99.6185 | 99.5972 | 33.5139 | 33.5660 | 33.5406 |
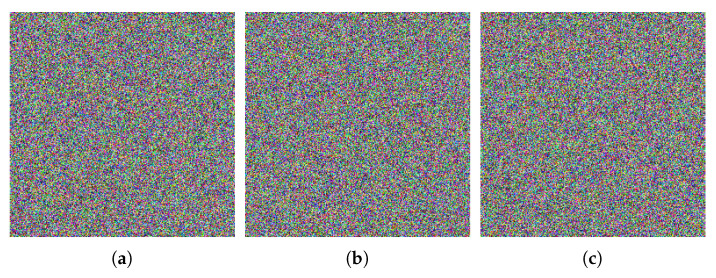
In decryption process, we decrypt the cipher image C with to obtain the image , where the cipher image C is obtained by encrypting the plain image P with K. Figure 20 shows the results. As can be seen from Figure 20, the image decrypted with the wrong key cannot get any effective information through vision. Meanwhile, NPCR and UACI are again employed to quantify the differences between P and . It is worth noting that the NPCR ideal value between deterministic and random images is fixed with a value of 99.6094%, while the UACI ideal value is dynamic [32]. When the Lena image (Figure 16a) is the deterministic image, 32.6967%, 30.5401% and 27.7562% are UACI ideal values of three components. When the Baboon image (Figure 16d) is the deterministic image, 29.4993%, 27.8160%, and 30.4805% are UACI ideal values of three components. When the Pepper image (Figure 16g) is the deterministic image, 28.7532%, 33.4662%, and 34.0153% are UACI ideal values of three components. Table 8 shows the NPCR and UACI between P and . Table 8 indicates that the values of NPCR and UACI are relatively near to the corresponding ideal values, so the proposed algorithm has strong sensitivity to the key.
Figure 20.
Experimental results of key sensitivity test during decryption. (a) result of decrypting Lena cipher image (Figure 16b) using ; (b) result of decrypting Baboon cipher image (Figure 16e) using ; (c) result of decrypting Pepper cipher image (Figure 16h) using .
Table 8.
NPCR and UACI between the image decrypted by the wrong key and the plain image.
| Index | Type | Component | Image | ||
|---|---|---|---|---|---|
| Lena | Baboon | Pepper | |||
| NPCR (%) | Calculated value | R | 99.6262 | 99.6155 | 99.6140 |
| G | 99.5697 | 99.5804 | 99.6490 | ||
| B | 99.6780 | 99.5621 | 99.5651 | ||
| Ideal value | R | ||||
| G | 99.6094 | ||||
| B | |||||
| UACI (%) | Calculated value | R | 32.7627 | 29.5176 | 28.7423 |
| G | 30.4562 | 27.8932 | 33.4938 | ||
| B | 27.8725 | 30.4958 | 34.0249 | ||
| Ideal value | R | 32.6967 | 29.4993 | 28.7532 | |
| G | 30.5401 | 27.8160 | 33.4662 | ||
| B | 27.7562 | 30.4805 | 34.0153 | ||
6.5. Information Entropy Analysis
The randomness of image information can be reflected through information entropy. The greater the information entropy, the less visual information the image contains, and the better the randomness of the image. The information entropy of information source s is defined as
| (20) |
where , is the grayscale value, and represents the occurrence probability of .
The theoretical value of information entropy of an 8-bit truly random image is 8. Table 9 illustrates the information entropy of the image before and after encryption. Clearly, the information entropy of the cipher images all distinctly approximate the theoretical value. Meanwhile, Table 10 gives the comparison results between the proposed algorithm and other algorithms on Lena image. As we can see, the information entropy of the proposed algorithm are higher than that of Refs. [34,35], and the proposed algorithm has some merits compared with Refs. [33,36,37].
Table 9.
Information entropy for plain images and cipher images.
| Image | Plain Image | Cipher Image | ||||
|---|---|---|---|---|---|---|
| R | G | B | R | G | B | |
| Lena | 7.2920 | 7.5658 | 7.0531 | 7.9976 | 7.9975 | 7.9973 |
| Baboon | 7.6634 | 7.3871 | 7,6646 | 7.9969 | 7.9973 | 7.9969 |
| Pepper | 7.3920 | 7.6150 | 7.1738 | 7.9973 | 7.9977 | 7.9969 |
Table 10.
Information entropy comparison of Lena’s cipher image.
6.6. Differential Attack Analysis
A secure image encryption algorithm can make the cipher image change dramatically when the plain image changes slightly. To verify the resistance of differential attacks of the proposed algorithm, we first select a pixel from the plain image at random and modify its value by Equation (21) to obtain the image . Then, the cipher images and are obtained by encrypting images and using the proposed algorithm. Finally, the difference between and is quantified by NPCR and UACI. Table 11 gives the results of differential attack. The results noted that NPCR and UACI are close to ideal values, so the proposed algorithm can effectively spread the small differences of the color plain image to the cipher image.
| (21) |
Table 11.
Differential attack results of color images.
| Image | NPCR (%) | UACI (%) | ||||
|---|---|---|---|---|---|---|
| R | G | B | R | G | B | |
| Lena | 99.6002 | 99.6506 | 99.6201 | 33.4866 | 33.4885 | 33.4942 |
| Baboon | 99.6170 | 99.5972 | 99.5956 | 33.4185 | 33.3454 | 33.4454 |
| Pepper | 99.6597 | 99.6323 | 99.6582 | 33.6292 | 33.4612 | 33.5380 |
Table 12 presents the comparison between the proposed algorithm and other algorithms on the Lena image. By analyzing the data in Table 12, it can be obtained that the NPCR and UACI of the proposed algorithm are closer to the ideal value compared with Refs. [33,35,36]. Compared with Ref. [34], the NPCR of R and B components of the proposed algorithm are closer to the ideal value, and the UACI of R and G components of the proposed algorithm are closer to the ideal value. Therefore, the proposed algorithm has some advantages compared with Refs. [33,34,35,36].
Table 12.
Comparison of differential attack results of Lena color image.
| Algorithm | NPCR (%) | UACI (%) | ||||
|---|---|---|---|---|---|---|
| R | G | B | R | G | B | |
| Proposed | 99.6002 | 99.6506 | 99.6201 | 33.4866 | 33.4885 | 33.4942 |
| Ref. [33] | 99.5590 | 99.5895 | 99.6063 | 33.5696 | 33.4967 | 33.5644 |
| Ref. [34] | 99.6243 | 99.6185 | 99.6280 | 33.4224 | 33.4361 | 33.4603 |
| Ref. [35] | 99.6124 | 99.6140 | 99.6201 | 33.4235 | 33.4838 | 33.5983 |
| Ref. [36] | 99.6078 | 99.6678 | 99.6078 | 33.5644 | 33.4458 | 33.5055 |
| Ref. [37] | - | - | - | - | - | - |
6.7. Chosen/Known-Plaintext Attack Analysis
The common methods for breaking image encryption algorithms include the chosen-plaintext attack and the known-plaintext attack. Moreover, the image encryption algorithm which can withstand the chosen-plaintext attack can also withstand the known-plaintext attack [38]. Therefore, we only test the performance of the proposed algorithm against the chosen-plaintext attack.
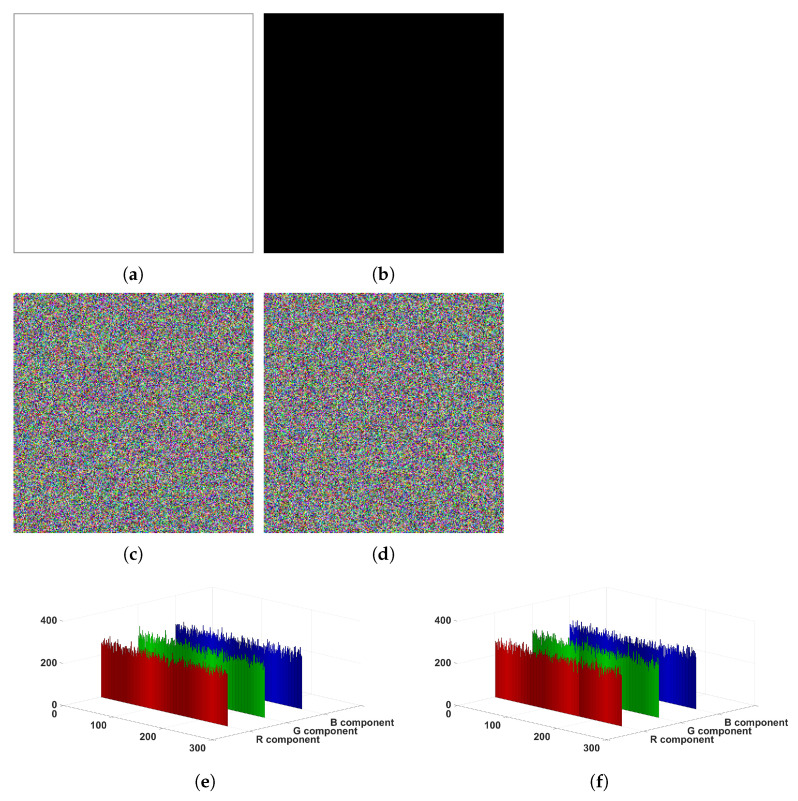
Because all-white and all-black images can make the permutation process invalid, attackers often use them to break encryption algorithms. Here, we encrypt the all-white image and all-black image, respectively, and perform a series of analyses on the encrypted images. Figure 21 and Table 13 show the experimental results. Clearly, the cipher images of all-white and all-black are unrecognizable noise images and their pixel values are evenly distributed, as shown in Figure 21. Table 13 illustrates that the cipher images of all-white and all-black have good performance. Therefore, the proposed algorithm can effectively withstand both chosen-plaintext and known-plaintext attacks.
Figure 21.
Experimental results of all-white image and all-black image. (a) all-white image; (b) all-black image; (c) cipher image of all-white image; (d) cipher image of all-black image; (e) histogram of (c); (f) histogram of (d).
Table 13.
The security analysis results of all-white cipher image and all-black cipher image.
| Image | Component | Correlation Coefficients | Chi-Square | Information Entropy | ||
|---|---|---|---|---|---|---|
| Horizontal | Vertical | Diagonal | ||||
| all-white | R | 0.0038 | 0.0013 | 0.0032 | 212.8594 | 7.9977 |
| G | −0.0021 | 0.0016 | −0.0004 | 255.8438 | 7.9972 | |
| B | 0.0035 | −0.0029 | 0.0015 | 258.0000 | 7.9972 | |
| all-black | R | 0.0032 | −0.0024 | 0.0017 | 274.5547 | 7.9970 |
| G | −0.0004 | −0.0005 | −0.0017 | 269.8046 | 7.9970 | |
| B | 0.0007 | 0.0025 | −0.0027 | 269.1016 | 7.9970 | |
6.8. Occlusion Attack Analysis
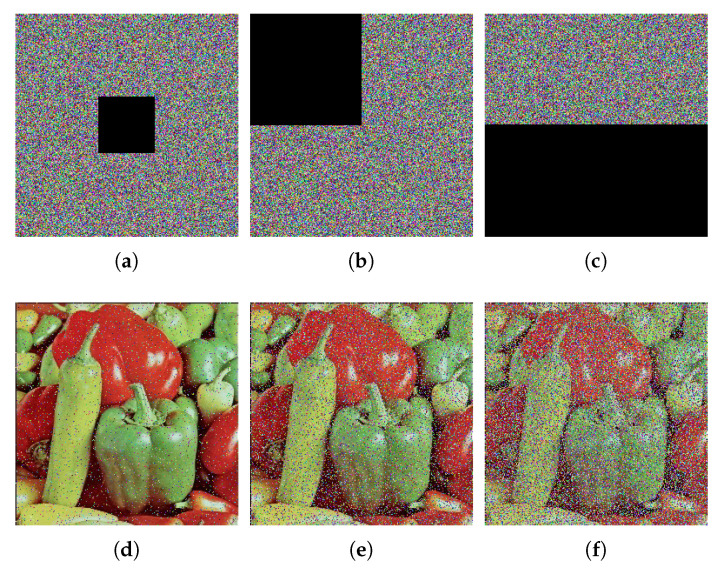
An effective image encryption algorithm should be robust to occlusion attack. Here, the color image Pepper (Figure 16g) is used as the test image. Furthermore, the content of the cipher image (Figure 16h) is occluded by 1/16, 1/4 and 1/2 respectively. Figure 22 gives the decryption results of the occluded images. clearly, the decrypted images can still be visually recognized even though the occlusion attack results in content loss and makes the decrypted image blurred. Therefore, the proposed algorithm is robust to occlusion attack.
Figure 22.
Occlusion attack results. (a) Figure 16h with 6.25% content occluding; (b) Figure 16h with 25% content occluding; (c) Figure 16h with 50% content occluding; (d) decrypted image of (a); (e) decrypted image of (b); (f) decrypted image of (c).
6.9. Noise Attack Analysis
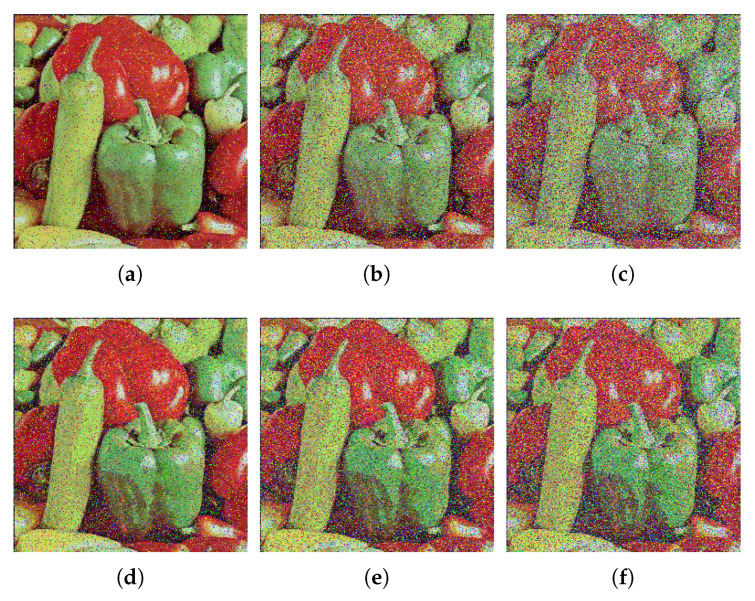
Image is often disrupted by noise during transmission. To ensure the effective restoration of the cipher image, the proposed algorithm should have good anti-noise interference ability. Salt & pepper noise (SPN) and Gaussian noise (GN) with different intensity are utilized to test the anti-noise performance of the proposed algorithm. Figure 23 gives the test results. The cipher images disturbed by noise are still visually identifiable after decryption, as shown in Figure 23. As a result, the proposed algorithm has strong ability to resist the attack from noise.
Figure 23.
Decryption images under different noise and different intensity. (a) SPN of 0.1 intensity; (b) SPN of 0.3 intensity; (c) SPN of 0.5 intensity; (d) GN of variance 0.0001 and mean 0.01; (e) GN of variance 0.0005 and mean 0.01; (f) GN of variance 0.001 and mean 0.01.
7. Conclusions
In this paper, two fractional order CNNs have been proposed by using Caputo definition. According to the results of dynamic analysis, the proposed two fractional order CNNs had better chaotic characteristics. Meanwhile, a color image encryption algorithm based on double fractional order CNN, interlaced dynamic DNA encoding and decoding, zigzag confusion, bidirectional bit-level diffusion and convolution operation was proposed. Firstly, the proposed algorithm adopted the encryption structure of forward diffusion, permutation and backward diffusion. The encryption structure can prevent the chosen-plaintext attack from breaking the permutation process. Secondly, the diffusion process of the proposed algorithm was carried out on the bit plane, which can better hide the bit plane information of plain image. Moreover, the proposed algorithm adopted the interlaced dynamic DNA encoding and decoding rule (the selection of rule was related to plaintext), which can make the diffusion process have dynamic evolution characteristics. Finally, the permutation process of the proposed algorithm included two parts: zigzag confusion and plaintext association permutation. In the process of zigzag confusion, the scanning path was different from other algorithms. In process of plaintext associative permutation, the convolution operation was used to make the proposed algorithm more sensitive to the key. In addition, the hash value of the plain image was the key, so the proposed algorithm was highly correlated with the plain image. Simulation results and security analysis indicated that the proposed algorithm was secure and effective.
However, since the proposed algorithm adopted the fractional order chaotic system, it had the disadvantage of long encryption and decryption time. In future research, we will apply the idea of block processing to optimize the proposed algorithm. Meanwhile, considering that the hyper-chaotic system has the same excellent chaotic characteristics as a fractional order chaotic system, we will try to design an image encryption algorithm based on a hyper-chaotic neural network. In recent years, machine learning and deep learning have performed well in the field of image processing. Thus, we will try to introduce these techniques to design a secure and efficient color image encryption algorithm.
Acknowledgments
The authors appreciate the smooth and quick processing of the manuscript by the editors and anonymous reviewers, as well as their helpful suggestions for improving the manuscript’s quality.
Abbreviations
The following abbreviations are used in this manuscript:
| CNN | Chaotic neural network |
| DNA | Deoxyribonucleic acid |
| HNN | Hopfield neural network |
| QR | Qatari Rial |
| LE | Lyapunov exponent |
| SE | spectral entropy |
| A | Adenine |
| G | Guanine |
| C | Cytosine |
| T | Thymine |
| SHA-256 | Secure hash algorithm-256 |
| PSNR | Peak signal-to-noise ratio |
| NPCR | Number of pixels change rate |
| UACI | Unified average changing intensity |
| SPN | Salt & pepper noise |
| GN | Gaussian noise |
Author Contributions
Conceptualization, N.L. and S.X.; Methodology, N.L. and S.X.; Software, N.L.; Validation, N.L., S.X. and J.Z.; Formal analysis, N.L.; Investigation, S.X.; Resources, N.L.; Data curation, N.L.; Writing—original draft preparation, N.L.; Writing—review and editing, S.X. and J.Z.; Visualization, N.L. and J.Z.; Supervision, S.X.; Project administration, N.L. and S.X. All authors have read and agreed to the published version of the manuscript.
Institutional Review Board Statement
Not applicable.
Informed Consent Statement
Not applicable.
Data Availability Statement
Data sharing not applicable.
Conflicts of Interest
The authors declare no conflict of interest.
Funding Statement
This research received no external funding.
Footnotes
Publisher’s Note: MDPI stays neutral with regard to jurisdictional claims in published maps and institutional affiliations.
References
- 1.Zhao H., Xie S., Zhang J., Wu T. A dynamic block image encryption using variable-length secret key and modified Henon map. Optik. 2021;230:166307. doi: 10.1016/j.ijleo.2021.166307. [DOI] [Google Scholar]
- 2.Suryanto Y., Suryadi M., Ramli K. A Secure and Robust Image Encryption Based on Chaotic Permutation Multiple Circular Shrinking and Expanding. J. Inf. Hiding Multim. Signal Process. 2016;7:697–713. [Google Scholar]
- 3.Gao X. A color image encryption algorithm based on an improved Hénon map. Phys. Scr. 2021;96:065203. doi: 10.1088/1402-4896/abed7d. [DOI] [Google Scholar]
- 4.Chen Y., Xie S., Zhang J. A Hybrid Domain Image Encryption Algorithm Based on Improved Henon Map. Entropy. 2022;24:287. doi: 10.3390/e24020287. [DOI] [PMC free article] [PubMed] [Google Scholar]
- 5.Wu T., Xie S.C., Zhang J.Z., Zhao H.X. Color image encryption algorithm based on the position index and chaos theory. J. Electron. Imaging. 2019;28:053008. doi: 10.1117/1.JEI.28.5.053008. [DOI] [Google Scholar]
- 6.Huang X., Nia M., Ding Q. Research on image encryption based on hyperchaotic system. J. Netw. Intell. 2020;5:10–22. [Google Scholar]
- 7.Wang T., Wang M.H. Hyperchaotic image encryption algorithm based on bit-level permutation and DNA encoding. Opt. Laser Technol. 2020;132:106355. doi: 10.1016/j.optlastec.2020.106355. [DOI] [Google Scholar]
- 8.Li H., Li T., Feng W., Zhang J., Zhang J., Gan L., Li C. A novel image encryption scheme based on non-adjacent parallelable permutation and dynamic DNA-level two-way diffusion. J. Inf. Secur. Appl. 2021;61:102844. doi: 10.1016/j.jisa.2021.102844. [DOI] [Google Scholar]
- 9.Chong J., Xie S., Zhang J., Liu D. Block color image encryption algorithm based on elementary cellular automata and DNA sequence operations. J. Electron. Imaging. 2021;30:043025. doi: 10.1117/1.JEI.30.4.043025. [DOI] [Google Scholar]
- 10.Roy S., Shrivastava M., Rawat U., Pandey C.V., Nayak S.K. IESCA: An efficient image encryption scheme using 2-D cellular automata. J. Inf. Secur. Appl. 2021;61:102919. doi: 10.1016/j.jisa.2021.102919. [DOI] [Google Scholar]
- 11.Zhao H., Xie S., Zhang J., Wu T. Efficient image encryption using two-dimensional enhanced hyperchaotic Henon map. J. Electron. Imaging. 2020;29:023007. doi: 10.1117/1.JEI.29.2.023007. [DOI] [Google Scholar]
- 12.Zhu J., Du B. Image Encryption Algorithm based on Chaos and Its Implementation on FPGA. J. Inf. Hiding Multim. Signal Process. 2019;10:278–288. [Google Scholar]
- 13.Hopfield J.J. Neural networks and physical systems with emergent collective computational abilities. Proc. Natl. Acad. Sci. USA. 1982;79:2554–2558. doi: 10.1073/pnas.79.8.2554. [DOI] [PMC free article] [PubMed] [Google Scholar]
- 14.Hu Y., Yu S., Zhang Z. On the security analysis of a Hopfield chaotic neural network-based image encryption algorithm. Complexity. 2020;2020:2051653. doi: 10.1155/2020/2051653. [DOI] [Google Scholar]
- 15.Mahmoud E.E., Jahanzaib L.S., Trikha P., Almaghrabi O.A. Analysis and control of the fractional chaotic Hopfield neural network. Adv. Differ. Equ. 2021;2021:1–15. doi: 10.1186/s13662-021-03285-0. [DOI] [Google Scholar]
- 16.Xu S., Wang X., Ye X. A new fractional-order chaos system of Hopfield neural network and its application in image encryption. Chaos Solitons Fractals. 2022;157:111889. doi: 10.1016/j.chaos.2022.111889. [DOI] [Google Scholar]
- 17.Huang X., Zhao Z., Wang Z., Li Y. Chaos and hyperchaos in fractional-order cellular neural networks. Neurocomputing. 2012;94:13–21. doi: 10.1016/j.neucom.2012.01.011. [DOI] [Google Scholar]
- 18.Zhang Q., Guo L., Wei X. Image encryption using DNA addition combining with chaotic maps. Math. Comput. Model. 2010;52:2028–2035. doi: 10.1016/j.mcm.2010.06.005. [DOI] [Google Scholar]
- 19.Zhang Y. The image encryption algorithm based on chaos and DNA computing. Multimed. Tools Appl. 2018;77:21589–21615. doi: 10.1007/s11042-017-5585-x. [DOI] [Google Scholar]
- 20.Chen L., Li C., Li C. Security measurement of a medical communication scheme based on chaos and DNA coding. J. Vis. Commun. Image Represent. 2022;83:103424. doi: 10.1016/j.jvcir.2021.103424. [DOI] [Google Scholar]
- 21.Zhang X., Ye R. A novel RGB image encryption algorithm based on DNA sequences and chaos. Multimed. Tools Appl. 2021;80:8809–8833. doi: 10.1007/s11042-020-09465-6. [DOI] [Google Scholar]
- 22.Jithin K., Sankar S. Colour image encryption algorithm combining Arnold map, DNA sequence operation, and a Mandelbrot set. J. Inf. Secur. Appl. 2020;50:102428. doi: 10.1016/j.jisa.2019.102428. [DOI] [Google Scholar]
- 23.Liu Q., Liu L. Color Image Encryption Algorithm Based on DNA Coding and Double Chaos System. IEEE Access. 2020;8:83596–83610. doi: 10.1109/ACCESS.2020.2991420. [DOI] [Google Scholar]
- 24.Hua Z., Yi S., Zhou Y. Medical image encryption using high-speed scrambling and pixel adaptive diffusion. Signal Process. 2018;144:134–144. doi: 10.1016/j.sigpro.2017.10.004. [DOI] [Google Scholar]
- 25.Cui L., Chen C., Jin J., Yu F. Dynamic analysis and FPGA implementation of new chaotic neural network and optimization of traveling salesman problem. Complexity. 2021;2021 doi: 10.1155/2021/5521192. [DOI] [Google Scholar]
- 26.Gottwald G.A., Melbourne I. Testing for chaos in deterministic systems with noise. Phys. D Nonlinear Phenom. 2005;212:100–110. doi: 10.1016/j.physd.2005.09.011. [DOI] [Google Scholar]
- 27.Cui L., Lu M., Ou Q., Duan H., Luo W. Analysis and circuit implementation of fractional order multi-wing hidden attractors. Chaos Solitons Fractals. 2020;138:109894. doi: 10.1016/j.chaos.2020.109894. [DOI] [Google Scholar]
- 28.Sabeti M., Katebi S., Boostani R. Entropy and complexity measures for EEG signal classification of schizophrenic and control participants. Artif. Intell. Med. 2009;47:263–274. doi: 10.1016/j.artmed.2009.03.003. [DOI] [PubMed] [Google Scholar]
- 29.Tang Z., Song J., Zhang X., Sun R. Multiple-image encryption with bit-plane decomposition and chaotic maps. Opt. Lasers Eng. 2016;80:1–11. doi: 10.1016/j.optlaseng.2015.12.004. [DOI] [Google Scholar]
- 30.Yang Y., Wang L., Duan S., Luo L. Dynamical analysis and image encryption application of a novel memristive hyperchaotic system. Opt. Laser Technol. 2021;133:106553. doi: 10.1016/j.optlastec.2020.106553. [DOI] [Google Scholar]
- 31.Alvarez G., Li S. Some basic cryptographic requirements for chaos-based cryptosystems. Int. J. Bifurc. Chaos. 2006;16:2129–2151. doi: 10.1142/S0218127406015970. [DOI] [Google Scholar]
- 32.Chen Y., Xie S., Zhang J. A novel double image encryption algorithm based on coupled chaotic system. Phys. Scr. 2022;97:065207. doi: 10.1088/1402-4896/ac6d85. [DOI] [Google Scholar]
- 33.Sun Y.J., Zhang H., Wang X.Y., Wang M.X. Bit-level color image encryption algorithm based on coarse-grained logistic map and fractional chaos. Multimed. Tools Appl. 2021;80:12155–12173. doi: 10.1007/s11042-020-10373-y. [DOI] [Google Scholar]
- 34.Zhang Y.Q., He Y., Li P., Wang X.Y. A new color image encryption scheme based on 2DNLCML system and genetic operations. Opt. Lasers Eng. 2020;128:106040. doi: 10.1016/j.optlaseng.2020.106040. [DOI] [Google Scholar]
- 35.Chidambaram N., Raj P., Thenmozhi K., Amirtharajan R. Advanced framework for highly secure and cloud-based storage of colour images. IET Image Process. 2020;14:3143–3153. doi: 10.1049/iet-ipr.2018.5654. [DOI] [Google Scholar]
- 36.Zhou J., Zhou N.R., Gong L.H. Fast color image encryption scheme based on 3D orthogonal Latin squares and matching matrix. Opt. Laser Technol. 2020;131:106437. doi: 10.1016/j.optlastec.2020.106437. [DOI] [Google Scholar]
- 37.Li X., Zhou L., Tan F. An image encryption scheme based on finite-time cluster synchronization of two-layer complex dynamic networks. Soft Comput. 2022;26:511–525. doi: 10.1007/s00500-021-06500-y. [DOI] [Google Scholar]
- 38.Ravichandran D., Praveenkumar P., Rayappan J.B.B., Amirtharajan R. Chaos based crossover and mutation for securing DICOM image. Comput. Biol. Med. 2016;72:170–184. doi: 10.1016/j.compbiomed.2016.03.020. [DOI] [PubMed] [Google Scholar]
Associated Data
This section collects any data citations, data availability statements, or supplementary materials included in this article.
Data Availability Statement
Data sharing not applicable.


