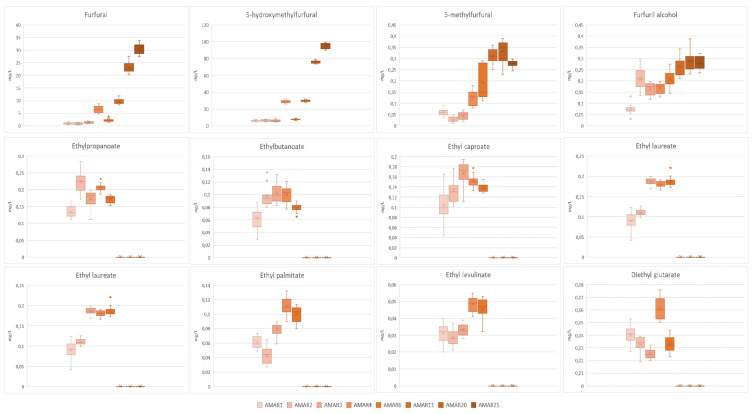
Figure 5.
Box and Whisker charts illustrating the levels of furanic compounds and ethyl esters of Amarena wines in relation to different bottle aging. In each graph, data were expressed as mean ± standard deviation of n = 15 samples coming from 5 bottles, where every sample was analyzed three times. The “×” indicates the average value in each wine group; whereas the outlier points display the outlier data that lie either below the lower whisker line or above the upper whisker line.

