

Abstract
Leaf water potential (ψ leaf), typically measured using the pressure chamber, is the most important metric of plant water status, providing high theoretical value and information content for multiple applications in quantifying critical physiological processes including drought responses. Pressure chamber measurements of ψ leaf (ψ leafPC) are most typical, yet, the practical complexity of the technique and of the underlying theory has led to ambiguous understanding of the conditions to optimize measurements. Consequently, specific techniques and precautions diversified across the global research community, raising questions of reliability and repeatability. Here, we surveyed specific methods of ψ leafPC from multiple laboratories, and synthesized experiments testing common assumptions and practices in ψ leafPC for diverse species: (i) the need for equilibration of previously transpiring leaves; (ii) leaf storage before measurement; (iii) the equilibration of ψ leaf for leaves on bagged branches of a range of dehydration; (iv) the equilibration of ψ leaf across the lamina for bagged leaves, and the accuracy of measuring leaves with artificially ‘elongated petioles’; (v) the need in ψ leaf measurements for bagging leaves and high humidity within the chamber; (vi) the need to avoid liquid water on leaf surfaces; (vii) the use of ‘pulse’ pressurization versus gradual pressurization; and (viii) variation among experimenters in ψ leafPC determination. Based on our findings we provide a best practice protocol to maximise accuracy, and provide recommendations for ongoing species‐specific tests of important assumptions in future studies.
Keywords: leaf water potential, plant water relations, plant water status, pressure bomb, pressure chamber, water stress
Summary statement
Key assumptions on pressure chamber leaf water potential (ψ leafPC) measurements were tested towards recommending best practices. Support to optimize the method was found, enabling concrete suggestions to maximize accuracy, and providing recommendations for species‐specific tests of additional assumptions in future studies.
1. INTRODUCTION
The use of the pressure chamber to study plant water relations and the hydraulics of water transport dates from the beginnings of experimental biology in the work of Stephen Hales (1727). Formerly known as the ‘pressure bomb’—still referred to this way colloquially—the glass version of the instrument was abandoned due to explosions (Dixon, 1914), and a steel chamber version was re‐invented by Scholander et al. (1965). Today's versions are the most common instruments used to measure leaf water potential (ψ leaf), with pressure‐release valves for safety, and digital pressure transducers for high precision. In the typical procedure, a leaf is excised from a plant and inserted in the instrument chamber lid with the cut surface of the petiole protruding out through a gasket. The lid is replaced, holding the leaf blade within the sealed chamber, and the chamber is pressurized until the petiole cut surface is wetted by the rising meniscus of xylem sap, indicating that the ‘balancing pressure’ applied has compensated for the negative pressure on the water column within the equilibrated leaf. The measurement assumes the Cohesion Tension theory for the ascent of sap (Angeles et al., 2004; Steudle, 2001), i.e., that the tension in the leaf xylem at the time that it is attached to the stem can be measured by pressurizing the equilibrated leaf and observing the balancing pressure. At that moment, assuming the xylem sap solute potential is negligible there is an equilibrium between the xylem tension, and the water potentials of the apoplast and the symplast, thus with bulk ψ leaf (Tyree & Zimmermann, 2002).
The pressure chamber has a range of critical applications, e.g., collection of xylem sap for determination of different components, or quantifying leaf water potential (ψ leafPC; Table S1). To ensure its reliability, ψ leafPC has been compared with other techniques. Stem hygrometers (Dixon & Tyree, 1984), leaf psychrometers (Boyer & Knipling, 1965; Kursar et al., 2009; Tyree et al., 2002, 2003), and the xylem pressure probe (Balling & Zimmermann, 1990; Melcher et al., 1998) enable estimates of stem xylem water potential (ψ stem) and ψ leaf. These techniques can be less destructive than pressure chamber measurements, not necessarily requiring leaf excision, but can be more intensive, time‐consuming, and less practical in the field due to their sensitivity to thermal gradients. Yet these approaches have corroborated the accuracy of ψ leafPC as have experiments based on transducers (Wei et al., 2000), centrifugation (Holbrook et al., 1995), air‐injecting branches (Sperry et al., 1996), and comparisons with stem diameter variation (Cochard et al., 2001).
Several seminal reviews and studies on ψ leafPC have been published, and the approach has thus been used to study a huge diversity of plant species. However, the published literature does not provide clarity on many specific practices related to preparing, storing, and manipulating samples (Table S2), and there exists no consensus or standard protocol. Current published studies typically provide little information about the specific ψ leafPC measurement methods, except in few cases in which modifications are pivotal for a specific purpose, e.g., measuring plant‐scale ψ (Knipfer et al., 2020), or to validate a methodology for a specific context, e.g., applying appropriate leaf storage conditions to maintain ψ leaf through time or determining the equilibration time for measuring ψ stem (Li et al., 2021; Wu et al., 2020). Coverage of ψ leafPC in trait measurement handbooks and online protocols (Boyer, 2011; Pérez‐Harguindeguy et al., 2013) offers important guidance for beginning users but still include scant details and recommendations on critical aspects, and even include some advice at odds with common assumptions, e.g., suggestions to measure leaves as soon as possible after sampling without equilibration (Pérez‐Harguindeguy et al., 2013). The current lack of standardized procedures reduces confidence in comparisons among the great variety of studies basing key conclusions on ψ leafPC.
Here, we surveyed specific methods of ψ leafPC from multiple laboratories, and synthesized experiments testing eight common assumptions and practices in ψ leafPC (Tables 1 and 2). We compiled tests from seven independent laboratories around the world on a wide range of species, aiming at the collaborative development of best practices recommendations to improve the reliability of ψ leafPC and to serve as updated guidelines for beginning and expert users.
Table 1.
Assumptions related to sampling conditions or sample manipulations before measurement (Assumptions 1–4) tested in the present study when measuring leaf water potential (ψ leaf) with the pressure chamber; user questions that we aim to answer with the tests; rationale or theory behind the conditions required for an accurate measurement; experiments synthesized as examples of attempts to identify practices that establish and maintain the required conditions; and findings derived from each experiment
| Assumption | User questions | Rationale/theoretical conditions for accurate measurement | Experiments as examples for identifying best practices | Findings |
|---|---|---|---|---|
| 1. Need for leaf equilibration before measurement: Bulk ψ leaf varies after excision from the plant until equilibration is reached, particularly if transpiring before excision. | “Do I need to equilibrate leaves after sampling before measuring?” | Measurements by different practitioners diverge in whether leaves are equilibrated after excision before measurement. Theoretical treatments specify the need for equilibration (Tyree & Zimmermann, 2002), but many practitioners believe that immediacy of measurement is preferable. According to theory, leaves should be equilibrated to achieve a stable value corresponding to the bulk ψ leaf, because when leaves are collected to be measured, even if transpiration is stopped by storage in darkness, high humidity, and constant temperature, ψ leaf may shift over time until equilibrium is achieved (Buckley et al., 2015, 2017). This time may depend on the leaf transpiration rate before excision. | 1a. Testing storage of leaves with different transpiration rate. O. europaea leaves collected at different times during the day (predawn, mid‐morning, and midday) and carefully stored under non‐transpiring conditions for 30 min. | 1a. The ψ of O. europaea leaves, collected at midday (12:00 GMT), were 0.31 ± 0.10 MPa lower after 30 min of equilibration than the values measured immediately after excision (p < 0.01; Figure 1a; see Table S4 for all statistical results). The decline in ψ leaf during equilibration increased with the hydration status of leaves at excision. Only leaves that were already relatively dehydrated at excision (ψ leaf below ca. −1.4 MPa), showed little further decline during equilibration. The effect of equilibration was not significant for olive leaves sampled either at predawn (04:00 GMT) or in the early morning (08:00 GMT). These leaves were probably already equilibrated. |
| 1b. Testing transpiring leaves stored under different conditions. Transpiring E. camaldulensis leaves stored in bags with moist paper towel (“moist” condition) or in bags with only air exhaled by a researcher (“exhalation” condition) for 10 min and 1 h. | 1b. The ψ of E. camaldulensis leaves collected at midday and immediately measured did not differ from the values after equilibration for 10 min and 1 h (Figure 1b). Exhalation treatment may allow further dehydration. | |||
| 2. Leaves measured for ψ leaf may be stored before measurement : Equilibrated leaves retain a stable ψ leaf for long time provided the right storage protocol is used. | “Can I store leaves in bags before measuring? For how long?” | Some have hypothesised that the ψ of leaves may increase when sealed in air‐tight bags with moist paper towel, given the observation of slow water uptake by leaves kept in fog chambers (Guzmán‐Delgado et al., 2018) or in contact with water (Fernández et al., 2017). Conversely, ψ leaf may decline when leaves are bagged without moist paper towel due to dehydration. Others hypothesized that ψ leaf is maintained by bagging leaves with moist paper towel if one avoids temperature fluctuations inducing dehydration or decomposition of leaf cells. | 2a. Testing retention of ψ leaf for up to 1.5 days. O. europaea leaves collected at different times during the day and equilibrated for 30 min were compared to leaves stored for 4 h and 1.5 days. | 2a. ψ leaf did not change during storage for equilibrated leaves (t 0+30 min) of O. europaea for up to 1.5 days (Figure 2b). |
| 2b. The ψ of E. camaldulensis leaves stored under “exhalation” conditions declined by 0.71 ± 0.14 MPa (p < 0.001) after 1 day from the control values (t 0+1h), whereas ψ remained constant for leaves under the “moist” condition (Figure 2c). | ||||
| 2b. Testing retention ofψleaf for up to 1 day under different storage conditions. E. camaldulensis leaves equilibrated for 1 h under “moist” and “exhalation” conditions were compared to leaves stored for 4 h and 1 day. | 2c. Gymnosperms (t 0+6h for up to 1 day), ferns, and the lycophyte species (t 0+1day for up to 4 days) did not change their ψ leaf compared to their initial values (Figure 2d). | |||
| 2c. Testing retention of ψleaf for up to 1–4 days in more plant groups. Partially dehydrated leaves from gymnosperm, fern and lycophyte species were measured after being stored under non‐transpiring conditions for determined times (from 6 h to 4 days). | 2d. After 14 days, ψ leaf of E. erythrocorys and H. arbutifolia declined by 0.11 ± 0.09 MPa (p = 0.04) for E. erythrocorys, in the fridge but not on the bench, and by 0.19 ± 0.05 MPa (p = 0.03) and 0.28 ± 0.09 MPa (p < 0.001) for H. arbutifolia on the bench and in the fridge, respectively. For M. grandiflora, however, ψ leaf started to decline after 1 day on the bench, and after 3 days in the fridge, by 0.26 ± 0.03 MPa (p < 0.01) and 0.28 ± 0.09 MPa (p < 0.001), respectively, and continued decreasing in both conditions, observing a stronger decrease in leaves with higher ψ leaf on the “bench” condition (Figure 2e). | |||
| 2d. Testing retention ofψleaf for up to 14 days under different storage conditions. Leaves from three angiosperm species were measured after long time (from 1 day to 14 days) stored under “bench” and “fridge” conditions. | ||||
| 3. Homogeneous equilibration among leaves and with their bearing stems: Leaves from a single plant or shoot all equilibrate to the same ψ leaf under non‐transpiring conditions. | “Do leaves sampled from a bench‐drying branch or seedling all have the same ψ?” | According to theory, during equilibration under non‐transpiring conditions for 1–2 h ψ leaf equilibrates across the leaves to the ψ of the shoot to which they are connected. Likewise, there should be equilibration across shoots within a branch and across an entire plant. | 3a. Example related to constructing hydraulic vulnerability curves using branches. P. cembra branches were bench dried, maintained under non‐transpiring conditions at increasing dehydration levels and ψ leaf was measured in twigs, short twigs and needles to check whether all agreed. | 3a. In tests of equilibrated branches of P. cembra, we found a small but significant trend, with needles lower than twigs by 0.01 ± 0.02 MPa (p < 0.05). Although apparently differing more the Δψ (MPa) for both needle and short twig ψ as control ψ decreased, Δψ (%) indicated that the highest variations occurred at control ψ levels >−0.5 MPa (Figure 3a). |
| 3b. Example related to constructing optical/hydraulic vulnerability curves from seedlings using stem psychrometers. ψ stem of L. ovalifolium and P. lusitanica seedlings measured during dehydration under laboratory conditions were compared to un‐bagged and bagged leaves (at least 1 h), i.e., minimally and non‐transpiring leaves, respectively. | 3b. No significant differences were found between ψ stem and ψ leaf in either minimally transpiring (un‐bagged) leaves or leaves in which transpiration was further reduced by bagging (upper panels of Figure 3b). However, in P. lusitanica, the relationship between ψ stem and ψ leaf of previously bagged leaves had a significantly lower slope than the 1:1 line (p < 0.001; lower panels of Figure 3b). | |||
| 4. Homogeneous equilibration within the leaf: ψ leaf equilibrates fully across the leaf, such that subsamples can be used. | “Can I cut back the leaf lamina to elongate the petiole before measurement?” | According to theory, during equilibration, ψ leaf will equalise throughout the leaf lamina. Using subsections of equilibrated leaves has been reported to reliably estimate ψ leaf (Richter, 1997; Figure 2.7 in Boyer, 1995). | 4. Testing the elongation of the leaf petiole. Either sides of the leaf midrib of five species was removed for elongating the petiole and their ψ leaf compared to intact leaves. | 4. Cutting the leaf lamina to elongate the petiole had no significant effect on ψ leaf in four of five species (E. camaldulensis, E. erythrocorys, H. arbutifolia, and Z. diploperennis), whereas M. grandiflora declined in ψ leaf by 0.10 ± 0.03 MPa (p < 0.001) (Figure 4). |
Abbreviation: GMT, Greenwich Mean Time.
Table 2.
Assumptions related to the measurement technique (Assumptions 5–8) tested in the present study when measuring leaf water potential (ψ leaf) with the pressure chamber; user questions that we aim to answer with the tests; rationale or theory behind the conditions required for an accurate measurement; experiments synthesized as examples of attempts to identify practices that establish and maintain the required conditions; and findings derived from each experiment
| Assumption | User questions | Rationale/theoretical conditions for accurate measurement | Experiments as examples for identifying best practices | Findings |
|---|---|---|---|---|
| 5. Accurate measurements require high humidity and bagged leaf in the chamber: ψ leaf may rapidly change when leaves are exposed to air, particularly inside the pressure chamber. | “Do I need to bag the leaf and put wet paper towel in the chamber during measurement?” | Given the initial steepness of pressure‐volume curves (Bartlett et al., 2012), water loss from an exposed excised leaf might cause a dramatic decline in ψ leaf. Thus, it may be necessary to enclose leaves in bags and provide humidity conditions from sampling through measurement. | 5. Testing leaves measured with and without humidity inside the chamber. Leaves of five species were measured under these two conditions to test the effect of applying dry air (compressed air or nitrogen) to bare leaves inside the chamber. | 5. In three of five species, ψ of leaves fully exposed to the dry chamber was significantly lower than leaves that were enclosed in bags and measured in a humidified chamber (Figure 5). ψ of E. erythrocorys, H. arbutifolia, and M. grandiflora leaves was 0.06 ± 0.03 MPa (p < 0.05), 0.25 ± 0.05 MPa (p < 0.001), and 0.08 ± 0.02 MPa (p < 0.001) lower than control leaves, respectively. For these species, the highest decrease of Δψ (%) occurred at control ψ leaf >−0.5 MPa, with H. arbutifolia decreasing 120%. |
| 6. Gas enters the leaf: ψ leaf measurement involves the pressurization of air in the intercellular spaces, rather than squeezing of the epidermis from the outside. | “Can the leaf surface be wet during measurement?” | According to published hypotheses, ψ leaf measurement of the equilibrated leaf may involve (a) pressurization of air inside the leaf due to equilibration across the stomata with chamber air, driving water in the apoplast (and then symplast) out of the petiole (Dixon, 1914; Scholander et al., 1965; Turner, 1988); or (b) pressurization of the exterior of the leaf, squeezing the water out of cells (Roderick & Canny, 2005). Which scenario applies has important implications: if air enters the leaf, then liquid water on the leaf surface would also be expected to enter the leaf and cause rehydration and a biased measurement | 6. Testing leaves measured in direct contact with water. Leaves of three species were measured under this condition to test the effect of liquid water in direct contact with the leaves on ψ leaf, and hence, inferring the effect of air on the measured leaves. | 6. The ψ of E. erythrocorys, H. arbutifolia, and M. grandiflora leaves increased by 0.61 ± 0.20 MPa, 0.54 ± 0.12 MPa, and 0.30 ± 0.12 MPa (all p < 0.001), respectively, when in contact with water during measurements (Figure 6). Moreover, in E. erythrocorys and H. arbutifolia, the magnitude of the rise in ψ leaf significantly increased with lower control ψ leaf. |
| 7. Gradual versus step pressurization: Accurate ψ leaf measurement depends on equilibrating the leaf at increasing given pressures until the balance pressure. | “Is it inaccurate to slowly build pressure in the chamber rather than deliver small discrete pulses?” | The pressure chamber is thought to deliver the bulk leaf balance pressure once equilibrium is established at the magnitude of the bulk leaf water potential. Even when the chamber is pressurized to this point, this equilibration can take up to several seconds given the leaf capacitance and hydraulic resistance. Therefore, pulsing or slow pressurization is needed to avoid overestimation (Naor & Peres, 2001), but pulsing or slow pressurization comes at the cost of rapid measurement. | 7. Comparing two pressurization methodologies. Leaves of three species measured (i) by applying a continuous rate of pressurization and (ii) applying pulses of flow and waiting between pulses were compared. | 7. In two of three species, approaching balance pressure by continuously increasing the pressure at a medium‐low rate led to a small but significant underestimation of ψ leaf compared to “pulsing” (0.02 ± 0.02 MPa and 0.05 ± 0.03 MPa (both p < 0.05) lower than leaves measured by ‘pulsing’ for E. erythrocorys and H. arbutifolia, respectively. Δψ (%) showed that gradual pressurization led to stronger underestimation of ψ leaf for well hydrated leaves (−40% at control ψ leaf >−1 MPa for both species) (Figure 7). |
| 8. Objectivity: Consistency of ψ leaf measurements across investigators. | “Can I trust and combine measurements made by different trained users?” | Given the many technical details that may be varied during measurement, it is not clear whether propagation of error would render the measurement highly variable among experimenters. For instance, although identifying the correct endpoint, i.e., when the xylem sap just returns to the cut surface of the petiole (Turner, 1988) seems an easy task, different approaches may result in different ψ leaf values for the same sample. Indeed, a seminal work suggested that accuracy in estimating the endpoint can be increased especially in species containing high amounts of resin (e.g., conifers), through measuring conductivity between thin electrodes inserted into the cut surface (Richter & Rottenburg, 1971). | 8. Testing the subjective nature of ψ leaf measurements with the pressure chamber. As an example of testing the effect of the observer on the ψ leaf value, leaves measured by non‐experienced and experienced researchers from an equilibrated branch of C. betulus were compared. | 8. Variation in ψ leaf measurements from a given equilibrated branch of C. betulus was higher among investigators, in terms of coefficient of variation (CV), in newly trained non‐experienced researchers relative to more experienced researchers. However, no significant differences were found in the mean among all investigators (p = 0.084) (Figure 8). |
2. MATERIALS AND METHODS
We structured this study by, first, identifying the conditions required in theory for an accurate measurement, which rely on eight key assumptions—those related to sampling conditions or sample manipulations before measurement, and those related to measurement technique. Second, based on the discovery that multiple research groups had been conducting tests of given assumptions, we compiled strategies for establishing the required conditions and specific tests to achieve them (all experiments for each assumption are summarized in Tables 1 and 2). This study represents tests of different assumptions by multiple groups on different species, with conclusions that diverge in some cases. Our primary aim was to identify practices that would optimise the method in practical use, and provide a common practice protocol and guidance for testing given assumptions on specific species when needed.
The experiments were conducted on 25 species overall, diverse in geographical location, phylogeny, leaf morphology and ecological specialization. Experiments were performed independently by seven research teams situated in USA, such as Los Angeles (team UCLA), and West Lafayette (team PURDUE); in Australia, such as Sydney (team SYDNEY), and Hobart (team UTAS); and in Europe, such as Innsbruck (Austria, team INNSBRUCK), Seville (Spain, team IRNAS), and Clermont‐Ferrand (France, team PIAF‐INRAE). Details and descriptions of specific methods applied by each team are presented in Table S3.
2.1. Methodology applied for each experiment to test assumptions towards best practices
2.1.1. Assumptions related to sampling conditions or sample manipulations before measurement
2.1.1.1. ASSUMPTION 1. Need for leaf equilibration before measurement
According to this assumption, after excision of a leaf from the plant (and especially a transpiring leaf), bulk ψ leaf may change until equilibration throughout the leaf is reached, and thus, leaves should be equilibrated before measurement.
The IRNAS team tested whether leaf transpiration rate before leaf excision would affect the equilibration of bulk ψ leaf in Olea europaea leaves. Six current‐year shoots from a single tree were selected and four mature leaves from two consecutive internodes per shoot (all with similar light exposure) were excised with a razor blade at 4:00 Greenwich Mean Time (GMT) (predawn), 8:00 GMT (mid‐morning) and 12:00 GMT (midday) (GMT). Each individual leaf was excised and rapidly enclosed in a small, unsealed plastic bag wrapped in soaked paper towel within a larger, sealed zip‐lock plastic bag, previously exhaled into. This prevented direct contact of the leaf with liquid water while also creating a humid environment. Bags were stored in a portable icebox with ice packs not touching the bagged leaves. One leaf per shoot was measured within 2–3 min after excision, which was the time needed to reach the pressure chamber and perform the measurement and treated as the control (t 0), and a second leaf was measured at t 0 + 30 min. The remaining two leaves were used to test Assumption 2.
The SYDNEY team tested the equilibration of transpiring Eucalyptus camaldulensis leaves under two different conditions. At mid‐day, five transpiring leaves were collected close together from a single shoot from each of six individual saplings, such that leaves on each shoot were similar in ψ leaf (leaf pairs measured on shoots of three other plants varied by less than 0.08 MPa). Leaves were enclosed in a plastic bag after excision and stored in an icebox with ice packs not touching the bagged leaves to avoid abrupt changes in leaf temperature that might result in condensation. In the first storage condition, bags in which the leaves were enclosed contained a moistened paper towel (‘moist’ condition); in the second condition, no paper towel was used but a researcher exhaled into the bag before quickly sealing it (‘exhalation’ condition). ψ leaf was measured for one leaf from each plant 1 min after excision as the control (t 0), and for leaves at t 0 + 10 min and t 0 + 1 h; the remaining two leaves per plant were used to test Assumption 2.
2.1.1.2. ASSUMPTION 2. Leaves measured for ψleaf may be stored before measurement
According to this assumption, when leaves have reached equilibrium, ψ leaf will be maintained for several days provided the right storage protocol is used.
The IRNAS team tested the effect of storage of equilibrated leaves for the two remaining leaves from each of the six O. europaea shoots described for Assumption 1 collected at different times of the day, i.e., at different transpiration rates, and stored as explained above. Equilibrated leaves measured at t 0 + 30 min were treated as the control, and compared with leaves measured at t 0 + 4 h, and t 0 + 1.5 day.
The SYDNEY team tested the two remaining leaves from each of the six E. camaldulensis saplings described for Assumption 1 under two different storage conditions (‘moist’ and ‘exhalation’ conditions). Equilibrated leaves measured at t 0 + 1 h were treated as the control, and compared with leaves measured at t 0 + 4 h, and t 0 + 1 day.
The UTAS team also tested the effects of partially dehydrated leaves of gymnosperm, fern and lycophyte species. Three to five plants or branches transpired until ψ leaf approximated that corresponding to stomatal closure, determined previously in independent studies, and then were placed under non‐transpiring conditions. One leaf per plant or branch was sampled and measured as the control (t 0). Then, samples were double bagged with a moist paper towel within a second bag and stored under laboratory conditions. For gymnosperms, samples were remeasured, following appropriate precautions, i.e., limiting water loss through the cut surface by avoiding driving ‘gushing’ of water due to overpressurization, and releasing the pressure very slowly (Wenkert et al., 1978) at t 0 + 6 h, 12 h and 1 day, and for the lycophyte and the ferns at t 0 + 1 day to t 0 + 4 days. The different times were based on how long water was expected to reequilibrate, if necessary, between internal storage compartments for each plant group, i.e., we expected that gymnosperms would redistribute water faster than ferns and lycophytes (McAdam & Brodribb, 2013; Pittermann et al., 2011).
The UCLA team tested two different storage conditions for a range of storage times. Partially dehydrated Eucalyptus erythrocorys, Heteromeles arbutifolia, and Magnolia grandiflora leaves from each of 12 equilibrated branches were stored either in a refrigerator (4°C, darkness) or on the laboratory bench (day/night temperatures 20/15°C, <6 μmol photons m−2·s−1). Differences between leaves along an equilibrated branch were less than 0.1 MPa. Two leaves from each branch per species were measured for each treatment. Equilibrated leaves measured at day 0 were treated as the control (t 0), and compared with leaves measured at t 0 + 1, 3, 7, and 14 days.
2.1.1.3. ASSUMPTION 3. Homogeneous equilibration among leaves and with their bearing stems
According to this assumption, covered and non‐transpiring leaves or shoots will equilibrate their ψ leaf with the branch or plant to which they are connected. This assumption is typically made when constructing hydraulic vulnerability curves, as branches are progressively bench dried and leaves or shoots are sampled for measurement of ψ leafPC, and stem or leaf hydraulic conductance is also measured, assuming equilibrium is maintained.
The INNSBRUCK team tested this assumption in 20 Pinus cembra branches. After laboratory processing (Table S3), subsamples (twigs, short twigs, or needles) were measured over a range of ψ of 0 to −3 MPa. ψ of three end twigs (length ca. 10 cm, with numerous short twigs) per branch, were considered the control samples, and compared with those of three short twigs (including 5 needles), and three single needles per branch. Measurements on single needles were made only to ca. −2 MPa, below which sealing into the lid of the pressure chamber was difficult and gas leaking complicated the determination of the endpoint.
The PIAF‐INRAE team tested whether leaves measured for ψ leaf on dehydrating seedlings were equilibrated with the stem in which ψ stem was monitored using a stem psychrometer. This assumption is particularly important in the measurement of optical vulnerability curves (Brodribb et al., 2016). Measurements were made for three seedlings of Ligustrum ovalifolium and Prunus lusitanica dehydrating under laboratory conditions. ψ stem was measured with a stem psychrometer (PSY1, ICT International, Armidale, NSW, Australia) installed centrally on the main stem of each seedling before dehydration after removing a small section of bark, with the interface between the sensor and stem sealed airtight with silicon (High vacuum silicone grease; Dow Corning). The Peltier cooling time was adjusted from 10 s (when the plant was well hydrated) to a maximum of 20 s (as the plant dehydrated) to ensure sufficient water was condensed onto the thermocouple and then evaporated to produce a stable reading of the wet‐bulb depression temperature. Leaves were either bagged for at least 1 h (i.e., non‐transpiring conditions) or left unbagged (i.e., minimally transpiring), and their ψ leaf compared with ψ stem. Three to 13 replicate sets of un‐bagged ψ leaf, bagged ψ leaf, and ψ stem measurements were obtained from each seedling during dehydration. The values of turgor loss point (TLP) obtained using pressure‐volume curves (Sack & Pasquet‐Kok, 2011), and ψ leaf at 50% loss of leaf xylem function (P50) measured with the optical method (Brodribb et al., 2016), are also presented for interpretation of results.
2.1.1.4. ASSUMPTION 4. Homogeneous equilibration within the leaf
According to this assumption, when transpiration of an excised leaf is halted, ψ leaf equilibrates fully across the leaf, making its measurement accurate even when removing sections of the leaf lamina and ‘elongating’ its petiole, a needed practice for short‐petiole species.
UCLA, SYDNEY, and PURDUE teams tested this assumption in different species and using different methodologies. Modifications for elongating the petiole consisted of removing half (UCLA), 8 mm (SYDNEY) or 30% (PURDUE) of the leaf lamina with a sharp razor blade on either side of the midrib. UCLA team measured two leaves (one intact or control, and the other modified) from each of 12 equilibrated branches of E. erythrocorys, H. arbutifolia, and M. grandiflora. SYDNEY team measured two adjacent leaves (one intact or control, and the other modified) from an equilibrated shoot (verified in three untreated leaves that differed less than 0.02 MPa) from each of eight E. camaldulensis saplings. PURDUE team measured ψ leaf using a psychrometer (PSY1, ICT International, Australia), previously installed on a leaf of Zea diploperennis plants (repeated on one leaf per plant on 15 plants), before the terminal portion of that leaf, up to the psychrometer, was excised, equilibrated in a bag with damp paper towel for 10–15 min, then modified to form a petiole‐like structure and immediately measured for ψ leaf.
2.2. Assumptions related to the measurement technique
2.2.1. ASSUMPTION 5. Accurate measurements require high humidity and bagged leaf in the chamber
According to this assumption, leaves will dehydrate when exposed to air inside the pressure chamber unless special measures are taken to humidify the environment around the leaf.
The UCLA and SYDNEY teams tested this assumption. For E. erythrocorys, H. arbutifolia, and M. grandiflora (UCLA), two leaves from each of 12 equilibrated branches were compared, with control leaves measured enclosed in a plastic bag with moist paper towel inside the pressure chamber, and treated leaves measured uncovered and without humidity. For Eucalyptus obliqua and Casuarina cunninghamiana (SYDNEY), leaves from equilibrated branches of different levels of ψ leaf (down to −7 and −4 MPa, respectively) were measured, first, enclosed within a bag and with humidity, and then, after releasing very slowly the pressure (Wenkert et al., 1978), un‐bagged and without humidity within the chamber.
2.2.2. ASSUMPTION 6. Gas enters the leaf
This assumption tests whether leaves with liquid water on their surfaces may lead to higher ψ leaf values. The assumption is that the measurement of leaves with the pressure chamber involves the pressurization of the airspace inside the leaves through the leaky stomata and/or the leaf lamina.
The UCLA team tested this assumption. For E. erythrocorys, H. arbutifolia, and M. grandiflora, two leaves from each of 12 equilibrated branches were compared, with control leaves measured enclosed in a plastic bag with moist paper towel inside the pressure chamber and treated leaves measured while their leaf lamina were immersed in a water‐filled plastic bag placed into the chamber.
2.2.3. ASSUMPTION 7. Gradual versus step pressurization
According to this assumption, step pressurization of the chamber until the balance pressure is achieved should lead to more accurate ψ leaf determination.
The UCLA team tested this assumption. For E. erythrocorys, H. arbutifolia, and M. grandiflora, two leaves from each of 12 equilibrated branches were compared, with control leaves measured by applying short pulses of flow (3–5 s) at 0.02 MPa s−1 and waiting also 3–5 s between pulses and treated leaves measured by increasing the pressure with a continuous flow rate (0.02 MPa s−1) until reaching the balance pressure.
2.2.4. ASSUMPTION 8. Objectivity
According to this assumption, the multiple steps in measurement and variation in the determination of balance pressure by different researchers can be overcome by training, rendering the measurement objective despite possible sources of error.
The INNSBRUCK team tested this assumption. Five non‐experienced researchers previously trained for 3 h and three experienced researchers performed the measurement procedure independently. Researchers were instructed to slowly increase the pressure (by about 0.02 MPa s−1) and progressively slow down the pressurization rate when the cut surface started to darken, as the first sign of the rising water in the xylem. Researchers did not know either the ψ leaf of the branch or values obtained by colleagues and were not instructed during measurements, or given any additional guidance related to adjustment of pressurization, interpretation of optical changes under the binocular, or other details. Each researcher randomly selected three leaves (from an equilibrated Carpinus betulus branch, Table S3) that had been previously enclosed in small plastic bags, excised them from the branch, sealed them in the pressure chamber and proceeded with measurements.
2.3. Data and statistical analyses
For each Assumption tested (except for Assumption 8), we subtracted the ψ leaf of tested leaves from that of control leaves to calculate the Δψ leaf. For each tested leaf there was a coupled control leaf for comparison. Thus, positive values (Δψ leaf > 0) signified that tested leaves had higher or less negative values than control leaves, whereas negative values (Δψ leaf < 0) signified that tested leaves had lower or more negative values than control leaves. For the results discussed in terms of percentage (%) difference of tested leaves relative to control leaves, these were calculated as (Δψ leaf/‐ψ leaf of control leaves) × 100. We fitted linear regressions to the relationships between Δψ leaf and control ψ leaf using SigmaPlot (version 12.0, Systat Software, Inc.). We plotted in figures only the regressions with p < 0.05 and when statistical analyses showed significant differences overall between tested and control leaves (see below); when overall significant differences were found but regressions were not significant, a horizontal line at the average of Δψ leaf was plotted instead. We report the mean effect sizes for Δψ leaf (MPa) ± standard errors.
We used linear mixed models with Tukey's post hoc comparisons to test the differences between test and control leaves overall for each Assumption at p < 0.05. We used the “lme()” function from the “nlme” package (Pinheiro et al., 2017) and the “glht()” function from the “multcomp” package (Hothorn et al., 2008) for post hoc multiple pair comparisons. We used random factor structure to account for experimental design (e.g., leaf identity within branch); when random factors were not necessary, the function “gls()” was used instead. The ψ leaf data were transformed when needed (logarithmic or potential transformation of the variable) to reduce heterogeneous variance in the residuals. For tests of Assumption 3, we were not able to obtain normal residuals; non‐parametric analyses were used instead (Kruskal–Wallis test). We tested the variability of ψ leaf measured by different investigators overall (Assumption 8) by comparing their coefficients of variation (CVs) applying the Modified signed‐likelihood ratio test (“mslr_test”) for equality of CVs, to measurement data and applying “set.seed()” for reproducible results (Krishnamoorthy & Lee, 2014, R package “cvequality”; Marwick & Krishnamoorthy, 2019). For Assumption 3, we analyzed whether the slopes of the regression lines for psychrometer‐derived ψ stem versus previously bagged and equilibrated ‐leaves measured with pressure chamber for L. ovalifolium and P. lusitanica were significantly different from the 1:1 line, by including an interaction term “bagged leaves × regression line type” in the model described above. R software was used for all the analyses (R version 3.6.0, 2019‐04‐26, last accessed 2020‐03‐06) except for the Kruskal–Wallis test and Dunn's post hoc multiple comparisons, for which SigmaPlot was used (version 12.0, Systat Software, Inc.).
3. RESULTS
The tests of each assumption are presented into one figure per assumption, with all experiments and findings summarized in Tables 1 and 2.
3.1. Test of Assumption 1. Generally, transpiring leaves need equilibration under non‐transpiring conditions for precise bulk ψleaf measurements
Leaves of O. europaea sampled when transpiring at substantial rates (at mid‐morning and midday) showed strong variability relative to their values after equilibrating for 30 min, and relative to their initial values, tending to be more variable when measured immediately (Figure 1a). Leaves that were sampled when transpiring at stronger rates, i.e., at midday, showed a stronger and significant decrease during equilibration. Leaves sampled at predawn, when transpiration would be minimal, did not shift in ψ leaf between sampling and equilibration.
Figure 1.

Assumption 1, i.e., need for leaf equilibration before measurement. Controls represent leaf water potential (ψ leaf) measured at t 0, i.e., measured soon after leaf excision, and Δψ leaf is the difference in ψ leaf between control and tested leaves (with a positive value indicating a less negative value for treatment than control) measured after different equilibration times (denoted as t 0 + time). Each point represents a pair of matched leaves, i.e., the difference in ψ leaf between tested and control leaves. (a) Leaves collected from an O. europaea tree under field conditions at three different times of the day and equilibrated under non‐transpiring conditions. (b) Transpiring leaves collected at midday from saplings of E. camaldulensis under field conditions and equilibrated under two different conditions [Color figure can be viewed at wileyonlinelibrary.com]
For leaves of E. camaldulensis sampled at mid‐day, 10 min of equilibration under ‘moist’ conditions (i.e., leaves stored in bags with wet paper towel inside) was sufficient, as no further shift in values was found relative to leaves equilibrated for 1 h. Notably, leaves equilibrated in ‘exhalation’ conditions (i.e., leaves stored in bags in which a researcher exhaled into) showed signs of dehydration (tending to be lower in ψ leaf) during equilibration relative to leaves measured immediately (Figure 1b).
3.2. Test of Assumption 2. Storage of leaves for days typically does not affect ψleaf provided adequate storage protocols
For leaves of O. europaea sampled at different times of day, ψ leaf remained stable during storage for 4 h, and overall for 1.5 days, though some samples had begun to diverge (Figure 2a).
Figure 2.

Assumption 2, i.e., leaves measured for leaf water potential (ψ leaf) may be stored before measurement. Controls represent ψ leaf from equilibrated leaves and Δψ leaf is the difference in ψ leaf between control and tested leaves (with a positive value indicating a less negative value for treatment than control) measured after different storage times (denoted as t 0 + time). Each point represents a pair of matched leaves, i.e., the difference in ψ leaf between tested and control leaves. Different species or plant types (when appearing on the same plot) are depicted with different symbol types. Regression lines are plotted when statistical analyses showed significant differences between tested and control leaves and regressions were p < 0.05, and horizontal lines are plotted when significant differences were found but regressions were not significant. (a) Leaves equilibrated for 30 min after being collected from an O. europaea tree under field conditions at three different times of the day and compared to leaves stored for 4 h and 1.5 days. (b) Transpiring leaves equilibrated for 1 h under two different conditions after being collected at midday from saplings of E. camaldulensis under field conditions and compared to leaves stored for 4 h and 1 day. (c) Leaves from two gymnosperm species (P. abies ◯, M. glyptostroboides △), five fern species (A. bulbiferum ◯, H. incisa △, H. rugulosa ▽, P. proliferum ◇, P. cretica □) and a lycophyte species (S. kraussiana ☆) partially dehydrated and compared to leaves stored for up to 1‐4 days. (d) Leaves collected from equilibrated branches of H. arbutifolia, E. erythrocorys and M. grandiflora and compared to leaves stored under two different conditions for up to 14 days [Color figure can be viewed at wileyonlinelibrary.com]
For E. camaldulensis leaves stored under ‘moist’ conditions, ψ leaf remained stable for 4 h and 1 day. Notably, leaves stored under the ‘exhalation’ condition declined in ψ leaf after 1 day of storage (Figure 2b).
For leaves sampled from stored dehydrated plants or branches, ψ leaf remained stable when tested after 6 h, 12 h, and 1 day for gymnosperms, and when tested for 1, 2, 3 and 4 days for ferns and a lycophyte (Figure 2c).
For two of three other species tested, storage under non‐transpiring conditions (‘bench’ and ‘fridge’) was feasible for 1 day, 3 days and 7 days, and declines in ψ leaf were observed when leaves were stored for 14 days (Figure 2d). M. grandiflora leaves showed declines in ψ leaf during storage for 1 day and longer on the bench, and 3 days and longer in the refrigerator, suggesting that for this species, storage for more than one day in the refrigerator would lead to loss of precision in ψ leaf measurement (Figure 2d).
3.3. Test of Assumption 3. Leaves approximately equilibrate in ψ within non‐transpiring single branches and seedlings
In branches of P. cembra, equilibrated at ψ leaf <−0.5 MPa, values were virtually the same across twigs, short twigs and needles, despite variation reaching ±100% when ψ leaf approached values very close to zero (Figure 3a). In branches equilibrated to lower water potentials, variation among different sampled organs was ±20% between twigs and short twigs or needles (Figure 3a).
Figure 3.

Assumption 3, i.e., homogeneous equilibration among leaves and with their bearing stems. (a) Branches of P. cembra collected in the field, dehydrated on the bench, and equilibrated for 1.5 h at different levels of ψ before measuring twigs, short twigs, and needles. Control samples were twigs and tested samples were short twigs or needles. Differences between control and tested samples (Δψ) over control ψ is presented in terms of absolute values (left panel) and % of difference respect to control ψ (right panel). Each point represents a pair of matched leaves, i.e., the difference in ψ leaf between tested and control leaves. (b) L. ovalifolium and P. lusitanica seedlings dehydrated on the bench under laboratory conditions. Stem water potential (ψ stem) was measured with a stem psychrometer, and ψ leaf was measured on control leaves, previously bagged (i.e., equilibrated with ψ stem) and on un‐bagged leaves with a pressure chamber. Upper panels show differences (Δψ leaf) between control and un‐bagged leaves or ψ stem over control ψ leaf. Lower panels show the relationships between ψ stem and equilibrated, bagged ψ leaf. Each point represents one replicate. The solid black line is the 1:1 line, and regression line (dashed black line) is presented for P. lusitanica because it was significantly different from the 1:1 line (p < 0.001). Vertical grey dashed lines represent turgor loss point (TLP), and vertical grey solid lines the ψ leaf at 50% loss of leaf xylem function (P50) [Color figure can be viewed at wileyonlinelibrary.com]
In dehydrated seedlings of L. ovalifolium and P. lusitanica, leaves equilibrated to similar ψ leaf, and similar to ψ stem. However, in strongly dehydrated branches of P. lusitanica, i.e., below TLP, and 50% loss of leaf xylem function, individual ψ stem values were higher than ψ leaf values for both bagged and un‐bagged leaves (Figure 3b).
3.4. Test of Assumption 4. For most species tested, homogeneous equilibration within the leaf enables lamina to be excised without altering ψleaf measurement
For four of five species tested, partial excision of lamina to artificially create ‘elongated petioles’ caused variation in ψ leaf, but no differences on average from an intact leaf. For M. grandiflora, partial excision of lamina led to ψ leaf values lower on average by 0.10 ± 0.03 MPa (p < 0.001) (Figure 4).
Figure 4.

Assumption 4, i.e., homogeneous equilibration within the leaf, tested on E. erythrocorys ( ), H. arbutifolia (
 ), M. grandiflora (
 ), E. camaldulensis (
 ), and Z. diploperennis (
 ). Controls represent ψ
leaf measured with no modifications on the leaves, and Δψ
leaf is the difference in ψ
leaf between leaves with elongated petioles and control leaves (with a positive value indicating a less negative value for treatment than control). The horizontal line indicates that a significant difference was found between tested and control leaves but the regression was not significant. Each point represents a pair of matched leaves, i.e., the difference in ψ
leaf between tested and control leaves [Color figure can be viewed at wileyonlinelibrary.com]
). Controls represent ψ
leaf measured with no modifications on the leaves, and Δψ
leaf is the difference in ψ
leaf between leaves with elongated petioles and control leaves (with a positive value indicating a less negative value for treatment than control). The horizontal line indicates that a significant difference was found between tested and control leaves but the regression was not significant. Each point represents a pair of matched leaves, i.e., the difference in ψ
leaf between tested and control leaves [Color figure can be viewed at wileyonlinelibrary.com]
3.5. Test of Assumption 5. Accurate measurements require bagging leaves and maintaining high humidity in the pressure chamber
In three of five species, measured ψ leaf was significantly lower when leaves were measured un‐bagged and without humidity inside the chamber. The effect was higher for leaves mildly dehydrated, i.e., at ψ leaf values closer to zero (Figure 5).
Figure 5.

Assumption 5, i.e., accurate measurements require high humidity and bagged leaf in the chamber, tested on E. erythrocorys (), H. arbutifolia (), M. grandiflora () C. cunninghamiana ( ), and E. obliqua (
 ). Controls represent ψ
leaf measured with moisture and bagged inside the chamber, and Δψ
leaf is the difference in ψ
leaf between leaves without bag and any moisture inside the chamber and control leaves (with a positive value indicating a less negative value for treatment than control). Δψ
leaf over control ψ
leaf is presented in terms of absolute values (left panel) and % of difference respect to control ψ
leaf (right panel). The horizontal line indicates that a significant difference was found between tested and control leaves but the regression was not significant. Each point represents a pair of matched leaves, i.e., the difference in ψ
leaf between tested and control leaves [Color figure can be viewed at wileyonlinelibrary.com]
). Controls represent ψ
leaf measured with moisture and bagged inside the chamber, and Δψ
leaf is the difference in ψ
leaf between leaves without bag and any moisture inside the chamber and control leaves (with a positive value indicating a less negative value for treatment than control). Δψ
leaf over control ψ
leaf is presented in terms of absolute values (left panel) and % of difference respect to control ψ
leaf (right panel). The horizontal line indicates that a significant difference was found between tested and control leaves but the regression was not significant. Each point represents a pair of matched leaves, i.e., the difference in ψ
leaf between tested and control leaves [Color figure can be viewed at wileyonlinelibrary.com]
3.6. Test of Assumption 6. When measuring ψleaf, air enters the leaf epidermis and pressurizes the intercellular spaces, and thus leaves should be measured with no liquid water on their surfaces
For the three species tested, measuring leaves immersed under water increased ψ leaf (Figure 6).
Figure 6.

Assumption 6, i.e., gas enters the leaf, tested on E. erythrocorys (), H. arbutifolia (), and M. grandiflora (). Controls represent ψ
leaf measured while immersed, and Δψ
leaf is the difference in ψ
leaf between leaves measured immersed in water inside the chamber and control leaves (with a positive value indicating a less negative value for treatment than control). Regression lines are plotted when statistical analyses showed significant differences between tested and control leaves and regressions were p < 0.05, and horizontal lines are plotted when significant differences were found but regressions were not significant. Each point represents a pair of matched leaves, i.e., the difference in ψ
leaf between tested and control leaves.
3.7. Test of Assumption 7. Step pressurization is most accurate, with gradual pressurization acceptable for strongly dehydrated leaves
For two of three species tested, ψ leaf measured by continuously applying pressure was significantly lower, though this effect was only pronounced for mildly dehydrated leaves, i.e., for ψ leaf values >−1 MPa (Figure 7).
Figure 7.

Assumption 7, i.e. gradual versus step pressurization, tested on E. erythrocorys (), H. arbutifolia (), and M. grandiflora (). Controls represent ψ
leaf measured with step pressurization or ‘pulsing’, and Δψ
leaf is the difference in ψ
leaf between control leaves and leaves measured by continuously increasing the pressure at a constant rate (with a positive value indicating a less negative value for treatment than control). Δψ
leaf over control ψ
leaf is presented in terms of absolute values (left panel) and % of difference respect to control ψ
leaf (right panel). The horizontal line indicates that a significant difference was found between tested and control leaves but the regression was not significant. Each point represents a pair of matched leaves, i.e., the difference in ψ
leaf between tested and control leaves [Color figure can be viewed at wileyonlinelibrary.com]
3.8. Test of Assumption 8. ψleaf Measurements are reliable across multiple experimenters, given protocols are standardized within research teams
Experienced researchers made comparable measurements of ψ leaf, and non‐experienced researchers obtained highly variable ψ leaf values (Figure 8).
Figure 8.
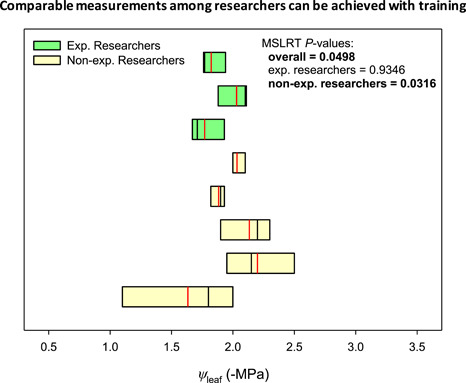
Boxplot of Assumption 8, i.e., objectivity of ψ leaf measurements across investigators, tested on C. betulus. Boxplots are ordered from low (up) to high (down) variation within the group of experienced or non‐experienced researchers (Exp. Researcher and Non‐exp. Researcher, respectively) and show the 25th percentile, median (black solid line), mean (red solid line) and 75th percentile. Each boxplot represents the measurements performed by a single researcher (n = 3). Modified signed‐likelihood ratio test for equality of coefficient of variations (MSLRT) statistic p value are presented on the graph considering all investigators (overall), only exp. researchers, and only non‐exp. researchers [Color figure can be viewed at wileyonlinelibrary.com]
4. DISCUSSION
Our compiled tests of pressure chamber assumptions provided key information for improved validity of measurement pointing to best practices (Appendix). Yet, these experimental findings do not represent an exhaustive testing of measurement approaches or global consensus on best practices. Indeed, the variation observed across species and research groups in the results of testing each assumption, suggests potential differences in practices and in species behaviours, thus indicating a critical need for further tests of these and other measurement assumptions (Appendix). The experiments synthesized in this study point to approaches that will enable the identification of best practices for ψ leaf measurements in individual future studies, and such experiments will not only assure greater precision but will also furnish further data for the future to optimize the methodology in practical use. Thus, our novel findings include both (i) instruction for potential tests to be done, e.g., before starting an experiment, and (ii) a demonstration of important potential pitfalls of the technique and means to best avoid them.
4.1. Measuring leaves immediately versus equilibrating them before measurements
There has been uncertainty in the literature about whether excised transpiring leaves should be allowed to equilibrate (by being bagged to prevent transpiration) before measurement or whether they should be measured immediately (Bernardi, 2000; Karlic & Richter, 1979; Ritchie & Hinckley, 1975; Turner, 1981, 1988). One of the possible causes of this lack of consensus is difficulty in defining and understanding what the pressure chamber measures. According to early interpretations (Scholander et al., 1965), which are still the most widely accepted (Sperry et al., 1996; Wei et al., 1999), for the leaf equilibrated under measurement in the pressure chamber, the magnitude of the balance pressure is equivalent to that of the negative hydrostatic pressure of the water in the xylem, as this positive pressure counteracts the surface tension of the menisci holding the xylem water in the pit membranes of vessels through which air/water interfaces cannot pass. Under these conditions of equilibrium at balance point, the chamber pressure is the negative of the water potentials of the symplast and apoplast and xylem, assuming the osmotic pressure of the apoplast (including the xylem) is close to zero (Boyer, 1969). Yet, how this equilibrium water potential should correspond to that of the transpiring leaf before excision has not been made clear.
Modelling approaches may help to resolve the underlying physical and physiological mechanisms. Thus, a spatially explicit model which coupled water and heat transport outside the xylem of leaves and mapped the distribution of ψ across leaf tissues in relation to anatomy and environmental factors (Buckley et al., 2015, 2017) showed that in transpiring leaves, large ψ gradients may occur between the xylem and the most distal epidermal tissues. Indeed, such gradients have also been measured with xylem and cell pressure probe experiments (Shackel & Brinckmann, 1985; Shackel, 1987; Zwieniecki et al. 2002). When a transpiring leaf is excised, causing the retreating water in the xylem, the pressure gradients will collapse if it is stored in a bag to avoid evaporation, as its ψ will equilibrate (and change) over time across the leaf tissues. Higher ψ tissues, likely closer to the xylem, will tend to lose water to more dehydrated, lowerψ tissues in the mesophyll and/or epidermis. The degree that the ψ immediately measured for an excised leaf would differ from that of a subsequently equilibrated leaf would depend on transpiration rate, and on the distribution and biophysical properties of leaf tissue of the species (Sack & Holbrook, 2006; Zwieniecki et al., 2007). For transpiring leaves with large pressure gradients from the xylem to the mesophyll, an instantly measured ψ leaf value would likely be biased upward by the higher ψ of the xylem and bundle sheath tissues, especially if these leaves had substantial water in these tissues, and during equilibration, given very high elastic modulus of the xylem cells, ψ leaf would decline closer to that of the mesophyll cells. The excision of transpiring leaves will also cause rapid dehydration (Turner & Long, 1980), so leaves must be enclosed under non‐transpiring conditions within 1–2 s after excision. Given that transpiration is halted when the leaf is sampled and bagged, the water potential values within the leaf would collapse to an equilibrium value that would represent the volume weighted mean of the leaf tissues (Tyree & Zimmermann, 2002), and thus closer to the bulk ψ leaf during transpiration than the immediate measure. Our empirical results supported the necessity for equilibration of leaves that were sampled during transpiration under appropriate storage conditions (see below), with a need to test the required equilibration time, which could be as short as 10 min for certain species, or potentially longer for others.
4.2. Storing equilibrated leaves under fully humid conditions in which there is no transpiration maintains stable ψleaf
ψ leaf is expected to be stable over time when leaves are not transpiring, i.e., ψ gradients within the leaf are equilibrated, and leaves are stored optimally before measurement. Our results suggest that this was the case for all species, though the conditions for long‐term maintenance of ψ leaf need to meet important criteria, and in some cases may be context dependent. Indeed, E. camaldulensis leaves stored in bags that were only exhaled into showed a decrease in ψ leaf over time, probably due to leaf dehydration. To minimise transpiration, the leaf needs to be stored in high relative humidity to reduce the driving force for water loss, and darkness, and potentially high CO2 to induce stomatal closure may be required, as well as constant temperature to prevent condensation on the leaf surface (Boyer, 1995). Our experiments showed that storage with simple procedures preserved ψ leaf of all species for up to 1 day and for most species, up to 3 days. Notably, a high humidity around the leaf as provided by wet paper towel is needed as part of the storage, and we did not find that ψ leaf increased due to uptake of water vapor under these conditions, excepting a very slight but statistically non‐significant trend for E. camaldulensis. In fact, this leaf rehydrating behaviour can occur for leaves kept in fog chambers (Guzmán‐Delgado et al., 2018) or in contact with water (Fernández et al., 2017). Nevertheless, we do not recommend long periods of storage (e.g., 1–2 weeks) as degradation of the leaf tissues, e.g., caused by biochemical and osmotic processes such as lysis of carbohydrates or depolymerisation of starch, may generate a variation in ψ leaf values, as observed in our results not only for these long storage times but also for some leaves stored for shorter times (1.5 days in O. europaea). For one species tested, M. grandiflora, ψ leaf declined after 1 day stored under non‐transpiring conditions on the laboratory bench, indicating this species dehydrated more easily than the others under the same conditions. This might be due to rapid osmotic adjustment, and/or tissue damage after excision, or just due to dehydration, especially if leaf surface trichomes play an important role as water storage sites and dehydrate even in humid air (Nguyen et al., 2017). Data from a greater diversity of species are needed to confirm the general feasibility of storing leaves for hours or days before ψ leaf measurement (see Appendix). We recommend conducting of tests for each species in designing measurement campaigns, to enable the convenience of sampling leaves in the field, storing and measuring them later in the laboratory.
4.3. Influence on ψ leaf values by modifications of the samples or measurement procedures
4.3.1. Equilibrating leaves on branches or seedlings
Transpiration causes gradients in ψ across organs in intact plants (Klepper et al., 1973). When this transpiration is prevented by covering the foliage, an equilibration time under non‐transpiring conditions is needed for these gradients to dissipate, and for their ψ to equalize. Reported equilibration times for branches vary widely in the literature, from 10 min to 1.5 h or longer (Hochberg, 2020; Levin, 2019; Li et al., 2021; Rockwell et al., 2011). The tests compiled here used the most common times reported in the literature (1–1.5 h) to ensure equilibration and found these to be sufficient for ψ leaf of leaves on single branches at different levels of dehydration to equilibrate, with a small difference in ψ between needles and twigs in P. cembra likely due to a technical issue in measuring conifers. The release of resin from ducts may mask the emergence of water from the cut end in conifers, especially at ψ >−0.5 MPa. Yet, this difference may not be important for well‐practiced operators, with repeatability of ±0.03–0.05 MPa.
Similarly, the ψ stem monitored with psychrometers in seedlings represented the ψ of all parts of the plant at equilibrium, given that stomata were virtually closed under the low irradiance laboratory conditions, except under strongly dehydrated samples. Notably, the ψ stem of P. lusitanica diverged from ψ leaf when ψ was close to TLP and 50% loss of leaf xylem functionality (P50); at this stage, embolism may lead to hydraulic disconnection between different tissues or organs in some species that would result in water losses at different rates, and a slower or incomplete equilibration across the plant (Brodribb et al., 2017). These discrepancies indicate that equilibration issues for branches dehydrated beyond cavitation thresholds would necessitate selecting ψ stem measurements as most appropriate according to the experimental design (Ritchie & Hinckley, 1971).
4.3.2. Elongating the petioles
Many researchers measuring small leaves have relied on pre‐treatments such as cutting a portion of leaf lamina to elongate the petiole (e.g., Richter, 1997). For ψ leaf measurements in grasses, Boyer (1995) recommended to cut one side of the leaf lamina of wide grass leaves perpendicularly, almost to the midrib, and to tear the leaf toward the apex from the cut, before measuring that sample. Our results mostly supported this approach. However, variation was usually high among such treated leaves, and apparently greater for leaves dehydrated to ψ leaf >−1.5 MPa; ψ leaf was also significantly lower in one of four species subjected to this modification. This species was M. grandiflora, corroborating the ability of their leaves to dehydrate easily which agrees with results from Assumption 2 for this species. Thus, whether removing a portion of the leaf lamina affects ψ leaf must be determined beforehand for the species under study (Appendix). Notably, another modification, which we did not test in our study, i.e., recutting the petiole, has always been discouraged in seminal papers (Richter et al., 1972; Scholander et al., 1965; Turner, 1988). Cutting large portions of petioles is obviously not recommended (Hochberg, 2020), but for some species the effect on ψ leaf has seemed to be negligible (Levin, 2019), and more data testing this modification are required (Appendix).
4.3.3. The need to measure leaves bagged and with high humidity inside the chamber
For decades, seminal works have recommended maintaining high humidity inside the pressure chamber during measurements (Turner, 1981, 1988), even modifying it so that gas enters the chamber by bubbling through water (Boyer, 1967). Given the initial steepness of pressure‐volume curves (Bartlett et al., 2012), water loss from an exposed excised leaf might cause a dramatic decline in ψ leaf. However, there have been scarce empirical data showing the effect of measuring leaves without humidifying the chamber (Cheung et al., 1975; Leach et al., 1982). We found that chamber conditions can strongly influence ψ leaf and thus that care must be taken to provide adequate humidity without inadvertently rehydrating samples (Appendix; Turner, 1988; Tyree et al., 1978), especially for leaves measured at moderate and high ψ leaf.
4.3.4. Measuring with gradual or step pressurization
Most pressure chamber users apply a constant and slow rate of pressurization during measurement of balance pressure (personal communications from researchers of several laboratories). Several experiments testing the influence of different rates of increase in pressure have been reported, with mixed results (Naor & Peres, 2001; Ritchie & Hinckley, 1975), concluding that the maximum rate applied should be determined for the species under study (Ritchie & Hinckley, 1975). We did not compare different rates of pressurization but a constant rate (0.02 MPa s−1) (Turner, 1981, 1988) versus a pulsed rate of increase, i.e., small increments followed by waiting periods. As the highest decrease from ‘gradual’ compared to ‘pulsing’ values was observed at ψ leaf >−1 MPa, we recommend the ‘pulsing’ methodology for accuracy of the endpoint identification when ψ leaf is expected to be high, although a low and continuous rate of pressurization would be acceptable when ψ leaf is expected to be lower and to enable measurement of a larger number of samples under time constraints (Appendix). We consider a ‘pulsing’ methodology to be more accurate because a specific time is allocated for pressure to equilibrate within the leaf. Therefore, pulsing or slow pressurization is needed to avoid overestimation (Naor & Peres, 2001), but this careful approach comes at the cost of rapid measurement.
4.3.5. Achieving agreement among investigators in measurements of ψleaf
Our test for the consistency of ψ leaf values across investigators showed that even when a standard protocol is taught to non‐experienced researchers and used within the same team, large variations in ψ leaf may occur among experimenters. Experience with the measurement procedures reduced this variation. Thus, we recommend that researchers design detailed workshops to establish a consensus in procedures such as collecting and storing the samples, handling the samples prior and during the measurement and determining the balance pressure point, and suggest our best practices protocol as a starting point (Appendix).
5. CONCLUSIONS
Due to the existence of an extraordinary variety of leaf forms across species, some might object prima facie to the standardization of ψ leafPC. Yet, in our work to test assumptions toward recommending best practices, we found support for general principles to optimize the method, enabling concrete suggestions for best practices, with the full recognition that our recommendations are still open for improvements. These continuing improvements will scale up to greater accuracy and precision in the multiple applications of ψ leaf measurements globally. Among the recommendations of best practices, we include (i) the need for equilibrating transpiring leaves under non‐transpiring conditions, (ii) the possibility to store equilibrated leaves under non‐transpiring conditions for a later measurement, (iii) the equilibration of ψ leaf for leaves on bagged branches of a range of dehydration, (iv) the possibility to elongate the petiole for some species, (v) the need for bagging leaves and include high humidity within the chamber when measuring ψ leaf, (vi) the need to avoid liquid water on leaf surfaces, (vii) the use of “pulse” pressurization for accuracy, and (viii) the need to standardize the sampling and measurement procedure within the research team. We also acknowledge the need to test these assumptions on additional species, including herbaceous species for which the use of the pressure chamber might be more difficult, and to test further assumptions not yet considered in our study (Appendix), not to only improve our understanding of the best means for reliable, accurate and precise measurements, but also to yield further insights on underlying processes affecting the species’ water relations.
CONFLICTS OF INTEREST
The authors declare no conflicts of interest.
AUTHOR CONTRIBUTIONS
Celia M. Rodriguez‐Dominguez, Alicia Forner, Sebastia Martorell and Lawren Sack: conceived and designed the experiment at University of California, Los Angeles, where Celia M. Rodriguez‐Dominguez, Alicia Forner, Scott A. M. McAdam collected and analysed the data with help from Lawren Sack Brendan Choat, Rosana Lopez, Jennifer M. R. Peters and Sebastian Pfautsch conceived and designed the experiment, and collected and analysed the data at Western Sydney University. Stefan Mayr: conceived and designed the experiment, and collected and analysed the data at University of Innsbruck. Madeline R. Carins‐Murphy, Scott A. M. McAdam and Freya Richardson: conceived and designed the experiment, and collected and analysed the data at University of Tasmania. Antonio Diaz‐Espejo and Virginia Hernandez‐Santana. conceived and designed the experiment, and collected and analysed the data at IRNAS‐CSIC. Paulo E. Menezes‐Silva and Jose M. Torres‐Ruiz: conceived and designed the experiment, and collected and analysed the data at INRAE‐Université Clermont‐Auvergne. Scott A. M. McAdam and Timothy A. Batz: conceived and designed the experiment, and collected and analysed the data at Purdue University. Virginia Hernandez‐Santana: performed all the statistical analyses. Celia M. Rodriguez‐Dominguez, Alicia Forner and Lawren Sack: wrote the first draft of the manuscript, with inputs from Scott A. M. McAdam. All authors reviewed the manuscript and contributed with very constructive inputs for the final version. Besides the first and last authors, criteria for ordering the authors were: first, authors from the same institution were joined; second, institutions were ordered as their authors were interested in contributing to the manuscript; and third, within each institution, authors were ordered by alphabetical order of the first surname of each author.
Supporting information
Supplementary information.
Supplementary information.
Supplementary information.
Supplementary information.
ACKNOWLEDGEMENTS
This study was supported by a FPDI research fellowship, an Individual Excellence Stay from the Junta de Andalucía and an Individual Fellowship from the European Union's Horizon 2020 research and innovation programme under the Marie Skłodowska‐Curie grant agreement No. 751918‐AgroPHYS to C.M R‐D; a JAE‐predoc fellowship and a APOSTD fellowship from the Generalitat Valenciana both co‐funded by the European Union to A.F; a Marie Curie Fellowship (FP7‐PEOPLE‐2013‐IOF‐624473) to R.L.; the Austrian research agency (FWF) project P32203 research area “Mountain Regions” to St.M; and the National Science Foundation (Grant IOS‐#1457279) to L.S. We are grateful to Alec Baird, Marvin Browne, Christian Henry, Leila Fletcher, Camila Medeiros, and Marissa Ochoa for comments on the manuscript.
Best practice recommendations for ψ leaf measurement with the pressure chamber and suggestions for further tests to be performed
1.
The aim of this Appendix is to present best practices for pressure chamber ψ leaf measurements derived from our knowledge of typical practices, the tests performed in the present study, and consultation with other experts. We also highlight when additional tests would be useful to design protocols for measuring given species.
1. Collecting samples
When the target leaf has been selected, caution must be taken in cutting the petiole.
The petiole must be long enough to fit the gasket of the pressure chamber (see Section 3 for recommendations measuring short‐petiole species), and the cleaner and more perpendicular the cut, the better for its visualization. Always use sharp razor blades.
Since the leaf may quickly dehydrate after excision, it should be immediately (within 1–2 s after excision) and appropriately stored. Based on our tests of assumptions 1 and 2, we advise minimising leaf dehydration. Immediately before, or immediately after excising a leaf, (i) insert it, with its petiole inside, in an individual small zip lock plastic bag previously exhaled into (and thus containing high humidity and CO2 to halt transpiration), (ii) squeeze the air out of the bag, (iii) seal the bag if convenient and insert it into another bag containing soaked paper towel and thus providing a saturated atmosphere around the bagged leaf, and (iv) store the double‐bagged leaf in a cooling box containing ice packs, while using a barrier (e.g., a cardboard box) to prevent contact between samples and ice packs, thus avoiding abrupt changes of temperature.
2. Equilibration and storage of samples before measurements
Store leaves in double bags as explained above. We recommend measuring leaves once equilibrium has been reached and avoid long storage periods (>1 day) that may lead to loss of accuracy. For transpiring leaves, the minimum equilibration time should be tested beforehand; 10 to 30 min was sufficient for our tested species when excised during transpiration. Allowable storage time before measurement appeared to differ among species.
1. Test for determining the storage time required for leaves to equilibrate. Collect ca. 10 leaves from the same branch and under the same conditions, store them as stated above, and measure three leaves immediately (this will also validate that the initial ψ leaf is the same) and, then, every 5–10 min. Once a plateau is reached, the leaves may be considered as equilibrated. Repeat this procedure at various times of the day corresponding to different transpiration rates.
While leaves should be stored in humid conditions, care must be taken to prevent the absorption of moisture and rehydration. Thus, we suggest sealing the leaves individually in bags with as little air space as possible and to test for this possibility if leaves are stored for many hours or days.
2. Test to check whether dry leaves stored under humid conditions may rehydrate. Follow the same steps as the previous example test 1. Store some leaves under those same conditions and others including a wet paper towel inside the individual bag, covering and touching the leaf, resulting in a highly humid environment around it. Measure one leaf from each condition immediately and then, measure the stored leaves every 30 min–1 h.
3. Manipulation of samples before measurements
The time that leaves remain on the bench when manipulated must be minimised and if leaves are subjected to treatments, the exposed leaf lamina should be covered with a plastic bag with wet paper towel inside to avoid dehydration. If the leaves have standing moisture on their surfaces (e.g., predawn samples), we recommend wiping them with a dry paper towel before measurement since it could rehydrate when measured (see tests of Assumption 6).
Although recutting the petiole has been discouraged in seminal works (Richter et al., 1972; Scholander et al., 1965; Turner, 1988) due to a possible effect of increasing ψ leaf, in some species, recutting of small amounts of the petiole may be essential to see the xylem and may not affect ψ leaf, e.g., vine leaves (Levin, 2019). We recommend that, if recutting the petiole is necessary, removing long portions of petioles should be avoided as this shortens the distance that the water column would travel (Hochberg, 2020).
3. Test of the effect of re‐cutting the petiole before measuring ψ leaf. Collect a branch with several leaves and store it under non‐transpiring conditions for 2 h to ensure all leaves have the same ψ leaf. Measure 3–4 replicates of leaves in which, right after taking the leaves, the petioles (i) have not been re‐cut, (ii) have been slightly re‐cut, and (iii) have been severely re‐cut, but with still enough remaining to fit into the pressure chamber gasket.
Another potential issue with small leaves is whether the leaf petiole is sufficiently long to fit through the gasket. According to our test of Assumption 4, elongating the petiole may affect the ψ leaf in some species. Thus, a test should be performed beforehand.
4. Test of the effect of elongating the petiole on ψ leaf. Since this test will likely be performed in species where elongating the petiole is inevitable (e.g., olive leaves), larger plant parts (short twigs, end twigs, branches) may be used for comparisons. Collect a twig or a shoot with 3–4 leaves to be measured and equilibrate it under non‐transpiring conditions for 1–2 h to ensure all leaves have the same ψ leaf. Measure first the equilibrated shoot keeping it bagged and under highly humid conditions inside the chamber, release the pressure very slowly, and finally measure the leaves with their petioles elongated, one at a time and keeping the shoot bagged under highly humid conditions between measurements.
An important recommendation for measuring twigs of conifer species, is to remove the bark and peel away the 3–5 mm of resinous outer layers to better identify the endpoint.
4. Measurement technique
Create high humidity conditions inside the chamber with abundant damp paper towel and enclose the leaf in a bag. These conditions are particularly important for mildly or moderately dehydrated leaves, i.e., with high ψ leaf (see test of Assumption 5). Caution must be taken using bags inside the chamber to avoid a safety risk if these block the safety valve making it difficult to fully depressurise the chamber after use. We suggest that the bag be arranged so as not to interfere with the safety valve, which is usually at the bottom of the chamber. Additionally, care must be taken such that the top of the plastic bag does not interfere with proper sealing of the chamber lid.
We suggest mounting a dissecting microscope above the pressure chamber, with fibre‐optic lights, to clearly observe the cut petiole surface and to best resolve the balance pressure.
A common question among pressure chamber users is how to decide on the measurement endpoint: what proportion of the petiole surface conductive area must be wetted? This may depend on the plant type and species, and thus, identifying first the xylem through which sap will appear is essential. We recommend noting the pressure at the first sign of water at the cut end, and additionally, the pressure when the entire xylem area is wetted. These values may be compared, and, if not too different, an average may be used. We also suggest considering that the endpoint has been exceeded when water is ‘bubbling’. These technicalities should be discussed among researchers; according to our test of assumption 8, variation among researchers in the approach should be minimised for what would be considered the endpoint.
If many samples need to be measured, and leaves to be measured are of low ψ leaf, it is acceptable to use a continuous medium‐slow rate of pressurization (0.02–0.03 MPa s−1). However, if only a few samples need to be measured and, in particular, if they are at high ψ leaf, pulsing the pressure increase is recommended (see test of Assumption 7), i.e., increasing the pressure by low increments (e.g., 0.05–0.10 MPa), and holding the pressure for 5–10 s (15–30 s when approaching the value) to test for balance pressure. If the approximate value of ψ leaf is known and it is low enough (≤−1 MPa), higher rates of pressurization can be applied at the beginning to build the chamber pressure; then, after holding the pressure for 5–10 s, the pressurization rate should be slowed to a slow pressurization rate, 0.007–0.01 MPa s−1 for the last 30% of the range until the balance pressure is reached. Although this last procedure was not exactly tested in our experiments (we evaluated a continuous increase in pressure vs. a pulsed increase, both at the same rate of pressurization), the differences between the two techniques evaluated tended to occur at high ψ leaf. Thus, using a slow pressurization rate for the last 30% of the ψ leaf range should allow precise identification of the endpoint, and also more rapid measurements for leaves at very low ψ leaf.
To validate the measurement, in case the endpoint was not clear, or to check whether the balance pressure was overestimated (as would occur if water was gushing out or ‘bubbling’ vigorously at the xylem cut surface), after the balancing pressure is achieved, i.e., when water reaches the cut surface, slowly decrease the pressure by ca. 0.5 MPa or until the water recedes, and then increase the pressure again very slowly in small pulses, holding the pressure for 15–30 s between pulses until a new balance pressure is reached. Recognize that the new water potential measurement may be slightly lower than the original measurement due to loss of water from the petiole.
5. Test of the effect of re‐measuring the same leaf on ψ leaf. When the same leaf is re‐measured, it is assumed that the first measurement does not change the water content of the leaf, and so its ψ leaf. To test this assumption, collect a branch and equilibrate it under non‐transpiring conditions for 1–2 h by covering each leaf individually with a Ziploc plastic bag containing a wet paper towel inside and the entire branch in a bigger, dark plastic bag with more wet paper towel inside. For the measurements, collect a leaf, weight it bagged on a precision balance, with the petiole inside the bag and the bag sealed, and measure it immediately taking the precautions specified by Wenkert et al. (1978), i.e., minimising the water loss through the cut surface by very slowly incrementing the pressure when approaching the balance pressure value, and depressurising very slowly to avoid possible damage to mesophyll cells. After removing the leaf from the chamber, weigh it again immediately after inserting the petiole inside the bag. Measure it a second time, repeating the same procedure, to check whether mass and ψ leaf have changed.
The determination of the balance pressure may be more difficult when embolism has occurred within the leaf xylem vessels, as an air‐water mixture is often observed at the cut surface, though ψ leaf determination might still be possible. In these cases, we recommend continuing to increase the pressure until the xylem cut surface is entirely covered, but if this does not occur, the pressure at the first sign of water remains the most acceptable value.
5. Some extra recommendations on measurement technique
Caution is necessary when plant material contains resin or mucilage ducts or laticifers, so measurements should be performed in test material beforehand to train on the visual distinction between resin, mucilage or latex and water. With practice, the different fluids can be clearly distinguished visually by their viscosity and reflectance.
Caution must be taken during the closure of the chamber to not squeeze some parts of the leaf. The sealing force (compression of the gasket) should be increased with increasing pressure, always taking care not to over‐squeeze the petiole. A good recommendation for low ψ leaf might be to wrap parafilm or dental epoxy around the base of the petiole to enhance the seal and prevent overtightening the lid and snapping the petiole. Another recommendation for herbaceous species, which are usually more difficult to measure, is not to force the gasket much to avoid smashing the petiole, even if there is some leakage. Small leaks are not problematic, indeed better than crushing the tissue, as long as the chamber can be pressurized. Using softer gaskets may also be very helpful. These ways to cope with the challenges of herbaceous leaves are based on our own experience, and we encourage researchers starting work on herbaceous species to evaluate different assumptions to optimize the use of the pressure chamber.
At the end of the measurement, samples should be checked for possible damage that may have led to incorrect values.
Rodriguez‐Dominguez, C. M. , Forner, A. , Martorell, S. , Choat, B. , Lopez, R. , Peters, J. M. R. et al. (2022) Leaf water potential measurements using the pressure chamber: Synthetic testing of assumptions towards best practices for precision and accuracy. Plant, Cell & Environment, 45, 2037–2061. 10.1111/pce.14330
DATA AVAILABILITY STATEMENT
The data that support the findings of this study are available from the corresponding author upon reasonable request.
REFERENCES
- Angeles, G. , Bond, B. , Boyer, J.S. , Brodribb, T. , & Tyree, M. (2004) The Cohesion‐Tension Theory. New Phytologist, 163, 451–452. [DOI] [PubMed] [Google Scholar]
- Balling, A. & Zimmermann, U. (1990) Comparative measurements of the xylem pressure ofNicotiana plants by means of the pressure bomb and pressure probe. Planta, 182, 325–338. [DOI] [PubMed] [Google Scholar]
- Bartlett, M.K. , Scoffoni, C. & Sack, L. (2012) The determinants of leaf turgor loss point and prediction of drought tolerance of species and biomes: a global meta‐analysis. Ecology Letters, 15, 393–405. [DOI] [PubMed] [Google Scholar]
- Bernardi, A. (2000) Branch water potential; a useful indicator of plant water potential in comparison to leaf water potential in canola. Australian Journal of Experimental Agriculture, 40, 687–692. [Google Scholar]
- Boyer, J.S. (1967) Leaf water potentials measured with a pressure chamber. Plant Physiology, 42, 133–137. [DOI] [PMC free article] [PubMed] [Google Scholar]
- Boyer, J.S. (1969) Measurement of the water status of plants. Annual Review of Plant Physiology, 20, 351–364. [Google Scholar]
- Boyer, J.S. (1995) Measuring the Water Status of Plants and Soils. Cambridge, MA: Academic. [Google Scholar]
- Boyer, J.S. (2011) Pressure Chamber for Measuring the Water Potential and its Components. http://prometheuswiki.org/tiki-index.php?page=Pressure%2Bchamber
- Boyer, J.S. & Knipling, E.B. (1965) Isopiestic technique for measuring leaf water potentials with a thermocouple psychrometer. Proceedings of the National Academy of Sciences, 54, 1044–1051. [PMC free article] [PubMed] [Google Scholar]
- Brodribb, T.J. , Carriqui, M. , Delzon, S. & Lucani, C. (2017) Optical measurement of stem xylem vulnerability. Plant Physiology, 174, 2054–2061. [DOI] [PMC free article] [PubMed] [Google Scholar]
- Brodribb, T.J. , Skelton, R.P. , Mcadam, S.A.M. , Bienaimé, D. , Lucani, C.J. & Marmottant, P. (2016) Visual quantification of embolism reveals leaf vulnerability to hydraulic failure. New Phytologist, 209, 1403–1409. [DOI] [PubMed] [Google Scholar]
- Buckley, T.N. , John, G.P. , Scoffoni, C. & Sack, L. (2015) How does leaf anatomy influence water transport outside the xylem? Plant Physiology, 168, 1616–1635. [DOI] [PMC free article] [PubMed] [Google Scholar]
- Buckley, T.N. , John, G.P. , Scoffoni, C. & Sack, L. (2017) The sites of evaporation within leaves. Plant Physiology, 173, 1763–1782. [DOI] [PMC free article] [PubMed] [Google Scholar]
- Cheung, Y.N.S. , Tyree, M.T. & Dainty, J. (1975) Water relations parameters on single leaves obtained in a pressure bomb and some ecological interpretations. Canadian Journal of Botany, 53, 1342–1346. [Google Scholar]
- Cochard, H. , Forestier, S. & Améglio, T. (2001) A new validation of the Scholander pressure chamber technique based on stem diameter variations. Journal of Experimental Botany, 52, 1361–1365. [PubMed] [Google Scholar]
- Dixon, H. (1914) Transpiration and the ascent of sap in plants. New York, NY, USA: MacMillan, MacMillan. New York, NY, USA: [Google Scholar]
- Dixon, M.A. & Tyree, M.T. (1984) A new stem hygrometer, corrected for temperature gradients and calibrated against the pressure bomb. Plant, Cell & Environment, 7, 693–697. [Google Scholar]
- Fernández, V. , Bahamonde, H.A. , Javier Peguero‐Pina, J. , Gil‐Pelegrín, E. , Sancho‐Knapik, D. , Gil, L. et al. (2017) Physico‐chemical properties of plant cuticles and their functional and ecological significance. Journal of Experimental Botany, 68, 5293–5306. [DOI] [PubMed] [Google Scholar]
- Guzmán‐Delgado, P. , Mason Earles, J. & Zwieniecki, M.A. (2018) Insight into the physiological role of water absorption via the leaf surface from a rehydration kinetics perspective. Plant, Cell and Environment, 41, 1886–1894. [DOI] [PubMed] [Google Scholar]
- Hales, S. (1727) Vegetable Staticks. London, UK: Oldbourne Book Co. [Google Scholar]
- Hochberg, U. (2020) Facilitating protocols while maintaining accuracy in grapevine pressure chamber measurements‐ comments on Levin 2019. Agricultural Water Management, 227, 105836. [Google Scholar]
- Holbrook, N.M. , Burns, M.J. & Field, C.B. (1995) In vivo observation of cavitation and embolism repair using magnetic resonance imaging. Negative Xylem Pressures in Plants: A Test of the Balancing Pressure Technique, 270, 1193–1194. [Google Scholar]
- Hothorn, T. , Bretz, F. & Westfall, P. (2008) Simultaneous inference in general parametric models. Biometrical Journal, 50, 346–363. [DOI] [PubMed] [Google Scholar]
- Karlic, H. & Richter, H. (1979) Storage of detached leaves and twigs without changes in water potential. New Phytologist, 83, 379–384. [Google Scholar]
- Klepper, B. , Taylor, H.M. , Huck, M.G. & Fiscus, E.L. (1973) Water relations and growth of cotton in drying soil. Agronomy Journal, 65, 307–310. [Google Scholar]
- Knipfer, T. , Bambach, N. , Hernandez, M.I. , Bartlett, M.K. & McElrone, A.J. (2020) Predicting stomatal closure and turgor loss in woody plants using predawn and midday water potential. Plant Physiology, 184, 881–894. [DOI] [PMC free article] [PubMed] [Google Scholar]
- Krishnamoorthy, K. & Lee, M. (2014) Improved tests for the equality of normal coefficients of variation. Computational statistics, 29, 215–232. [Google Scholar]
- Kursar, T.A. , Engelbrecht, B.M.J. , Burke, A. , Tyree, M.T. , El Omari, B. & Giraldo, J.P. (2009) Tolerance to low leaf water status of tropical tree seedlings is related to drought performance and distribution. Functional Ecology, 23, 93–102. [Google Scholar]
- Leach, J.E. , Woodhead, T. & Day, W. (1982) Bias in pressure chamber measurements of leaf water potential. Agricultural Meteorology, 27, 257–263. [Google Scholar]
- Levin, A.D. (2019) ) Re‐evaluating pressure chamber methods of water status determination in field‐grown grapevine (Vitis spp.). Agricultural Water Management, 221, 422–429. [Google Scholar]
- Li, H. , Zhang, X. , Hou, X. & Du, T. (2021) Developmental and water deficit‐induced changes in hydraulic properties and xylem anatomy of tomato fruit and pedicels. Journal of Experimental Botany, 72, 2741–2756. [DOI] [PubMed] [Google Scholar]
- Marwick, B. & Krishnamoorthy, K. (2019) cvequality: Tests for the Equality of Coefficients of Variation from Multiple Groups. R software package version 0.1.3.https://github.com/benmarwick/cvequality on 05/01/2019 Retrieved from.
- McAdam, S.A.M. & Brodribb, T.J. (2013) Ancestral stomatal control results in a canalization of fern and lycophyte adaptation to drought. New Phytologist, 198, 429–441. [DOI] [PubMed] [Google Scholar]
- Melcher, P.J. , Meinzer, F.C. , Yount, D.E. , Goldstein, G. & Zimmermann, U. (1998) Comparative measurements of xylem pressure in transpiring and non‐transpiring leaves by means of the pressure chamber and the xylem pressure probe. Journal of Experimental Botany, 49, 1757–1760. [Google Scholar]
- Naor, A. & Peres, M. (2001) Pressure‐increase rate affects the accuracy of stem water potential measurements in deciduous fruit trees using the pressure‐chamber technique. Journal of Horticultural Science and Biotechnology, 76, 661–663. [Google Scholar]
- Nguyen, H.T. , Meir, P. , Wolfe, J. , Mencuccini, M. & Ball, M.C. (2017) Plumbing the depths: extracellular water storage in specialized leaf structures and its functional expression in a three‐domain pressure –volume relationship. Plant, Cell and Environment, 40, 1021–1038. [DOI] [PubMed] [Google Scholar]
- Pérez‐Harguindeguy, N. , Díaz, S. , Garnier, E. , Lavorel, S. & Cornelissen, J.H.C. (2013) New Handbook for standardized measurment of plant functional traits worldwide. Australian Journal of Botany, 61, 167–234. [Google Scholar]
- Pinheiro, J. , Bates, D. , DebRoy, S. & Sarkar, D. , R Core Team (2017) _nlme: Linear and Nonlinear Mixed Effects Models_. R package version 3.1‐131. [Google Scholar]
- Pittermann, J. , Limm, E. , Rico, C. & Christman, M.A. (2011) Structure‐function constraints of tracheid‐based xylem: a comparison of conifers and ferns. New Phytologist, 192, 449–461. [DOI] [PubMed] [Google Scholar]
- Richter, H. (1997) Water relations of plants in the field: some comments on the measurement of selected parameters. Journal of Experimental Botany, 48, 1–7. [Google Scholar]
- Richter, H. , Halbwachs, G. & Holzner, W. (1972) Saugspannungsmessungen in der Krone eines Mammutbaumes (Sequoiadendron giganteum)1. Flora, 161, 401–420. [Google Scholar]
- Richter, H. & Rottenburg, W. (1971) Leitfähigkeitsmessung zur Endpunktanzeige bei der Saugspannungsbestimmung nach Scholander. Flora, 160, 440–443. [Google Scholar]
- Ritchie, G.A. & Hinckley, T.M. (1971) Evidence for error in pressure‐bomb estimates of stem xylem potentials. Ecology, 52, 534–536. [Google Scholar]
- Ritchie, G.A. & Hinckley, T.M. (1975) The pressure chamber as an instrument for ecological research. Advances in Ecological Research, 9, 165–254. [Google Scholar]
- Rockwell, F.E. , Holbrook, N.M. & Zwieniecki, M.A. (2011) Hydraulic conductivity of red oak (Quercus rubra L.) leaf tissue does not respond to light. Plant, Cell and Environment, 34, 565–579. [DOI] [PubMed] [Google Scholar]
- Roderick, M.L. & Canny, M.J. (2005) A mechanical interpretation of pressure chamber measurements—what does the strength of the squeeze tell us? Plant Physiology and Biochemistry, 43, 323–336. [DOI] [PubMed] [Google Scholar]
- Sack, L. & Holbrook, N.M. (2006) Leaf Hydraulics. Annual review of plant biology, 57, 361–381. [DOI] [PubMed] [Google Scholar]
- Sack, L. & Pasquet‐Kok, J. (2011) Leaf pressure‐volume curve parameters. http://prometheuswiki.org/tiki-index.php?page=Leaf%2Bpressure-volume%2Bcurve%2Bparameters
- Scholander, P.F. , Bradstreet, E.D. , Hemmingsen, E.A. & Hammel, H.T. (1965) Sap pressure in vascular plants: negative hydrostatic pressure can be measured in plants. Science (New York, N.Y.), 148, 339–346. [DOI] [PubMed] [Google Scholar]
- Shackel, K.A. (1987) Direct measurement of turgor and osmotic potential in individual epidermal cells. Plant Physiology, 83, 719–722. [DOI] [PMC free article] [PubMed] [Google Scholar]
- Shackel, K.A. & Brinckmann, E. (1985) In situ measurement of epidermal cell turgor, leaf water potential, and gas exchange in tradescantia virginiana L. Plant Physiology, 78, 66–70. [DOI] [PMC free article] [PubMed] [Google Scholar]
- Sperry, J.S. , Saliendra, N.Z. , Pockman, W.T. , Cochard, H. , Cruiziat, P. , Davis, S.D. et al. (1996) New evidence for large negative xylem pressures and their measurement by the pressure chamber method. Plant, Cell and Environment, 19, 427–436. [Google Scholar]
- Steudle, E. (2001) The Cohesion‐Tension mechanism and the acquisition of water by plant roots. Annual Review of Plant Physiology and Plant Molecular Biology, 52, 847–875. [DOI] [PubMed] [Google Scholar]
- Turner, N.C. (1981) Techniques and experimental approaches for the measurement of plant water status. Plant and Soil, 58, 339–366. [Google Scholar]
- Turner, N.C. (1988) Measurement of plant water status by the pressure chamber technique. Irrigation Science, 9, 289–308. [Google Scholar]
- Turner, N.C. & Long, M.J. (1980) Errors arising from rapid water loss in the measurement of leaf water potential by the pressure chamber technique. Functional Plant Biology, 7, 527–537. [Google Scholar]
- Tyree, M.T. , Cheung, Y.N.S. , MacGregor, M.E. & Talbot, A.J.B. (1978) The characteristics of seasonal and ontogenetic changes in the tissue – water relations of Acer, Populus, Tsuga, and Picea . Canadian Journal of Botany, 56, 635–647. [Google Scholar]
- Tyree, M.T. , Engelbrecht, B.M.J. , Vargas, G. & Kursar, T.A. (2003) Desiccation tolerance of five tropical seedlings in Panama. Relationship to a field assessment of drought performance. Plant Physiology, 132, 1439–1447. [DOI] [PMC free article] [PubMed] [Google Scholar]
- Tyree, M.T. , Vargas, G. , Engelbrecht, B.M.J. & Kursar, T.A. (2002) Drought until death do us part: a case study of the desiccation‐tolerance of a tropical moist forest seedling‐tree, Licania platypus (Hemsl.) Fritsch. Journal of Experimental Botany, 53, 2239–2247. [DOI] [PubMed] [Google Scholar]
- Tyree, M.T. & Zimmermann, M.H. (2002) Xylem Structure and the Ascent of Sap. Berlin, Heidelberg: Springer Berlin Heidelberg. [Google Scholar]
- Wei, C. , Steudle, E. & Tyree, M.T. (1999) Water ascent in plants: Do ongoing controversies have a sound basis? Trends in Plant Science, 4, 372–375. [DOI] [PubMed] [Google Scholar]
- Wei, C. , Tyree, M.T. & Bennink, J.P. (2000) The transmission of gas pressure to xylem fluid pressure when plants are inside a pressure bomb. Journal of Experimental Botany, 51, 309–316. [DOI] [PubMed] [Google Scholar]
- Wenkert, W. , Lemon, E. & Sinclair, T. (1978) Changes in water potential during pressure bomb measurement. Agronomy Journal, 70, 353–355. [Google Scholar]
- Wu, J. , Serbin, S.P. , Ely, K.S. , Wolfe, B.T. , Dickman, L.T. , Grossiord, C. et al. (2020) The response of stomatal conductance to seasonal drought in tropical forests. Global Change Biology, 26, 823–839. [DOI] [PubMed] [Google Scholar]
- Zwieniecki, M.A. , Brodribb, T.J. & Holbrook, N.M. (2007) Hydraulic design of leaves: insights from rehydration kinetics. Plant, Cell & Environment, 30, 910–921. [DOI] [PubMed] [Google Scholar]
- Zwieniecki, M.A. , Melcher, P.J. , Boyce, C.K. , Sack, L. & Holbrook, N.M. (2002) Hydraulic architecture of leaf venation in Laurus nobilis L. Plant, Cell and Environment, 25, 1445–1450. [Google Scholar]
Associated Data
This section collects any data citations, data availability statements, or supplementary materials included in this article.
Supplementary Materials
Supplementary information.
Supplementary information.
Supplementary information.
Supplementary information.
Data Availability Statement
The data that support the findings of this study are available from the corresponding author upon reasonable request.