

Abstract
Background
Oxygen saturation indices show a strong correlation with long‐term health outcomes. Nonetheless, evidence on the relationship between reduction in respiratory events and increase in oxygenation levels following oral appliance (OA) treatment is scarce.
Objectives
To verify the relationship between reduction in the apnoea‐hypopnoea index (AHI) and oxygen saturation levels following OA treatment, we have conducted an evaluation of polysomnography (PSG) and clinical parameters associated with the improvement of oxygen desaturation.
Methods
OSA patients (n = 48) who received an OA and had pre‐ and post‐treatment PSG were classified into three responder groups according to the change in AHI and min O2 post‐treatment: responderAHIonly (decrease in AHI of ≥50% but increase in min O2 level of <4% or decrease); responderMinO2only (increase in min O2 level of ≥4% but decrease in AHI <50% or increase) and responderCongruous (decrease in AHI of ≥50% and increase in min O2 level of ≥4%). Various demographic and PSG variables were statistically compared among groups.
Results
There were 26 (54.17%) responderAHIonly, 9 (18.75%) responderMinO2only and 13 (27.08%) responderCongruous. Pre‐treatment min O2 was significantly lower in responderMinO2only. A higher pre‐treatment min O2 showed a significant correlation with a smaller amount of change in mean O2 (r = −.486) and min O2 (r = −.764) with treatment. Pre‐treatment min O2 showed the strongest ability to predict those who would show a ≥4% min O2 increase following treatment.
Conclusion
Certain patients do not show sufficient decrease in hypoxaemia in spite of the improvement in AHI. Pre‐treatment min O2 should be considered in OA treatment planning regarding its close relation to improvements in oxygenation levels with treatment.
Keywords: hypoxic burden, mandibular advancement device, obstructive sleep apnoea, oxygen saturation, responder, sleep disordered breathing
Certain patients do not show sufficient improvement in oxygen saturation levels in spite of the improvement in AHI. Pre‐treatment minimum oxygen saturation levels should be considered in oral appliance treatment planning regarding its close relation to improvements in oxygenation levels with treatment. Patients with increased desaturation should not be excluded from oral appliance therapy since these patients also showed an important and more significant increase in oxygen levels compared to patients who did not present low levels of oxygenation at baseline.

1. INTRODUCTION
Obstructive sleep apnoea (OSA) is caused by repeated obstruction of the upper airway that is followed by partial or complete interruption of airflow during sleep. OSA affects 3%–20% of the general population with prevalence showing a significant increase along with its socioeconomic burden. 1 , 2 Untreated OSA is associated with long‐term adverse health outcomes including cardiovascular disease, endocrine disorders and also motor vehicle accidents that may cause fatality. 3 Appropriate therapy can improve symptoms and reduce associated sequelae to some extent. 4 , 5 , 6 Continuous positive airway pressure (CPAP) is considered the first‐line therapy for OSA; however, many patients experience difficulty in its usage and adherence remains generally low with 30% of the initially compliant patients failing to use CPAP at 5 years. 7 , 8 Based on such observations, oral appliances (OA) are recommended for OSA management. 9 Growing evidence confirmed that even severe OSA can be successfully treated with OAs that protrude the mandible to maintain upper airway patency and decrease its collapsibility through various mechanisms. OA treatment for OSA has shown to reduce the number of respiratory events and increase oxygen saturation levels. The success rate for OA treatment is 50%–75% with > 50% reduction in pre‐treatment apnoea‐hypopnoea index (AHI) as the criteria is 50%–75% according to various studies. 5 , 10 , 11 However, studies defining treatment success based on the improvement in oxygen saturation levels are scarce and this is also true in evaluating the efficacy of other OSA treatments including CPAP. Intermittent hypoxia and oxygen desaturation, the main hallmarks of OSA, are known to cause alterations in gene expression and cell metabolism, which are directly related to the adverse systemic sequelae and increased mortality of OSA. 12 , 13 Although AHI is the most commonly used index for evaluating OSA, controversies have risen since AHI often fails to show a significant correlation with OSA related complications and comprehensive measurements such as quality of life and treatment response. 14 , 15 Several studies reported that oxygen saturation indices showed a stronger correlation with long‐term health outcomes including cardiovascular complications compared to AHI values. 16 , 17 Nonetheless, clinical evidence on the relationship between the reduction in respiratory events and increase in oxygenation levels following treatment is limited.
Therefore, the aim of this study was to quantitatively verify the relationship between alterations in AHI and oxygen saturation and hypoxic burden levels following OA treatment in OSA patients and evaluate polysomnography (PSG) and clinical parameters associated with persistent oxygen desaturation, in spite of improvement in AHI values. Such results should be considered when assessing OSA treatment efficacy and the possibility of adverse health outcomes related to OSA.
2. MATERIALS AND METHODS
2.1. Subjects
Patients aged 18 years or older with the complaint of snoring and respiratory problems during sleep, diagnosed to have mild‐to‐severe OSA (AHI ≥ 5/h), then referred to the Sleep Apnea Dental Clinic at the University of British Columbia (UBC) or to an affiliated private practice for OSA treatment with an OA from January, 2001 to September, 2016 were included in this retrospective study. Those with an initial diagnosis of moderate‐to‐severe OSA (AHI ≥ 15/h) or mild OSA (AHI ≥ 5/h) with associated symptoms including excessive daytime sleepiness were included only after the patient failed or refused to try CPAP treatment. As inclusion criteria, all subjects underwent clinical and pre‐ and post‐treatment PSG evaluation at the same laboratory for OSA diagnosis and treatment efficacy evaluation.
All patients received an OA at the same university clinic. During clinical examination for OA eligibility, patients with advanced periodontitis, dental caries requiring treatment, active temporomandibular joint disorders and/or less than 6 remaining posterior teeth were excluded. Also, those with uncontrolled psychological, respiratory or cardiovascular disease, pregnancy, acute or chronic systemic inflammatory disease, previous OA or surgical treatment for OSA and lacking comparable PSG data were excluded. Initially, 91 patients diagnosed and treated for OSA were selected for the analysis. Seventeen participants lacked appropriate post‐treatment oxygen saturation data. Following the final grouping criteria of treatment responders, we excluded 26 participants that did not show an improvement in both AHI and minimum oxygen saturation levels. The final complete sample was obtained in 48 patients on which final analysis was conducted.
This study was conducted in accordance with the amended Declaration of Helsinki. Approval for the study was obtained from the UBC Clinical Research Ethics Board (H20‐02643) and permission was obtained from the dataset owner to use the information for the purposes of the research. This was a retrospective clinical chart review study and acquired data was kept anonymized. The UBC Clinical Research Ethics Board granted exemption from obtaining informed consent.
2.2. Oral appliance treatment
All patients were fitted with a custom made titratable mandibular advancement OA (Klearway [Great Lakes Orthodontics] and SomnoDent [SomnoMed]). The amount of initial advancement was set at two‐thirds of the possible maximum protrusion, and then further advanced by 0.25 mm increments until self‐reported resolution of snoring and related symptoms such as daytime sleepiness. Advancements were also stopped when the patient complained of any discomfort due to the appliance. Vertical opening was kept to a minimum of 3–5 mms. Optimal titration was verified by a follow‐up sleep study. Recall checks were done every month for the initial 4 months. Patients that were comfortable with their OA after 4 months were scheduled for recall checks at 6 months, 1 year, and 2 years after wearing the appliance.
2.3. Polysomnographic evaluation of OSA
Attended standardised PSG was performed pre‐ and post‐treatment in the same hospital sleep clinic and scored according to the American Academy of Sleep Medicine (AASM) criteria. 18 The apnoea‐hypopnoea index (AHI), AI, and HI in both NREM and REM sleep, respiratory related and spontaneous arousal indices, and positional dependency and REM relatedness of the respiratory events were evaluated. OSA was defined as mild (AHI 5–14/h), moderate (AHI 15–29/h) or severe (AHI ≥30/h). Positional OSA patients were defined as those with a supine AHI to non‐supine AHI ratio >2. 19 REM‐related OSA patients were defined as those with a NREM AHI < 15 and a REM AHI to NREM AHI ratio >2. 20 The hypopnoea/apnoea ratio (HAR) was also calculated to evaluate the extent of upper airway collapsibility. 21 Patients were classified as apnoea‐predominant (HAR ≤ 0.5), hypopnoea‐predominant (HAR > 2) and indeterminate (0.5 < HAR ≤ 2). 22
To evaluate the hypoxic burden, mean and longest duration of apnoeas and hypopnoeas were gathered and the mean duration of apnoea plus hypopnoea was used to group patients into 4 different groups (10 to ≤20 s; 20 to≤30 s; 30 to ≤40 s; and >40 s). 23 Minimum (min O2) and mean (mean O2) oxygen saturation were recorded in total sleep, NREM and REM sleep. The value for total sleep was used to group the patients (min O2 ≥ 85% or <85%; mean O2 ≥ 96% or <96%). 24 , 25 The percentage of time spent below an oxygen saturation of 90% (T90) was also recorded. Oxygen desaturation index (ODI) was calculated as the number of times per hour of sleep that blood oxygen level dropped by ≥3% from baseline. ODI was graded into four groups; normal (ODI < 5), mild (ODI 5–14/h), moderate (ODI 15–29/h) and severe (ODI ≥30/h).
The periodic limb movement (PLM) index and PLM related arousal index were recorded and analysed.
Pre‐treatment PSG was performed at the latest 1 month before treatment initiation. The duration between the pre‐ and post‐treatment PSG studies were 2.23 ± 2.10 years (mean ± standard deviation [SD]).
On the night of both PSGs, patients completed questionnaires with items related to medical history, sleep symptoms and medications. Patients were divided into normal (body mass index [BMI] < 25), overweight (25 ≤ BMI < 30) and obese class 1 (30 ≤ BMI < 35), class 2 (35 ≤ BMI < 40) and class 3 (BMI ≥ 40). 26
2.4. Defining treatment responsiveness and success
Patients were classified into three responder groups according to the relationship between change in AHI and min O2 level post‐treatment: responderAHIonly (AHI responder but min O2 non‐responder, i.e., decrease in AHI of ≥50% but increase in min O2 level of <4% or decrease from baseline), responderMinO2only (AHI non‐responder but min O2 responder, i.e., increase in min O2 level of ≥4% but decrease in AHI <50% or increase from baseline) and responderCongruous (both AHI and min O2 responder, decrease in AHI of ≥50% and increase in min O2 level of ≥4%). The min O2 level was used as grouping criteria considering its close relationship to cardiovascular health outcomes. 17 , 24 The cut‐off value for AHI and min O2 was decided based on previous reports. 9 , 27
Treatment success was defined as follows: the resolution of OSA (AHI < 5), treatment success (5 ≤ AHI ≤ 10), suboptimal treatment (10 < AHI ≤ 20) and treatment failure (AHI > 20). 28
2.5. Statistical analysis
Kolmogorov–Smirnov and Shapiro–Wilk tests were used to test the normality of data and each following test was selected accordingly. Differences in demographic and clinical parameters and polysomnographic characteristics based on the treatment responder groups were analysed by one‐way ANOVA, Kruskal–Wallis one‐way ANOVA, and chi‐square test. Post‐hoc analyses were conducted by Bonferroni correction. Differences in clinical and polysomnographic characteristics before and after OA treatment in each responder response group were analysed by the paired t‐test, Wilcoxon Rank‐sum test, chi‐square test and McNemar's test. Correlations of pre‐treatment polysomnographic and clinical variables and post‐treatment oxygen saturation levels and hypoxic burden variables were analysed by Pearson's correlation coefficient. Multiple linear regression analysis was used to estimate the relationship between pre‐treatment polysomnographic and clinical variables as independent variables and post‐treatment oxygen saturation levels as dependent variables. Regression analysis was also applied to analyse the magnitude of change in each oxygen saturation and hypoxic burden variable according to a unit change in AHI value in each group. The receiver operating characteristic (ROC) curve and area under the curve (AUC) for being a minimum oxygen saturation responder were analysed to obtain cut‐off values of polysomnographic and clinical variables that showed a significant association with post‐treatment oxygen saturation levels through regression analyses. The role of AUC as discriminating cut‐off values was considered acceptable 0.7–0.8, excellent if values were between 0.8–0.9 or outstanding discrimination if values were >0.9. Calculation for likelihood ratios and predictive values were done with an online programme (https://www.medcalc.org/calc/diagnostic_test.php). All statistical analysis was performed using SPSS 22.0 software programme (IBM). Results were considered statistically significant at a level of p < .05.
3. RESULTS
3.1. Clinical characteristics and treatment responses of the study group
Initially, 74 patients who were referred for OA therapy for the treatment of OSA completed pre‐ and post‐treatment PSG evaluation at the same institution. As per our study criteria, we excluded from our final analysis 26 (35.14%) patients, as they were non‐responders and showed less than 50% reduction in AHI and less than 4% increase in min O2 level following OA treatment. The other 48 (64.86%) patients were responders who showed either a ≥50% reduction in AHI and/or ≥4% increase in min O2. There were no significant differences in age, gender, BMI, AHI, min O2 level, mean apnoea and hypopnoea duration before treatment between responders and non‐responders; however, non‐responders had a significantly longer mean apnoea duration post‐treatment (p = .034, data not shown).
Thirty‐nine participants (81.25%) showed a ≥50% decrease in AHI and 22 (45.83%) showed a ≥4% increase in min O2 level post‐treatment. Sixteen showed resolution (AHI < 5, 33.33%), 17 success (5 ≤ AHI ≤ 10, 35.42%), 11 suboptimal (10 < AHI ≤ 20, 22.92%) and 4 failure (AHI > 20, 8.33%), following treatment. There were 26 (54.17%) in the responderAHIonly group showing a ≥50% improvement in AHI while the min O2 level improved minimally or did not improve; 9 (18.75%) were in the responderMinO2only group showing a ≥4% improvement in min O2 level while the AHI improved minimally or did not improve, and 13 (27.08%) were responderCongruous showing an improvement in both variables with a ≥50% decrease in AHI and ≥4% increase in min O2 level. There were no significant differences in confounders such as age, gender, BMI, and cardiovascular conditions both pre‐ and post‐treatment among responder groups. The mean age was lower and BMI was higher both pre‐ and post‐treatment in the responderAHIonly group, and there were more females compared to the other groups; however, the difference was not statistically significant. As shown in Table 1, there was no significant weight change in any of the groups. The average change in weight was −2.79 ± 16.92 kg.
TABLE 1.
Baseline and post‐treatment clinical characteristics of the responder groups
| Variables | ResponderAHIonly (N = 26) | ResponderMinO2only (N = 9) | ResponderCongruous (N = 13) | Total (N = 48) | p‐Value |
|---|---|---|---|---|---|
| Pre‐OA | |||||
| Age (years) a | 50.50 (12.37) | 55.44 (10.73) | 55.08 (10.57) | 52.67 (11.63) | .381 |
| Gender (male/female) b | 15/11 | 6/3 | 9/4 | 30/18 | .750 |
| Weight (kg) a | 86.10 (22.04) | 81.00 (15.77) | 80.15 (13.01) | 83.53 (18.76) | .595 |
| BMI (kg/m2) a | 29.68 (7.35) | 27.50 (4.15) | 27.02 (4.05) | 28.55 (6.12) | .384 |
| Obesity group b (normal/overweight/obese class 1/2/3) | 8/7/6/3/2 | 3/3/2/1/0 | 4/5/4/0/0 | 15/15/12/4/2 | .873 |
| Abnormal cardiac rhythm b (normal/abnormal) | 11/1 | 3/0 | 8/2 | 22/3 | .558 |
| AHI a | 26.11 (19.97) | 30.09 (18.64) | 32.36 (17.34) | 28.55 (18.86) | .609 |
| Min O2 saturation (%) a | 90.10 (2.94)* | 77.19 (13.12)* | 80.55 (7.00)* | 85.09 (8.83) | .000* |
| Post‐OA | |||||
| Weight (kg) a | 87.66 (22.67) | 80.31 (11.14) | 80.12 (13.30) | 84.25 (18.84) | .417 |
| BMI (kg/m2) a | 30.04 (7.45) | 27.30 (2.94) | 26.38 (4.15) | 28.53 (6.20) | .187 |
| Obesity group b (normal/overweight/obese class 1/2/3) | 7/9/3/4/2 | 2/4/2/0/0 | 5/4/4/0/0 | 14/17/9/4/2 | .470 |
| Abnormal cardiac rhythm b (normal/abnormal) | 6/1 | 2/2 | 5/2 | 13/5 | .444 |
| AHI a | 6.56 (7.62)* | 21.97 (11.58)* | 8.75 (5.29)* | 10.04 (9.76) | .000* |
| Min O2 saturation (%) a | 89.52 (5.14) | 86.56 (8.45) | 90.77 (4.07) | 89.30 (5.70) | .228 |
| Pre‐ and post‐PSG interval (days) a | 751.81 (587.46) | 798.00 (838.46) | 707.62 (569.20) | 748.50 (622.01) | .947 |
| Change in weight b (same/gain/loss) | 20/2/3 | 6/1/1 | 12/0/1 | 38/3/5 | .779 |
| Change in obesity group b (same/gain/loss) | 20/2/3 | 6/1/1 | 12/0/1 | 38/3/5 | .779 |
| Treatment success b (resolution/success/suboptimal/failure) | 11/14/0/1* | 0/0/6/3* | 5/3/5/0* | 16/17/11/4 | .000* |
Abbreviations: AHI, apnoea‐hypopnoea index; BMI, body mass index; Min O2, minimum oxygen saturation level; OA, oral appliance; PSG, polysomnography.
*Significant difference: p < .05.
Differences among groups were tested with t‐test: Mean (SD).
Differences among groups were tested with Chi‐square test.
3.2. Magnitude of change in oxygen saturation and hypoxic burden parameters with oral appliance treatment
In the responderAHIonly group, 1‐unit change in AHI corresponded to 0.640 change in ODI. In the responderMinO2only group, 1‐unit change in AHI corresponded to 0.810 change in mean O2 and 0.803 change in T90. In the responderCongruous group,1‐unit change in AHI corresponded to 0.701 change in T90, 0.935 change in ODI, 0.586 change in mean hypopnoea duration and 0.627 change in longest hypopnoea duration. One‐unit change in AHI corresponded to 0.710 change in ODI in the total responder group. The coefficients for all oxygen saturation and hypoxic burden related variables are shown in Table 2.
TABLE 2.
Correlation coefficients based on linear regression analysis of change in oxygen saturation and hypoxic burden parameters following oral appliance treatment
| Variables (per 1 unit change of AHI) | ResponderAHIonly (N = 26) | ResponderMinO2only (N = 9) | ResponderCongruous (N = 13) | Total (N = 48) |
|---|---|---|---|---|
| Mean O2 saturation (%) | .059 | .810** | .278 | .108 |
| Min O2 saturation (%) | .098 | .611 | .249 | .090 |
| T90 (%TST) | .058 | .803** | .701** | .186 |
| ODI (events/h) | .640* | .797 | .935** | .710** |
| Mean apnoea duration (s) | .045 | .180 | .239 | .008 |
| Longest apnoea duration (s) | .109 | .016 | .092 | .122 |
| Mean hypopnoea duration (s) | .016 | .309 | .586* | .130 |
| Longest hypopnoea duration (s) | .006 | .008 | .627* | .003 |
Abbreviations: AHI, apnoea‐hypopnoea index; Min O2, minimum oxygen saturation level; ODI, oxygen desaturation index; T90, percentage of time spent oxygen saturation <90%; TST, total sleep time.
*Significant difference: p < .0.
**Significant difference: p < .01.
3.3. Polysomnographic characteristics of different responder groups’ oxygen saturation and hypoxic burden levels
For the total sample (N = 48), treatment resulted in an increase in mean and min O2 level of 0.12 ± 1.73% and 4.22 ± 7.06%, respectively. There was a decrease in T90 of 1.36 ± 6.03% and a decrease in ODI (N = 24) of 9.58 ± 10.98. The decrease in mean and longest apnoea duration was 5.44 ± 14.48 and 10.50 ± 31.70 s, respectively. The decrease in mean and longest hypopnoea duration was 0.89 ± 9.80 and 2.45 ± 35.33 s, respectively.
Table 3 describes the oxygen saturation levels and hypoxic burden according to responder groups. There was a significant increase in mean O2 levels for both responderMinO2only and responderCongruous, while the level decreased in responderAHIonly following treatment. On the other hand, mean O2 in NREM only did not show a significant change after treatment in responderMinO2only. The pre‐treatment mean O2 in REM was lowest in responderMinO2only. There was a significant difference among groups in pre‐treatment min O2 with responderMinO2only showing the lowest values. The difference in min O2 levels were no longer significant post‐treatment. The min O2 decreased and T90 increased only in the responderAHIonly. There were significantly more patients in the low min O2 (<85%) group in the responderMinO2only pre‐treatment.
TABLE 3.
Polysomnographic characteristics according to responder group‐oxygen saturation and hypoxic burden
| Variables | ResponderAHIonly (N = 26) | ResponderMinO2only (N = 9) | ResponderCongruous (N = 13) | |||
|---|---|---|---|---|---|---|
| Pre‐OA | Post‐OA | Pre‐OA | Post‐OA | Pre‐OA | Post‐OA | |
| Mean O2 saturation (%) a | 95.47 (1.85)** | 94.66 (2.80)** | 93.99 (3.04)** | 95.12 (2.21)** | 94.99 (1.52)** | 96.28 (1.66)** |
| NREM a mean O2 | 95.28 (1.98)** | 94.62 (2.57)** | 95.04 (1.69) | 95.51 (1.81) | 95.32 (1.43)** | 96.21 (1.51)** |
| REM a mean O2 | 95.65 (1.79)*,** | 94.70 (3.11)** | 92.93 (4.74)*,** | 94.73 (3.17)** | 94.67 (1.85)*,** | 96.35 (1.90)** |
| Min O2 saturation (%) a | 90.10 (2.94)* | 89.52 (5.14) | 77.19 (13.12)*,** | 86.56 (8.45)** | 80.55 (7.00)*,** | 90.77 (4.07)** |
| NREM a min O2 | 89.35 (3.56)* | 88.50 (6.14) | 76.40 (13.11)*,** | 88.11 (5.21)** | 83.56 (6.22)*,** | 91.23 (3.14)** |
| REM a min O2 | 90.83 (3.58)* | 90.54 (5.16) | 78.00 (14.63)*,** | 85.00 (12.00)** | 77.53 (10.66)*,** | 90.31 (5.17)** |
| T90 (%TST) a | 3.81 (14.46) | 4.80 (18.93) | 7.40 (10.08)** | 2.68 (5.35)** | 4.39 (5.66)** | 0.64 (1.65)** |
| Mean O2 group b (O2 ≥ 96%/<96%) | 13/13 | 9/17 | 3/6** | 4/5** | 4/9 | 8/5 |
| Min O2 group b (O2 ≥ 85%/<85%) | 25/1* | 22/4 | 3/6* | 7/2 | 5/8* | 12/1 |
| ODI a | 17.03 (12.86)** (n = 13) | 5.98 (4.61)** (n = 17) | 22.78 (24.82) (n = 5) | 14.13 (13.61) (n = 6) | 16.83 (14.41) (n = 6) | 6.23 (5.91) (n = 7) |
| ODI severity b (normal/mild/moderate/severe) | 3/3/4/3** | 7/10/0/0** | 1/1/2/1 | 1/4/0/1 | 2/1/2/1 | 4/2/1/0 |
| Mean apnoea duration (s) c | 17.15* (13.78, 22.10) | 13.80* (0.00, 18.43) | 25.70* (16.80, 29.10) | 23.80* (9.00, 29.90) | 28.30*,** (16.30, 34.35) | 18.90*,** (6.15, 27.75) |
| Longest apnoea duration a | 23.13 (15.13)* | 15.32 (17.99)* | 51.93 (37.79)* | 54.07 (45.62)* | 49.44 (29.85)*,** | 24.82 (21.51)*,** |
| Mean hypopnoea duration a | 24.12 (6.80) | 23.72 (9.38) | 25.74 (4.97) | 29.07 (8.55) | 25.22 (6.31) | 26.99 (6.27) |
| Longest hypopnoea duration a | 58.58 (21.13)** | 45.75 (22.49)*,** | 64.31 (16.18) | 91.79 (37.44)* | 58.49 (20.25) | 56.09 (23.54)* |
| A‐H duration group b , d (1/2/3/4) | 1/5/9/11 | 2/8/8/8 | 0/0/2/7 | 0/1/2/6 | 1/0/2/8 | 1/1/3/8 |
| Change in mean O2 a | −0.81 (1.59)* | 1.13 (1.15)* | 1.28 (1.24)* | |||
| Change in min O2 a | −0.57 (4.64)* | 9.36 (5.78)* | 10.22 (4.42)* | |||
| Change in T90 a | 1.00 (5.40)* | −4.72 (6.19)* | −3.75 (5.40)* | |||
| Change in ODI c | −8.40 (−16.18, −1.07) | −5.95 (−20.38, 9.83) | −10.30 (−15.10, −0.57) | |||
Abbreviations: A‐H, apnoea‐hypopnoea; AHI, apnoea‐hypopnoea index; Min O2, minimum oxygen saturation level; NREM, non‐rapid eye movement; OA, oral appliance; ODI, oxygen desaturation index; REM, rapid eye movement; T90, percentage of time spent oxygen saturation <90%; TST, total sleep time.
*Significant difference: p < .05, comparison among responder groups.
**Significant difference: p < .05, comparison between pre‐ and post‐oral appliance treatment.
Differences among groups were tested with one‐way ANOVA test and pre‐ and post‐OA data within groups were tested with paired t‐test: Mean (SD).
Differences among groups and pre‐ and post‐OA data were tested with Chi‐square test.
Differences among groups were tested with Kruskal–Wallis one‐way ANOVA test and pre‐ and post‐OA data were tested with Wilcoxon Rank‐sum test: Median (lower quartile, upper quartile).
1: 10 to ≤20 s; 2: 20 to ≤30 s; 3: 30 to ≤40; 4: >40 s.
Although there was a decrease in oxygen saturation in responderAHIonly, there was a significant decrease in ODI post‐treatment in this group. The ODI values decreased in the other 2 groups but the difference was not statistically significant.
There was a significant difference in mean and longest apnoea duration pre‐ and post‐treatment among responder groups with responderAHIonly showing the shortest duration for both values at both measurements. There was a significant decrease in both values post‐treatment only in the responderCongruous group. The mean hypopnoea duration decreased only in the responderAHIonly, while this value increased in the other 2 responder groups. Although there were no significant differences pre‐treatment, the longest hypopnoea duration was significantly higher in the responderMinO2only post‐treatment. The longest hypopnoea duration significantly decreased only in the responderAHIonly.
3.4. Polysomnographic characteristics of different responder groups’ respiratory parameters
The average amount of reduction in AHI for the total sample was 18.51 ± 14.61 (63.97 ± 27.70% change). Table 4 describes the differences in respiratory parameters between responder groups. In the responderMinO2only group, AHI was reduced only 20.43 ± 31.77%, although the decrease in AHI post‐treatment was significant in all 3 groups.
TABLE 4.
Polysomnographic characteristics according to responder group‐respiratory parameters
| Variables | ResponderAHIonly (N = 26) | ResponderMinO2only (N = 9) | ResponderCongruous (N = 13) | |||
|---|---|---|---|---|---|---|
| Pre‐OA | Post‐OA | Pre‐OA | Post‐OA | Pre‐OA | Post‐OA | |
| AHI a | 26.11 (19.97)** | 6.56 (7.62)*,** | 30.09 (18.64)** | 21.97 (11.58)*,** | 32.36 (17.34)** | 8.75 (5.29)*,** |
| REM AHI a | 26.55 (23.12)*,** | 9.19 (13.39)*,** | 33.02 (16.10)* | 30.60 (12.39)* | 45.26 (13.60)*,** | 17.15 (13.81)*,** |
| NREM AHI a | 25.08 (19.77)** | 5.84 (8.86)*,** | 26.88 (20.85) | 19.44 (12.97)* | 29.17 (19.74)** | 7.00 (5.55)*,** |
| AI a | 2.98 (3.91)* | 1.50 (4.96) | 12.82 (18.57)* | 4.83 (5.52) | 9.75 (14.03)*,** | 1.84 (2.56)** |
| REM AI a | 3.01 (6.37)* | 1.26 (3.37)* | 16.19 (15.82)* | 12.70 (13.04)* | 21.61 (20.71)*,** | 4.86 (8.69)*,** |
| NREM AI b | 0.75** (0.00, 4.60) | 0.00** (0.00, 0.85) | 2.00 (0.20, 18.40) | 0.40 (0.20, 4.65) | 3.00** (0.20, 19.60) | 0.60** (0.00, 1.90) |
| HI a | 22.44 (18.55)** | 4.82 (3.49)*,** | 15.78 (4.80) | 16.79 (8.68)* | 17.51 (12.80)** | 6.60 (4.17)*,** |
| REM HI a | 23.55 (21.49)** | 7.92 (13.04)** | 16.83 (13.86) | 17.90 (10.83) | 23.65 (17.34) | 12.29 (11.43) |
| NREM HI a | 22.12 (18.96)** | 4.26 (4.08)*,** | 15.39 (5.34) | 16.37 (9.77)* | 16.18 (12.76)** | 5.48 (4.26)*,** |
| CI a | 0.69 (1.54) | 0.24 (0.47) | 1.49 (2.62) | 0.34 (0.89) | 0.15 (0.36) | 0.31 (0.82) |
| OSA severity c (normal/mild/moderate/severe) | 1/6/12/7** | 11/14/0/1*,** | 0/0/7/2** | 0/3/4/2*,** | 0/3/4/6 | 5/7/1/0* |
| Supine AHI a | 38.92 (33.37)** | 10.29 (18.04)*,** | 43.14 (27.72) | 27.47 (11.84)* | 36.85 (22.06)** | 14.74 (17.49)*,** |
| Non‐supine AHI a | 19.55 (23.76)** | 5.11 (6.10)*,** | 14.18 (11.43) | 17.14 (14.48)* | 15.56 (15.13)** | 4.87 (3.73)*,** |
| Supine time (h) a | 2.08 (1.80) | 1.59 (1.50) | 3.00 (2.44) | 3.00 (1.09) | 2.67 (2.33) | 2.48 (2.15) |
| Positional OSA c (positional/non) | 12/14 | 11/15 | 5/4 | 3/6 | 8/5 | 7/6 |
| REM‐related OSA c (related/not) | 7/19 | 11/15 | 3/6 | 4/5 | 6/7 | 8/5 |
| HAR b | 6.67 (2.83, 23.67) | 4.13 (1.24, 10.61) | 2.44** (0.73, 9.02) | 3.25** (1.80, 4.51) | 2.45 (0.37, 17.58) | 3.61 (1.82, 13.58) |
| Event type dominance c , d (apnea/hypopnea/neither) | 1/24/1* | 0/21/5 | 1/5/3* | 0/7/2 | 3/7/3* | 0/11/2 |
| Change in AHI (%) a | 75.24 (13.19)* | 20.43 (31.77)* | 71.56 (14.55)* | |||
Abbreviations: AHI, apnoea‐hypopnoea index; AI, apnoea index; CI, central index; HAR, hypopnoea/apnoea ratio; HI, hypopnoea index; Min O2, minimum oxygen saturation level; NREM, non‐rapid eye movement; OA, oral appliance; OSA, obstructive sleep apnoea; REM, rapid eye movement.
*Significant difference: p < .05, comparison among responder groups.
**Significant difference: p < .05, comparison between pre‐ and post‐oral appliance treatment.
Differences among groups were tested with one‐way ANOVA test and pre‐ and post‐OA data within groups were tested with paired t‐test: Mean (SD).
Differences among groups were tested with Kruskal–Wallis one‐way ANOVA test and pre‐ and post‐OA data were tested with Wilcoxon Rank‐sum test: Median (lower quartile, upper quartile).
Differences among groups were tested with Chi‐square test and pre‐ and post‐OA data were tested with McNemar's and chi‐square test.
Apnoea‐predominant: HAR ≤ 0.5; hypopnoea‐predominant: HAR > 2; neither: 0.5 < HAR ≤ 2.
There was a significant difference in the pre‐treatment REM AHI among the responder groups with the responderCongruous showing the highest value and the difference evident between responderMinO2only and responderCongruous. The pre‐treatment AI and REM AI values were also significantly different among responder groups; however, this difference did not persist following treatment. Such a significant difference among responder groups did not exist for pre‐treatment NREM AI.
There was a significant difference among the responder groups in post‐treatment HI and NREM HI values although the difference was not significant pre‐treatment. ResponderMinO2only showed the highest value that significantly differed from the other two responder groups. The differences for post‐treatment HI and NREM HI were evident between responderMinO2only and other groups. There was a significant difference in post‐treatment supine and non‐supine AHI among the groups although there was no difference pre‐treatment.
Only the responderMinO2only with the highest rate of apnoea dominance pre‐treatment showed a significant increase in HAR following OA treatment.
3.5. Correlation between pre‐treatment variables and amount of change in oxygen saturation and hypoxic burden levels
A higher pre‐treatment AHI showed a significant correlation with a smaller amount of change in T90 (r = −.323) and ODI (r = −.714) with treatment. A higher pre‐treatment mean O2 (r = −.342) and mean O2 in REM (r = −.445) showed a significant correlation with a smaller amount of change in min O2 with treatment. A higher pre‐treatment min O2 and min O2 in NREM and REM showed a significant correlation with a smaller amount of change in mean (r = −.486; r = −.406; r = −.479, respectively) and min O2 (r = −.764; r = −.651; r = −.744, respectively) and greater change in T90 (r = .510; r = .467; r = .471, respectively) with treatment. A higher pre‐treatment ODI showed a significant correlation with a smaller amount of change in ODI with treatment (r = −.872). A higher pre‐treatment mean apnoea (r = −.423) and hypopnoea (r = −.316) duration showed a significant correlation with a smaller amount of change in apnoea‐hypopnoea duration with treatment (data not shown).
3.6. Pre‐treatment variables predicting post‐treatment oxygen saturation and hypoxic burden levels
Multiple linear regression analysis results with post‐treatment oxygen saturation and hypoxic burden indices as dependent variables are shown in Table 5. Pre‐treatment min O2 and T90 were independent factors negatively associated with post‐treatment mean O2 levels. Pre‐treatment BMI, amount of REM sleep, mean O2 and mean apnoea duration were independent factors showing a significant correlation with post‐treatment min O2 levels. Pre‐treatment AHI and min O2 were positively associated, while BMI, respiratory arousal index and ODI were negatively associated with post‐treatment T90.
TABLE 5.
Multiple regression of pre‐treatment variables predicting post‐treatment oxygen saturation and hypoxic burden levels
| Predictor variable | Mean O2 | Min O2 | T90 |
|---|---|---|---|
| BMI | 0.011 | 0.475* | −0.147* |
| AHI | −0.463 | 0.426 | 0.577** |
| HAR | 0.155 | 0.033 | −0.042 |
| REM sleep | 0.056 | 0.659** | −0.096 |
| Respiratory arousal index | 0.334 | −0.783 | −0.408** |
| Mean O2 | – | 1.425** | −0.212 |
| Min O2 | −0.767* | – | 0.371** |
| T90 | −0.652** | 0.106 | – |
| ODI | −0.043 | 0.147 | −0.337** |
| Mean apnoea duration | −0.197 | −0.690** | 0.051 |
| Mean hypopnoea duration | −0.055 | 0.035 | −0.016 |
All regression coefficients are standardized.
Abbreviations: AHI, apnoea‐hypopnoea index; BMI, body mass index; HAR, hypopnoea/apnoea ratio; Min O2, minimum oxygen saturation; ODI, oxygen desaturation index; REM, rapid eye movement; T90, percentage of time spent oxygen saturation <90%.
Significant difference: *p < .05; **p < .01.
3.7. Effectiveness of pre‐treatment polysomnographic variables to predict the treatment outcome of being a minimum oxygen saturation responder
As shown in Figure 1, there were 5 baseline PSG characteristics, which showed statistically significant chances to predict patients being in the responderMinO2only group. As the receiver operating characteristic (ROC) curve analysis shows, pre‐treatment min O2 level with a cut‐off value of 86.25% leads to a AUC of 0.925 (sensitivity 77.27% [95% confidence interval [CI]: 54.63–92.18], specificity 92.31% [95% CI: 74.87–99.05], positive predictive value (PPV) 89.47% [95% CI: 68.77–97.04], negative predictive value (NPV) 82.76% [95% CI: 68.79–91.27]), T90 higher than 1.25% leads to an AUC of 0.761 (sensitivity 68.18% [95% CI: 45.13–86.14], specificity 80.77% [95% CI: 60.65–93.45], PPV 75.00% [95% CI: 56.48–87.40], NPV 75.00% [95% CI: 61.27–85.05]), longest apnoea duration with a 44.2 second cut‐off value leads to an AUC of 0.742 (sensitivity of 59.09% [95% CI: 36.35–79.29], specificity 96.15% [95% CI: 80.36–99.90], PPV 92.86% [95% CI: 64.84–98.92], NPV 73.53% [95% CI: 62.56–82.20]) and mean apnoea‐hypopnoea duration with a 47.45 second cut‐off value leads to an AUC of 0.706 (sensitivity of 68.18% [95% CI: 45.13–86.14], specificity 73.08% [95% CI: 52.21–88.43], PPV 68.18% [95% CI: 51.69–81.10], NPV 73.08% [95% CI: 58.51–83.93]).
FIGURE 1.
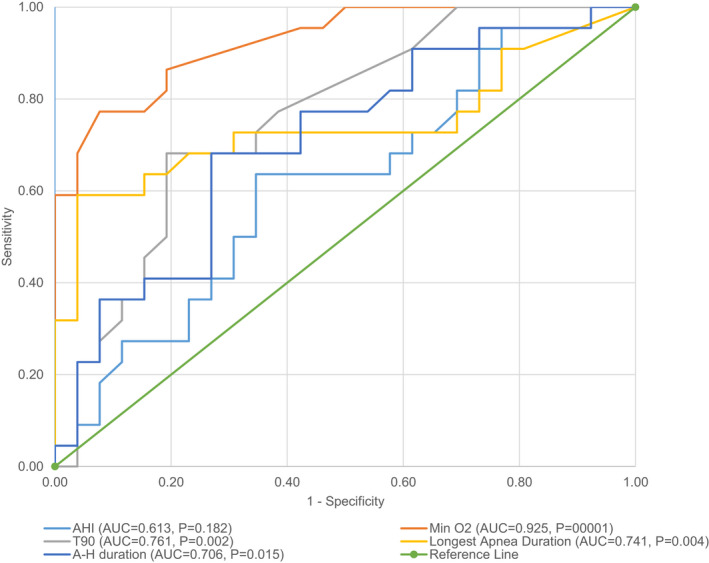
Receiver operating characteristic (ROC) curves comparisons for pre‐treatment polysomnographic variables of minimum oxygen saturation responders (≥4% increase post‐treatment). The diagnostic ability was significantly different between the analytic methods (p < .001). A‐H, apneaapnoea‐hypopneahypopnoea; AHI, apneaapnoea‐hypopneahypopnoea index; AUC, area under the curve; Min O2, minimum oxygen saturation level; T90, percentage of time spent oxygen saturation <90%
All showed higher than acceptable discrimination ability with relatively high sensitivity and specificity to predict those who would show a ≥4% increase in min O2 following treatment. Pre‐treatment AHI was not effective (AUC: 0.613) in doing so.
4. DISCUSSION
This is the first study to define groups according to disparity in the improvement of AHI and min O2 saturation levels following OA treatment for OSA and quantitatively analyse the change in oxygenation and hypoxic burden levels in relation to respiratory indices. The results showed that 35% of OSA patients treated with an OA do not show a significant decrease in AHI nor a notable increase in oxygen saturation levels. Furthermore, 47% showed a discrepancy between the improvement of AHI and oxygen saturation levels with OA treatment, as 35% showed only a significant improvement in the AHI and 12% only improvements in the oxygen saturation levels. Such results are the first to quantitatively show the mismatch in the treatment response rate based on the two most commonly applied indices in measuring OSA treatment outcomes. In spite of the betterment of airflow through OA treatment, many patients did not experience a significant improvement in their oxygenation levels and the rate of treatment success may vary according to the criteria that was implemented.
Although AHI has been widely accepted as a standard to diagnose and evaluate OSA, long‐term adverse health outcomes are not only related to airflow and arousals but also hypoxaemia. Studies show that min O2 is a better prognostic factor in the evaluation of cardiovascular comorbidities. 16 , 17 , 24 AHI alone often shows only weak correlation with OSA related complications and plays a stronger role in the progress of cardiovascular problems when combined with nocturnal hypoxaemia. 14 , 15 , 17 However, treatment success for OSA has been traditionally defined solely on the basis of AHI. The results of this study showed that the improvement in min O2 level was less than 4% in 35% of the OSA patients treated with OA who would have been considered successfully treated based on the >50% AHI reduction criterion. Applying AHI as the sole criteria for the decision of OA titration could lead to deleterious long‐term health outcomes especially those related to cardiovascular damage due to intermittent hypoxaemia. This is in line with a previous study showing that the min O2 of severe OSA patients remained below 90% even with OA treatment, suggesting the need to evaluate treatment success based on oxygen saturation levels. 29 Min O2 rather than mean O2 was used as a grouping criteria in this investigation based on studies showing its close relationship with general health outcomes such as cognition and cardiovascular disease. 30 , 31 Based on a recent review, OA reduces ODI by 9.6 events per hour on average, and the amount of improvement in oxygenation levels was estimated as an improvement of mean and minimum oxygen saturation levels of 2.9% and 3.7%, respectively. 27 Such values are in line with those from our study which shows an average increase in min O2 level of 4.2% and decrease in ODI of 9.58 ± 10.98 following OA treatment. However, in the present study, the increase in mean O2 level was 0.12 ± 1.73%, which is lower compared to the estimate from other studies on OA treatment. This may be due to the fact that patients of this study were of a relatively higher severity (AHI: 28.55 ± 18.86) while most studies on OA treatment are based on mild to moderate OSA patients. The improvement level in T90 has rarely been reported with OA therapy. Results with CPAP showed approximately a 2.6% decrease in T90, which is higher than the 1.36 ± 6.03% reduction achieved with our patients after OA therapy. 32
The disparity observed in the improvement of AHI and min O2 in the patients of our study could be partially explained by the difference in baseline oxygenation levels. Min O2 was significantly lower for the responderMinO2only group before treatment; however, such significance was lost following OA therapy and the min O2 level was similar in all 3 responder groups post‐treatment at a level converging to approximately 90%. Those with a very low min O2 level pre‐treatment may show the largest amount of improvement in hypoxaemia levels, while those with a relatively higher min O2 level pre‐treatment will show minimal improvement in spite of the decrease in AHI. Such incongruity between the two indices can also be seen in the correlation coefficients from regression analysis showing a lack of significance in the amount of change in Min O2 in relation to 1‐unit change of AHI. One could speculate based on the higher efficacy of CPAP compared to OA in correcting hypoxaemia that there would be less patients that show a minimal amount of improvement in oxygenation levels when the AHI value is sufficiently rectified. 33 Studies based on CPAP showed a 9%–22% increase in min O2 post‐treatment. 34 , 35 A low baseline min O2 should not be a contra‐indication of OA treatment as we found that patients with an average min O2 of <86% tend to show a greater response to OA treatment.
Pre‐treatment mean O2 showed a significant difference among responder groups only in REM sleep and the amount of time spent in REM sleep pre‐treatment was significantly related to post‐treatment min O2 levels. This could implicate a sleep stage dependency in treatment response. It is well known that OSA worsens during REM sleep and REM OSA may act as an independent risk factor for adverse health outcomes. 36
ROC curve analysis showed that pre‐treatment min O2 level showed the strongest ability to predict those who would show a ≥4% increase in min O2 following OA treatment, while pre‐treatment AHI was not effective. Pre‐treatment min O2 ≤86.25% could be considered in patient selection and setting treatment goals as such patients are likely to show a ≥4% increase in min O2 following treatment.
The respiratory events were differently constituted as responderMinO2only had an increased HAR after treatment where the responderAHIonly group showed a decrease in this ratio. The marked elimination of apnoeas may have led to the significant increase in min O2 levels in the responderMinO2only group. OA treatment is known to convert apnoeas into hypopnoeas with the HAR increasing along with the decrease in overall AHI.
Correlation analysis results have shown that pre‐treatment min O2 levels were most significantly related to the amount of change in oxygen saturation levels including not only mean and min O2 levels but also T90 along with multiple regression analysis results showing min O2 as a significant predictor of post‐treatment mean O2 and T90. All results direct towards a trend of lower pre‐treatment min O2 resulting in a significantly more positive improvement in oxygenation status post‐treatment. This result should be considered in conjunction with the fact that there may be a ceiling effect in the improvement of min O2 level achievable with OA treatment for OSA. Interestingly, for non‐responders mean apnoea duration was a significant predictor of post‐treatment mean O2 (β = −0.468, p = .018), min O2 (β = −0.428, p = .029), and T90 (β = 0.422, p = .001).
There are limitations of this study due to its retrospective design that limit the general application of the predictive variables and cut‐off values in patient populations of different characteristics. Studied variables and cut‐off values should be tested in diverse patient populations to verify its reliability in future studies. However, the usage of level 1 PSG conducted pre‐ and post‐treatment in the same facility with regular concordance activities and the standardised OA treatment protocol identically applied to all patients of this study assigns reliability to the derived results. Also, the relatively small sample size of subgroups warrants further studies with larger subject numbers. Another point to consider is the oxygen related index to apply in treatment evaluation. Focussing on changes in nadir oxygen saturation level itself may be more intuitive to interpret and is important as it focuses on the individual baseline improvement and the amount of time that the mean oxygen level remains low, rather than discussing the presence of a change in min O2 level of ≥4% or 3%.
The results of this study that defined groups based on both responses in AHI and min O2 saturation levels following OA treatment for OSA show that certain patients do not show a sufficient decrease in hypoxaemia in spite of the improvement in AHI and subgroups exist within OA treatment responders with distinct post‐treatment characteristics of AHI and oxygen saturation levels. Such results suggest that the evaluation of treatment response based on AHI as the only criteria could hinder accurate measurement of treatment success and long‐term prognosis.
5. CONCLUSIONS
Pre‐treatment min O2 levels should be considered in OA treatment titration regarding its close relation to improvements in oxygenation levels with OA treatment and systemic sequelae. Patients with increased desaturation should not be excluded from OA therapy, as in the present study, these patients have shown an important and more significant increase in oxygen levels compared to patients who did not present low levels of oxygenation at baseline.
CONFLICT OF INTEREST
The authors report no conflicts of interest that may have affected the work.
AUTHOR CONTRIBUTIONS
Ji Woon Park participated in data analysis and interpretation of data, and also in drafting and revising the manuscript critically for important intellectual content. Fernanda R. Almeida initiated the study project and participated in the acquisition of data, data analysis and interpretation of data, and also in drafting and revising the manuscript critically for important intellectual content. All authors reviewed and revised the manuscript, and approved the final version of the manuscript.
PEER REVIEW
The peer review history for this article is available at https://publons.com/publon/10.1111/joor.13316.
ACKNOWLEDGEMENTS
We thank, Mary Wong, Faculty of Dentistry, University of British Columbia for her support with data management and statistical analysis.
Park JW, Almeida FR. Disparities in oxygen saturation and hypoxic burden levels in obstructive sleep apnoea patient’s response to oral appliance treatment. J Oral Rehabil. 2022;49:633–643. doi: 10.1111/joor.13316
DATA AVAILABILITY STATEMENT
The data that support the findings of this study are available on request from the corresponding author. The data are not publicly available due to privacy or ethical restrictions.
REFERENCES
- 1. Peppard PE, Young T, Barnet JH, Palta M, Hagen EW, Hla KM. Increased prevalence of sleep‐disordered breathing in adults. Am J Epidemiol. 2013;177:1006‐1014. [DOI] [PMC free article] [PubMed] [Google Scholar]
- 2. Kapur VK, Alfonso‐Cristancho R. Just a good deal or truly a steal? Medical cost savings and the impact on the cost‐effectiveness of treating sleep apnea. Sleep. 2009;32:135‐136. [DOI] [PMC free article] [PubMed] [Google Scholar]
- 3. Jordan AS, McSharry DG, Malhotra A. Adult obstructive sleep apnoea. Lancet. 2014;383:736‐747. [DOI] [PMC free article] [PubMed] [Google Scholar]
- 4. Montserrat J, Ferrer M, Hernandez L, et al. Effectiveness of CPAP treatment in daytime function in sleep apnea syndrome: a randomized controlled study with an optimized placebo. Am J Resp Crit Care Med. 2001;164:608‐613. [DOI] [PubMed] [Google Scholar]
- 5. Marco Pitarch R, Selva García M, Puertas Cuesta J, Marco Algarra J, Fernández Julian E, Fons FA. Effectiveness of a mandibular advancement device in obstructive sleep apnea patients: a prospective clinical trial. Eur Arch Otorhinolaryngol. 2018;275:1903‐1911. [DOI] [PubMed] [Google Scholar]
- 6. Kartali N, Daskalopoulou E, Geleris P, et al. The effect of continuous positive airway pressure therapy on blood pressure and arterial stiffness in hypertensive patients with obstructive sleep apnea. Sleep Breath. 2014;18:635‐640. [DOI] [PubMed] [Google Scholar]
- 7. Libman E, Bailes S, Fichten CS, et al. CPAP treatment adherence in women with obstructive sleep apnea. Sleep Disord. 2017;2017:2760650. [DOI] [PMC free article] [PubMed] [Google Scholar]
- 8. McArdle N, Devereux G, Heidarnejad H, Engleman HM, Mackay TW, Douglas NJ. Long‐term use of CPAP therapy for sleep apnea/hypopnea syndrome. Am J Respir Crit Care Med. 1999;159:1108‐1114. [DOI] [PubMed] [Google Scholar]
- 9. Ramar K, Dort LC, Katz SG, et al. Clinical practice guideline for the treatment of obstructive sleep apnea and snoring with oral appliance therapy: an update for 2015. J Clin Sleep Med. 2015;11:773‐827. [DOI] [PMC free article] [PubMed] [Google Scholar]
- 10. Gjerde K, Lehmann S, Berge ME, Johansson AK, Johansson A. Oral appliance treatment in moderate and severe obstructive sleep apnoea patients non‐adherent to CPAP. J Oral Rehabil. 2016;43:249‐258. [DOI] [PMC free article] [PubMed] [Google Scholar]
- 11. Serra‐Torres S, Bellot‐Arcís C, Montiel‐Company JM, Marco‐Algarra J, Almerich‐Silla JM. Effectiveness of mandibular advancement appliances in treating obstructive sleep apnea syndrome: a systematic review. Laryngoscope. 2016;126:507‐514. [DOI] [PubMed] [Google Scholar]
- 12. Almendros I, Martinez‐Garcia MA, Farré R, Gozal D. Obesity, sleep apnea, and cancer. Int J Obes. 2020;44:1653‐1667. [DOI] [PubMed] [Google Scholar]
- 13. Chen L‐D, Chen Q, Lin X‐J, et al. Effect of chronic intermittent hypoxia on gene expression profiles of rat liver: a better understanding of OSA‐related liver disease. Sleep Breath. 2020;24:761‐770. [DOI] [PubMed] [Google Scholar]
- 14. Punjabi NM, Newman AB, Young TB, Resnick HE, Sanders MH. Sleep‐disordered breathing and cardiovascular disease: an outcome‐based definition of hypopneas. Am J Respir Crit Care Med. 2008;177:1150‐1155. [DOI] [PMC free article] [PubMed] [Google Scholar]
- 15. Weaver EM, Woodson BT, Steward DL. Polysomnography indexes are discordant with quality of life, symptoms, and reaction times in sleep apnea patients. Otolaryngol Head Neck Surg. 2005;132:255‐262. [DOI] [PubMed] [Google Scholar]
- 16. Brown DL, Shafie‐Khorassani F, Kim S, et al. Do apneas and hypopneas best reflect risk for poor outcomes after stroke? Sleep Med. 2019;63:14‐17. [DOI] [PMC free article] [PubMed] [Google Scholar]
- 17. Natsios G, Pastaka C, Vavougios G, et al. Age, body mass index, and daytime and nocturnal hypoxia as Ppredictors of hypertension in patients with obstructive sleep apnea. J Clin Hypertens. 2016;18:146‐152. [DOI] [PMC free article] [PubMed] [Google Scholar]
- 18. Berry RB, Budhiraja R, Gottlieb DJ, et al. Rules for scoring respiratory events in sleep: update of the 2007 AASM Manual for the Scoring of Sleep and Associated Events. Deliberations of the Sleep Apnea Definitions Task Force of the American Academy of Sleep Medicine. J Clin Sleep Med. 2012;8(5):597‐619. [DOI] [PMC free article] [PubMed] [Google Scholar]
- 19. Oksenberg A, Silverberg DS, Arons E, Radwan H. Positional vs nonpositional obstructive sleep apnea patients: anthropomorphic, nocturnal polysomnographic, and multiple sleep latency test data. Chest. 1997;112:629‐639. [DOI] [PubMed] [Google Scholar]
- 20. Koo BB, Patel SR, Strohl K, Hoffstein V. Rapid eye movement‐related sleep‐disordered breathing: influence of age and gender. Chest. 2008;134:1156‐1161. [DOI] [PMC free article] [PubMed] [Google Scholar]
- 21. Mathew R, Castriotta RJ. High hypopnea/apnea ratio (HAR) in extreme obesity. J Clin Sleep Med. 2014;10:391‐396. [DOI] [PMC free article] [PubMed] [Google Scholar]
- 22. Sutherland K, Takaya H, Qian J, Petocz P, Ng AT, Cistulli PA. Oral appliance treatment response and polysomnographic phenotypes of obstructive sleep apnea. J Clin Sleep Med. 2015;11:861‐868. [DOI] [PMC free article] [PubMed] [Google Scholar]
- 23. Kulkas A, Duce B, Leppänen T, Hukins C, Töyräs J. Severity of desaturation events differs between hypopnea and obstructive apnea events and is modulated by their duration in obstructive sleep apnea. Sleep Breath. 2017;21:829‐835. [DOI] [PubMed] [Google Scholar]
- 24. Xie J, Sert Kuniyoshi FH, Covassin N, et al. Nocturnal hypoxemia due to obstructive sleep apnea is an independent predictor of poor prognosis after myocardial infarction. J Am Heart Assoc. 2016;5:e003162. [DOI] [PMC free article] [PubMed] [Google Scholar]
- 25. Vold ML, Aasebø U, Wilsgaard T, Melbye H. Low oxygen saturation and mortality in an adult cohort: the Tromsø study. BMC Pulm Med. 2015;15:9. [DOI] [PMC free article] [PubMed] [Google Scholar]
- 26. Weir CB, Jan A. BMI classification percentile and cut off points. StatPearls [Internet]. StatPearls Publishing; 2020. [PubMed] [Google Scholar]
- 27. Sutherland K, Vanderveken OM, Tsuda H, et al. Oral appliance treatment for obstructive sleep apnea: an update. J Clin Sleep Med. 2014;10:215‐227. [DOI] [PMC free article] [PubMed] [Google Scholar]
- 28. Almeida FR, Lowe AA, Tsuiki S, et al. Long‐term compliance and side effects of oral appliances used for the treatment of snoring and obstructive sleep apnea syndrome. J Clin Sleep Med. 2005;1:143‐152. [PubMed] [Google Scholar]
- 29. Fukuda T, Tsuiki S, Kobayashi M, Nakayama H, Inoue Y. Selection of response criteria affects the success rate of oral appliance treatment for obstructive sleep apnea. Sleep Med. 2014;15:367‐370. [DOI] [PubMed] [Google Scholar]
- 30. Kato K, Noda A, Yasuma F, et al. Effects of sleep‐disordered breathing and hypertension on cognitive function in elderly adults. Clin Exp Hypertens. 2020;42:250‐256. [DOI] [PubMed] [Google Scholar]
- 31. Gunnarsson SI, Peppard PE, Korcarz CE, et al. Minimal nocturnal oxygen saturation predicts future subclinical carotid atherosclerosis: the Wisconsin sleep cohort. J Sleep Res. 2015;24:680‐686. [DOI] [PMC free article] [PubMed] [Google Scholar]
- 32. Gottlieb DJ, Punjabi NM, Mehra R, et al. CPAP versus oxygen in obstructive sleep apnea. N Engl J Med. 2014;370:2276‐2285. [DOI] [PMC free article] [PubMed] [Google Scholar]
- 33. White J, Cates C, Wright J. Continuous positive airways pressure for obstructive sleep apnoea. Cochrane Database Syst Rev. 2002(2):CD001106. [DOI] [PubMed] [Google Scholar]
- 34. Liu T, Li W, Zhou H, Wang Z. Verifying the relative efficacy between continuous positive airway pressure therapy and its alternatives for obstructive sleep apnea: a network meta‐analysis. Front Neurol. 2017;8:289. [DOI] [PMC free article] [PubMed] [Google Scholar]
- 35. Wang X‐T, Zhao G, Tu L, et al. Continuous positive airway pressure effectively alleviates arrhythmias in patients with obstructive sleep apnea: possible relationship with counteracting oxidative stress. Curr Med Sci. 2019;39:52‐58. [DOI] [PubMed] [Google Scholar]
- 36. Varga AW, Mokhlesi B. REM obstructive sleep apnea: risk for adverse health outcomes and novel treatments. Sleep Breath. 2019;23:413‐423. [DOI] [PMC free article] [PubMed] [Google Scholar]
Associated Data
This section collects any data citations, data availability statements, or supplementary materials included in this article.
Data Availability Statement
The data that support the findings of this study are available on request from the corresponding author. The data are not publicly available due to privacy or ethical restrictions.