

Summary
Increased droughts impair tree growth worldwide. This study analyzes hydraulic and carbon traits of conifer species, and how they shape species strategies in terms of their growth rate and drought resilience.
We measured 43 functional stem and leaf traits for 28 conifer species growing in a 50‐yr‐old common garden experiment in the Netherlands. We assessed: how drought‐ and carbon‐related traits are associated across species, how these traits affect stem growth and drought resilience, and how traits and drought resilience are related to species’ climatic origin.
We found two trait spectra: a hydraulics spectrum reflecting a trade‐off between hydraulic and biomechanical safety vs hydraulic efficiency, and a leaf economics spectrum reflecting a trade‐off between tough, long‐lived tissues vs high carbon assimilation rate. Pit aperture size occupied a central position in the trait‐based network analysis and also increased stem growth. Drought recovery decreased with leaf lifespan.
Conifer species with long‐lived leaves suffer from drought legacy effects, as drought‐damaged leaves cannot easily be replaced, limiting growth recovery after drought. Leaf lifespan, rather than hydraulic traits, can explain growth responses to a drier future.
Keywords: carbon physiology, drought resilience, functional trait, hydraulic trade‐off, leaf economics spectrum, leaf lifespan, pit aperture, stem growth
Introduction
Climate change and conifer species
One of the most important challenges in ecology is to predict climate change impacts on plants, and its cascading effects on plant species distributions, community structure, ecosystem functioning and ecosystem services (Bellard et al., 2012; Jump et al., 2017). Here we focus on conifer species as they are important components of many temperate and boreal forests because they provide timber, carbon storage, food and shelter (Pan et al., 2011; Hämäläinen et al., 2018; Davies et al., 2020). Global warming and the increased frequency and intensity of droughts are endangering the growth and survival of tree species worldwide (IPCC, 2013; Choat et al., 2018; Brodribb et al., 2020), including conifer species (DeSoto et al., 2020). In this study we analyze the hydraulic and carbon traits of conifer species, and how they shape species strategies in terms of their growth and drought resilience.
Plant economics spectrum and conifer species
Functional traits have been widely used to predict species responses to climate change, since they affect plant growth and survival in different environments (Poorter et al., 2008; Wu et al., 2016). Plant traits determine the uptake, transport, use and loss of essential resources for plants, such as water, nutrients and carbon (Choat et al., 2018). The traits of different plant organs (i.e. leaf, stem and root) are expected to be associated and integrated, since they jointly determine resource use (Reich, 2014). Worldwide, a plant economics spectrum has been identified ranging from species with conservative resource use, slow growth and high survival to species with acquisitive resource use, fast growth but low survival (Reich, 2014; Díaz et al., 2016). This global spectrum is well established for leaves (i.e. the leaf economics spectrum (LES)) (Wright et al., 2004), but developed to a lesser extent for stems (Yang et al., 2022).
Conifers tend to occupy the conservative end along the global spectrum (Díaz et al., 2016) because they possess specific features, such as tough, needle‐like and mostly evergreen leaves, and narrow tracheids, which reduce their water transport capacity but make them more tolerant to drought or cold. Most large‐scale comparative studies have confirmed the LES for a broad range of angiosperm species. However, a comparative study on gymnosperms failed to find the LES (Anderegg et al., 2018), probably due to the relatively narrow range of leaf trait values within this group. Moreover, it remains unclear to what extent leaf and stem traits are coordinated, and whether conifer species show a plant economics spectrum that integrates leaf and stem traits (Rosas et al., 2019). Here we address this knowledge gap by quantifying a comprehensive set of 43 stem and leaf traits of 28 conifer tree species growing in a common garden experiment. We assess the existence of economics spectra across leaves and stems, with a particular emphasis on hydraulic traits, and explore the implications for stem growth and drought resilience.
Traits and tree strategies of conifer species
Traits that increase carbon gain, water transport and reduce tissue construction costs tend to increase growth but come at the expense of reduced survival (Reich, 2014). For example, acquisitive leaf trait values, such as a high specific leaf area, stomatal conductance and nutrient concentration, and low leaf dry matter content and short leaf lifespans, may contribute to a higher growth rate (Sterck et al., 2006; Kitajima & Poorter, 2010), but may come at the cost of higher mortality risks with low resistance to drought. Conservative leaves, by contrast, facilitate the resistance to drought stress, but come at the cost of reduced growth (Onoda et al., 2017). Similarly, acquisitive stem trait values such as wide pits and tracheids favor conductivity and growth rates of conifer species, but this may come at the expense of reduced drought tolerance (Song et al., 2022).
Few studies have explored growth responses of large numbers of conifer species using a broad range of functional traits (Walters & Gerlach, 2013; Anderegg et al., 2018), and even fewer studies link the resultant trait spectra to differences in stem growth rate or drought resilience across conifers (Gazol et al., 2017). Some of the species’ generalizations may therefore be premature for conifers.
In this study, we quantified 43 leaf and stem traits of 28 conifer species growing in a common garden experiment and used dendrochronology to quantify stem growth rate and drought resilience. Resilience consists of two components, the reduction in stem growth during dry years (resistance) and the increase in stem growth (recovery) after dry years (Lloret et al., 2011). We addressed three questions and their corresponding hypotheses:
How are functional traits associated with each other? We expect that traits that contribute to similar functions are more closely correlated than traits related to other functions. From this, we predict that traits can be classified into different clusters, reflecting, for example, structural construction costs, drought tolerance, water transport and carbon assimilation. In combination, these functions and clusters result in different plant strategies to deal with water, carbon and nutrient use. As a result, we expect a plant strategy spectrum that runs from conservative species with dense tissues and high hydraulic safety to acquisitive species with soft tissues, high hydraulic efficiency and carbon assimilation rates.
How do functional traits predict the inherent growth rate and drought resilience of conifer species? We hypothesize that traits related to hydraulic efficiency and carbon assimilation predict conifer species’ inherent growth rate since these traits allow species to have high photosynthesis. We expect that different traits underlie drought resistance and drought recovery. Drought resistance will increase with higher values for multiple hydraulic safety traits, whereas drought recovery will increase with traits associated with fast growth, such as high carbon assimilation rates and soft tissues.
How are stem growth and drought resilience related to species climatic origin? We predict that conifer species originating from harsh xeric or cold habitats are characterized by a conservative strategy and traits that are associated with slow growth, such as small tracheids, low specific leaf area and long leaf lifespan. Because of these conservative trait values they will be drought‐resistant and, hence, also drought‐resilient.
Materials and Methods
Study site and species selection
This study was conducted in a 50‐yr‐old common garden experiment at the Schovenhorst Estate (52.25°N, 5.63°E), near Putten, the Netherlands. The study site is characterized by a temperate maritime climate. Mean annual temperature and rainfall are 10.1°C and 830 mm, respectively. The area has dry, loamy and sandy, nutrient‐poor soils with a low water retention capacity (Cornelissen et al., 2012) and a long distance (19 m) to the soil water table (TNO‐NITG, 2020). In total, 28 conifer species from the northern hemisphere with different climatic origins were planted in monospecific stands (Supporting Information Table S1), and trees had an average stem diameter at breast height (1.3 m) of 35.8 cm, varying from 5.0 to 86.3 cm across species.
Sample collection and functional trait measurements
Between 2018 and 2019, we collected 43 traits for each of the 28 conifer species (Table 1). One branch per individual was selected for the following measurements. These traits were related to leaf size and display (three traits), carbon assimilation (seven), tissue toughness (six), wood anatomy (13), hydraulics and cavitation resistance (eight), and pressure–volume traits (six). To reduce phenotypic variation among individuals and species, we harvested branches (c. 65 cm long, see Fig. S1) in the most illuminated position with an average height of 6 m (5–7 m; see Methods S1). Due to time limitations, traits related to wood anatomy and pressure–volume traits were measured based on three individuals per species. For the remaining traits, five or six individuals per species were measured. All trait values were averaged at the species level.
Table 1.
Overview of 43 functional traits for 28 conifer species in this study: trait name, abbreviation, units, median, 5th percentile, 95th percentile and coefficient of variation (CV) based on trait values (n = 3–6 individuals × 28 species).
| Traits function | Trait name | Abbreviation | Units | Median | Percentile | CV | |
|---|---|---|---|---|---|---|---|
| 5th | 95th | ||||||
| Leaf size and display (3) | Specific leaf area | SLA | cm2 g−1 | 59.20 | 36.10 | 116.72 | 0.45 |
| Leaf mass fraction of the branch | LMFB | g g−1 | 0.84 | 0.54 | 0.93 | 0.15 | |
| Leaf number per branch length | LNBL | mm−1 | 1.44 | 0.48 | 3.94 | 0.73 | |
| Carbon and nutrient investments (7) | Photosynthetic rate (area) | A area | μmol CO2 m−2 s−1 | 8.03 | 4.31 | 14.97 | 0.39 |
| Photosynthetic rate (mass) | A mass | nmol CO2 g−1 | 47.37 | 24.12 | 90.44 | 0.46 | |
| Stomatal conductance | g s | mol H2O m−2 s−1 | 0.06 | 0.03 | 0.14 | 0.52 | |
| Intrinsic water‐use efficiency | iWUE | mmol CO2 (molH2O)−1 | 132.40 | 69.34 | 181.16 | 0.26 | |
| Leaf nitrogen concentration | N | % | 1.45 | 0.98 | 2.37 | 0.27 | |
| Leaf phosphorus concentration | P | % | 0.13 | 0.06 | 0.24 | 0.43 | |
| Leaf potassium concentration | K | % | 0.44 | 0.24 | 0.83 | 0.38 | |
| Tissue toughness (6) | Leaf density | LD | g cm−3 | 0.41 | 0.23 | 0.49 | 0.20 |
| Leaf dry matter content | LDMC | g g−1 | 0.48 | 0.37 | 0.53 | 0.16 | |
| Wood dry matter content | WDMC | g g−1 | 0.51 | 0.42 | 0.58 | 0.11 | |
| Bark density | BD | g cm−3 | 0.42 | 0.34 | 0.51 | 0.14 | |
| Wood density | WD | g cm−3 | 0.53 | 0.44 | 0.66 | 0.12 | |
| Leaf lifespan | LL | yr | 5.00 | 1.00 | 9.00 | 0.52 | |
| Wood anatomy (13) | Hydraulic diameter | Dh | µm | 12.49 | 10.35 | 17.76 | 0.18 |
| Tracheid density | TD | mm−2 | 3.57 × 10³ | 2.34 × 10³ | 4.69 × 10³ | 0.21 | |
| Wall thickness (earlywood) | Tw_E | µm | 2.34 | 1.82 | 3.16 | 0.18 | |
| Wall thickness (latewood) | Tw_L | µm | 2.92 | 2.37 | 3.75 | 0.52 | |
| Thickness to span ratio (earlywood) | TSR_E | µm µm−1 | 0.17 | 0.08 | 0.51 | 0.79 | |
| Thickness to span ratio (latewood) | TSR_L | µm µm−1 | 0.78 | 0.15 | 1.98 | 0.84 | |
| Pit aperture diameter | DPA | µm | 4.29 | 3.12 | 5.16 | 0.16 | |
| Pit aperture resistance | R PA | MPa s m−3 | 3.28 × 10⁸ | 2.10 × 10⁸ | 1.00 × 10⁹ | 0.71 | |
| Pit membrane diameter | DPM | µm | 12.83 | 9.86 | 15.31 | 0.14 | |
| Torus diameter | DT | µm | 0.35 | 0.28 | 0.44 | 0.14 | |
| Margo flexibility | MF | – | 0.48 | 0.44 | 0.58 | 0.09 | |
| Torus overlap | TO | – | 0.35 | 0.28 | 0.44 | 0.14 | |
| Valve effect | VE | – | 0.17 | 0.14 | 0.20 | 0.11 | |
| Hydraulics and cavitation resistance (8) | Predawn water potential | |Ψpre| | MPa | 1.13 | 0.73 | 1.91 | 0.30 |
| Minimum water potential | |Ψmin| | MPa | 1.83 | 1.45 | 2.25 | 0.15 | |
| Xylem‐specific hydraulic conductivity | Ks | kg m−1 s−1 MPa−1 | 0.29 | 0.08 | 0.67 | 0.59 | |
| Pit‐specific hydraulic conductivity | Kpit | kg m−1 s−1 MPa−1 | 0.34 | 0.24 | 0.81 | 0.45 | |
| Xylem pressure when 12% of hydraulic conductivity is lost | |P12| | MPa | 3.05 | 2.31 | 5.09 | 0.26 | |
| Xylem pressure when 50% of hydraulic conductivity is lost | |P50| | MPa | 3.72 | 2.92 | 7.34 | 0.32 | |
| Xylem pressure when 88% of hydraulic conductivity is lost | |P88| | MPa | 4.33 | 3.37 | 9.83 | 0.38 | |
| Hydraulic safety margin | HSM | MPa | 2.16 | 1.27 | 5.33 | 0.51 | |
| Pressure–volume traits (6) | Turgor loss point | |ΨTLP| | MPa | 1.57 | 0.90 | 1.93 | 0.24 |
| Osmotic potential at full turgor | |π0| | MPa | 1.02 | 0.62 | 1.51 | 0.29 | |
| Bulk modulus of elasticity of cell walls | ε | MPa | 10.99 | 4.07 | 20.94 | 0.51 | |
| Hydraulic capacitance at full turgor | CFT | mol m−2 MPa−1 | 0.06 | 0.04 | 0.14 | 0.53 | |
| Saturated water content | SWC | g g−1 | 1.76 | 1.19 | 2.60 | 0.26 | |
| Relative water content at turgor loss point | RWCtlp | % | 90.72 | 75.14 | 95.90 | 0.16 | |
Leaf size and display
Specific leaf area (SLA, cm2 g−1), leaf mass fraction of branch (LMFB, g g−1) and leaf number per unit branch length (LNBL, mm−1) imply the capacity of light capture, since SLA represents biomass efficiency for leaf display, LMFB represents biomass allocation to leaves and LNBL indicates the efficiency of branches packing their leaves (Poorter et al., 2018). SLA was calculated as leaf area per unit dry mass. LMFB was calculated as leaf dry mass divided by branch dry mass. LNBL was calculated as the number of needles divided by branch length.
Carbon and nutrient investments
To estimate the carbon assimilation rate, the maximum photosynthetic rate per unit leaf area (A area, μmol CO2 m−2 s−1) and stomatal conductance (g s, mol H2O m−2 s−1) were measured using a portable photosynthesis meter (Li‐6400; Li‐Cor, Lincoln, NE, USA) . Given that the physiological efficiency of plants is better expressed on a mass basis, and that the LES is more pronounced when being expressed on a mass basis (Osnas et al., 2013), we used the maximum photosynthetic rate per unit leaf mass (A mass, nmol CO2 g−1) as the indicator of carbon assimilation capacity (He et al., 2019). A mass was obtained by multiplying A area by SLA. Intrinsic water use efficiency (iWUE, mmol CO2 (molH2O)−1) was calculated as A area/g s (Yao et al., 2021). Leaf N, P and K concentrations were measured using a flow‐injection autoanalyzer. For detailed measurements, see Methods S2.
Tissue toughness
Leaf density (LD, g cm−3), leaf lifespan (LL, yr), bark density (BD, g cm−3), wood density (WD, g cm−3), leaf dry matter content (LDMC, g g−1) and wood dry matter content (WDMC, g g−1) all contribute to toughness construction and structural reinforcement (Wright et al., 2005; Poorter et al., 2018). LD, BD and WD were calculated as the corresponding dry mass divided by fresh volume. LDMC and WDMC were calculated as the corresponding dry mass divided by fresh mass. LL was defined by the oldest leaf along the main branch, cutting down the branch at the position where the oldest leaf appeared and counting annual rings. Deciduous species were all counted as 1 yr for their LL.
Wood anatomy
Wood anatomical traits indicate species capacity for hydraulic transport (i.e. conduits and pits) and cavitation resistance (i.e. pit size and sealing) (Delzon et al., 2010; Poorter et al., 2010). On the transverse section, tracheid traits, namely hydraulic (weighted) diameter (μm), tracheid density (mm−2), wall thickness for earlywood and latewood (μm), and thickness to span ratio for earlywood and latewood (μm μm−1), were measured using light microscopy. Along the tangential section, pit traits, that is diameter of pit aperture (DPA, μm), pit membrane (DPM, μm) and torus (DT, μm), pit aperture resistance (i.e. R PA, MPa·s m−3) and pit sealing (i.e. torus overlap, margo flexibility and valve effect) were measured using electron microscopy (see Methods S3; Song et al., 2022).
Hydraulics and cavitation resistance
The xylem‐specific hydraulic conductivity (Ks, kg m−1 MPa−1 s−1), xylem potential specific hydraulic conductivity (Kp, kg m–1 MPa−1 s−1) and pit‐specific hydraulic conductivity (Kpit, kg m−1 MPa−1 s−1) all indicate species water transport efficiency (Domec et al., 2006; Poorter et al., 2010). Ks, Kp and Kpit were measured following Methods S4. To indicate species cavitation resistance to drought, xylem pressures when 12, 50 or 88% of hydraulic conductivity was lost (P12, P50 and P88), predawn water potential (Ψpre, MPa), minimum water potential (Ψmin, MPa) and hydraulic safety margin (i.e. HSM = Ψmin − P50, MPa) for the twigs were measured. P12, P50, P88, Ψmin and HSM are good predictors for species hydraulic safety and drought resistance (Bhaskar & Ackerly, 2006; Anderegg et al., 2016).
Pressure–volume traits
Leaf water potential at turgor loss point (ΨTLP, MPa) is a good predictor for drought tolerance. A more negative turgor loss point implies species have lower leaf wilting risks and would be more drought‐tolerant (Bartlett et al., 2012; Maréchaux et al., 2015). A bench dehydration technique was used to determine pressure–volume traits (Sack et al., 2011), that is turgor loss point, osmotic potential at full turgor (π0, MPa), relative water content at turgor loss point (RWCtlp, %), saturated water content (SWC, g g−1), hydraulic capacitance at full turgor (CFT, mol m−2 MPa−1) and bulk modulus of elasticity of the cell wall (Ɛ, MPa). For more detailed information, see Methods S5.
Inherent growth rate and drought resilience components
For inherent growth rate and drought resilience components (i.e. resistance, recovery and resilience), we measured tree rings for the period 1974–2017 for 20 of the 28 species. Eight species were excluded because trustful tree‐ring dating and/or physiological measurements were not feasible for them (e.g. Juniperus species) (Table S1). To quantify the inherent growth rate of species, three different dimensions of growth rate were obtained from Song et al. (2021): stem diameter growth rate (cm yr−1), stem basal area growth rate (BAI, cm2 yr−1) based on the averaged basal area increment, and stem mass growth rate (kg yr−1 m−1) calculated based on wood density and stem area growth (Sterck et al., 2012). These growth rates were calculated based on the first 20 yr since tree species were established, the canopy was perhaps relatively open and there was less competition among individuals (see methods described by Song et al., 2021).
To calculate drought resilience components (i.e. resistance, recovery and resilience), we first quantified drought year using a climate–water balance index (i.e. standardized precipitation evapotranspiration index, SPEI), and then calculated the three drought resilience components based on each drought year. Drought resistance was the ratio of tree‐ring width (TR) during drought to mean TR 2 yr earlier, recovery was the ratio of mean TR two years after drought to TR during drought, and drought resilience was the ratio of mean TR 2 yr after drought to mean TR 2 yr before (Fig. S2). These indices were averaged per species for further analysis. For the quantification of drought year and calculation of resilience components, see Methods S6.
Climate origin of conifer species
Although it would have been best to know the climatic origin of the provenance used in this experiment, this was not possible because the specific seed origin of the trees is not known. We therefore quantified the climatic conditions in the distribution range of the species, based on occurrence data. Specifically, we determined the range of distributions of all 28 species based on Farjon & Filer (2013), which allowed us to determine the original distribution per species, thus avoiding areas where the species had been introduced. We then extracted the occurrence records (i.e. longitude and latitude, Fig. S3) of each species from the Global Biodiversity Information Facility (GBIF, 2019) using the R rgbif package (Chamberlain et al., 2017: https://www.gbif‐uat.org/).
Based on occurrence records, we extracted elevation and climate data related to water deficit, heat and cold. Water deficit includes the following factors: mean annual precipitation (MAP, mm), mean annual evapotranspiration (PET, mm) and mean annual aridity index (MAI), minimum and maximum monthly precipitation (P min, mm; P max, mm), and maximum monthly potential evapotranspiration (PETmax, mm month–1). Mean annual aridity index was calculated based on the ratio of annual precipitation and annual potential evapotranspiration (Trabucco & Zomer, 2018). Heat and cold factors include the following indices: mean annual temperature (MAT, °C), minimum and maximum monthly temperature (T min, °C; T max, °C), and maximum monthly solar radiation (SRmax, kJ m−2 d−1). Elevation, MAP, P min, P max, MAT, T min, T max and SRmax were extracted from WorldClim 2.0 (http://worldclim.org/version2). PETmax, PET and MAI were extracted for the original distribution sites from a global dataset by Trabucco & Zomer (2018).
All climate data were extracted based on the period 1970–2000 with a resolution of 1 km2 by implementing the R raster package (Hijmans et al., 2015). To better quantify the climatic limits for each species distribution, the 10th, 50th and 90th percentiles of climatic variables based on each species were subsequently extracted. Because different quantiles of climate data gave similar results (Tables [Link], [Link]), we used the 90% quantile of climate data for further analysis.
Data analysis
To address our research questions we used three complementary analyses: a cluster analysis to identify how these 43 traits were coordinated into different functions, a principal component analysis (PCA) to evaluate how traits were associated and what plant strategy spectra can be distinguished, and network analysis to identify which ‘core traits’ or ‘central hub traits’ (He et al., 2020) are strongly linked to other traits and underlie trait coordination. Before analysis, data were log10‐transformed to improve normality and homoscedasticity. We used the absolute values of Pearson correlation to do the cluster analysis. Pearson correlation and cluster analysis were carried out with the R packages hmisc (Harrell & Harrell, 2019) and pheatmap (Kolde, 2019), respectively. Second, PCA was performed in canoco 5 based on identified cluster groups. We used the first two principal components because the third and fourth PCA axes explained considerably less of the variation (respectively 10 and 7%), and a parallel analysis (Dinno, 2018) indicated that only the first two principal components were significant (Fig. S4).
The cluster analysis resulted in eight clusters of closely associated traits. Although a cluster may have multiple functions, we coined each cluster according to its most important function, for the sake of clarity and overview. To assess which traits are ‘central traits’ or ‘key traits’, which are closely associated with other traits for mechanistic or ecological reasons, we used network analysis. Note that multivariate analysis with larger numbers of variables than observations may induce low confidence (Jennions & Møller, 2003). For this statistical reason, the maximum number of traits that can be included in a network analysis of 28 species is eight. For each of the eight identified clusters, we therefore selected one trait based on two different criteria (Table S6), resulting in two different network analyses (Fig. S5): we selected the most ecologically relevant trait, based on the literature, and we selected for each cluster group the trait that had the highest number of significant bivariate correlations with the other 42 traits because a network analysis requires high collinearity among variables (Epskamp & Fried, 2018). The network analysis was done with eight trait names as nodes, and partial correlation coefficients between every two nodes after controlling all other variables in the dataset as edges (Poorter et al., 2021). To assess the importance of nodes in the network, centrality was computed by summing the absolute values of partial correlations to obtain the higher values quantified as important traits (Epskamp & Fried, 2018; Epskamp et al., 2018). To check the sensitivity of the network for trait selection, we performed 100 random selections of one trait per group, repeated the network analysis 100 times, and calculated from this the average importance values of each of the 43 traits based on the networks when it was included (Fig. S6). This showed that DPA still occupied an important position in the network. Network analysis was performed with the R package bootnet (Epskamp et al., 2015).
To assess how functional traits affect growth rate and drought resilience, we first used bivariate Pearson correlations and then used model selection with dredge function in the mumin package (Barton, 2020) based on the selected groups from cluster analysis. To compare the effect size of different traits, all traits were standardized by subtracting the mean and dividing by the standard deviation.
To assess how climatic harshness affects stem growth, drought resilience and the underlying functional traits, bivariate Pearson correlations were used. All data analyses were performed using R v.4.0.2 (R Core Team, 2020) and residuals were checked for normality and homoscedasticity with QQ plots.
Results
Trait clusters
Eight functional trait groups were identified using hierarchical clustering (Fig. 1). The first cluster (in light blue) consisted of three traits related to drought tolerance since it contains predawn and minimum branch water potential (Ψpre and Ψmin), and it was also associated with leaf phosphorus (P). The second cluster (in purple) consisted of three traits related to branch toughness, including wood density (WD), wood dry matter content (WDMC) and bark density (BD). The third cluster (in blue) consisted of traits related to water transport, including stem‐specific conductivity (Ks), pit conductivity (Kpit), cell wall thickness and thickness to span ratio of the earlywood (Tw_E and TSR_E). The fourth cluster (in red) consisted of traits related to water use efficiency (iWUE, g s, Dh and TD) and cavitation resistance (P12, P88, P50, HSM). The fifth cluster (in pink) contained three traits related to leaf toughness, namely leaf dry matter content (LDMC), leaf density (LD) and leaf lifespan (LL). The sixth cluster (in green) was composed of traits related to carbon assimilation (SLA, N and A mass) and water status of the symplast (|ΨTLP| and |π0|). The seventh cluster (in grey) reflected branch‐level traits mainly associated with structure such as leaf mass fraction of the branch (LMFB), latewood structure such as cell wall thickness and thickness to span ratio of the latewood (Tw_L and TSR_L). The eighth cluster (in black) was the largest and involved 12 pit traits, that is those related to pit size such as the diameter of the pit aperture, pit membrane and torus (DPM, DPA and DT), and pit sealing such as torus overlap (TO), margo flexibility (MF) and valve effect (VE).
Fig. 1.
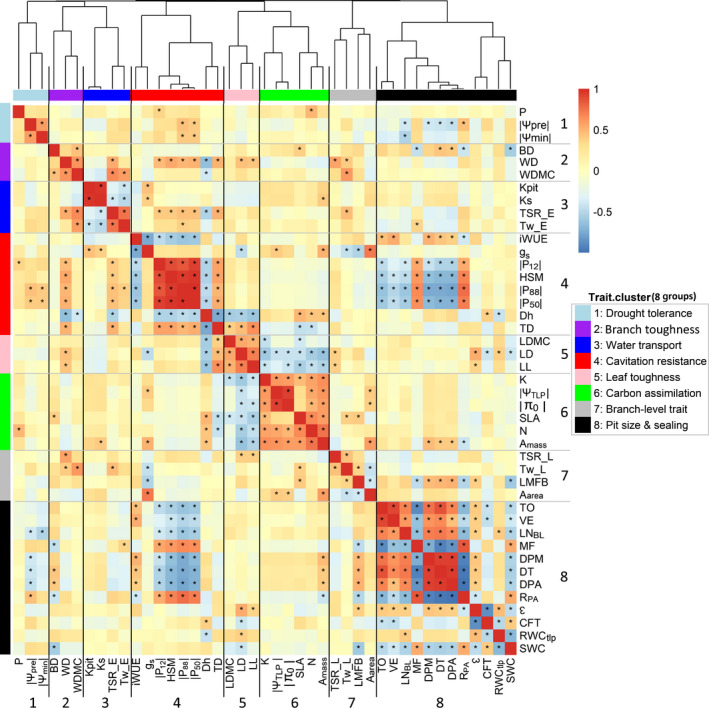
Covariance of plant functional traits (n = 28 species) analyzed by cluster analysis (hierarchical clustering) combined with a heatmap of covariation among the 43 traits. Trait correlations are indicated using colors; warm (red) shades indicate positive Pearson correlations and cool (blue) shades indicate negative correlations. The distance tree of traits derived from hierarchical clustering is illustrated at the top. Eight resulting clusters are given names: group 1, drought tolerance; group 2, branch toughness; group 3, water transport; group 4, cavitation resistance; group 5, leaf toughness; group 6, carbon assimilation and water status; group 7, branch‐level trait associated with structure; and group 8, pit size and pit sealing. The number of groups is shown at the bottom and right. *, P < 0.05. For trait abbreviations see Table 1.
We then further explored the relationships among these traits and the eight groups using PCA. The first two PCA axes explained 63% of the variation and showed two trait spectra (Fig. 2). The first axis reflected a trade‐off between hydraulic and biomechanical safety (red, blue and light blue) at the left and hydraulic efficiency (black and blue) at the right. It also indicated a conservative strategy with high cavitation resistance (red), cell wall thickness (Tw_L and Tw_E; blue) and thickness‐to‐span ratio of earlywood (TSR_E, blue) on the left side of the axis; and an acquisitive strategy with high water use efficiency (iWUE, red) and wide pits (DPA, DPM and DT; black) on the right side. This hydraulic spectrum also reflected an old split between cavitation‐resistant Cupressaceae and Taxaceae with high margo flexibility (MF) to the left, and conductive Pinaceae with wide pits and potentially fast growth to the right.
Fig. 2.
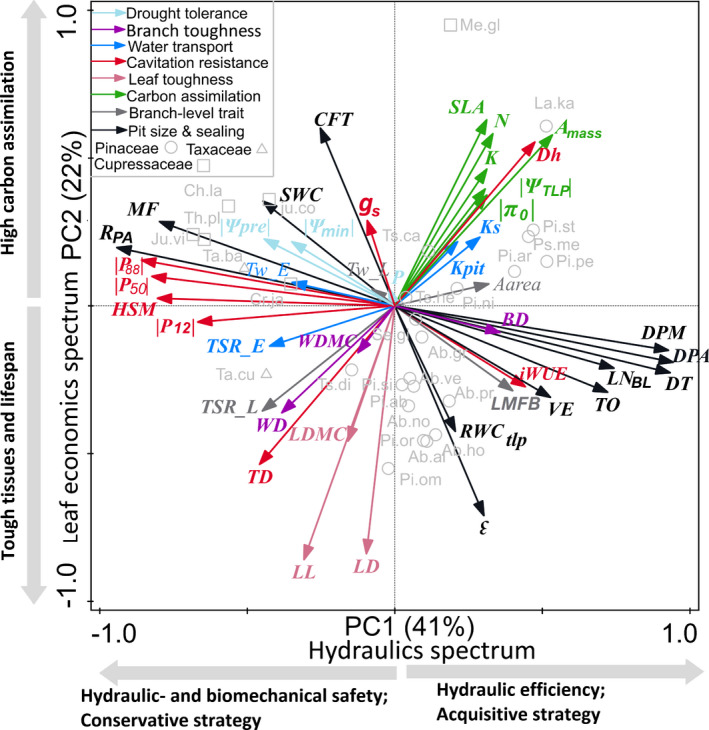
Principal components analysis (PCA) for the first two PCA axes of 43 traits across 28 conifer species. The x‐axis indicates the hydraulics spectrum and y‐axis indicates the leaf economics spectrum. Eight trait groups were classified based on cluster analysis in Fig. 1 and indicated with arrows in different colors. Different families (Cupresssaceae, Pinaceae, Taxaceae) are indicated by different symbols. For trait abbreviations see Table 1, and for species abbreviations (in light grey) see Supporting Information Table S1.
The second axis reflected a trade‐off between leaf tissues toughness and lifespan at the lower end of the axis vs carbon assimilation at the higher end of the axis, where tissues toughness (pink) was associated with high leaf density (LD), leaf lifespan (LL) and leaf dry matter content (LDMC) at the bottom; and carbon assimilation (green) associated with high specific leaf area (SLA), photosynthetic rate (A mass) and hydraulic diameter (Dh) at the top.
Trait network
When traits for the network analysis were selected based on mechanistic reasons, then the most central trait was pit aperture diameter (DPA), which was positively related to carbon assimilation (A mass, photosynthetic rate) and negatively related to drought tolerance (|Ψpre|, absolute value of predawn branch water potential). It was followed by four traits with a similar centrality: hydraulic safety margin (HSM), wood density (WD), leaf lifespan (LL) and A mass (Fig. 3). A comparable network was obtained when the eight traits were selected based on statistical reasons (i.e. the highest number of statistical correlations, Fig. S5). Finally, when an explorative sensitivity analysis was done, the DPA was still an important central trait next to DPM, but other important traits included cavitation resistance traits such as Dh, P88 and HSM (Fig. S6).
Fig. 3.
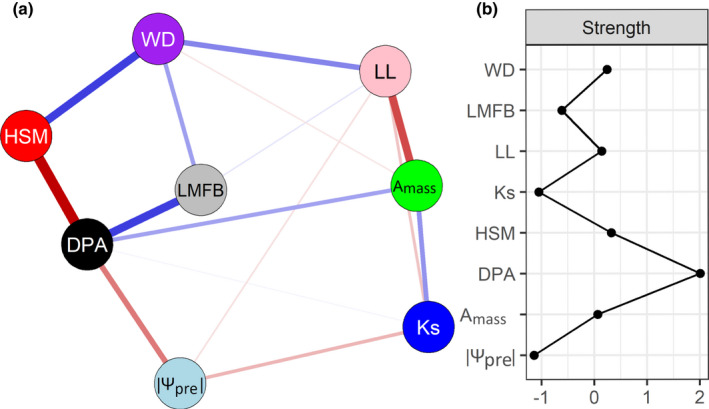
Ecological reason‐based network analysis among eight main functional traits from eight different clusters (a), and the strength of centrality indices (b). Node colors vary among the different groups; see Fig. 1. Each trait is a node and connections represent partial correlation coefficients between two variables after conditioning on all other variables. The links in blue indicate positive coefficients and the links in red indicate negative coefficients in the model. The partial correlation value is proportional to the thickness of the links. Strength was calculated from accumulated values of absolute partial coefficients between a focal node and all other connected nodes in the network. Strength was standardized by subtracting the mean from the specific values and dividing it by the standard deviation. Large strength values indicate high central traits. For trait abbreviations see Table 1.
Effects of traits on stem growth and drought resilience
Of all 43 traits evaluated, stem diameter growth only significantly increased with pit aperture diameter (Fig. 4a), which was also confirmed by the multiple regression (Tables 2, S7). Stem area growth (BAI) and mass growth increased with hydraulic tracheid diameter (Fig. 4b,c). Unexpectedly, growth rate was not significantly related to any of the two PCA axes that reflect multivariate trait strategies (Fig. S7). Hence, stem growth of conifer species was determined by pit aperture size and hydraulic tracheid diameter.
Fig. 4.
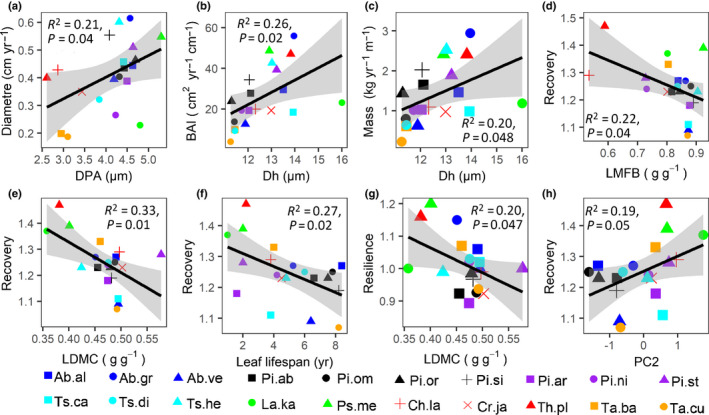
Bivariate significant relationships between growth rate and trait for (a) stem diameter growth and pit aperture diameter (DPA), (b) stem area growth and hydraulic diameter (Dh), (c) stem mass growth and hydraulic diameter; and relationships between growth resilience components and traits or PC2 scores for: (d) recovery and leaf mass fraction of the branch (LMFB), (e) recovery and leaf dry matter content (LDMC), (f) recovery and leaf lifespan, (g) resilience and leaf dry matter content (LDMC), and (h) recovery and PC2 scores from the result of PCA. Regression lines, 95% confidence intervals (grey), R 2 and P values are shown. The same color indicates the same genus. For species abbreviations see Supporting Information Table S1.
Table 2.
Results of averaged models based on best models (ΔAICc < 2) showing how these functional traits from eight different cluster groups affect conifer species growth (in light blue) and growth resilience (in light grey).
| Model | |Ψpre| | WD | Ks | HSM | LL | A mass | LMFB | DPA |
|---|---|---|---|---|---|---|---|---|
| Stem diameter growth | ||||||||
| Avg | −0.48 | 0.62 | ||||||
| Imp | 0.73 | 1.00 | ||||||
| P | 0.04 | 0.01 | ||||||
| Stem area growth | ||||||||
| Avg | −0.35 | 0.32 | −0.37 | −0.26 | 0.30 | |||
| Imp | 0.34 | 0.10 | 0.18 | 0.15 | 0.18 | |||
| P | 0.16 | 0.18 | 0.13 | 0.28 | 0.22 | |||
| Stem mass growth | ||||||||
| Avg | −0.22 | −0.27 | 0.26 | −0.37 | −0.22 | 0.32 | ||
| Imp | 0.09 | 0.11 | 0.11 | 0.23 | 0.09 | 0.16 | ||
| P | 0.38 | 0.27 | 0.29 | 0.12 | 0.38 | 0.19 | ||
| Resistance | ||||||||
| Avg | −0.24 | |||||||
| Imp | 1.00 | |||||||
| P | 0.31 | |||||||
| Recovery | ||||||||
| Avg | 0.41 | −0.47 | −0.43 | |||||
| Imp | 0.33 | 0.52 | 0.71 | |||||
| P | 0.045 | 0.04 | 0.057 | |||||
| Resilience | ||||||||
| Avg | −0.27 | −0.23 | 0.30 | −0.30 | ||||
| Imp | 0.16 | 0.13 | 0.20 | 0.20 | ||||
| P | 0.27 | 0.34 | 0.21 | 0.22 | ||||
The bold coefficients indicate P < 0.05. The model indexes, degrees of freedom (df), log‐likelihood (logLik), corrected Akaike information criterion (AICc) and AICc weight are given in Supporting Information Table S7. The average coefficients (Avg), relative importance (Imp) and significances (P) are shown. The relative importance of the predictor variables is calculated as the sum of the Akaike weights over the best‐selected models. |Ψpre|, predawn water potential; A mass, photosynthetic rate (mass); DPA, pit aperture diameter; HSM, hydraulic safety margin; Ks, xylem‐specific hydraulic conductivity; LL, leaf lifespan; LMFB, leaf mass fraction of the branch; WD, wood density.
Bivariate correlations showed that drought recovery decreased with an increase in leaf mass fraction of the branch (LMFB), leaf dry matter content (LDMC) and leaf lifespan (LL) (Fig. 4d–f). Drought recovery also increased with the second PCA axis, reflecting a trade‐off between carbon assimilation and leaf toughness and – to a lesser extent – branch toughness (R 2 = 0.19, P = 0.05; Fig. 4h). Multiple regression indicated that drought recovery was negatively affected by leaf lifespan (LL) (Table 2), and positively affected by specific hydraulic conductivity (Ks) (Table 2). Surprisingly, none of the traits could explain drought resistance. In sum, species with a slow turnover rate (i.e. long leaf lifespan) have reduced drought recovery.
Relationships among climate origin, stem growth, drought resilience and functional traits
Pairwise correlations showed that stem growth rates in terms of area, mass and diameter all increased with maximum solar radiation (SRmax) of the species in their original climate, and, to a lesser extent, with maximum potential evapotranspiration (PETmax) (Table 3). Similarly, drought resilience increased with maximum solar radiation and mean annual evapotranspiration (PET). Functional traits were also significantly related to climate origin (Table S5).
Table 3.
Pearson correlations between the 90th quantile of climate data, stem growth rate, growth resilience and the first two PCA scores from Fig. 2.
| Functional traits | MAT | T min | T max | MAP | P min | P max | SRmax | PETmax | PET | MAI | Elev | Long | Lati | |
|---|---|---|---|---|---|---|---|---|---|---|---|---|---|---|
| Growth rate | Area | 0.00 | 0.39 | −0.06 | 0.09 | −0.27 | 0.12 | 0.60 | 0.50 | 0.39 | −0.10 | −0.13 | −0.73 | 0.28 |
| Mass | −0.04 | 0.42 | −0.14 | 0.13 | −0.24 | 0.15 | 0.62 | 0.46 | 0.32 | −0.05 | −0.17 | −0.75 | 0.36 | |
| Diameter | −0.14 | 0.24 | −0.18 | 0.10 | −0.18 | 0.09 | 0.49 | 0.31 | 0.20 | −0.03 | −0.20 | −0.70 | 0.26 | |
| Growth resilience | Resistance | −0.16 | −0.19 | 0.07 | 0.13 | −0.11 | 0.18 | 0.03 | 0.10 | 0.17 | 0.27 | 0.27 | −0.06 | −0.25 |
| Recovery | 0.02 | 0.35 | 0.00 | −0.09 | −0.33 | −0.03 | 0.42 | 0.44 | 0.33 | −0.20 | 0.01 | −0.37 | 0.19 | |
| Resilience | −0.15 | 0.16 | 0.00 | −0.11 | −0.36 | −0.03 | 0.48 | 0.53 | 0.45 | −0.12 | 0.08 | −0.51 | 0.13 | |
| PCA scores | PC1 | 0.22 | 0.27 | 0.15 | 0.14 | 0.11 | 0.11 | 0.16 | 0.19 | 0.07 | −0.01 | −0.37 | −0.12 | 0.03 |
| PC2 | 0.51 | 0.23 | 0.56 | −0.09 | −0.20 | −0.05 | 0.01 | 0.24 | 0.35 | −0.20 | −0.12 | −0.01 | −0.25 | |
The bold coefficients indicate P < 0.05. Similar results were produced when using the 10th quantile and 50th quantile of climate data, using Supporting Information Tables S3 and S4. For trait abbreviations see Table 1. Elev, elevation; Lati, latitude; Long, longitude; MAI, mean annual aridity index; MAP, mean annual precipitation; MAT, mean annual temperature; PET, mean annual evapotranspiration; PETmax, maximum potential evapotranspiration of warmest month; P max, maximum precipitation of the wettest month; P min, minimum precipitation of the driest month; SRmax, maximum solar radiation among the warmest months; T max, maximum temperature of the warmest month; T min, minimum temperature of the coldest month.
Overall, species of warm climate origin, characterized by high solar radiation, temperature and evapotranspiration, had acquisitive trait values (i.e. high stomatal conductance and photosynthetic rate, short leaf lifespan, low leaf density, low cavitation resistance and small valve effect), and hence high stem growth rate and high stem growth resilience to drought.
Discussion
We assessed associations and clusters amongst 43 functional traits and showed how traits affected stem growth and drought resilience of conifer species. Two trait spectra were found. The first reflects a hydraulics spectrum driven by traits related to pit size, pit sealing and cavitation resistance, indicating a trade‐off between hydraulic safety and hydraulic efficiency. The second reflects an LES driven by traits related to leaf toughness and carbon assimilation, reflecting a trade‐off between leaf persistence and high leaf carbon assimilation. Stem growth rate increased with traits of the first spectrum (i.e. large tracheids and pits), whereas drought recovery increased with traits related to the second spectrum (i.e. low leaf toughness and short leaf lifespan). Below we discuss how traits are associated and how they underlie growth and drought resilience.
Trait associations and function for growth strategy of conifers
Trait associations
We expected that traits are clustered according to their main functions. We found eight clusters related to structural and physiological traits at different organizational scales. Structural trait clusters ranged from the subcellular level (pit traits) to branch level (branch toughness) and leaf level (leaf toughness). Physiological trait clusters were related to hydraulics (drought tolerance, water use efficiency and cavitation resistance, water transport) and leaf physiology (carbon assimilation and water status). This suggests that the strongest integration is within each organizational level (e.g. pit, leaf, branch, individual) and less across these organizational levels, probably because of developmental reasons or optimization of specific physiological processes at each organizational level. The divergent clusters indicate that there is less tight integration across organs and functions. This means suboptimal solutions at the whole‐plant level and that different clusters may be important under different environments.
Despite the weaker integration across clusters and their functions, we found that leaf economics traits and stem hydraulic traits were at least partly coupled (Figs 1, 2). Species with an acquisitive strategy for leaves, such as high leaf nutrient concentrations (N, K), SLA, g s and A mass, had a larger hydraulic diameter (Dh) in the branches. Since wider tracheids increase hydraulic conductivity and water supply (Sterck et al., 2008), this may allow for a higher g s, transpiration rate and, coupled to that, A mass (Brodribb & Feild, 2000; Chave et al., 2009) and growth for both conifers (Sterck et al., 2012) and broadleaf trees (Poorter et al., 2010). The key traits for carbon, nutrient and water economics are thus partly coordinated across leaf and stem. This indicates that an integrated whole‐plant economics spectrum (Reich, 2014) also exists across conifer species (Rosas Torrent, 2019).
In contrast to our expectation, an acquisitive leaf strategy was associated with a large absolute (i.e. ‘safe’) twig turgor loss point (|ΨTLP|). Such large |ΨTLP| is commonly interpreted as an indicator of drought tolerance worldwide (Bartlett et al., 2012). Given that the needles were dense and tiny, we used twigs for pressure–volume curves to infer leaf ΨTLP, reflecting twig ΨTLP rather than needles. This may lead to different findings for twigs compared with leaves; its is probable that twigs with their parenchyma and bark have a larger hydraulic capacitance (CFT, SWC; Fig. 2). The reason for this puzzling result requires further attention in future studies.
Trait spectra and plant strategies
The PCA shows that the trait clusters are loosely organized into different multivariate plant strategy axes (Fig. 2). The first axis is strongly associated with trait clusters related to pit size and hydraulic safety measures, indicating that wider pits that facilitate hydraulic conductivity come at the expense of reduced hydraulic safety (Roskilly et al., 2019). Overall, the first axis reflects a hydraulics spectrum, running from a conservative strategy with high hydraulic and biomechanical safety (i.e. high cavitation resistance, more negative water potential, large hydraulic safety margin and dense wood with high wood dry matter content) to a more acquisitive strategy with higher hydraulic efficiency (i.e. high conductivity and wide pits). The trade‐off between hydraulic and biomechanical safety and efficiency has been frequently found in Mediterranean (Quero et al., 2011; Ramírez‐Valiente et al., 2020), tropical and temperate forests or tree species (Hacke et al., 2006; van der Sande et al., 2019; López et al., 2021), whereas the trade‐offs across areas of temperate conifer species are rarely reported, or no such a trade‐off has been found within species (López et al., 2013; Rosas et al., 2019). Hence, our study supports the evidence that such a safety–efficiency spectrum is not only found across angiosperms and gymnosperms, where gymnosperms occupy the safe end of angiosperms and gymnosperms (Yang et al., 2022), but also within gymnosperm species. We conclude that the hydraulics spectrum exists in different forest ecosystems, enabling species to adapt to divergent environments for their water use strategy in a changing climate.
The second axis reflected a trade‐off between the leaf toughness cluster (high LDMC, LD and LL) with lower water storage capacity at the branch level (low SWC and CFT) vs the carbon assimilation cluster (high SLA, N, K and A mass) (Figs 1, 2). It indicates that tough tissues and increased leaf lifespan come at the expense of a reduced photosynthetic capacity. This is consistent with the literature showing that thick, dense leaves increase the resistance and pathlength for CO2 diffusion (Niinemets, 2001), while nitrogen investment in cell wall defence cannot be invested in the photosynthetic enzyme Rubisco (Onoda et al., 2017), and the observation that small and thick cells are metabolically less active (Brown et al., 2004). In the long run, both leaf strategies may have a similar lifetime carbon gain, as short‐lived leaves have a high capacity, and long‐lived leaves have a long photosynthetic revenue stream over the lifetime of a leaf (Westoby, 1998; Edwards et al., 2014). High leaf toughness was also associated with lower water storage capacity at the branch level. Such lower water storage capacity implies high water potential fluctuations, which may cause stomatal closure, and thus reduce carbon gain (Sack & Tyree, 2005). In sum, the second axis thus mainly reflects an LES, running from a conservative strategy with high leaf toughness and long leaf lifespan to an acquisitive strategy with leaf trait values that increase carbon gain.
Pinaceae tend to occupy the efficient side of the hydraulics spectrum and Cupressaceae the safe side (Fig. 2). This suggests that the traits underlying these clusters (i.e. cavitation resistance and pit size) are under strong phylogenetic control (cf. Song et al., 2022). Gymnosperms are therefore characterized by a strong evolutionary integration of hydraulic safety traits whereas, for example, for tropical trees P50 and ΨTLP have been the result of repeated evolutionary adaptation (Guillemot et al., 2022). We did not find a clear phylogenetic split along the LES, probably because all conifers have relatively tough and tiny needles with relatively less variation in leaf traits, whereas a global tree study that also included angiosperms did find that leaf nutrient concentrations were phylogenetically conserved (Sardans et al., 2021).
What drives trait associations?
Trait network analysis shows that pit aperture diameter (DPA) is the most central trait in the trait network (Fig. 3). DPA is positively associated with increased carbon assimilation (i.e. A mass) but comes at the cost of reduced hydraulic safety, as indicated by the negative correlation with HSM and |Ψpre|. Wide pits not only facilitate hydraulic transport but may also result in relatively small torus overlap and, hence, higher cavitation risks (Jansen & McAdam, 2019).
The second‐most central trait is HSM. HSM is positively linked to WD, indicating that tough tissues, which can avoid tracheid implosion, are also safer (Hacke et al., 2001). High HSM indicates that plants follow a hydraulically safe strategy by reducing the risk of drought‐induced cavitation and hydraulic failure. The importance of HSM is also highlighted by a global metaanalysis (Choat et al., 2012), where tree species from biomes that differ strongly in aridity operate at very similar hydraulic safety margins just above zero, presumably to balance the need for safety to survive in a certain environment, with the need to increase carbon gain to effectively compete with other species. Additionally, the sensitivity analysis suggests that, apart from HSM, other traits that belong to the cavitation cluster (P88 and narrow Dh) occupy a central position in the trait network (Fig. S6).
The network analysis further highlights some level of coordination between leaf traits and stem traits across conifer species (Fig. 3). There are clear associations between leaf photosynthetic capacity (A mass) and the hydraulic water supply to the leaf (DPA and Ks), probably because the latter facilitates gas exchange. The positive association between WD and LL indicates that plants with a conservative strategy of resource use (e.g. shade‐ or drought tolerance) have both long‐lived leaves and dense wood. The coupled relationship between leaf and stem is consistent with previous studies that leaf traits and wood traits were more related for both species in different temperate forests (Kawai & Okada, 2019) and species coexisting in temperate forests (Maherali et al., 2006).
Mechanisms underlying growth rate and drought resilience
Pit aperture and tracheids determine stem growth
We expected that the stem growth of conifer species would increase with stem traits that increase water transport capacity, with leaf traits that increase photosynthetic carbon gain and with cheap tissue construction costs. Although hydraulic conductivity did not affect species growth, the underlying water transport traits such as pit aperture and tracheid size did increase the stem growth of conifer species (Fig. 4a–c; Table 2). Both larger pit aperture and hydraulic diameter reflect larger tracheid dimensions and lower construction costs. The important role of DPA is also consistent with the central role it plays amongst traits from the eight different clusters (Fig. 3). To our knowledge, this is the first study that highlights the importance of pit aperture for stem diameter growth.
Leaf lifespan reduces drought recovery
Drought resilience consists of resistance and recovery. We expected that resistance is explained by hydraulic stem and leaf traits, whereas drought recovery is explained by traits that increase carbon gain and growth. Surprisingly, none of the putative drought tolerance traits of stems (e.g. small pits, strong pit sealing and large cavitation resistance) and leaves (e.g. negative ΨTLP and Ψmin) could explain drought resistance. Hydraulic traits such as P50 may increase drought tolerance in extremely arid systems (Plaut et al., 2012), but may be less important under the relatively mild maritime climatic conditions of our study site where drought avoidance, for example through deep roots, may become important (Choat et al., 2018).
Leaf toughness and leaf lifespan were the best predictors of drought recovery: tree species with a longer leaf lifespan (and tougher leaves) recovered more poorly after drought. This observation is in line with predictions from a theoretical model, showing that slower organ turnover rates can cause stronger legacy effects on growth (Zweifel & Sterck, 2018; Zweifel et al., 2020). Droughts can either damage leaves through bleaching, photodamage and membrane rupture that reduce leaf functioning (Thomas & Gay, 1987; Hansen & Dörffling, 2003; Brodribb et al., 2016) or lead to leaf loss, which in both cases results in reduced carbon gain and recovery. Species with a short leaf lifespan can rapidly replace damaged leaves with well‐functioning leaves, but species with a long leaf lifespan cannot, so they suffer for a long time from the legacy of a reduced or damaged leaf canopy (Zweifel et al., 2020). To our knowledge, this is the first study that shows that species with a conservative leaf economics strategy (long leaf lifespan) have such a lower drought recovery. This adds an important ecological dimension to leaf lifespan, which is known as a key trait for multiple functions of plant strategies, such as increasing stress tolerance and conserving nutrient, carbon and nutrient cycling (Edwards et al., 2014; Yu & He, 2017). Whether the observed legacy effects of leaf lifespan on drought recovery is something particular for conifers, or also occurs across broadleaf species or other forests, remains to be tested.
Does climatic origin of a species affect stem growth rate and drought resilience?
We expected that species from harsh, xeric or cold habitats would have a reduced inherent growth rate and high drought resistance, because these species were expected to be characterized by a conservative strategy with trait values associated with slow growth, such as small tracheids, small pits and low specific leaf area (Wright et al., 2004; Larter et al., 2017; Maharjan et al., 2021). Surprisingly, we did not find that species from dry climates had a reduced growth rate or a high drought resilience. Perhaps the climatic origins of these temperate and boreal species from the northern hemisphere (MAT ranging from 8.5 to 18.8°C and MAP ranging from 1053 to 2913 mm) were too similar or too humid to find a response.
Instead, for our species pool we found that species from bright climates (i.e. high solar radiation and potential evapotranspiration) followed an acquisitive strategy, with high stomatal conductance, fast leaf turnover rate (i.e. short leaf lifespan) and photosynthetic rate (Table S5) and, hence, high growth rate and drought resilience for these relatively humid species. Stem diameter growth was also positively related to pit aperture, but pit aperture was not related to climatic origin, probably because it is phylogenetically conserved (Song et al., 2022). The observed relationship between drought resilience and potential evapotranspiration is probably because evapotranspiration is strongly positively correlated with radiation (Table S2). Hence, for our study species high solar radiation rather than climatic drought affects their drought resilience, perhaps because most of our species come originally from relatively humid climates.
Conclusions
This study shows that leaf and stem traits are coordinated in terms of carbon assimilation and hydraulic efficiency. Two main strategy spectra were identified, namely the hydraulics spectrum and LES. The hydraulics spectrum runs from a conservative strategy with high hydraulic and biomechanical safety to an acquisitive strategy with high hydraulic efficiency. The LES runs from a conservative strategy with tough tissues and a long lifespan to an acquisitive strategy with high carbon assimilation. Pit aperture size is the central trait linking the hydraulics spectrum and LES. As pits form the ‘hydraulic bottleneck’, a large pit size is associated with increased stem diameter growth. A long leaf lifespan reduces drought recovery because of a reduced ability to replace drought‐damaged tissues and track new climatic conditions with new, acclimated leaves. These insights may be used to improve our models and predictions of tree responses to an uncertain and drier future.
Author contributions
YS, FS and LP designed the study, and BK, XZ, QL and YS contributed to data collection. YS analysed the data, and LP, FS and YS discussed and explained the results. YS wrote the first draft of the manuscript, which was edited by all authors.
Supporting information
Fig. S1 Figure showing how the branch sample was measured.
Fig. S2 Illustration of three drought resilience components for tree ring width reduction in the drought year 1976, and formulas for resistance, recovery and resilience.
Fig. S3 Map of the original distribution of the 28 conifer species. Occurrence records were retrieved from Global Biodiversity Information Facility (GBIF: https://www.gbif.org/).
Fig. S4 Analysis of the number of principal components to be retained in the PCA using Horn’s parallel analysis with the R package paran.
Fig. S5 Two network analyses based on statistical reasons and ecological reasons.
Fig. S6 Sensitivity analysis showing the average importance values (i.e. strength) of each of the 43 traits based on the networks in which it was included.
Fig. S7 Bivariate relationships between the first two PCA scores and growth rate.
Methods S1 Sample collection.
Methods S2 Carbon and nutrient investments.
Methods S3 Wood anatomy.
Methods S4 Hydraulics and cavitation resistance.
Methods S5 Pressure–volume traits.
Methods S6 Drought resilience components.
Table S1 Overview of 28 conifer species, family, abbreviations and distribution area.
Table S3 Pearson correlations between the 10th quantile of climate data, stem growth rate, growth resilience, functional traits and the first two PCA scores from Fig. 2.
Table S4 Pearson correlations between the 50th quantile of climate data, stem growth rate, growth resilience, functional traits and the first two PCA scores from Fig. 2.
Table S5 Pearson correlations between the 90th quantile of climate data, stem growth rate, growth resilience, functional traits and the first two PCA scores from Fig. 2.
Table S6 Two ways of network selection per trait per cluster group.
Table S7 The results of individual models based on best models (ΔAICc < 2) showing how these functional traits from eight different cluster groups affect conifer species growth (in light blue) and growth resilience (in light grey).
Table S2 Pearson correlations among different quantiles of climate data (i.e. 10th quantile, 50th quantile and 90th quantile) for 28 conifer species.
Please note: Wiley Blackwell are not responsible for the content or functionality of any Supporting Information supplied by the authors. Any queries (other than missing material) should be directed to the New Phytologist Central Office.
Acknowledgements
This study was funded by the KNAW Fonds Ecologie under grant no. KNAWWF/807/19033, Oudemans Foundation from Schovenhorst estate, LEB fonds from Wageningen University (2018‐051C Song) and the China Scholarship Council (CSC, no. 201706140106). We are very grateful to Jop de Klein and Els van Ginkel for allowing fieldwork at Schovenhorst and for logistical support. We thank Surya Kumar Maharjan, Masha T. van der Sande and Dylan Craven for providing analysis code. We are very grateful to Ute Sass‐Klaassen for commenting on drought resilience calculations. We acknowledge Angelina Horsting, Chenxuan Li, Dainius Masiliūnas, Ellen Wilderink, Jing Li, Jose A. Medina‐Vega, Leo Goudzwaard, Linar Akhmetzyanov, Manuel Rodriguez Carracedo, Matteo Dell’Oro, Na Wang, Rodrigo Munoz Aviles, Sylvain Delzon, Weixuan Peng, Xiaohan Yin, Yanjie Xu, Shanshan Yang, Shenglai Yin, Zexin Fan and Zulin Mei for assistance with fieldwork and lab work. The authors have no conflicts of interest to declare.
Data availability
The data and code that support this study are available upon reasonable request from the coauthors.
References
- Anderegg LD, Berner LT, Badgley G, Sethi ML, Law BE, HilleRisLambers J. 2018. Within‐species patterns challenge our understanding of the leaf economics spectrum. Ecology Letters 21: 734–744. [DOI] [PubMed] [Google Scholar]
- Anderegg WR, Klein T, Bartlett M, Sack L, Pellegrini AF, Choat B, Jansen S. 2016. Meta‐analysis reveals that hydraulic traits explain cross‐species patterns of drought‐induced tree mortality across the globe. Proceedings of the National Academy of Sciences, USA 113: 5024–5029. [DOI] [PMC free article] [PubMed] [Google Scholar]
- Bartlett MK, Scoffoni C, Sack L. 2012. The determinants of leaf turgor loss point and prediction of drought tolerance of species and biomes: a global meta‐analysis. Ecology Letters 15: 393–405. [DOI] [PubMed] [Google Scholar]
- Barton K. 2020. Package ‘mumin’. Multi‐model inference. R v.1.46.0. [WWW document] URL https://cran.r‐project.org/web/packages/MuMIn/MuMIn.pdf [accessed 1 March 2021]. [Google Scholar]
- Bellard C, Bertelsmeier C, Leadley P, Thuiller W, Courchamp F. 2012. Impacts of climate change on the future of biodiversity. Ecology Letters 15: 365–377. [DOI] [PMC free article] [PubMed] [Google Scholar]
- Bhaskar R, Ackerly D. 2006. Ecological relevance of minimum seasonal water potentials. Physiologia Plantarum 127: 353–359. [Google Scholar]
- Brodribb TJ, Bienaimé D, Marmottant P. 2016. Revealing catastrophic failure of leaf networks under stress. Proceedings of the National Academy of Sciences, USA 113: 4865–4869. [DOI] [PMC free article] [PubMed] [Google Scholar]
- Brodribb T, Feild T. 2000. Stem hydraulic supply is linked to leaf photosynthetic capacity: evidence from New Caledonian and Tasmanian rainforests. Plant, Cell & Environment 23: 1381–1388. [Google Scholar]
- Brodribb TJ, Powers J, Cochard H, Choat B. 2020. Hanging by a thread? Forests and drought. Science 368: 261–266. [DOI] [PubMed] [Google Scholar]
- Brown JH, Gillooly JF, Allen AP, Savage VM, West GB. 2004. Toward a metabolic theory of ecology. Ecology 85: 1771–1789. [Google Scholar]
- Chamberlain S, Ram K, Barve V, Mcglinn D, Chamberlain MS. 2017. Package ‘rgbif’. Interface to the Global Biodiversity Information Facility ‘API’. R v.0.9.7. [WWW document] URL https://cran.microsoft.com/snapshot/2017‐04‐05/web/packages/rgbif/rgbif.pdf [accessed 10 May 2018]. [Google Scholar]
- Chave J, Coomes D, Jansen S, Lewis SL, Swenson NG, Zanne AE. 2009. Towards a worldwide wood economics spectrum. Ecology Letters 12: 351–366. [DOI] [PubMed] [Google Scholar]
- Choat B, Brodribb TJ, Brodersen CR, Duursma RA, Lopez R, Medlyn BE. 2018. Triggers of tree mortality under drought. Nature 558: 531–539. [DOI] [PubMed] [Google Scholar]
- Choat B, Jansen S, Brodribb TJ, Cochard H, Delzon S, Bhaskar R, Bucci SJ, Feild TS, Gleason SM, Hacke UG et al. 2012. Global convergence in the vulnerability of forests to drought. Nature 491: 752–755. [DOI] [PubMed] [Google Scholar]
- Cornelissen JHC, Sass‐Klaassen U, Poorter L, van Geffen K, van Logtestijn RSP, van Hal J, Goudzwaard L, Sterck FJ, Klaassen RKWM, Freschet GT et al. 2012. Controls on coarse wood decay in temperate tree species: birth of the LOGLIFE experiment. Ambio 41: 231–245. [DOI] [PMC free article] [PubMed] [Google Scholar]
- Davies S, Bathgate S, Petr M, Gale A, Patenaude G, Perks M. 2020. Drought risk to timber production–A risk versus return comparison of commercial conifer species in Scotland. Forest Policy and Economics 117: 102189. [Google Scholar]
- Delzon S, Douthe C, Sala A, Cochard H. 2010. Mechanism of water‐stress induced cavitation in conifers: bordered pit structure and function support the hypothesis of seal capillary‐seeding. Plant, Cell & Environment 33: 2101–2111. [DOI] [PMC free article] [PubMed] [Google Scholar]
- DeSoto L, Cailleret M, Sterck F, Jansen S, Kramer K, Robert EMR, Aakala T, Amoroso MM, Bigler C, Camarero JJ et al. 2020. Low growth resilience to drought is related to future mortality risk in trees. Nature Communications 11: 1–9. [DOI] [PMC free article] [PubMed] [Google Scholar]
- Díaz S, Kattge J, Cornelissen JHC, Wright IJ, Lavorel S, Dray S, Reu B, Kleyer M, Wirth C, Colin Prentice I et al. 2016. The global spectrum of plant form and function. Nature 529: 167–171. [DOI] [PubMed] [Google Scholar]
- Dinno A. 2018. paran: Horn’s test of principal components/factors. R v.1.5.2. [WWW document] URL https://cran.r‐project.org/web/packages/paran/index.html [accessed 20 December 2021]. [Google Scholar]
- Domec JC, Lachenbruch B, Meinzer FC. 2006. Bordered pit structure and function determine spatial patterns of air‐seeding thresholds in xylem of Douglas‐fir (Pseudotsuga menziesii; Pinaceae) trees. American Journal of Botany 93: 1588–1600. [DOI] [PubMed] [Google Scholar]
- Edwards EJ, Chatelet DS, Sack L, Donoghue MJ. 2014. Leaf life span and the leaf economic spectrum in the context of whole plant architecture. Journal of Ecology 102: 328–336. [Google Scholar]
- Epskamp S, Borsboom D, Fried EI. 2018. Estimating psychological networks and their accuracy: a tutorial paper. Behavior Research Methods 50: 195–212. [DOI] [PMC free article] [PubMed] [Google Scholar]
- Epskamp S, Fried EI, Epskamp MS. 2015. Package ‘bootnet’. Bootstrap methods for various network estimation routines. R v.0.1. [WWW document] URL https://mran.revolutionanalytics.com/snapshot/2015‐05‐16/web/packages/bootnet/bootnet.pdf [accessed 3 March 2021]. [Google Scholar]
- Epskamp S, Fried EI. 2018. A tutorial on regularized partial correlation networks. Psychological Methods 23: 617. [DOI] [PubMed] [Google Scholar]
- Farjon A, Filer D. 2013. An atlas of the world's conifers: an analysis of their distribution, biogeography, diversity and conservation status. Leiden, the Netherlands: Brill Press. [Google Scholar]
- Gazol A, Camarero J, Anderegg W, Vicente‐Serrano S. 2017. Impacts of droughts on the growth resilience of Northern Hemisphere forests. Global Ecology and Biogeography 26: 166–176. [Google Scholar]
- GBIF . 2019. Global Biodiversity Information Facility. [WWW document] URL http://www.gbif.org [accessed 3 June 2019].
- Guillemot J, Martin‐StPaul NK, Bulascoschi L, Poorter L, Morin X, Pinho BX, Maire G, Bittencourt P, Oliveira RS, Bongers F et al. 2022. Small and slow is safe: on the drought tolerance of tropical tree species. Global Change Biology 28: 2622–2638. [DOI] [PubMed] [Google Scholar]
- Hacke UG, Sperry JS, Pockman WT, Davis SD, McCulloh KA. 2001. Trends in wood density and structure are linked to prevention of xylem implosion by negative pressure. Oecologia 126: 457–461. [DOI] [PubMed] [Google Scholar]
- Hacke UG, Sperry JS, Wheeler JK, Castro L. 2006. Scaling of angiosperm xylem structure with safety and efficiency. Tree Physiology 26: 689–701. [DOI] [PubMed] [Google Scholar]
- Hämäläinen S, Fey K, Selonen V. 2018. Habitat and nest use during natal dispersal of the urban red squirrel (Sciurus vulgaris). Landscape and Urban Planning 169: 269–275. [Google Scholar]
- Hansen H, Dörffling K. 2003. Root‐derived trans‐zeatin riboside and abscisic acid in drought‐stressed and rewatered sunflower plants: interaction in the control of leaf diffusive resistance? Functional Plant Biology 30: 365–375. [DOI] [PubMed] [Google Scholar]
- Harrell FE Jr, Harrell MFE Jr. 2019. Package ‘hmisc’. CRAN2018 2019: 235–236. R v.4.7‐0 [WWW document] URL https://cran.r‐project.org/package=Hmisc. [accessed 1 April 2020]. [Google Scholar]
- He N, Li Y, Liu C, Xu LI, Li M, Zhang J, He J, Tang Z, Han X, Ye Q et al. 2020. Plant trait networks: improved resolution of the dimensionality of adaptation. Trends in Ecology & Evolution 35: 908–918. [DOI] [PubMed] [Google Scholar]
- He P, Wright IJ, Zhu S, Onoda Y, Liu H, Li R, Liu X, Hua L, Oyanoghafo OO, Ye Q. 2019. Leaf mechanical strength and photosynthetic capacity vary independently across 57 subtropical forest species with contrasting light requirements. New Phytologist 223: 607–618. [DOI] [PubMed] [Google Scholar]
- Hijmans RJ, van Etten J, Mattiuzzi M, Sumner M, Greenberg J, Lamigueiro O, Bevan A, Racine E, Shortridge A. 2015. Raster: geographic data analysis and modeling. R v.3.5‐15. [WWW document] URL https://cran.r‐project.org/web/packages/raster/index.html [accessed 5 July 2019]. [Google Scholar]
- IPCC . 2013. Climate Change 2013: the physical science basis. Cambridge, UK; New York, NY, USA: Cambridge University Press. [Google Scholar]
- Jansen S, McAdam S. 2019. Pits with aspiration explain life expectancy of a conifer species. Proceedings of the National Academy of Sciences, USA 116: 14794–14796. [DOI] [PMC free article] [PubMed] [Google Scholar]
- Jennions MD, Møller AP. 2003. A survey of the statistical power of research in behavioral ecology and animal behavior. Behavioral Ecology 14: 438–445. [Google Scholar]
- Jump AS, Ruiz‐Benito P, Greenwood S, Allen CD, Kitzberger T, Fensham R, Martínez‐Vilalta J, Lloret F. 2017. Structural overshoot of tree growth with climate variability and the global spectrum of drought‐induced forest dieback. Global Change Biology 23: 3742–3757. [DOI] [PubMed] [Google Scholar]
- Kawai K, Okada N. 2019. Coordination of leaf and stem traits in 25 species of Fagaceae from three biomes of East Asia. Botany‐Botanique 97: 391–403. [Google Scholar]
- Kitajima K, Poorter L. 2010. Tissue‐level leaf toughness, but not lamina thickness, predicts sapling leaf lifespan and shade tolerance of tropical tree species. New Phytologist 186: 708–721. [DOI] [PubMed] [Google Scholar]
- Kolde R. 2019. pheatmap: pretty heatmaps. R v.1.0.12. [WWW document] URL https://cran.r‐project.org/web/packages/pheatmap/index.html [accessed 2 March 2021]. [Google Scholar]
- Larter M, Pfautsch S, Domec JC, Trueba S, Nagalingum N, Delzon S. 2017. Aridity drove the evolution of extreme embolism resistance and the radiation of conifer genus Callitris . New Phytologist 215: 97–112. [DOI] [PubMed] [Google Scholar]
- Lloret F, Keeling EG, Sala A. 2011. Components of tree resilience: effects of successive low‐growth episodes in old ponderosa pine forests. Oikos 120: 1909–1920. [Google Scholar]
- López R, Cano FJ, Martin‐StPaul NK, Cochard H, Choat B. 2021. Coordination of stem and leaf traits define different strategies to regulate water loss and tolerance ranges to aridity. New Phytologist 230: 497–509. [DOI] [PubMed] [Google Scholar]
- López R, López de Heredia U, Collada C, Cano FJ, Emerson BC, Cochard H, Gil L. 2013. Vulnerability to cavitation, hydraulic efficiency, growth and survival in an insular pine (Pinus canariensis). Annals of Botany 111: 1167–1179. [DOI] [PMC free article] [PubMed] [Google Scholar]
- Maharjan SK, Sterck FJ, Dhakal BP, Makri M, Poorter L. 2021. Functional traits shape tree species distribution in the Himalayas. Journal of Ecology 109: 3818–3834. [Google Scholar]
- Maherali H, Moura CF, Caldeira MC, Willson CJ, Jackson RB. 2006. Functional coordination between leaf gas exchange and vulnerability to xylem cavitation in temperate forest trees. Plant, Cell & Environment 29: 571–583. [DOI] [PubMed] [Google Scholar]
- Maréchaux I, Bartlett MK, Sack L, Baraloto C, Engel J, Joetzjer E, Chave J. 2015. Drought tolerance as predicted by leaf water potential at turgor loss point varies strongly across species within an Amazonian forest. Functional Ecology 29: 1268–1277. [Google Scholar]
- Niinemets Ü. 2001. Global‐scale climatic controls of leaf dry mass per area, density, and thickness in trees and shrubs. Ecology 82: 453–469. [Google Scholar]
- Onoda Y, Wright IJ, Evans JR, Hikosaka K, Kitajima K, Niinemets Ü, Poorter H, Tosens T, Westoby M. 2017. Physiological and structural tradeoffs underlying the leaf economics spectrum. New Phytologist 214: 1447–1463. [DOI] [PubMed] [Google Scholar]
- Osnas JL, Lichstein JW, Reich PB, Pacala SW. 2013. Global leaf trait relationships: mass, area, and the leaf economics spectrum. Science 340: 741–744. [DOI] [PubMed] [Google Scholar]
- Pan Y, Birdsey RA, Fang J, Houghton R, Kauppi PE, Kurz WA, Phillips OL, Shvidenko A, Lewis SL, Canadell JG et al. 2011. A large and persistent carbon sink in the world’s forests. Science 333: 988–993. [DOI] [PubMed] [Google Scholar]
- Plaut JA, Yepez EA, Hill J, Pangle R, Sperry JS, Pockman WT, Mcdowell NG. 2012. Hydraulic limits preceding mortality in a piñon–juniper woodland under experimental drought. Plant, Cell & Environment 35: 1601–1617. [DOI] [PubMed] [Google Scholar]
- Poorter L, Castilho CV, Schietti J, Oliveira RS, Costa FR. 2018. Can traits predict individual growth performance? A test in a hyperdiverse tropical forest. New Phytologist 219: 109–121. [DOI] [PMC free article] [PubMed] [Google Scholar]
- Poorter L, Craven D, Jakovac CC, van der Sande MT, Amissah L, Bongers F, Chazdon RL, Farrior CE, Kambach S, Meave JA et al. 2021. Multidimensional tropical forest recovery. Science 374: 1370–1376. [DOI] [PubMed] [Google Scholar]
- Poorter L, McDonald I, Alarcón A, Fichtler E, Licona JC, Peña‐Claros M, Sterck F, Villegas Z, Sass‐Klaassen U. 2010. The importance of wood traits and hydraulic conductance for the performance and life history strategies of 42 rainforest tree species. New Phytologist 185: 481–492. [DOI] [PubMed] [Google Scholar]
- Poorter L, Wright SJ, Paz H, Ackerly DD, Condit R, Ibarra‐Manríquez G, Harms KE, Licona JC, Martínez‐Ramos M, Mazer SJ et al. 2008. Are functional traits good predictors of demographic rates? Evidence from five neotropical forests. Ecology 89: 1908–1920. [DOI] [PubMed] [Google Scholar]
- Quero JL, Sterck FJ, Martínez‐Vilalta J, Villar R. 2011. Water‐use strategies of six co‐existing Mediterranean woody species during a summer drought. Oecologia 166: 45–57. [DOI] [PubMed] [Google Scholar]
- R Core Team . 2020. R: a language and environment for statistical computing,v.4.0.3. Vienna, Austria: R Foundation for Statistical Computing. [WWWdocument] URL https://www.r‐project.org/ [accessed 1 July 2020]. [Google Scholar]
- Ramírez‐Valiente JA, López R, Hipp AL, Aranda I. 2020. Correlated evolution of morphology, gas exchange, growth rates and hydraulics as a response to precipitation and temperature regimes in oaks (Quercus). New Phytologist 227: 794–809. [DOI] [PubMed] [Google Scholar]
- Reich PB. 2014. The world‐wide ‘fast–slow’ plant economics spectrum: a traits manifesto. Journal of Ecology 102: 275–301. [Google Scholar]
- Rosas T, Mencuccini M, Barba J, Cochard H, Saura‐Mas S, Martínez‐Vilalta J. 2019. Adjustments and coordination of hydraulic, leaf and stem traits along a water availability gradient. New Phytologist 223: 632–646. [DOI] [PubMed] [Google Scholar]
- Rosas Torrent T. 2019. Integrating plant hydraulics into functional traits framework to understand plant adjustments along a water availability gradient. Doctoral dissertation, Universitat Autònoma de Barcelona, Spain. [Google Scholar]
- Roskilly B, Keeling E, Hood S, Giuggiola A, Sala A. 2019. Conflicting functional effects of xylem pit structure relate to the growth‐longevity trade‐off in a conifer species. Proceedings of the National Academy of Sciences, USA 116: 15282–15287. [DOI] [PMC free article] [PubMed] [Google Scholar]
- Sack L, Pasquet‐Kok J, Contributors P. 2011. Leaf pressure–volume curve parameters. PrometheusWiki website: [WWW document] URL http://prometheuswiki.org/tiki‐index.php [accessed 10 April 2019]. [Google Scholar]
- Sack L, Tyree MT. 2005. Leaf hydraulics and its implications in plant structure and function. In: Holbrook NM, Zweiniecki MA, eds. Vascular transport in plants. Oxford, UK: Elsevier/Academic Press. [Google Scholar]
- van der Sande MT, Poorter L, Schnitzer SA, Engelbrecht BM, Markesteijn L. 2019. The hydraulic efficiency–safety trade‐off differs between lianas and trees. Ecology 100: e02666. [DOI] [PMC free article] [PubMed] [Google Scholar]
- Sardans J, Vallicrosa H, Zuccarini P, Farré‐Armengol G, Fernández‐Martínez M, Peguero G, Gargallo‐Garriga A, Ciais P, Janssens IA, Obersteiner M et al. 2021. Empirical support for the biogeochemical niche hypothesis in forest trees. Nature Ecology & Evolution 5: 184–194. [DOI] [PubMed] [Google Scholar]
- Song Y, Poorter L, Horsting A, Delzon S, Sterck F. 2022. Pit and tracheid anatomy explain hydraulic safety but not hydraulic efficiency of 28 conifer species. Journal of Experimental Botany 73: 1033–1048. [DOI] [PMC free article] [PubMed] [Google Scholar]
- Song Y, Sass‐Klaassen U, Sterck F, Goudzwaard L, Akhmetzyanov L, Poorter L. 2021. Growth of 19 conifer species is highly sensitive to winter warming, spring frost and summer drought. Annals of Botany 128: 545–557. [DOI] [PMC free article] [PubMed] [Google Scholar]
- Sterck FJ, Martínez‐Vilalta J, Mencuccini M, Cochard H, Gerrits P, Zweifel R, Herrero A, Korhonen JFJ, Llorens P, Nikinmaa E et al. 2012. Understanding trait interactions and their impacts on growth in Scots pine branches across Europe. Functional Ecology 26: 541–549. [Google Scholar]
- Sterck F, Poorter L, Schieving F. 2006. Leaf traits determine the growth‐survival trade‐off across rain forest tree species. The American Naturalist 167: 758–765. [DOI] [PubMed] [Google Scholar]
- Sterck FJ, Zweifel R, Sass‐Klaassen U, Chowdhury Q. 2008. Persisting soil drought reduces leaf specific conductivity in Scots pine (Pinus sylvestris) and pubescent oak (Quercus pubescens). Tree Physiology 28: 529–536. [DOI] [PubMed] [Google Scholar]
- Thomas H, Gay A. 1987. Characterization of forages for drought resistance. IBPGR Training Courses: Lecture Series 1: 29–35. [Google Scholar]
- TNO‐NITG . 2020. Data and information of the Dutch subsurface [WWW document] URL https://www.dinoloket.nl/ondergrondgegevens [accessed 12 January 2020].
- Trabucco A, Zomer R. 2018. Global aridity index and potential evapo‐transpiration (ET0) climate database v.2. CGIAR Consortium for Spatial Information (CGIAR‐CSI). [WWW document] URL https://figshare.com/articles/Global_Aridity_Index_and_Potential_Evapotranspiration_ET0_Climate_Database_v2/7504448/1 [accessed 25 June 2019]. [Google Scholar]
- Walters MB, Gerlach JP. 2013. Intraspecific growth and functional leaf trait responses to natural soil resource gradients for conifer species with contrasting leaf habit. Tree Physiology 33: 297–310. [DOI] [PubMed] [Google Scholar]
- Westoby M. 1998. A leaf‐height‐seed (LHS) plant ecology strategy scheme. Plant and Soil 199: 213–227. [Google Scholar]
- Wright IJ, Reich PB, Westoby M, Ackerly DD, Baruch Z, Bongers F, Cavender‐Bares J, Chapin T, Cornelissen JHC, Diemer M et al. 2004. The worldwide leaf economics spectrum. Nature 428: 821–827. [DOI] [PubMed] [Google Scholar]
- Wright IJ, Reich PB, Cornelissen JHC, Falster DS, Groom PK, Hikosaka K, Lee W, Lusk CH, Niinemets Ü, Oleksyn J et al. 2005. Modulation of leaf economic traits and trait relationships by climate. Global Ecology and Biogeography 14: 411–421. [Google Scholar]
- Wu J, Albert LP, Lopes AP, Restrepo‐Coupe N, Hayek M, Wiedemann KT, Guan K, Stark SC, Christoffersen B, Prohaska N et al. 2016. Leaf development and demography explain photosynthetic seasonality in Amazon evergreen forests. Science 351: 972–976. [DOI] [PubMed] [Google Scholar]
- Yang S, Sterck FJ, Sass‐Klaassen U, Cornelissen JHC, van Logtestijn RSP, Hefting M, Goudzwaard L, Zuo J, Poorter L. 2022. Stem trait spectra underpin multiple functions of temperate tree species. Frontiers in Plant Science 13: 1–15. [DOI] [PMC free article] [PubMed] [Google Scholar]
- Yao GQ, Nie ZF, Turner NC, Li FM, Gao TP, Fang XW, Scoffoni C. 2021. Combined high leaf hydraulic safety and efficiency provides drought tolerance in Caragana species adapted to low mean annual precipitation. New Phytologist 229: 230–244. [DOI] [PMC free article] [PubMed] [Google Scholar]
- Yu H‐W, He W‐M. 2017. Negative legacy effects of rainfall and nitrogen amendment on leaf lifespan of steppe species. Journal of Plant Ecology 10: 831–838. [Google Scholar]
- Zweifel R, Etzold S, Sterck F, Gessler A, Anfodillo T, Mencuccini M, von Arx G, Lazzarin M, Haeni M, Feichtinger L et al. 2020. Determinants of legacy effects in pine trees–implications from an irrigation‐stop experiment. New Phytologist 227: 1081. [DOI] [PMC free article] [PubMed] [Google Scholar]
- Zweifel R, Sterck F. 2018. A conceptual tree model explaining legacy effects on stem growth. Frontiers in Forests and Global Change 1: 9. [Google Scholar]
Associated Data
This section collects any data citations, data availability statements, or supplementary materials included in this article.
Supplementary Materials
Fig. S1 Figure showing how the branch sample was measured.
Fig. S2 Illustration of three drought resilience components for tree ring width reduction in the drought year 1976, and formulas for resistance, recovery and resilience.
Fig. S3 Map of the original distribution of the 28 conifer species. Occurrence records were retrieved from Global Biodiversity Information Facility (GBIF: https://www.gbif.org/).
Fig. S4 Analysis of the number of principal components to be retained in the PCA using Horn’s parallel analysis with the R package paran.
Fig. S5 Two network analyses based on statistical reasons and ecological reasons.
Fig. S6 Sensitivity analysis showing the average importance values (i.e. strength) of each of the 43 traits based on the networks in which it was included.
Fig. S7 Bivariate relationships between the first two PCA scores and growth rate.
Methods S1 Sample collection.
Methods S2 Carbon and nutrient investments.
Methods S3 Wood anatomy.
Methods S4 Hydraulics and cavitation resistance.
Methods S5 Pressure–volume traits.
Methods S6 Drought resilience components.
Table S1 Overview of 28 conifer species, family, abbreviations and distribution area.
Table S3 Pearson correlations between the 10th quantile of climate data, stem growth rate, growth resilience, functional traits and the first two PCA scores from Fig. 2.
Table S4 Pearson correlations between the 50th quantile of climate data, stem growth rate, growth resilience, functional traits and the first two PCA scores from Fig. 2.
Table S5 Pearson correlations between the 90th quantile of climate data, stem growth rate, growth resilience, functional traits and the first two PCA scores from Fig. 2.
Table S6 Two ways of network selection per trait per cluster group.
Table S7 The results of individual models based on best models (ΔAICc < 2) showing how these functional traits from eight different cluster groups affect conifer species growth (in light blue) and growth resilience (in light grey).
Table S2 Pearson correlations among different quantiles of climate data (i.e. 10th quantile, 50th quantile and 90th quantile) for 28 conifer species.
Please note: Wiley Blackwell are not responsible for the content or functionality of any Supporting Information supplied by the authors. Any queries (other than missing material) should be directed to the New Phytologist Central Office.
Data Availability Statement
The data and code that support this study are available upon reasonable request from the coauthors.