

Abstract
Defective DNA mismatch repair (dMMR) causes elevated tumour mutational burden (TMB) and microsatellite instability (MSI) in multiple cancer types. dMMR/MSI colorectal cancers (CRCs) have enhanced T‐cell infiltrate and favourable outcome; however, this association has not been reliably detected in other tumour types, including endometrial cancer (EC). We sought to confirm this and explore the underpinning mechanisms. We first meta‐analysed CRC and EC trials that have examined the prognostic value of dMMR/MSI and confirmed that dMMR/MSI predicts better prognosis in CRC, but not EC, with statistically significant variation between cancers (hazard ratio [HR] = 0.63, 95% confidence interval [CI] = 0.54–0.73 versus HR = 1.15, 95% CI = 0.72–1.58; P INT = 0.02). Next, we studied intratumoural immune infiltrate in CRCs and ECs of defined MMR status and found that while dMMR was associated with increased density of tumour‐infiltrating CD3+ and CD8+ T‐cells in both cancer types, the increases were substantially greater in CRC and significant only in this group (P INT = 4.3e‐04 and 7.3e‐03, respectively). Analysis of CRC and EC from the independent Cancer Genome Atlas (TCGA) series revealed similar variation and significant interactions in proportions of tumour‐infiltrating lymphocytes, CD8+, CD4+, NK cells and immune checkpoint expression, confirming a more vigorous immune response to dMMR/MSI in CRC than EC. Agnostic analysis identified the IFNγ pathway activity as strongly upregulated by dMMR/MSI in CRC, but downregulated in EC by frequent JAK1 mutations, the impact of which on IFNγ response was confirmed by functional analyses. Collectively, our results confirm the discordant prognosis of dMMR/MSI in CRC and EC and suggest that this relates to differences in intratumoural immune infiltrate and tumour genome. Our study underscores the need for tissue‐specific analysis of cancer biomarkers and may help inform immunotherapy use. © 2022 The Authors. The Journal of Pathology published by John Wiley & Sons Ltd on behalf of The Pathological Society of Great Britain and Ireland.
Keywords: colorectal cancer, endometrial cancer, mismatch repair deficiency, microsatellite instability, immune response, immune escape
Introduction
The DNA mismatch repair (MMR) system plays a critical role in suppression of mutagenesis and cancer [1]. Defective DNA mismatch repair (dMMR) occurs with variable prevalence across cancer types, although most commonly in colorectal and endometrial cancer (CRC and EC), in which it is found in 10–15% and 20–25% of cases respectively [2, 3]. Mechanistically, dMMR arises either as a consequence of inherited defects in MMR genes—a condition known as Lynch syndrome (LS)—or as a somatic event from MLH1 promoter methylation or biallelic somatic MMR gene mutations. Irrespective of its cause, it leads to a failure to correct base mispairs and small insertion–deletion (indel) mutations incorporated during DNA replication, leading to an elevated tumour mutational burden (TMB), and slippage at repetitive DNA microsatellites, a phenomenon referred to as microsatellite instability (MSI) [2, 3]. Early studies suggested that early‐stage colorectal cancers (CRCs) with dMMR had a favourable outcome, a finding which has been confirmed in other series [4]. The subsequent demonstration that dMMR CRCs commonly display a dense lymphocytic infiltrate [5] provided a plausible explanation for their improved prognosis, and has led to a broadly accepted model in which dMMR causes elevated TMB, and an increase in the number of mutated neoantigens recognised as nonself by cytotoxic T‐cells, inducing a tumour suppressive cytolytic immune response [6]. This model is supported by recent data showing that LS‐associated dMMR tumours have higher TMB and denser T‐cell infiltrate than sporadic dMMR tumours of the same type [7, 8], and that (at least in the case of CRC), this is reflected in a seemingly better outcome for LS dMMR cases [7]. Of course, the fact that all such cancers have grown to the extent that they are diagnosed demonstrates that some degree of immune escape has occurred. The mechanisms by which this occurs are multiple and an active area of research, but it is clear that mutations in antigen presentation components and immunomodulatory signalling pathways play a pivotal role, as does upregulation of immunosuppressive immune checkpoint molecules such as CTLA4, PD1, and PDL1 [6, 9, 10]. Targeting of these immune checkpoints in otherwise treatment‐refractory dMMR metastatic cancers results in frequent and, in some cases, sustained responses [11], leading the US Food and Drug Administration (US FDA) to license the use of anti‐PD1 therapy for this molecular subset irrespective of histology; the first tumour type agnostic biomarker approved for such an indication [12].
While the molecular and clinical impact of dMMR has been intensively investigated, current understanding of its variation across cancers remains far from complete. Perhaps the most obvious example is between the cancer types in which dMMR is most common—colorectal and endometrial [2, 3]. In both cases, dMMR/MSI tumours display hypermutation (often defined as TMB greater than 10 mutations/Mb), and increased density of cytotoxic T lymphocytes when compared to their proficient MMR (pMMR) / microsatellite stable (MSS) counterparts [13, 14, 15, 16]. However, while formal comparison has not been performed, most studies of the prognosis of dMMR EC have not reported the favourable prognosis seen in CRC [17], and some have even suggested a worse outcome than pMMR/MSS ECs, with a similarly low burden of copy number alterations [18]. This discordance is intriguing, as ultramutated (typically >100 mutations/Mb) tumours with POLE exonuclease domain mutations display excellent prognosis in both tumour types [19, 20]. It is also not merely of academic interest, because understanding the underlying mechanisms could reveal novel therapeutic targets in dMMR EC to improve the outcome in this challenging subset. In this study we sought to define the variation in prognosis of dMMR between CRC and EC by meta‐analysis, and to delineate the underpinning immunological and molecular mechanisms. Our results provide new insights into the tissue‐specific variation of dMMR and the immune response to hypermutation.
Materials and methods
Ethical approval
The Biomarkers Of Lynch syndrome Tumours (BOLT) study was sponsored by the University of Manchester and approved by the North West Greater Manchester Research Ethics Committee (ref: 16/NW/0164).
Ethical approval for analysis of human tumour samples used in this study was given by committees at all participating institutions; approval for integrated analysis of datasets was provided by REC reference 18/SC/0533.
Design and study cohorts
Studies for meta‐analysis were identified by PubMed search using the terms ‘colorectal’ OR ‘endometrial’ AND ‘mismatch repair’ OR ‘microsatellite instability’ AND ‘prognosis,’ limiting results to clinical trials published between 2000 and 2021. Cases with defined mismatch repair status (pMMR, dMMR sporadic, dMMR Lynch) for immunoprofiling were assembled from the BOLT study [21] and retrospective population‐based cohorts curated by the University of Manchester (UK) and the Leiden University Medical Center (NL).
Determination of dMMR/MSI and Lynch syndrome status in study cohorts
MMR status in the retrospective CRC and EC cohorts was determined by immunohistochemistry as reported previously [22]. Following microwave antigen retrieval (in 10 mm Tris‐EDTA buffer, pH 9.0), formalin‐fixed paraffin‐embedded (FFPE) sections were incubated overnight with primary antibodies against MLH1 (clone ES05, 1:100; Dako), MSH2 (clone FE11, 1:200, Dako, Santa Clara, CA, USA), MSH6 (clone EPR3945, 1:800, Genetex, Irvine, CA, USA), all at room temperature, or PMS2 (clone EP51, 1:75, Dako) at 4 °C. Sections were then incubated for 15 min at room temperature with Envision FLEX+ Linker (Dako), followed by 30 min with secondary antibody (Poly‐HRP‐GAM/R/R; DPV0110HRP; ImmunoLogic, Duiven, The Netherlands), and colour developed using DAB before counterstaining and mounting. MMR loss was defined as complete loss of epithelial staining for ≥1 protein in the presence of positive stromal or immune cells. Tumour MSI status was determined by Promega MSI analysis system (v. 1.2, Promega, Madison, WI, USA) as reported previously [22]. Tumours with instability in ≥2 of 5 mononucleotide repeat markers were defined as being microsatellite instability‐high (MSI), whereas those showing no instability or instability at a single repeat were classified as MSS. Confirmation of Lynch syndrome was made by Regional Genetics Laboratories following testing of constitutional DNA for pathogenic MMR gene variants (InSiGHT Class IV or V) [23].
Multispectral immunofluorescence staining
Tumour infiltrating immune cells were quantified by multispectral immunofluorescence (IF) as described previously [24]. FFPE slides were deparaffinised before antigen retrieval using citrate buffer. The slides were then incubated overnight with primary antibodies for FoxP3 (236A/E7, 1:25, ThermoFisher Scientific, Waltham, MA, USA) and CD8 (4B11, 1:50, ThermoFisher Scientific). Following washes with phosphate‐buffered saline (PBS) supplemented with 0.05% Tween, slides were incubated for a further 1 h with the appropriate secondary fluorophore antibodies (CFF633 goat antimouse IgG1, 1:100, [Avantor, Radnor, PA, USA] and CF555 goat anti IgG2b, 1:100, [Sigma‐Aldrich, St. Louis, MO, USA] for FoxP3 and CD8 detection, respectively). The slides were then washed again, then incubated with conjugated antibodies (primary antibody with fluorophore) for CD3 (D7A6E, 1:50, Cell Signaling Technology, Beverly, MA, USA) and pan‐cytokeratin (Pankeratin (C11), 1:50, Cell Signaling Technology and Cytokeratin, AE1/AE3, 1:50, ThermoFisher Scientific) for 6 h. The slides were then washed again, DAPI applied as a nuclear stain and the slides mounted using ProLong Gold (ThermoFisher).
Image acquisition and analysis
Multispectral IF‐stained slides were imaged using the Vectra Polaris imaging system (Perkin Elmer, Waltham, MA, USA). Following initial whole slide scans, high‐power (40×x objective magnification) images were taken for analysis from representative sections (two from the tumour centre and one from the invasive margin). Tissue was segmented into epithelia and stroma by training on DAPI and cytokeratin stains and the following cell populations defined and quantified: total T‐cells (CD3+), cytotoxic T‐cells (CD3+CD8+), and T regulatory cells (CD3+FoxP3+).
TCGA analysis
MC3 MAFs containing curated TCGA colorectal (COADREAD) and endometrial (UCEC) cancer whole exome sequencing (WES) data were downloaded from the NIH Genomic Data Commons (https://gdc.cancer.gov/about-data/publications/mc3-2017) along with tumour MSI status determined by testing of microsatellite markers [13, 14]. Germline MMR gene mutations were identified by analysis of controlled‐access BAMs for pathogenic variants [23]. Controlled FASTq files for RNAseq data were downloaded from the NIH GDC data portal (https://portal.gdc.cancer.gov/) and processed by Salmon (see Supplementary materials and methods) to obtain relative transcript abundance (Transcripts Per Million—TPM) for downstream analysis. Estimates of tumour‐infiltrating immune cell populations and related data were downloaded from the supplementary material of Thorsson et al [25]. To calculate absolute estimates of immune cell populations, proportional estimates were multiplied by leucocyte fraction, the latter being an estimate of the total fraction of the bulk tumour due to immune cells. Methylation data for TCGA cases were downloaded from the National Institutes of Health (NIH) Genomic Data Commons (GDC). Probes mapping to MLH1, which were most differentially methylated according to tumour MSI status were identified using the TCGAbiolinks package (see Supplementary materials and methods).
Cell lines
Human endometrial adenocarcinoma cell lines were a kind gift from Konstantin Dedes (University of Zurich, Switzerland) and Britta Weigelt (previously Cancer Research UK, Lincoln's Inn Fields UK) or purchased from the European Collection of Authenticated Cell Cultures or the JCRB cell bank. The MSI status was determined using the Promega MSI analysis system and JAK1 mutation by whole exome sequencing (WES) done in‐house or by the Cancer Cell Line Encyclopedia: https://depmap.org/portal/ccle/. Cell lines were cultured under standard conditions. Full details are provided in the Supplementary materials and methods.
Interferon‐gamma stimulation
Cells for interferon‐gamma (IFN‐) stimulation were plated at 1×10⁶ cells in 25 cm2 cell culture flasks, grown to 70–80% confluency, and serum starved for 24 h before treatment with IFN‐ (554617, BD Biosciences, Franklin Lanes, NJ, USA) at 75 ng/ml or an equivalent volume of PBS for 16 h before cell lysis and protein collection.
Western blotting
Protein lysis and western blotting were performed according to standard methods. Full details, including antibody clones and concentrations, are provided in the Supplementary materials and methods.
Statistical analyses
Continuous variables were analysed using the nonparametric Mann–Whitney U test, given the lack of normal data distribution, with interaction testing performed using aligned‐rank analysis of variance (ANOVA). Categorical variables were analysed using Fisher's exact test. Meta‐analysis of trial data was performed by both fixed and random effects models using inverse variance weighting. Differentially expressed gene analyses and dysregulated processes/pathways, were identified by DESeq2 and clusterProfiler, respectively (see Supplementary materials and methods). The association of candidate immune escape mutations with tumour IFNγ pathway activity was analysed by multiple linear regression including tumour type and MSI status as covariables. All statistical analyses were performed in R, v. 4.0.1 (https://cran.r-project.org), using the packages ‘meta,’ ‘ggplot2,’ ‘DESeq2,’ ‘clusterProfiler,’ ‘TCGAbiolinks,’ and ‘MAFtools’ (see Supplementary materials and methods for sources). Statistical tests were two‐sided, and hypothesis testing was performed at the 5% significance level.
Results
Prognostic value of dMMR/MSI varies between CRC and EC
The robust association of dMMR with reduced recurrence risk in stage II CRC is reflected in its inclusion as a prognostic biomarker in clinical guidelines. However, similar analysis of EC suggests that dMMR carries either no prognostic import, or predicts worse outcome [17]. To confirm and quantify this, we did a meta‐analysis of published studies that have addressed this question. Limiting our inclusion to early‐stage (i.e. nonmetastatic) disease and to clinical trials (which provide a higher level of evidence than nonexperimental cohorts), we identified 12 CRC [20, 26, 27, 28, 29, 30, 31, 32, 33, 34, 35, 36] and 4 EC [37, 38, 39, 40] publications that met our search criteria (see Materials and methods and the PRISMA diagram shown in supplementary material, Figure S1 for details) reporting the analysis of 27 and 5 trials, respectively. Details of these studies are summarised in supplementary material, Table S1. Multivariable‐adjusted hazard ratios (HRs) for disease‐free survival (DFS) and overall survival (OS) were extracted from the study publications and pooled by fixed‐effects (FE) and random‐effects (RE) meta‐analysis. As expected, dMMR was associated with a substantial and highly significant improvement in DFS in CRC (HRRE = 0.62; 95% CI = 0.55–0.70%; p < 1e‐04), with moderate heterogeneity across studies (I2 = 47%, τ2 = 0.015, p = 0.036) (Figure 1). In contrast, similar analysis of EC revealed no significant association of dMMR with tumour recurrence (HRRE = 1.15; 95% CI = 0.72–1.58; p = 0.23), without significant between‐study heterogeneity (I2 = 31%, τ2 = 0.0571, p = 0.23) (Figure 1). Formal testing confirmed that this variation by tumour type was statistically significant (p = 0.02). Similar results were obtained for meta‐analysis of OS (supplementary material, Figure S2). Thus, dMMR is associated with better prognosis in early‐stage CRC, but not in EC.
Figure 1.
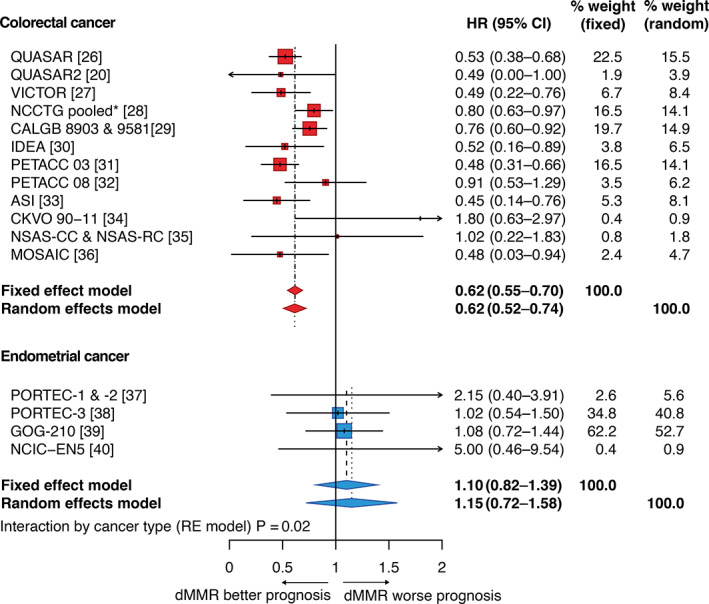
Association between MMR status and disease‐free survival (DFS) in colorectal and endometrial cancer. Forest plot showing meta‐analysis of clinical trials that have examined association of dMMR with DFS in CRC and EC (details in Materials and methods). Corresponding plot for overall survival (OS) is provided as supplementary material, Figure S1. *Pooled analysis includes Mayo Clinic and North Central Cancer Treatment Group (NCCTG) trials 78‐48‐52, 84‐46,52/Intergroup 0035, 89‐46‐51, 79‐46‐04, 87‐46‐51, 91‐46‐53, Federation Francophone de la Cancerologie Digestive (FFCD) 8802, Gruppo Italiano Valutazione Interventi in Oncologia (GIVIO), National Cancer Institute of Canada (NCIC) C03, NSABP C‐01, C‐02, C‐03, and C‐04.
dMMR is associated with greater increase in T‐cell infiltrate in CRC than in EC
Work from our group and others' has shown that dMMR is associated with increased intratumoural cell infiltrate in both CRC and EC [15, 16, 20]; however, whether this differs in magnitude and type between these cancer types is unknown. The discordant prognostic value of dMMR in CRC versus EC led us to speculate on this possibility. To test this, we assembled a large cohort of CRCs and ECs of defined MMR status, including both hereditary (LS) and sporadic (MLH1 methylation) causes of dMMR, and quantified the density and localisation of lymphocytic infiltrate by multispectral co‐immunofluorescence (see Materials and methods). Given the known association of POLE exonuclease domain mutations with increased tumour T‐cell infiltrate [15, 20], we excluded these from our analysis. When compared with MMRp tumours, median intraepithelial (IE) CD3+ and cytotoxic CD8+ T‐cell densities were numerically greater in dMMR tumours in both CRC and EC, with LS tumours tending to have denser infiltrate, in keeping with previous reports [7, 8, 41] (Figure 2A,B). However, while in CRC these increases were substantial and highly statistically significant, in EC any differences were far more modest and not statistically significant, reflected in statistically significant MMR*tumour type interactions for both markers (P INT = 4.3e‐04 and 7.3e‐03, respectively) (Figure 2B, supplementary material, Table S2). Analysis of the tumour invasive margin revealed similar findings (P INT = 3.1e‐04 and 0.037, respectively) (Figure 2B). Differences in intrastromal CD3+ and CD8+ infiltrate showed similar trends but were more modest (supplementary material, Figure S3A). No significant difference between groups was detected for either intraepithelial and intrastromal FoxP3+ cell infiltrate (supplementary material, Figure S3B).
Figure 2.
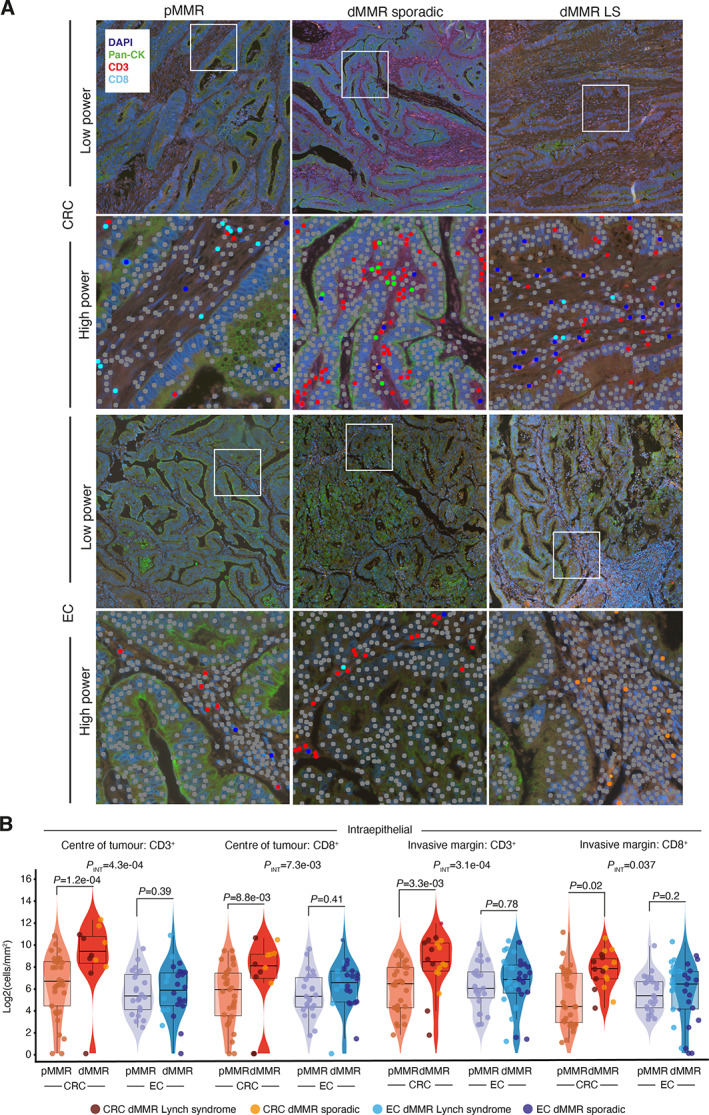
Intratumoural CD3+ and CD8+ cell infiltrate by MMR status and cancer type. (A) Representative multiplex co‐immunofluorescence images from mismatch repair‐proficient (pMMR) and mismatch repair‐deficient (dMMR) tumours of sporadic (MLH1 methylated) and Lynch Syndrome (LS) aetiology. High‐power magnification images illustrate automated quantification of tumour‐infiltrating immune cells. (B) Quantification of density of intraepithelial CD3+ and CD8+ cells in the tumour centre and invasive margin. Corresponding quantification for intrastromal lymphocytes is shown in supplementary material, Figure S2. Boxplots indicate sample median (thick line) interquartile ranges. Comparison between groups used a Mann–Whitney U test; tests for interaction used aligned rank ANOVA.
TCGA analysis confirms variable immune response against MSI between CRC and EC and identifies IFNγ response as a key discordant pathway
We sought to validate and extend these results by analysis of tumours from TCGA [13, 14], taking MSI as a broadly accepted surrogate for MMR deficiency. Using CIBERSORT estimates of tumour immune cell fractions from the Thorsson TCGA pan‐cancer immune study [25] (in which data underwent rigorous QC and extensive batch correction), we first confirmed that MSI was associated with a substantially greater increase in intratumoural lymphocyte fraction, and CD8+ cell fraction in CRC than EC, with statistically significant interaction in both cases (P INT = 0.002 and P INT = 0.005, respectively) (Figure 3A). Similar variation and statistically significant interactions were also observed for CIBERSORT estimates of CD4+ cells, activated NK cells, M1 and M2 macrophages, and neutrophils (Figure 3A), and expression of immune checkpoints PDCD1 (PD1), CD274 (PDL1), CTLA4, HAVCR2, LAG3, TIGIT, and VSIR determined by RNAseq (Figure 3A, supplementary material, Figure S4). We next took a hypothesis‐free approach to examine the consequences of dMMR/MSI between tumour types through gene set enrichment analysis (GSEA), beginning with CRC. Strikingly, among the 10 most enriched gene sets in MSI CRCs, nine involved an immune or antiviral response, including five corresponding to the IFNγ response, a pivotal player in antitumour immunity [42], and a central determinant of response to immune checkpoint blockade [43] (Figure 3B). In contrast, similar analysis of EC not only failed to demonstrate enrichment of immune system processes among MSI tumours, but also revealed significant downregulation of multiple IFNα gene sets in this subgroup (Figure 3B). Further analysis using a published IFNγ gene signature [25] revealed striking variation by cancer type and MSI status. While IFNγ pathway activity was, in general, lower in CRC than in EC, MSI CRCs demonstrated substantially, and highly significantl greater pathway activity compared to MSS CRCs (p = 1.7e‐10). In contrast, among ECs the opposite was the case; that is, MSI tumours had significantly lower IFNγ pathway activity (p = 2.3e‐03). Formal testing confirmed this interaction was highly statistically significant (P INT = 1.4e‐13) (Figure 3A).
Figure 3.
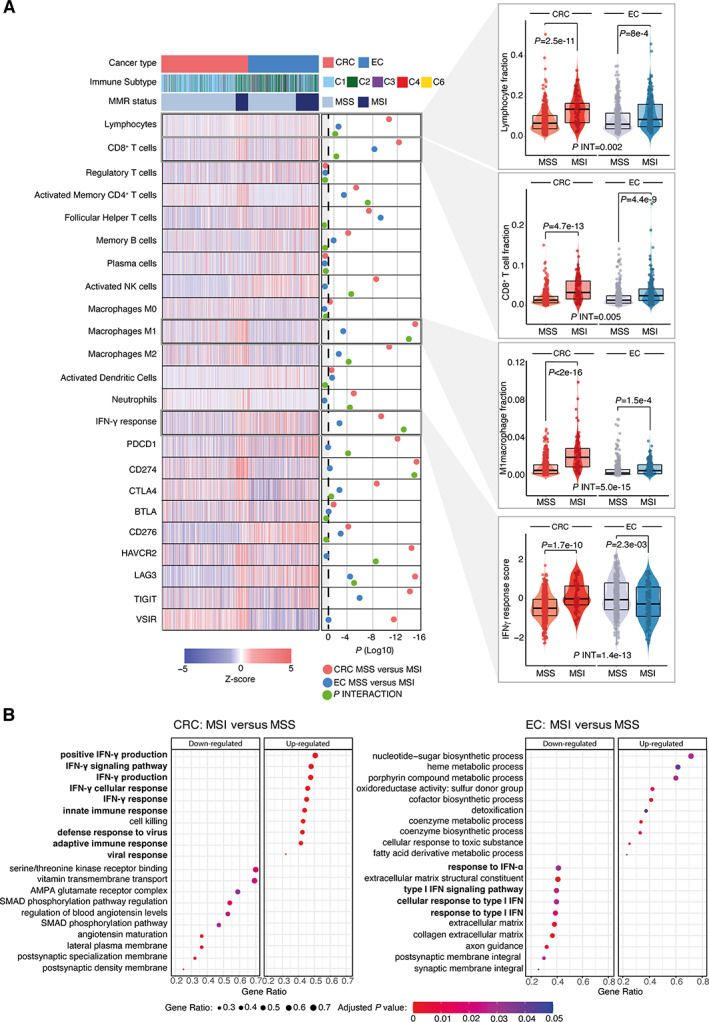
Intratumoural immune cell infiltrate, immune checkpoint expression, and most highly dysregulated pathways by MMR status and cancer type. (A) Heatmap showing relative tumour proportion of tumour‐infiltrating immune cells, IFNγ response score, and expression of immune checkpoints by cancer type, MMR status, and immune subgroup (C1–C6) according to the classification in Thorsson et al [25]. Corresponding scatterplots showing immune checkpoint expression are shown in the supplementary material, Figure S3. (B) Ten most upregulated and downregulated gene sets in MSI versus MSS tumours identified by gene set enrichment analysis. Immune‐related gene sets are highlighted in bold. Comparison between MSI and MSS tumours within cancer types in (A) used a Mann–Whitney U test; tests for interaction used aligned rank ANOVA. CRC, colorectal cancer; EC, endometrial cancer; MSI, microsatellite unstable; MSS, microsatellite stable.
Recurrent JAK1 frameshift mutations disrupt IFNγ signalling in MSI EC
We used the TCGA series to investigate whether the variation in immune response between dMMR/MSI CRC and EC reflected underlying differences in tumour biology and immunogenicity. TMB and predicted single nucleotide variant (SNV) and indel neoantigen burden (predictors of intratumoural immune infiltrate) were elevated in MSI tumours of both types. However, the increases were significantly greater in CRC (P INT = 2.48e‐08 to P INT = 0.040) (Figure 4A–D). These differences could not obviously be explained by differences in MLH1 promoter methylation or expression (Figure 4A, supplementary material, Figure S4), or secondary mutations in DNA repair genes (data not shown). Further analysis of a recently published set of genes implicated in immune escape [44] revealed notable variation between MSI tumours according to the tissue of origin. Genes enriched for loss of function (LOF) mutations in MSI CRC versus MSI EC included components of the MHC class I antigen presentation pathway, including HLA‐B, B2M, NLRC5, and TAP2 (p = 0.01 to p = 2.3e‐06, Fisher's exact test) (Figure 4A). While only two immune escape genes—JAK1 and RPL22—were more commonly subject to LOF mutations in MSI EC than MSI CRC, both were mutated at high frequency (23.8 and 31.9% cases, respectively, p = 3.0e‐04 and p = 0.02, respectively, Fisher's exact test) (Figure 4A), with the majority of JAK1 mutations being a recurrent frameshift at codon 860 (p.K860Nfs*16). We used multiple regression to test whether these differences could account for the variation in IFNγ pathway activity between MSI CRC and EC. Interestingly, other than the expected associations with tumour type and MSI status, the only significant predictor of IFNγ response were JAK1 LOF mutations, which predicted substantially reduced activity (β = −0.72, p = 2.48e‐07) (Figure 4E). Interestingly, reduced JAK1 expression and IFNγ were only detected in association with truncating frameshift mutations; predominantly the codon 860 variant (Figure 4F,G). JAK1 is a tyrosine kinase that binds IFN cell surface receptors to coordinate phosphorylation, oligomerization, and nuclear translocation of the transcription factor STAT1 [42], thus mediating type I and II IFN signalling. JAK1 mutations have been reported in dMMR EC and highlighted as a likely mechanism of immune escape [45, 46]. However, these studies did not perform mechanistic analysis, and an early functional analysis of JAK1 mutations in gynaecological cancers included only two EC cell lines and did not account for MMR status [47]. To study the impact of JAK1 mutations in detail, we screened a panel of EC cell lines of known MSI and JAK1 mutation status. JAK1 LOF mutations were detected in eight lines, seven of which were MSI—the single other line being HEC‐251, which carries a pathogenic POLE mutation. Six of these LOF mutations were the recurrent p.K860Nfs*16 frameshift, with several mutant lines harbouring more than one truncating mutation, suggesting compound heterozygosity, or demonstrating mutant allele fractions consistent with loss of heterozygosity of the wildtype allele. Immunoblot analysis confirmed JAK1 protein expression in all four MSS cell lines (although expression was reduced in HEC251 cells) and all three MSI cell lines lacking JAK1 mutations (Figure 5A). In contrast, six of seven MSI cell lines with JAK1 frameshift mutations showed loss of JAK1 protein, including all lines with the p.K860Nfs*16 variant (Figure 5A). Immunoblotting confirmed that JAK1 loss was associated with the absence of induction and phosphorylation of STAT1 and lack of upregulation of MHC class I heavy chain in response to IFNγ, consistent with functional loss of IFNγ pathway signalling (Figure 5B). Thus, the enrichment of JAK1 truncating frameshift mutations in dMMR/MSI EC at least partly explains their lack of IFNγ response, and may also partly explain the absence of a prognostic benefit of MMR loss in this tumour type.
Figure 4.
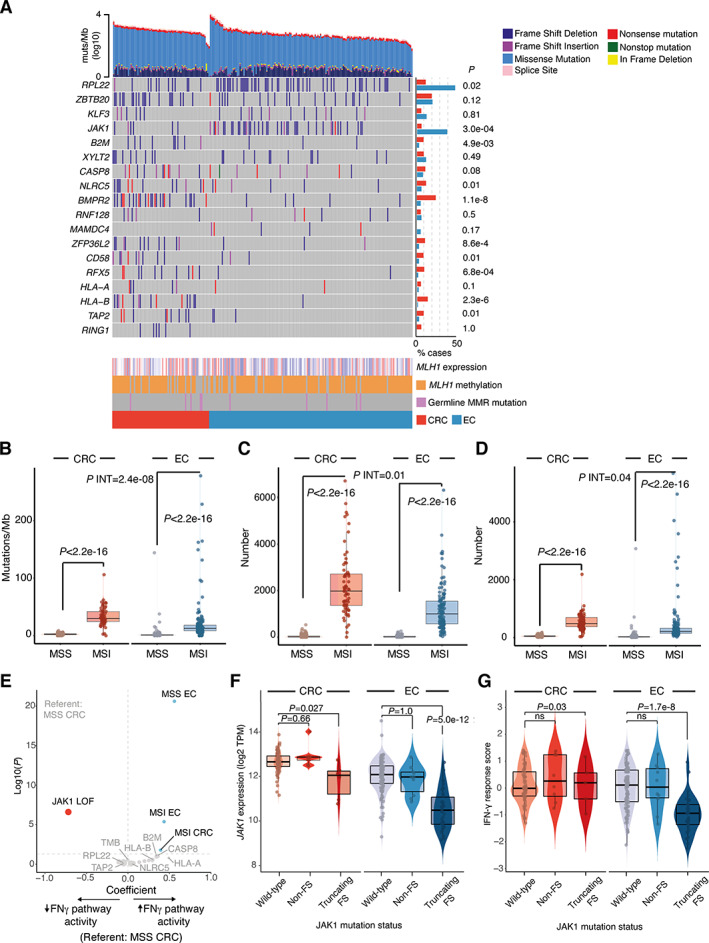
Tumour mutation burden, immune escape mutations, and interferon gamma pathway activity. (A) Oncoprint showing tumour mutation burden stratified by type, immune escape mutations (list from [44]), MLH1 expression, and promoter methylation and germline MMR gene mutation. Bars to the right indicate the proportion of cases with loss of function (LOF) mutations, defined as a truncating point or frameshift variants. (B–D) Tumour nonsilent mutation rate (B), predicted indel neoantigen burden (C), and single nucleotide variant (SNV) neoantigen burden (D) according to cancer type and MMR status. (E) Multiple linear regression for predictors of IFNγ response. Regression included tumour type and MMR status, and candidate immune escape mutations shown in (A). (F,G) Relationship between JAK1 mutation and (F) JAK1 expression and (G) IFNγ response score in MSI CRC and EC. Comparison of LOF mutation frequency in (A) used Fisher's exact test. Comparison between groups in (C, D) used Mann–Whitney U tests; tests for interaction used aligned rank ANOVA. CRC, colorectal cancer; EC, endometrial cancer; FS, frameshift mutation; MSI, microsatellite unstable; MSS, microsatellite stable.
Figure 5.
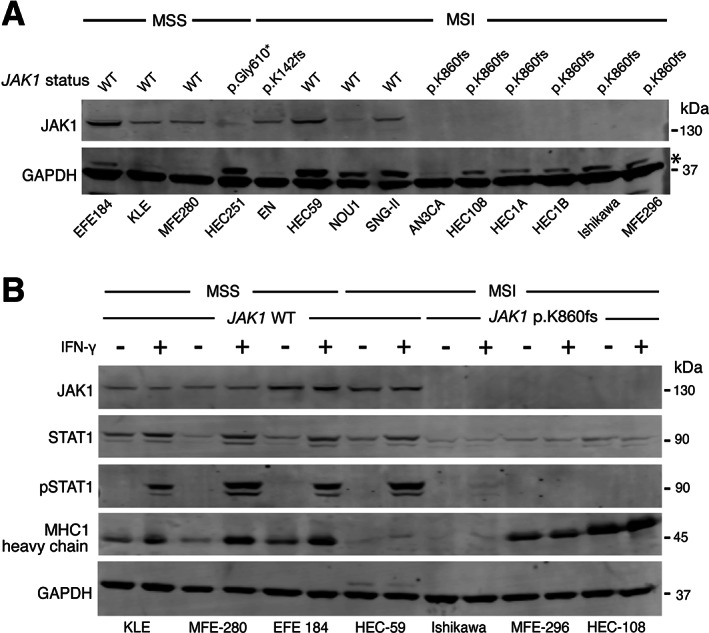
JAK1 mutation, protein levels and IFNγ response in endometrial cancer cell lines. (A) Immunoblot showing MMR status, JAK1 mutation, and JAK1 protein levels in a panel of 14 endometrial cancer cell lines. (B) Immunoblot showing downstream STAT1 induction, activating Y701 phosphorylation and HLA class I heavy chain levels in response to recombinant IFNγ (75 ng/ml for 16 h) in endometrial cancer cell lines according to JAK1 truncating p. K860fs mutation and JAK1 protein loss. Molecular weights of standards are shown to the right of the panels. Further details including antibodies used, are provided in Materials and methods. MSS, microsatellite stable; MSI, microsatellite unstable. * In panel (A) indicates nonspecific bands at higher molecular weight than GAPDH loading control.
Discussion
In this study we demonstrated that the prognostic value of dMMR varies between the two tumour types in which it is most common—colorectal and endometrial—and that this discordance correlated with quantitative and qualitative differences in intratumoural immune cell infiltrate, and the underlying tumour genome. Furthermore, we identified the IFNγ response as a critical pathway upregulated in dMMR CRC, and downregulated in dMMR EC as a consequence of JAK1 LOF mutations.
While the favourable prognosis of early‐stage dMMR CRC is well‐recognised, studies in EC have yielded conflicting results, reflected in a meta‐analysis that was inconclusive owing to marked interstudy heterogeneity [17]. By meta‐analysis of trial data, we show clear, statistically significant variation in the prognostic value of dMMR between these tumour types, with no detectable improvement in the latter. Motivated by this observation, we performed what is, to the best of our knowledge, the first comparison of the impact of dMMR/MSI on intratumoural infiltrate between CRC and EC. While as expected [7, 8, 15, 20], dMMR was associated with increased T‐cell infiltrate in both cancer types, the increase was markedly greater in CRC, evidenced by a statistically significant interaction. This discordance was mirrored by similar variation, (and statistically significant interactions), in tumour infiltration by multiple additional immune cells, and the IFNγ response—a key player in antitumour immunity [42] and response to immune checkpoint blockade [43]. Strikingly, while dMMR was associated with strong upregulation of the IFNγ pathway in CRC, in EC the opposite was the case. This appeared partly due to enrichment of JAK1 truncating frameshift mutations, which were associated with reduced IFNγ response in human cancers, loss of IFN signalling in cell lines, and which have recently been shown to predict lack of response to immunotherapy in EC [48]. However, this did not appear to be the sole explanation, because dMMR ECs lacking JAK1 mutations also demonstrated reduced IFNγ pathway activity compared to MMRp ECs. The possibility of hidden confounders means that cross‐cancer comparisons of RNAseq data must be interpreted cautiously, even following careful batch effect correction. Nevertheless, in general, IFNγ pathway activation appeared greater in EC than CRC, both across the whole cohorts, and among the majority of MMRp/MSS tumours. Speculatively, this difference may account for the apparent selection for JAK1 LOF mutations in dMMR EC, and possibly even the partial sensitivity of MMRp ECs to immune checkpoint inhibition [49], in contrast to the refractoriness of MMRp CRC to such therapy. Other dMMR/MSI‐associated immune escape mutations that varied in frequency between cancer types included RPL22, which was enriched in EC, and the antigen processing and presentation pathway components B2M, NLRC5, TAP2, and HLA‐B, which were more commonly disrupted in CRC. While previous reports have noted variation in the type and frequency of somatic mutations between dMMR/MSI according to the site of origin, ours is the first to demonstrate similar variation in the genetic mechanisms of immune escape. It is also the first to demonstrate the discordance in TMB and predicted neoantigen burden between dMMR/MSI tumours of the colon and endometrium; an observation which did not appear to relate to differences in MLH1 promoter methylation or expression. Understanding how these results relate to the differing immunological milieu between the immune‐rich human colon and the immune‐privileged endometrium, and the other factors that underpin these differences, will be important topics for future study, as will their utility as prognostic markers and predictors of immunotherapy benefit. Similar efforts also appear merited in other cancer types: while a recent study revealed better outcome of gastric cancers with dMMR/MSI (~8% cases) [50], the modest prevalence of dMMR/MSI in other cancers has precluded definitive conclusions on its prognostic value or immunological correlates.
Our study has limitations. The large number of tumours we analysed precluded the use of costly methods for detailed immunophenotyping. Consequently, it is unclear if other immune cell types (e.g. myeloid lineages and rarer T‐cell populations) and tumour PDL1 status display similar variation by MMR status and cancer type as the markers we assessed. Given that these markers have been shown to predict prognosis and/or benefit from immunotherapy, it will be important to address this in future studies. Furthermore, the formalin fixation of these retrospectively selected clinical samples prevented in‐depth genomic or transcriptomic interrogation. Similarly, TCGA samples permitted only analysis of the bulk transcriptome, meaning that subtle, epithelial‐specific perturbations could well have been missed. The use of MSI as a surrogate for dMMR in the TCGA cases is another limitation, as the correspondence between the two is less reliable in EC than in CRC, particularly in the minority of cases due to MSH6 or MSH2 gene defects. Finally, the correlative nature of our analyses means that, with the exception of JAK1 mutation, the mechanistic underpinnings of our results await definition through functional studies.
To conclude, our study provides further evidence that the consequences of genetic alterations in cancer depend upon the tissue context in which they occur. Recognising this, and understanding the underpinning mechanisms, will be critical for delivery of precision medicine and immunooncology over the coming years.
Supporting information
Supplementary materials and methods
Figure S1. PRISMA diagram showing search strategy used for identification of studies for inclusion in meta‐analysis
Figure S2. Deficient DNA mismatch repair predicts improved overall survival in colorectal but not endometrial cancer
Figure S3. Intrastromal CD3+ and CD8+, and intraepithelial and intrastromal FoxP3+ cell infiltrate by tumour type and MMR status
Figure S4. Immune checkpoint expression by cancer type and MSI status
Figure S5. MLH1 promoter methylation and expression by cancer type and MSI status
Table S1. Details of studies used for analysis of prognostic value of deficient DNA mismatch repair (dMMR)
Table S2. Tumour‐infiltrating lymphocyte density by marker and compartment according to cancer type and MMR status
Acknowledgements
We thank the patients who donated samples for this study and the researchers who helped curate them. We are also thank Konstantin Dedes (University of Zurich, Switzerland) and Britta Weigelt (Memorial Sloan Kettering Cancer Center, previously at Cancer Research UK, Lincoln's Inn Fields, UK) for kindly sharing cell lines. We would also like to acknowledge the NIHR UK RareGenetic Disease Research Consortium for supporting recruitment to the BOLT study. The results presented here are in whole or in part based upon data generated by the TCGA Research Network: https://www.cancer.gov/tcga—we thank the patients and researchers for this invaluable resource.
This work was funded by a Cancer Research UK Advanced Clinician Scientist Fellowship (C26642/A27963) to DNC, the Manchester and Oxford NIHR Comprehensive Biomedical Research Centre (BRC), the European Commission under a MSCA‐ITN award (675743: ISPIC), the KWF Bas Mulder Award UL (2015‐7664), the ZonMw Veni grant (916171144), and the European Research Council (ERC) under the European Union's Horizon 2020 Research and Innovation Programme (grant agreement no. 852832). MAG was funded by a Wellcome Trust Clinical Training Fellowship. NR was a Medical Research Council Doctoral Research Fellow (MR/M018431/1). KK is funded by a Wellcome Trust Genomic Medicine and Statistics Studentship (BST00080 H506). EJC was supported by NIHR Clinician Scientist (NIHR‐CS‐012‐009) and NIHR Advanced Fellowships (NIHR300650). TB is supported by a Dutch Cancer Society Young Investigator Award. The cost of open access publication was provided by core funding to the Wellcome Centre for Human Genetics from the Wellcome Trust (203141/Z/16/Z). The views expressed are those of the authors and not necessarily those of the NHS, the NIHR, the Department of Health, or the Wellcome Trust.
Conflict of interest statement: DNC has participated in the advisory board for MSD. No other conflicts of interest were declared
Data availability statement
TCGA data used in this study are available for download from the NCI Genomic Data Commons Data Portal: https://portal.gdc.cancer.gov. Other data used in this publication will be shared subject to ethical permissions upon reasonable request addressed to the corresponding author: david.church@well.ox.ac.uk.
References
References 51–57 are cited only in the supplementary material
- 1. Kunkel TA, Erie DA. Eukaryotic mismatch repair in relation to DNA replication. Annu Rev Genet 2015; 49: 291–313. [DOI] [PMC free article] [PubMed] [Google Scholar]
- 2. Hause RJ, Pritchard CC, Shendure J, et al. Classification and characterization of microsatellite instability across 18 cancer types. Nat Med 2016; 22: 1342–1350. [DOI] [PubMed] [Google Scholar]
- 3. Cortes‐Ciriano I, Lee S, Park WY, et al. A molecular portrait of microsatellite instability across multiple cancers. Nat Commun 2017; 8: 15180. [DOI] [PMC free article] [PubMed] [Google Scholar]
- 4. Popat S, Houlston RS. A systematic review and meta‐analysis of the relationship between chromosome 18q genotype, DCC status and colorectal cancer prognosis. Eur J Cancer 2005; 41: 2060–2070. [DOI] [PubMed] [Google Scholar]
- 5. Smyrk TC, Watson P, Kaul K, et al. Tumor‐infiltrating lymphocytes are a marker for microsatellite instability in colorectal carcinoma. Cancer 2001; 91: 2417–2422. [PubMed] [Google Scholar]
- 6. Llosa NJ, Cruise M, Tam A, et al. The vigorous immune microenvironment of microsatellite instable colon cancer is balanced by multiple counter‐inhibitory checkpoints. Cancer Discov 2015; 5: 43–51. [DOI] [PMC free article] [PubMed] [Google Scholar]
- 7. Liu GC, Liu RY, Yan JP, et al. The heterogeneity between Lynch‐associated and sporadic MMR deficiency in colorectal cancers. J Natl Cancer Inst 2018; 110: 975–984. [DOI] [PubMed] [Google Scholar]
- 8. Pakish JB, Zhang Q, Chen Z, et al. Immune microenvironment in microsatellite‐instable endometrial cancers: hereditary or sporadic origin matters. Clin Cancer Res 2017; 23: 4473–4481. [DOI] [PMC free article] [PubMed] [Google Scholar]
- 9. Grasso CS, Giannakis M, Wells DK, et al. Genetic mechanisms of immune evasion in colorectal cancer. Cancer Discov 2018; 8: 730–749. [DOI] [PMC free article] [PubMed] [Google Scholar]
- 10. Ijsselsteijn ME, Petitprez F, Lacroix L, et al. Revisiting immune escape in colorectal cancer in the era of immunotherapy. Br J Cancer 2019; 120: 815–818. [DOI] [PMC free article] [PubMed] [Google Scholar]
- 11. Overman MJ, Lonardi S, Wong KYM, et al. Durable clinical benefit with nivolumab plus ipilimumab in DNA mismatch repair‐deficient/microsatellite instability‐high metastatic colorectal cancer. J Clin Oncol 2018; 36: 773–779. [DOI] [PubMed] [Google Scholar]
- 12. Marcus L, Lemery SJ, Keegan P, et al. FDA approval summary: Pembrolizumab for the treatment of microsatellite instability‐high solid tumors. Clin Cancer Res 2019; 25: 3753–3758. [DOI] [PubMed] [Google Scholar]
- 13. Cancer Genome Atlas Research Network , Kandoth C, Schultz N. Integrated genomic characterization of endometrial carcinoma. Nature 2013; 497: 67–73. [DOI] [PMC free article] [PubMed] [Google Scholar]
- 14. Cancer Genome Atlas Network . Comprehensive molecular characterization of human colon and rectal cancer. Nature 2012; 487: 330–337. [DOI] [PMC free article] [PubMed] [Google Scholar]
- 15. van Gool IC, Eggink FA, Freeman‐Mills L, et al. POLE proofreading mutations elicit an antitumor immune response in endometrial cancer. Clin Cancer Res 2015; 21: 3347–3355. [DOI] [PMC free article] [PubMed] [Google Scholar]
- 16. Glaire M, Domingo E, Nicholson G, et al. Tumour‐infiltrating CD8+ lymphocytes as a prognostic marker in colorectal cancer: a retrospective, pooled analysis of the QUASAR2 and VICTOR trials. J Clin Oncol 2018; 36: 3515. [Google Scholar]
- 17. Diaz‐Padilla I, Romero N, Amir E, et al. Mismatch repair status and clinical outcome in endometrial cancer: a systematic review and meta‐analysis. Crit Rev Oncol Hematol 2013; 88: 154–167. [DOI] [PubMed] [Google Scholar]
- 18. Stelloo E, Bosse T, Nout RA, et al. Refining prognosis and identifying targetable pathways for high‐risk endometrial cancer; a TransPORTEC initiative. Mod Pathol 2015; 28: 836–844. [DOI] [PubMed] [Google Scholar]
- 19. Church DN, Stelloo E, Nout RA, et al. Prognostic significance of POLE proofreading mutations in endometrial cancer. J Natl Cancer Inst 2015; 107: 402. [DOI] [PMC free article] [PubMed] [Google Scholar]
- 20. Domingo E, Freeman‐Mills L, Rayner E, et al. Somatic POLE proofreading domain mutation, immune response, and prognosis in colorectal cancer: a retrospective, pooled biomarker study. Lancet Gastroenterol Hepatol 2016; 1: 207–216. [DOI] [PubMed] [Google Scholar]
- 21. Ryan NAJ, Walker TDJ, Bolton J, et al. Histological and somatic mutational profiles of mismatch repair deficient endometrial tumours of different aetiologies. Cancers (Basel) 2021; 13: 4538. [DOI] [PMC free article] [PubMed] [Google Scholar]
- 22. Stelloo E, Jansen AML, Osse EM, et al. Practical guidance for mismatch repair‐deficiency testing in endometrial cancer. Ann Oncol 2017; 28: 96–102. [DOI] [PubMed] [Google Scholar]
- 23. Thompson BA, Spurdle AB, Plazzer JP, et al. Application of a 5‐tiered scheme for standardized classification of 2,360 unique mismatch repair gene variants in the InSiGHT locus‐specific database. Nat Genet 2014; 46: 107–115. [DOI] [PMC free article] [PubMed] [Google Scholar]
- 24. Ijsselsteijn ME, Brouwer TP, Abdulrahman Z, et al. Cancer immunophenotyping by seven‐colour multispectral imaging without tyramide signal amplification. J Pathol Clin Res 2019; 5: 3–11. [DOI] [PMC free article] [PubMed] [Google Scholar]
- 25. Thorsson V, Gibbs DL, Brown SD, et al. The immune landscape of cancer. Immunity 2018; 48: 812–30.e14. [DOI] [PMC free article] [PubMed] [Google Scholar]
- 26. Hutchins G, Southward K, Handley K, et al. Value of mismatch repair, KRAS, and BRAF mutations in predicting recurrence and benefits from chemotherapy in colorectal cancer. J Clin Oncol 2011; 29: 1261–1270. [DOI] [PubMed] [Google Scholar]
- 27. Mouradov D, Domingo E, Gibbs P, et al. Survival in stage II/III colorectal cancer is independently predicted by chromosomal and microsatellite instability, but not by specific driver mutations. Am J Gastroenterol 2013; 108: 1785–1793. [DOI] [PubMed] [Google Scholar]
- 28. Sinicrope FA, Foster NR, Thibodeau SN, et al. DNA mismatch repair status and colon cancer recurrence and survival in clinical trials of 5‐fluorouracil‐based adjuvant therapy. J Natl Cancer Inst 2011; 103: 863–875. [DOI] [PMC free article] [PubMed] [Google Scholar]
- 29. Bertagnolli MM, Redston M, Compton CC, et al. Microsatellite instability and loss of heterozygosity at chromosomal location 18q: prospective evaluation of biomarkers for stages II and III colon cancer–a study of CALGB 9581 and 89803. J Clin Oncol 2011; 29: 3153–3162. [DOI] [PMC free article] [PubMed] [Google Scholar]
- 30. Pagès F, André T, Taieb J, et al. Prognostic and predictive value of the Immunoscore in stage III colon cancer patients treated with oxaliplatin in the prospective IDEA France PRODIGE‐GERCOR cohort study. Ann Oncol 2020; 31: 921–929. [DOI] [PubMed] [Google Scholar]
- 31. Roth AD, Tejpar S, Delorenzi M, et al. Prognostic role of KRAS and BRAF in stage II and III resected colon cancer: results of the translational study on the PETACC‐3, EORTC 40993, SAKK 60‐00 trial. J Clin Oncol 2010; 28: 466–474. [DOI] [PubMed] [Google Scholar]
- 32. Taieb J, Zaanan A, Le Malicot K, et al. Prognostic effect of BRAF and KRAS mutations in patients with stage III colon cancer treated with leucovorin, fluorouracil, and oxaliplatin with or without cetuximab: a post hoc analysis of the PETACC‐8 trial. JAMA Oncol 2016; 2: 643–653. [DOI] [PubMed] [Google Scholar]
- 33. de Weger VA, Turksma AW, Voorham QJ, et al. Clinical effects of adjuvant active specific immunotherapy differ between patients with microsatellite‐stable and microsatellite‐instable colon cancer. Clin Cancer Res 2012; 18: 882–889. [DOI] [PubMed] [Google Scholar]
- 34. Westra JL, Schaapveld M, Hollema H, et al. Determination of TP53 mutation is more relevant than microsatellite instability status for the prediction of disease‐free survival in adjuvant‐treated stage III colon cancer patients. J Clin Oncol 2005; 23: 5635–5643. [DOI] [PubMed] [Google Scholar]
- 35. Sasaki Y, Akasu T, Saito N, et al. Prognostic and predictive value of extended RAS mutation and mismatch repair status in stage III colorectal cancer. Cancer Sci 2016; 107: 1006–1012. [DOI] [PMC free article] [PubMed] [Google Scholar]
- 36. André T, de Gramont A, Vernerey D, et al. Adjuvant fluorouracil, leucovorin, and oxaliplatin in stage II to III colon cancer: updated 10‐year survival and outcomes according to BRAF mutation and mismatch repair status of the MOSAIC study. J Clin Oncol 2015; 33: 4176–4187. [DOI] [PubMed] [Google Scholar]
- 37. Stelloo E, Nout RA, Osse EM, et al. Improved risk assessment by integrating molecular and Clinicopathological factors in early‐stage endometrial cancer‐combined analysis of the PORTEC cohorts. Clin Cancer Res 2016; 22: 4215–4224. [DOI] [PubMed] [Google Scholar]
- 38. León‐Castillo A, de Boer SM, Powell ME, et al. Molecular classification of the PORTEC‐3 trial for high‐risk endometrial cancer: impact on prognosis and benefit from adjuvant therapy. J Clin Oncol 2020; 38: 3388–3397. [DOI] [PMC free article] [PubMed] [Google Scholar]
- 39. Cosgrove CM, Tritchler DL, Cohn DE, et al. An NRG Oncology/GOG study of molecular classification for risk prediction in endometrioid endometrial cancer. Gynecol Oncol 2018; 148: 174–180. [DOI] [PMC free article] [PubMed] [Google Scholar]
- 40. Mackay HJ, Gallinger S, Tsao MS, et al. Prognostic value of microsatellite instability (MSI) and PTEN expression in women with endometrial cancer: results from studies of the NCIC Clinical Trials Group (NCIC CTG). Eur J Cancer 2010; 46: 1365–1373. [DOI] [PubMed] [Google Scholar]
- 41. Ramchander NC, Ryan NAJ, Walker TDJ, et al. Distinct immunological landscapes characterize inherited and sporadic mismatch repair deficient endometrial cancer. Front Immunol 2020; 10: 3023. [DOI] [PMC free article] [PubMed] [Google Scholar]
- 42. Alspach E, Lussier DM, Schreiber RD. Interferon γ and its important roles in promoting and inhibiting spontaneous and therapeutic cancer immunity. Cold Spring Harb Perspect Biol 2019; 11: a028480. [DOI] [PMC free article] [PubMed] [Google Scholar]
- 43. Grasso CS, Tsoi J, Onyshchenko M, et al. Conserved interferon‐gamma signaling drives clinical response to immune checkpoint blockade therapy in melanoma. Cancer Cell 2020; 38: 500–15.e3. [DOI] [PMC free article] [PubMed] [Google Scholar]
- 44. Litchfield K, Reading JL, Puttick C, et al. Meta‐analysis of tumor‐ and T cell‐intrinsic mechanisms of sensitization to checkpoint inhibition. Cell 2021; 184: 596–614.e14. [DOI] [PMC free article] [PubMed] [Google Scholar]
- 45. Stelloo E, Versluis MA, Nijman HW, et al. Microsatellite instability derived JAK1 frameshift mutations are associated with tumor immune evasion in endometrioid endometrial cancer. Oncotarget 2016; 7: 39885–39893. [DOI] [PMC free article] [PubMed] [Google Scholar]
- 46. Albacker LA, Wu J, Smith P, et al. Loss of function JAK1 mutations occur at high frequency in cancers with microsatellite instability and are suggestive of immune evasion. PLoS One 2017; 12: e0176181. [DOI] [PMC free article] [PubMed] [Google Scholar]
- 47. Ren Y, Zhang Y, Liu RZ, et al. JAK1 truncating mutations in gynecologic cancer define new role of cancer‐associated protein tyrosine kinase aberrations. Sci Rep 2013; 3: 3042. [DOI] [PMC free article] [PubMed] [Google Scholar]
- 48. Gulhan DC, Garcia E, Lee EK, et al. Genomic determinants of De novo resistance to immune checkpoint blockade in mismatch repair‐deficient endometrial cancer. JCO Precis Oncol 2020; 4: 492–497. [DOI] [PMC free article] [PubMed] [Google Scholar]
- 49. Green AK, Feinberg J, Makker V. A review of immune checkpoint blockade therapy in endometrial cancer. Am Soc Clin Oncol Educ Book 2020; 40: 1–7. [DOI] [PubMed] [Google Scholar]
- 50. Pietrantonio F, Miceli R, Raimondi A, et al. Individual patient data meta‐analysis of the value of microsatellite instability as a biomarker in gastric cancer. J Clin Oncol 2019; 37: 3392–3400. [DOI] [PubMed] [Google Scholar]
- 51. Patro R, Duggal G, Love MI, et al. Salmon provides fast and bias‐aware quantification of transcript expression. Nat Methods 2017; 14: 417–419. [DOI] [PMC free article] [PubMed] [Google Scholar]
- 52. Colaprico A, Silva TC, Olsen C, et al. TCGAbiolinks: an R/Bioconductor package for integrative analysis of TCGA data. Nucleic Acids Res 2016; 44: e71. [DOI] [PMC free article] [PubMed] [Google Scholar]
- 53. Love MI, Huber W, Anders S. Moderated estimation of fold change and dispersion for RNA‐seq data with DESeq2. Genome Biol 2014; 15: 550. [DOI] [PMC free article] [PubMed] [Google Scholar]
- 54. Yu G, Wang LG, Han Y, et al. clusterProfiler: an R package for comparing biological themes among gene clusters. Omics 2012; 16: 284–287. [DOI] [PMC free article] [PubMed] [Google Scholar]
- 55. Schwartzer G. Meta‐Analysis with R. Springer International Publishing, 2015. [Google Scholar]
- 56. Wickham H. ggplot2: Elegant Graphics for Data Analysis. Springer‐Verlag: New York, 2016. [Google Scholar]
- 57. Mayakonda A, Lin DC, Assenov Y, et al. Maftools: efficient and comprehensive analysis of somatic variants in cancer. Genome Res 2018; 28: 1747–1756. [DOI] [PMC free article] [PubMed] [Google Scholar]
Associated Data
This section collects any data citations, data availability statements, or supplementary materials included in this article.
Supplementary Materials
Supplementary materials and methods
Figure S1. PRISMA diagram showing search strategy used for identification of studies for inclusion in meta‐analysis
Figure S2. Deficient DNA mismatch repair predicts improved overall survival in colorectal but not endometrial cancer
Figure S3. Intrastromal CD3+ and CD8+, and intraepithelial and intrastromal FoxP3+ cell infiltrate by tumour type and MMR status
Figure S4. Immune checkpoint expression by cancer type and MSI status
Figure S5. MLH1 promoter methylation and expression by cancer type and MSI status
Table S1. Details of studies used for analysis of prognostic value of deficient DNA mismatch repair (dMMR)
Table S2. Tumour‐infiltrating lymphocyte density by marker and compartment according to cancer type and MMR status
Data Availability Statement
TCGA data used in this study are available for download from the NCI Genomic Data Commons Data Portal: https://portal.gdc.cancer.gov. Other data used in this publication will be shared subject to ethical permissions upon reasonable request addressed to the corresponding author: david.church@well.ox.ac.uk.