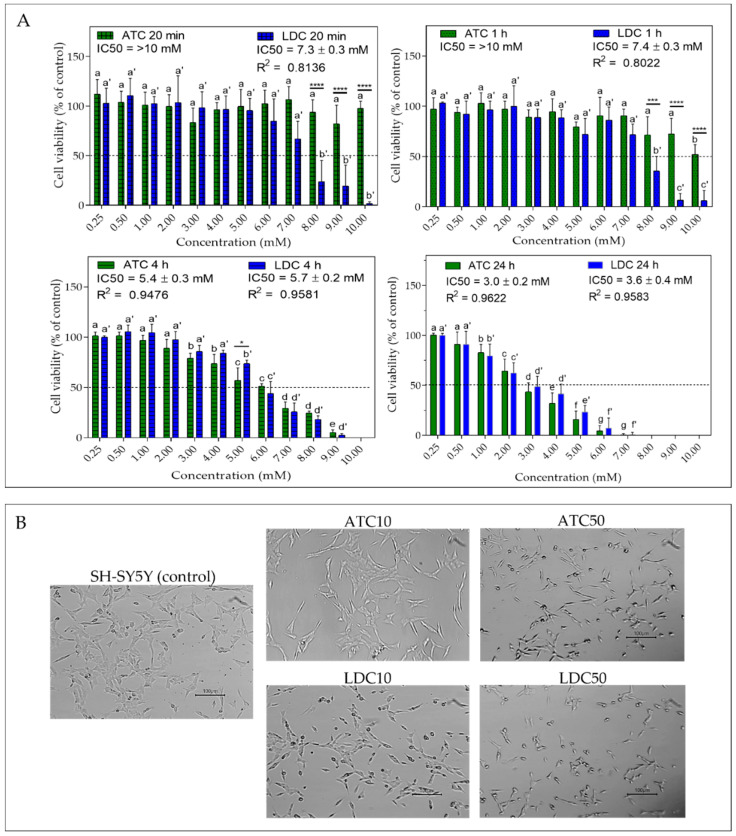
Figure 2.
(A) Cell viability of SH-SY5Y neuroblastoma cells exposed to 0.25–10 mM of articaine (ATC) or lidocaine (LDC) after 20 min, 1 h, 4 h and 24 h of treatment. The IC50 values and the R2 values (reflecting the goodness of fit) are indicated. Statistical significance was assessed via one-way ANOVA; for each LA, significant differences between cell viabilities at different concentrations are indicated by different letters (without/with prime for ATC/LDC, respectively); significant differences between ATC and LDC, at each exposure concentration, are indicated by asterisks (* p < 0.05; *** p < 0.005; **** p < 0.001); (B) Micrographs of SH-SY5Y cells, without treatment (control) and after 24 h exposure to the local anesthetics at concentrations of IC10 (ATC10 and LDC10) and IC50 (ATC50 and LDC50). Scale Bar = 100 µm.

