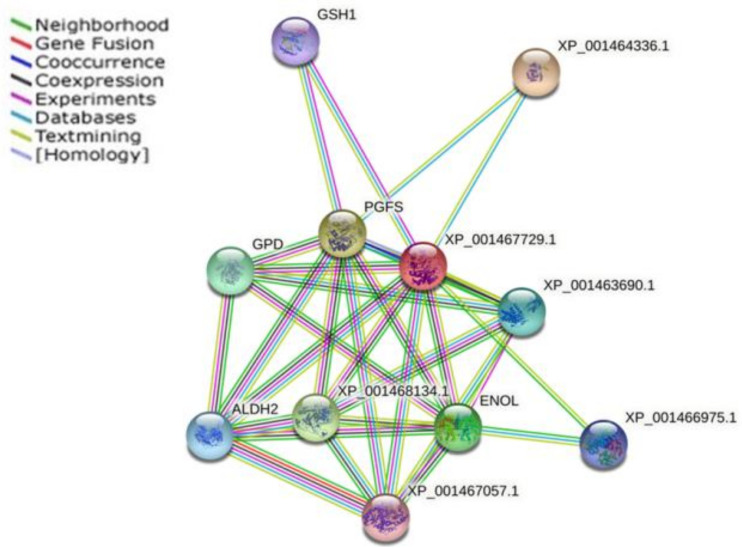
Figure 4.
Functional and physical protein associations interaction map of prostaglandin F2α synthase (PGFS). The nodes are representative of protein species, and different line colors show the types of evidence for the association. The STRING tool (http://www.string-db.org; accessed on 1 May 2022) was used to construct the interaction network. The related proteins are listed in Table 3.

