Abstract
Two bacterial strains isolated from the aquifer underlying Oyster, Va., were recently injected into the aquifer and monitored using ferrographic capture, a high-resolution immunomagnetic technique. Injected cells were enumerated on the basis of a vital fluorescence stain, whereas total cell numbers (stained target cells plus unstained target and antigenically similar indigenous bacteria) were identified by cell outlines emanating from fluorophore-conjugated antibodies to the two target strains. The arrival of injected bacteria at the majority of monitored sampling ports was accompanied by simultaneous temporary increases in unstained cell counts that outnumbered the injected bacteria by 2- to 100-fold. The origin and mechanism of appearance of the unstained cells are considered.
Little is known about the hydrodynamic environment experienced by bacteria attached to sediment grain surfaces in groundwater aquifers. Laboratory studies of other colloidal materials have determined that hydrodynamic interactions between mobile and attached colloids prevent the attachment of mobile colloids within a given distance of attached colloids, an effect known as hydrodynamic scattering (1) or the shadow effect (9). Force balance calculations also indicate that hydrodynamic interactions between mobile and attached colloids can be expected to result in enhanced detachment of attached colloids, even for dilute solutions (2, 3). This report describes field data that indicate that hydrodynamic interactions between mobile and attached bacteria may indeed be relevant to bacterial transport in groundwater.
The experiments were performed at the U.S. Department of Energy Natural and Accelerated Bioremediation (NABIR) South Oyster (SO) field site, in Oyster, Va., on the southern Delmarva Peninsula. The SO and Narrow Channel (NC) focus areas are two locations at the site where flow cells to study bacterial transport have been installed. The flow cells at both sites are bordered on the down-gradient end by groundwater extraction wells used to set up a steady-state flow field prior to injection experiments. Within each flow cell are 24 custom-made multilevel samplers (MLS) (8), each possessing 12 sampling ports vertically spaced approximately 30 cm apart within the lower 3 m of the shallow sandy aquifer. The MLS designs and flow cell installation at the two focus areas are described in further detail elsewhere (8).
Two bacterial strains were used in this study. DA001 is an aerobic, adhesion-deficient variant of an isolate originally obtained from the NC focus area and has been identified as a Comamonas sp. OY-107 is a facultative iron-reducing bacterium of the genus Acidovorax that was naturally adhesion deficient when it was isolated from the SO site. DA001 and OY-107 are gram-negative rods approximately 1.2 by 0.6 μm and 1.9 by 1.0 μm in size, respectively. The organisms were grown at Envirogen, Inc., on acetate (NC experiment) or lactate (SO experiment) using standard fermentation procedures and were harvested by centrifugation (6, 7). The injected DA001 and OY-107 cells were labeled using the green fluorescent vital stain 5- (and 6)-carboxyfluorescein diacetate, succinimidyl ester (CFDA/SE), and the red fluorescent vital stain 5- (and 6)-carboxytetramethylrhodamine succinimidyl ester (TAMRA/SE) as described elsewhere (6, 7). Examination of the stained cells via epifluorescence microscopy and flow cytometry showed that at most 1 to 5% of the population of cells were not visibly fluorescent after the staining procedure (6, 7; Fuller et al., unpublished).
Transport of DA001 at the NC focus area was examined in an experiment performed during October 1999, whereas simultaneous transport of DA001 and OY-107 was examined at the SO focus area during August 2000. One week prior to injection at each site, a forced hydraulic gradient was established by withdrawing groundwater at the down-gradient wells in order to achieve an average site pore water velocity of 1 m day−1 through the flow cells. The NC injection solution was composed of 90% CFDA/SE-stained DA001 cells and 10% 13C-labeled unstained DA001 cells, with a total concentration of 108 cells ml−1. The 13C-labeled cells are relevant to this report insofar as this fraction of the injected cell suspension was unstained. For the SO field experiment, all of the DA001 and OY-107 cells (5 × 10⁷ cells ml−1 each) were internally stained with TAMRA/SE and CFDA/SE, respectively; no 13C labeling was performed. Both field experiments were done with an injection system that preserved the groundwater chemistry (6, 8). Sampling infrastructure and sampling protocols used at the NC and SO focus areas are described in detail elsewhere (6, 8). The samples were preserved in the field (1% [vol/vol] formaldehyde) and shipped on ice to the University of Utah.
For the ferrographic capture analyses, polyclonal rabbit antibodies (Rockland Immunochemicals, Inc., Gilbertsville, Pa.) raised to whole cells of the target bacterial strains were used to tether goat anti-rabbit-coated paramagnetic beads (50-nm diameter; Miltenyi Biotec, Auburn, Calif.) to the surface of the target cells following sample collection. The bacterium-bead suspension was then introduced into a Bio-Ferrograph (Guilfoyle, Inc, Belmont, Mass.), which deposited the magnetically tagged bacteria onto a small area of a glass substratum. The bacteria were then enumerated under an epifluorescence microscope. Further details are given elsewhere (8, 11, 12).
Aliquots of the anti-DA001 and anti-OY-107 antibodies were conjugated to a green fluorophore, fluorescein isothiocyanate (FITC), used in parallel analyses to allow the enumeration of unstained cells of target and antigenically similar strains that may have been captured. The FITC-conjugated antibodies provided fluorescent outlines of all captured cells (hereafter referred to as total cell counts), whereas the nonconjugated antibodies were not fluorescent. Hence, when the nonconjugated antibodies were used in the analyses, only the stained (injected) cells were visible (hereafter referred to as injected cell counts). Examples of stained and FITC-outlined bacterial images are given in the report of Zhang et al. (12). The number of unstained bacteria (unstained target and antigenically similar bacteria) in each sample was determined as the difference between the total and the injected cell counts.
As stated above, the NC injection solution contained 10% 13C-labeled DA001 cells and 90% CFDA/SE-stained DA001 cells. Also, for both experiments, a conservative maximum of 5% of the injected cells that underwent the staining procedure may not have been rendered internally fluorescent (6, 7; Fuller et al., unpublished). To account for this initial unstained fraction of the injected cells, a specified fraction of the injected cell counts was subtracted from the difference between the total and the injected cell counts. The specified fractions were 15% for NC samples (10% 13C labeled plus 5% inefficiently stained) and 10% for SO samples (5% inefficiently stained plus 5% conservative addition).
Standards for stained DA001 cells and stained OY-107 cells (∼100 cells ml−1 mixed in NC artificial groundwater, stored in plastic centrifuge tubes, and refrigerated at 4°C) were analyzed every 10 samples to monitor analytical error. For samples targeting the CFDA-stained bacteria, analyses for total cell counts (injected cells plus unstained target and antigenically similar cells) and injected cell counts were performed separately, since the FITC-conjugated antibody and the CFDA/SE stain fluoresced at similar wavelengths. For samples targeting the TAMRA/SE-stained bacteria, total and injected cell counts targeting DA001 were determined together (using the FITC-conjugated antibody), since the FITC-conjugated anti-DA001 antibody and the TAMRA/SE stain fluoresced at different wavelengths.
Triplicate analyses were performed using ferrographic capture of serially diluted stained DA001 standards with nominal concentrations of 5,000, 500, 50, and 5 cells ml−1, which yielded cell counts of 5,500 ± 800, 620 ± 30, 60 ± 11, and 11 ± 2 cells ml−1. The corresponding analytical errors were 15, 5, 20, and 22%, respectively. Blank samples showed values ranging from 0 to 6 cells ml−1, causing the sample with the lowest concentration to be significantly overestimated. A quantitation limit of 20 cells ml−1 was therefore used in this study, and cell counts of less than 20 cells ml−1 were considered negligible. This degree of resolution is unparalleled by other bacterial tracking techniques (4, 6, 8).
Equivalent cell counts were obtained repeatedly over a month-long period using the FITC-conjugated and nonconjugated antibodies and refrigerated (4°C) standards (3,500 cells/ml) in NC groundwater and NC artificial groundwater, with and without preservation with 1% formaldehyde. The results also indicated that the internal stain was stable for at least 1 month and that cell lysis and growth were not significant under storage conditions. Triplicate recoveries from standards of 570 cells ml−1 (DA001) and of 800 cells ml−1 (OY-107), analyzed separately and as a mixture, showed no cross-reactivity of the antibodies to the two strains.
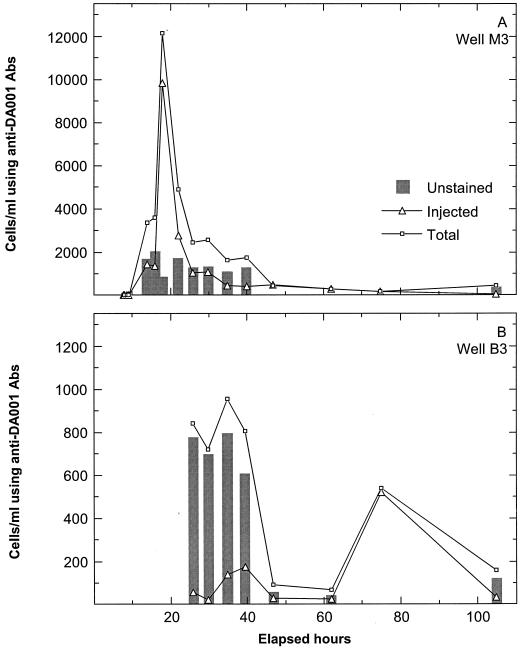
The number of cells captured by the FITC-conjugated anti-DA001 antibody was low (<50 cells ml−1) across the NC site prior to the arrival of injected cells (initial samples) (Fig. 1A). Unstained cell counts (unstained target and antigenically similar cells) became significant during the breakthrough of injected DA001 (difference between total and injected cell counts after subtraction of 15% of the injected cell count) (Fig. 1A). During the breakthrough of injected DA001, unstained cell counts in well M3 were relatively constant, ranging between 1,000 and 2,000 cells ml−1, despite order-of-magnitude changes in injected DA001 counts (Fig. 1A). Well B3 exhibited two pulses of injected DA001 (Fig. 1B). During the period between 25 and 42 days, unstained cell counts (600 to 800 cells ml−1) were much higher than injected DA001 counts, by as much as a factor of 100. No unstained bacteria accompanied the second pulse of injected DA001 in well B3. These results indicate that unstained cell counts were not proportional to injected DA001 counts during breakthrough at the NC site.
FIG. 1.
Breakthrough at the NC focus area of injected DA001 (using nonconjugated anti-DA001 antibody [Abs]) and total cells (injected DA001 plus unstained DA001 and antigenically similar cells recovered using FITC-conjugated anti-DA001 antibody) in wells M3 and B3. Unstained cell counts are shown as gray bars after subtraction of 15% of the injected cell counts from the difference between total and injected cell counts.
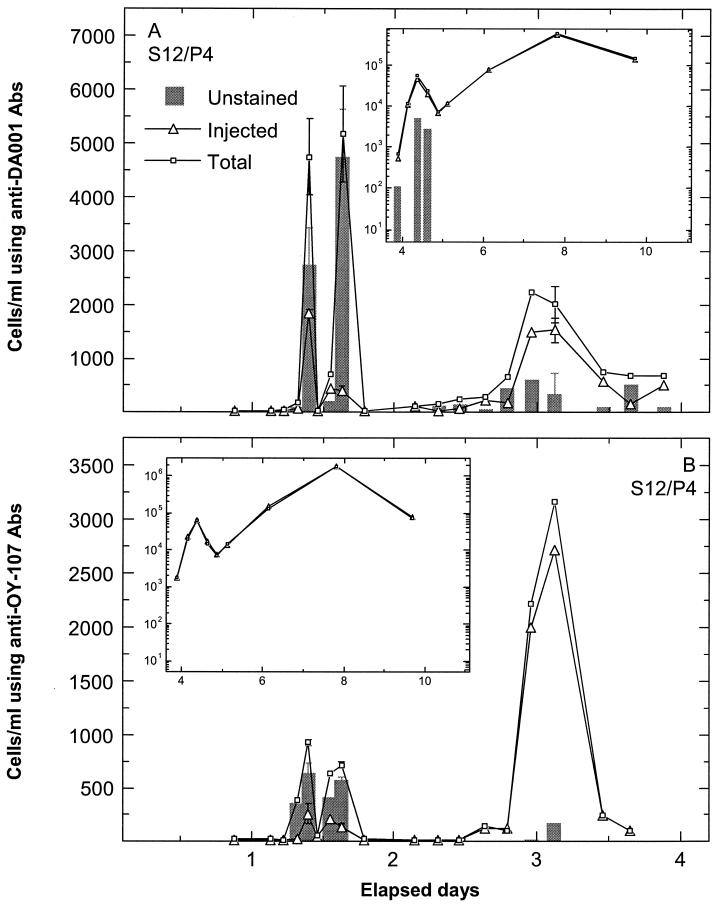
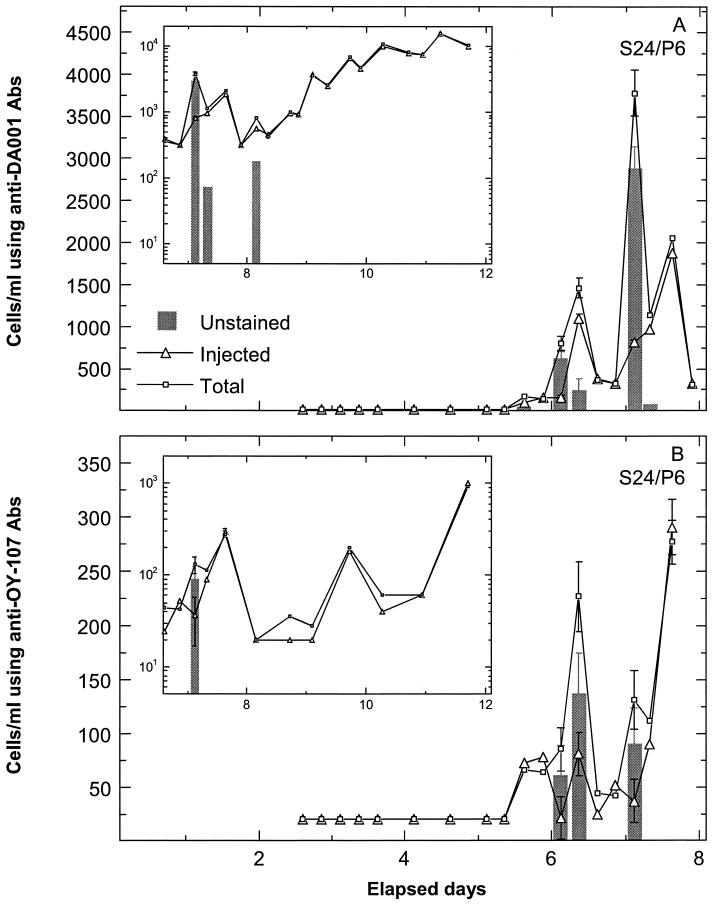
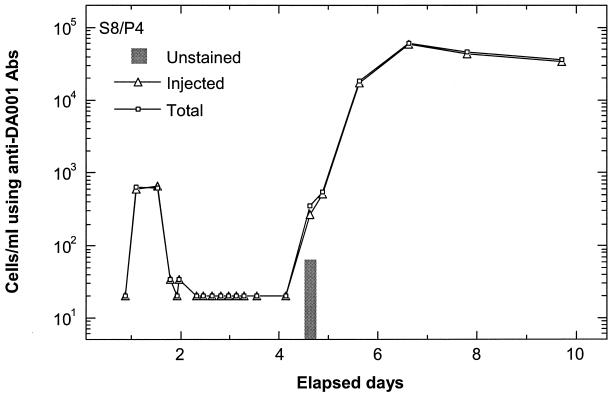
Examples of cell breakthrough during the SO focus area experiment are shown for MLS 12 port 4 (Fig. 2) and MLS 24 port 6 (Fig. 3). Prior to the breakthrough of injected cells, insignificant total cell counts determined by ferrographic capture were observed for the SO site (early times in Fig. 2 and 3), corroborating plate counts for the same samples. Breakthrough of the two injected strains was similar, with three low-concentration breakthrough pulses of DA001 (Fig. 2A) and OY-107 (Fig. 2B) in MLS 12 port 4 and two low-concentration breakthrough pulses of DA001 (Fig. 3A) and OY-107 (Fig. 3B) in MLS 24 port 6. Associated with the breakthrough of the injected cells were pulses of unstained cells (difference between total and injected cell counts after subtraction of 10% of the injected cell count). Unstained cell counts were up to ninefold higher than injected cell counts (e.g., analyses with anti-DA001 antibody at 1.5 days in MLS 12 port 4) (Fig. 2A). It should be noted that the error bars are smaller than the symbols for total cell counts obtained with anti-OY-107 antibody between days 1 and 2 (Fig. 2B). Some breakthrough pulses of injected bacteria did not show an accompanying pulse of unstained bacteria, e.g., cell counts obtained with anti-OY-107 antibody at 5.5 days in MLS 24 port 6 (Fig. 3B). Furthermore, some wells showed no unstained cells at any time during the breakthrough of injected cells, e.g., MLS 8 port 4 (Fig. 4). Although the difference between total and injected cell counts slightly exceeded the 10% tolerance used for SO samples at 4.5 days in Fig. 4, the difference in this instance is not sufficient to be convincingly indicative of unstained bacteria beyond those present in the injected solution.
FIG. 2.
Breakthrough at SO focus area MLS 12 port 4 (S12/P4) of injected DA001 (using nonconjugated anti-DA001 antibody [Abs]) and total cells (using FITC-conjugated anti-DA001 antibody) and injected OY-107 (using nonconjugated anti-OY-107 antibody) and total cells (using FITC-conjugated anti-OY-107 antibody). Unstained cell counts are presented as gray bars after subtraction of 10% of the injected cell counts from the difference between total and injected cell counts. Long-term data are shown in the inset graphs. Error bars show standard deviations.
FIG. 3.
Breakthrough at SO focus area MLS 24/port 6 (S24/P6) of injected DA001 (using nonconjugated anti-DA001 antibody [Abs]) and total cells (using FITC-conjugated anti-DA001 antibody) and injected OY-107 (using nonconjugated anti-OY-107 antibody) and total cells (using FITC-conjugated anti-OY-107 antibody). Unstained cell counts are presented as gray bars after subtraction of 10% of the injected cell counts from the difference between total and injected cell counts. Long-term data are shown in the inset graphs. Error bars show standard deviations.
FIG. 4.
Breakthrough at SO focus area MLS 8/port 4 (S8/P4) of injected DA001 (using nonconjugated anti-DA001 antibody [Abs]) and total cells (using FITC-conjugated anti-DA001 antibody). Unstained cell counts are presented as a gray bar after subtraction of 10% of the injected cell counts from the difference between total and injected cell counts.
Longer-term breakthrough of the two strains in the same MLS ports as those described above (shown in the insets in Fig. 2 and 3) indicated that above a certain injected cell concentration, unstained cells were not detectable as the difference between total and injected cell counts. Unstained cell counts at about 4.5 days in inset Fig. 2A and about 8 days in inset Fig. 3A were associated with near-unity ratios of total to injected cell counts and so were close to unstained cell counts expected to exist within the injected population. The absence of a significant number of unstained cells at higher injected cell counts (higher than about 30,000 cells/ml) indicates that the capturable unstained cells were limited in number.
The results clearly indicate that prior to the breakthrough of injected cells the counts of unstained cells were negligible, whereas unstained cell counts greatly increased simultaneously with the breakthrough of injected cells, to values that often exceeded the injected cell counts. There are several potential origins of these unstained cells, including the injected bacterial population and the bacterial population indigenous to the aquifer (not injected). Assuming that unstained cells originated from the injected cell population, their appearance at concentrations outnumbering injected cell concentrations (by as much as a factor of 100) requires mechanisms to selectively concentrate unstained cells relative to stained cells during transport. Potential mechanisms include growth of injected cells (with lack of stain transfer to daughter cells), loss of stain from injected cells during transport, and less adhesion of unstained relative to stained cells. Cell division was insignificant for stored samples monitored over a 1-month period, as described above. Furthermore, the lack of significant cell division during transport in the field was indicated by close corroboration of injected DA001 cell counts by culture plating (with identification based on unique colony morphology), ferrographic capture, 13C analyses, direct counting, and flow cytometry (8). Loss of stain was negligible for both CFDA/SE and TAMRA/SE in refrigerated (4°C), preserved (1% formaldehyde) samples monitored over a month-long period (this study). Furthermore, loss of stain during transport in the field was negligible, as indicated by flow cytometric analyses of groundwater samples, which showed that the per-cell fluorescence of CDFA/SE-stained DA001 did not change over a period of more than 100 days in the aquifer at NC (6, 13). Equivalent adhesion of stained and unstained cells during transport has been shown with standard adhesion assays (5) and with 50-cm cores (7.2 cm in diameter) packed with NC site sediment (interstitial velocity, 1 m day−1) (4). Our results indicate that selective concentration of unstained cells during transport by the above mechanisms did not occur to an extent that could explain the appearance of unstained cells at concentrations far higher than the injected cell concentrations. However, even assuming that selective concentration of unstained cells occurred during transport, it is difficult to explain the observed temporal variations in unstained cell concentrations, that is, the ephemeral pulse of unstained cells that was not detectable at higher injected cell concentrations. In order to explain the observed breakthrough behavior, selective concentration of unstained cells would need to have occurred exclusively on the low-concentration fringes of the injected bacterial plume, a possibility that cannot be discounted but that seems unlikely.
Considering the possibility that unstained cells originated from the cell population indigenous to the aquifer (not injected), potential mechanisms of appearance include growth or detachment in response to breakthrough of the injected bacterial plume. Increased shear forces cannot explain the observations, since forced-gradient conditions were imposed at least 1 week prior to injection. Appearance due to growth seems unlikely, since no lag time was observed between the appearance of the unstained cells and the breakthrough of the injected bacteria. The progression of breakthrough in well B3 during the NC experiment (Fig. 1) and in MLS 12 port 4 at the SO focus area (Fig. 2) indicates that the highest ratios of unstained to injected cell concentrations were associated with the earliest pulses of injected cells, whereas subsequent pulses of similar concentrations of injected cells produced lower relative unstained cell counts. This observation is consistent with detachment from sediment of a limited population of weakly attached cells in response to breakthrough of the injected bacterial plume. Detachment could have occurred due to a number of mechanisms, including slight shifts in groundwater chemistry (reviewed in reference 10) or hydrodynamic interactions with mobile injected bacteria (2, 3), among others. Since no significant changes in groundwater pH, ionic strength, or dissolved oxygen accompanied the breakthrough of injected cells, it is plausible that the appearance of unstained cells represented detachment in response to hydrodynamic or other interactions with the injected bacteria.
Acknowledgments
This work was funded by the U.S. Department of Energy (DOE) Natural and Accelerated Bioremediation Research Program (NABIR)—Acceleration Element (grant DE-FG03-99ER62820/A000).
We acknowledge the leadership of Frank Wobber. The long-term sampling efforts of Keun-Hyung Choi and Leslie Ball and the excellent work of David Stone in sample analyses also deserve heartfelt thanks and praise. Access to the field site was granted by The Nature Conservancy, Virginia Coast Reserve.
REFERENCES
- 1.Adamczyk Z, Warszynski P, Szyk-Warszynska L, Weronski P. Role of convection in particle deposition at solid surfaces. Colloids Surf. 2000;165:157–187. [Google Scholar]
- 2.Dabros T. Interparticle hydrodynamic interactions in deposition processes. Colloids Surf. 1989;39:127–141. [Google Scholar]
- 3.Dabros T, van de Ven T G M. Hydrodynamic interactions between two spheres near a solid plane. Int J Multiph Flow. 1992;18:751–764. [Google Scholar]
- 4.DeFlaun, M. F., M. E. Fuller, W. P. Johnson, P. Zhang, B. J. Mailloux, T. C. Onstott, W. Holben, D. Balkwill, and D. White. Comparison of methods for monitoring bacterial transport in the subsurface. J. Microbiol. Methods, in press. [DOI] [PubMed]
- 5.DeFlaun M F, Tanzer A, McAteer A, Marshall B, Levy S. Development of an adhesion assay and characterization of an adhesion-deficient mutant of Pseudomonas fluorescens. Appl Environ Microbiol. 1990;56:112–119. doi: 10.1128/aem.56.1.112-119.1990. [DOI] [PMC free article] [PubMed] [Google Scholar]
- 6.Fuller M, Mailloux B, Zhang P, Streger S, Hall J, Vainberg S, Beavis A, Johnson W, Onstott T, DeFlaun M. Field-scale evaluation of CFDA/SE staining coupled with multiple detection methods for assessing the transport of bacteria in situ. FEMS Microbiol Ecol. 2001;37:55–56. [Google Scholar]
- 7.Fuller M E, Streger S, Rothmel R, Mailloux B J, Hall J A, Onstott T C, Fredrickson J K, Balkwill D L, DeFlaun M F. Development of a vital fluorescent staining method for monitoring bacterial transport in subsurface environments. Appl Environ Microbiol. 2001;66:4486–4496. doi: 10.1128/aem.66.10.4486-4496.2000. [DOI] [PMC free article] [PubMed] [Google Scholar]
- 8.Johnson W P, Zhang P, Fuller M F, Scheibe T D, Mailloux B J, Onstott T C, DeFlaun M F, Hubbard S S, Radtke J, Kovacik W P, Holben W. Ferrographic tracking of bacterial transport in the field at the narrow channel focus area, Oyster, VA. Environ Sci Technol. 2001;35:185–191. doi: 10.1021/es001170e. [DOI] [PubMed] [Google Scholar]
- 9.Ko C, Elimelech M. The “shadow effect” in colloid transport and deposition dynamics in granular porous media: measurements and mechanisms. Environ Sci Technol. 2000;34:3681–3689. [Google Scholar]
- 10.Murphy E M, Ginn T R. Modeling microbial processes in porous media. Hydrogeol J. 2000;8:142–158. [Google Scholar]
- 11.Zhang P, Johnson W P. Rapid selective ferrographic enumeration of bacteria. J Magn Magn Mater. 1999;194:267–274. [Google Scholar]
- 12.Zhang P, Johnson W P, Rowland R. Bacterial tracking using ferrographic separation. Environ Sci Technol. 1999;33:2456–2460. [Google Scholar]
- 13.Zhang, P., W. P. Johnson, T. D. Scheibe, K. Choi, and F. C. Dobbs. Extended tailing of bacterial concentrations at the narrow channel site, Oyster, VA. Water Resour. Res., in press.


