

Abstract
Public health systems should guarantee universal access to health care services, including cancer screening. We assessed whether certain population subgroups were underrepresented among participants in colorectal cancer screening with sigmoidoscopy and faecal immunochemical testing (FIT). Between 2012 and 2019, about 140 000 individuals aged 50 to 74 years were randomly invited to once‐only sigmoidoscopy or first round of FIT screening. Our study included 46 919 individuals invited to sigmoidoscopy and 70 019 to FIT between 2012 and 2017. We used logistic regression models to evaluate if demographic and socioeconomic factors and use of certain drugs were associated with participation. Twenty‐four thousand one hundred and fifty‐nine (51.5%) individuals attended sigmoidoscopy and 40 931 (58.5%) FIT screening. Male gender, young age, low education and income, being retired or unemployed, living alone, being an immigrant, long driving time to screening centre, and use of antidiabetic and psychotropic drugs were associated with low participation in both screening groups. Many of these factors also predicted low acceptance of colonoscopy after positive FIT. While male gender, young age and living alone were more strongly associated with nonparticipation in FIT than sigmoidoscopy, low education and income, being retired or immigrant and long driving time were more strongly associated with nonparticipation in sigmoidoscopy than FIT. In conclusion, participation was lower in sigmoidoscopy than FIT. Predictors of nonparticipation were similar between arms. However, low socioeconomic status, being an immigrant and long driving time affected participation more in sigmoidoscopy screening, suggesting that FIT may guarantee more equal access to screening services than sigmoidoscopy.
Keywords: colorectal cancer screening, faecal immunochemical testing, participation, sigmoidoscopy, socioeconomic status
What's new?
Participation rates in European screening programmes vary broadly. Whether sociodemographic factors predict participation in faecal‐based and sigmoidoscopy screening differently remains to be determined. Our study linking data from a large randomised screening trial and population‐based registries shows that male gender and young age are more strongly associated with nonparticipation in faecal immunochemical testing than sigmoidoscopy screening. Low education and income, retirement, immigration background and long driving time to the screening centre are more strongly associated with nonparticipation in sigmoidoscopy than faecal immunochemical screening. Faecal immunochemical testing might guarantee more equal access to screening services compared to sigmoidoscopy.
Abbreviations
- CRC
colorectal cancer
- FIT
faecal immunochemical test
1. INTRODUCTION
Colorectal cancer (CRC) is the cancer type with the third highest mortality rate globally. 1 Nationwide organised CRC screening programmes have been established or are being planned in most developed countries around the world, repeated faecal testing being the most common screening method in European, 2 East Asian and South‐East Asian countries. 3 Among programmes using endoscopy as the primary screening method, colonoscopy is used in Poland and parts of Germany, sigmoidoscopy has been used in parts of the United Kingdom, while colonoscopy is the most common method in the United States.
Reported participation rates in the European organised screening programmes or trials targeting 50 to 70 year‐old individuals vary between 10% and 73% for faecal tests, between 15% and 52% for colonoscopy screening 2 , 4 , 5 and between 19% and 52% for sigmoidoscopy screening. 6 According to studies that used public registries, vulnerable demographic characteristics and low socioeconomic status are predictors of nonparticipation. In European nationwide organised screening programmes, uptake in faecal‐based screening has been shown to be higher in women than in men and to increase with age up to 70 years. 5 , 7 , 8 Participation is lowest in the lowest socioeconomic groups, 5 , 7 , 8 , 9 , 10 population with nonnative ethnicity, 5 , 8 , 9 those living without a partner, 5 , 8 with earlier nonparticipation 8 and with major chronic diseases. 11 The socioeconomic gradient is also important in sigmoidoscopy screening, where participation is lower than in faecal‐based screening. 12 , 13 However, it is unknown whether sociodemographic factors predict participation in faecal‐based and sigmoidoscopy screening differently.
Demographic and sociodemographic factors, such as male gender and low education, are risk factors of CRC 14 , 15 ; certain comorbidities associated with nonparticipation, including metabolic syndrome and diabetes mellitus, also predict CRC risk. 16 , 17 Together, this indicates that people with the highest risk of CRC might be the ones who participate the least in screening, a paradox long observed in medical care. 18
In the present study, we linked data from an ongoing large randomised screening trial with data from population‐based registries. The primary aim was to identify demographic, socioeconomic and comorbidity‐related factors associated with nonparticipation in faecal immunochemical test (FIT) and sigmoidoscopy screening. As secondary aims, we investigated whether predictive factors for nonparticipation also predict nonacceptance of follow‐up colonoscopy after a positive FIT, and whether these factors were associated with neoplasia detected at the screening among those who participated.
2. METHODS
2.1. Design and participants
In 2012, 140 000 out of 154 000 individuals 50 to 74 years old living in two geographical areas in South‐East part of Norway, identified through the population registry, were randomly invited to CRC screening by either once‐only sigmoidoscopy or a FIT every second year in a 1:1 ratio. 12 For the current study, we included participants invited to sigmoidoscopy and the first round of FIT between March 2012 and April 2017. Data extraction was conducted in October 2017. Attenders in the sigmoidoscopy group provided written informed consent on attendance at the screening centre, while return of the faecal sample was considered as consent to participate in the FIT group.
2.2. Screening invitation procedure
Participants were invited by mail and reminded once in case of no‐response after 6 weeks. 12 Individuals randomised to FIT were mailed an invitation together with a FIT sampling kit (OC Sensor, Eiken Chemicals) and instructions. The participants were instructed to return the faecal sample in a prepaid return envelope. Individuals randomised to sigmoidoscopy were mailed an invitation letter with a prespecified time for out‐patient sigmoidoscopy (n = 36 293, 77.4%) or were invited to sigmoidoscopy by an open invitation with an opportunity to book the time in the screening centre at a suitable time point (10 626, 22.6%). No preparations were required from the participants prior to the examination. Bowel cleansing was conducted at the screening centre. Participation in FIT and sigmoidoscopy screening was free of charge for the participant, but the sigmoidoscopy participants had to arrange and cover costs for their travel to the screening centre. Parking at the screening centre was free of charge. In both modalities, participants with a positive screening test, that is, blood detected in the FIT sample, or any significant lesions detected in sigmoidoscopy, were referred to a follow‐up colonoscopy. 12 Participants themselves had to cover a copayment of NOK 450 (approximately 45 €) for the colonoscopy examination.
2.3. Data variables and sources
Data on marital status, immigration status, education, employment and household income for all invited individuals were retrieved from Statistics Norway. Status “immigrant” was defined as being born outside Norway by two non‐Norwegian parents. All others were defined as “nonimmigrants.” Data on drug prescriptions were obtained from the Norwegian Prescription Database. We included the prescriptions of the following drugs as surrogates for major comorbidities: drugs used in diabetes (anatomical therapeutic chemical code A10), antithrombotic agents (B01), cardiac therapy (C01), antihypertensives (C07, C08 and C09), psychotropic drugs (N05A, N05B, N05C and N06A), anti‐Parkinson drugs (N04) and drugs for obstructive airway diseases (R03). We defined an individual as a user of a particular drug class if he/she received two prescriptions of that drug class during the year before invitation. These data from individual level records were merged with additional information obtained from the trial: demographic data, driving time to the screening centre, participation in sigmoidoscopy and FIT screening (yes/no), acceptance of work‐up colonoscopy after a positive screening test (yes/no) and the screening findings. We used predefined cut‐off times of 20 and 40 minutes to categorise driving time to the screening centre from the participant's registered address of residence, based on a digital map estimate.
2.4. Outcomes
The outcomes of interest were participation in sigmoidoscopy and FIT arms, acceptance of colonoscopy after a positive screening test, and final screening outcome among those who participated. Participation in FIT was defined as participating in the first round, however we ran an additional analysis of participation in two rounds of FIT among those who were invited twice before the extraction of the data (n = 57 119). The final screening outcome was dichotomized into “advanced neoplasia” (an adenoma with either size ≥10 mm, villous components of at least 25% or high‐grade dysplasia, or adenocarcinoma) and “no advanced neoplasia” (any other outcome or negative primary screening test).
2.5. Statistical methods
The Chi‐square test or the Chi‐square test for trend were used to evaluate the differences in categorical and ordinal variables, respectively, between participants and nonparticipants, in sigmoidoscopy and FIT arms separately. We also examined the association between these factors and participation in follow‐up colonoscopy invitation after a positive FIT result. We did not analyse predictors of follow‐up colonoscopy invitation after a positive sigmoidoscopy result because of almost complete participation in that arm (97.8%). Multivariable logistic regression models were used to estimate the association between the possible predictors of participation and each outcome. We report odds ratios (OR) with 95% confidence intervals (CI). All ORs reported in the tables were mutually adjusted and additionally adjusted by screening centre. To test for the interaction between each factor and arm, gender or age (≤60 years vs >60 years), interaction terms were added to the multivariable models. To test for the linear association of education and income with nonacceptance of colonoscopy in FIT‐positive participants, we entered the two ordinal variables as continuous variables in the multivariable logistic regression models. To illustrate participation rates by age and stratified by sex, we present restricted cubic splines from univariate logistic models, with knots placed at the four quartiles of age.
All tests were 2‐sided, and P‐values <.05 were considered statistically significant. Statistical analyses were performed by using SAS software, version 9.4 (SAS Institute, Inc, Cary, NC).
3. RESULTS
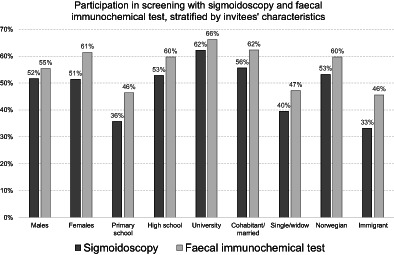
We included 46 919 individuals invited to sigmoidoscopy screening and 70 019 invited to FIT screening (Table 1). Of those invited, 24 159 (51.5%) individuals participated in the sigmoidoscopy screening and 40 931 (58.5%) in the first round of FIT screening. Participation rates by age and sex are presented in Figure 1. In both screening arms, male gender, younger age, low education, being retired or unemployed, low income, living alone, being an immigrant, living far from the screening centre and use of antidiabetic and psychotropic drugs, were associated with a low participation (Table 2). When including the first two rounds in the FIT arm, participation in at least one of the two rounds was 64.7% (Figure 1) but results on the predictors of participation did not change substantially (data not shown).
TABLE 1.
Characteristics of the invited population and association with participation
| Sigmoidoscopy | Faecal immunochemical test | ||||||
|---|---|---|---|---|---|---|---|
| Characteristic | Category | Invited (col%) | Participated (row %) | P | Invited (col%) | Participated (row %) | P |
| All | 46 919 (100.0) | 24 159 (51.5) | 70 019 (100.0) | 40 931 (58.5%) | |||
| Sex | Females | 23 844 (50.8) | 12 250 (51.4) | .61 | 35 455 (50.6) | 21 774 (61.4) | <.01 |
| Males | 23 075 (49.2) | 11 909 (51.6) | 34 564 (49.4) | 19 157 (55.4) | |||
| Age (years) | 50‐55 | 8420 (17.9) | 4033 (47.9) | <.01 | 13 787 (19.7) | 7154 (51.9) | <.01 |
| 56‐60 | 10 884 (23.2) | 5474 (50.3) | 16 325 (23.3) | 9156 (56.1) | |||
| 61‐65 | 9781 (20.8) | 5291 (54.1) | 14 566 (20.8) | 8865 (60.9) | |||
| 66‐70 | 9551 (20.4) | 5298 (55.5) | 14 327 (20.5) | 9222 (64.4) | |||
| >70 | 8283 (17.7) | 4063 (49.1) | 11 014 (15.7) | 6534 (59.3) | |||
| Education | Primary school | 10 305 (22.3) | 3681 (35.7) | <.01 | 15 235 (22.0) | 7065 (46.4) | <.01 |
| High school | 21 452 (46.3) | 11 324 (52.8) | 32 051 (46.3) | 19 142 (59.7) | |||
| 1‐4 years university | 10 481 (22.6) | 6459 (61.6) | 15 624 (22.6) | 10 372 (66.4) | |||
| >4 years university | 4061 (8.8) | 2590 (63.8) | 6276 (9.1) | 4124 (65.7) | |||
| Occupation | Employed | 28 006 (59.7) | 15 865 (56.6) | <.01 | 42 157 (60.2) | 25 762 (61.1) | <.01 |
| Retired | 18 596 (39.7) | 8188 (44.0) | 27 358 (39.1) | 14 971 (54.7) | |||
| Unemployed | 297 (0.6) | 104 (35.0) | 476 (0.7) | 194 (40.8) | |||
| Household income (NOK) | ≤484 000 | 11 864 (25.3) | 4028 (34.0) | <.01 | 17 351 (24.8) | 7777 (44.8) | <.01 |
| 484 001‐755 000 | 11 755 (25.1) | 6044 (51.4) | 17 456 (24.9) | 10 385 (59.5) | |||
| 755 001‐1 130 000 | 11 703 (25.0) | 6753 (57.7) | 17 537 (25.1) | 11 076 (63.2) | |||
| >1 130 000 | 11 566 (24.7) | 7331 (63.4) | 17 638 (25.2) | 11 689 (66.3) | |||
| Marital status | Cohabit/married | 34 953 (74.3) | 19 437 (55.6) | <.01 | 52 351 (74.6) | 32 517 (62.3) | <.01 |
| Single/widow | 12 072 (25.7) | 4719 (39.5) | 17 638 (25.4) | 8324 (47.2) | |||
| Immigration background | Norwegian | 42 852 (91.3) | 22 810 (53.2) | <.01 | 63 843 (91.2) | 38 114 (59.7) | <.01 |
| Immigrant | 4067 (8.7) | 1349 (33.2) | 6175 (8.8) | 2816 (45.6) | |||
| Centre | Moss | 25 056 (53.4) | 12 334 (49.2) | <.01 | 36 367 (51.9) | 20 831 (57.3) | <.01 |
| Bærum | 21 863 (46.6) | 11 825 (54.1) | 33 652 (48.1) | 20 100 (59.7) | |||
| Driving time (minutes) | ≤20 | 19 733 (42.8) | 11 233 (56.9) | <.01 | 29 546 (43.1) | 18 083 (61.2) | <.01 |
| 21‐40 | 17 297 (37.5) | 8555 (49.5) | 25 677 (37.4) | 14 845 (57.8) | |||
| >40 | 9046 (19.6) | 4123 (45.6) | 13 401 (19.5) | 7517 (56.1) | |||
| Drugs used in diabetes | No use | 43 699 (93.1) | 22 906 (52.4) | <.01 | 65 367 (93.4) | 38 683 (59.2) | <.01 |
| Use | 3220 (6.9) | 1253 (38.9) | 4652 (6.6) | 2248 (48.3) | |||
| Drugs for obstructive airway diseases | No use | 42 580 (90.8) | 22 178 (52.1) | <.01 | 63 553 (90.8) | 37 354 (58.8) | <.01 |
| Use | 4339 (9.2) | 1981 (45.7) | 6466 (9.2) | 3577 (55.3) | |||
| Antithrombotic agents | No use | 37 210 (79.3) | 19 289 (51.8) | <.01 | 55 803 (79.7) | 32 552 (58.3) | .19 |
| Use | 9709 (20.7) | 4870 (50.2) | 14 216 (20.3) | 8379 (58.9) | |||
| Antihypertensives | No use | 30 208 (64.4) | 15 782 (52.2) | <.01 | 45 397 (64.8) | 26 681 (58.8) | .02 |
| Use | 16 711 (35.6) | 8377 (50.1) | 24 622 (35.2) | 14 250 (57.9) | |||
| Cardiac therapy | No use | 45 937 (97.9) | 23 708 (51.6) | <.01 | 68 545 (97.9) | 40 096 (58.5) | .16 |
| Use | 982 (2.1) | 451 (45.9) | 1474 (2.1) | 835 (56.6) | |||
| Anti‐Parkinson drugs | No use | 46 577 (99.3) | 24 008 (51.5) | <.01 | 69 477 (99.2) | 40 662 (58.5) | <.01 |
| Use | 342 (0.7) | 151 (44.2) | 542 (0.8) | 269 (49.6) | |||
| Psychotropic drugs | No use | 37 855 (80.7) | 20 283 (53.6) | <.01 | 56 622 (80.9) | 33 888 (59.9) | <.01 |
| Use | 9064 (19.3) | 3876 (42.8) | 13 397 (19.1) | 7043 (52.6) | |||
FIGURE 1.
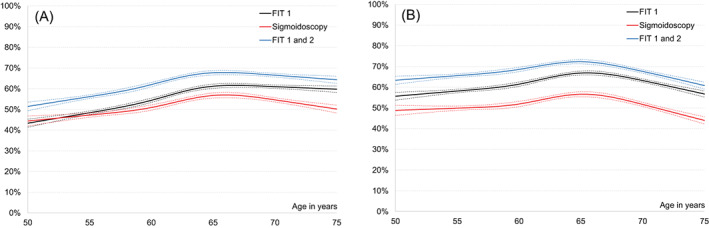
Participation rates by age in the sigmoidoscopy group, FIT round 1 and FIT rounds 1 and 2 for (A) men and (B) women, respectively. For FIT rounds 1 and 2, participation was defined as at least once across the two FIT rounds. Dotted lines represent 95% confidence bands
TABLE 2.
Odds ratios for nonparticipation in colorectal cancer screening from multivariable logistic regression models
| Characteristic | Comparison | Sigmoidoscopy | Faecal immunochemical test | |
|---|---|---|---|---|
| OR (95% CI) | OR (95% CI) | P a | ||
| Sex | Males vs females | 1.13 (1.08‐1.17) | 1.44 (1.40‐1.49) | <.01 |
| Age (years) | ≤55 vs >70 | 1.59 (1.48‐1.71) | 1.77 (1.67‐1.88) | <.01 |
| 56‐60 vs >70 | 1.41 (1.32‐1.51) | 1.49 (1.40‐1.57) | ||
| 61‐65 vs >70 | 1.16 (1.09‐1.24) | 1.17 (1.11‐1.24) | ||
| 66‐70 vs >70 | 0.92 (0.86‐0.98) | 0.91 (0.86‐0.96) | ||
| Education | Primary school vs >4 years university | 2.06 (1.89‐2.24) | 1.80 (1.68‐1.93) | .03 |
| High school vs >4 years university | 1.28 (1.19‐1.38) | 1.22 (1.15‐1.30) | ||
| 1‐4 years vs >4 years university | 0.99 (0.91‐1.07) | 0.97 (0.91‐1.03) | ||
| Occupation | Unemployed vs employed | 1.55 (1.20‐2.00) | 1.64 (1.35‐1.99) | .02 |
| Retired vs employed | 1.31 (1.25‐1.38) | 1.19 (1.14‐1.24) | ||
| Household income (NOK) | ≤484 000 vs >1 130 000 | 1.99 (1.85‐2.14) | 1.66 (1.56‐1.76) | <.01 |
| 484 001‐755 000 vs >1 130 000 | 1.28 (1.20‐1.36) | 1.17 (1.12‐1.23) | ||
| 755 001‐1 130 000 vs >1 130 000 | 1.11 (1.05‐1.17) | 1.07 (1.01‐1.12) | ||
| Marital status | Single/widow vs married/cohabiting | 1.31 (1.24‐1.38) | 1.41 (1.35‐1.47) | .04 |
| Immigration background | Immigrant vs Norwegian | 1.96 (1.82‐2.11) | 1.46 (1.38‐1.55) | <.01 |
| Driving time (minutes) | 21‐40 vs ≤20 | 1.20 (1.15‐1.26) | 1.06 (1.01‐1.10) | <.01 |
| >40 vs ≤20 | 1.36 (1.29‐1.44) | 1.09 (1.04‐1.14) | ||
| Drugs used in diabetes | Use vs no use | 1.41 (1.30‐1.52) | 1.38 (1.29‐1.47) | .68 |
| Drugs for obstructive airways disease | Use vs no use | 1.06 (0.99‐1.13) | 1.05 (1.00‐1.11) | .86 |
| Antithrombotic agents | Use vs no use | 0.96 (0.91‐1.02) | 0.89 (0.85‐0.93) | .04 |
| Antihypertensives | Use vs no use | 1.00 (0.95‐1.05) | 1.04 (1.01‐1.08) | .17 |
| Cardiac therapy | Use vs no use | 1.03 (0.89‐1.18) | 0.97 (0.86‐1.08) | .52 |
| Anti‐Parkinson drugs | Use vs no use | 1.12 (0.91‐1.43) | 1.29 (1.08‐1.54) | .37 |
| Psychotropic drugs | Use vs no use | 1.23 (1.17‐1.29) | 1.18 (1.13‐1.23) | .22 |
Abbreviations: OR, odds ratio.
Testing heterogeneity between sigmoidoscopy and faecal immunochemical test. Estimates were additionally adjusted by screening centre.
Participation was higher in females than males, especially in the FIT arm (P‐value for between‐arms heterogeneity <.01; Table 2). While male gender, young age and living alone were more strongly associated with nonparticipation in FIT, low education and income, being retired or immigrant and long driving time were more strongly associated with nonparticipation in sigmoidoscopy.
When stratified by screening method and sex, in the FIT arm we found that age and living alone were more strongly associated with nonparticipation in men than in women, while driving time counted more for women than men (Table S1). When stratified by arm and age, we found that being retired or unemployed and low income were predictors of nonparticipation more among those aged 60 years or younger, while living alone and use of psychotropic drugs were predictors of nonparticipation more among those above 60 (Table S2). Finally, when stratified by arm and education, we found that, in both arms, living alone had a stronger association with nonparticipation in those with a primary education than in those with secondary or higher education. In the sigmoidoscopy arm, being unemployed had a stronger association with nonparticipation in those with a primary education; in the FIT arm, low income had a stronger association with nonparticipation in those with a university education (data not shown).
Among the participants in the first FIT round, the 3300 (8.1%) individuals with a positive result were invited to undergo a colonoscopy, and 3100 (93.9%) accepted (Table 3). Nonacceptance of colonoscopy was associated with being an immigrant, living far from the screening centre, and use of antidiabetic and psychotropic drugs. Moreover, a higher, borderline significant odds for nonacceptance of colonoscopy was observed for retirement and living alone. Finally, we also found evidence of a linear association between nonacceptance of colonoscopy and education (P‐value for linear trend .03) and income (P‐value for linear trend .06).
TABLE 3.
Characteristics of the population invited to colonoscopy after a positive faecal immunochemical test and multivariable logistic regression analyses with odds ratios for nonparticipation to colonoscopy
| Characteristic | Category | Invited (col%) | Participated (row %) | P | OR (95% CI) for nonparticipation |
|---|---|---|---|---|---|
| All | 3300 (100.0) | 3100 (93.9) | |||
| Sex | Females | 1454 (44.1) | 1358 (93.4) | .25 | Ref. |
| Males | 1846 (55.9) | 1742 (94.4) | 1.04 (0.76‐1.42) | ||
| Age (years) | 50‐55 | 400 (12.1) | 378 (94.5) | <.01 | 1.05 (0.59‐1.86) |
| 56‐60 | 607 (18.4) | 583 (96.0) | 0.65 (0.38‐1.11) | ||
| 61‐65 | 704 (21.3) | 663 (94.2) | 0.92 (0.59‐1.44) | ||
| 66‐70 | 823 (24.9) | 774 (94.0) | 0.83 (0.55‐1.24) | ||
| >70 | 766 (23.2) | 702 (91.6) | Ref. | ||
| Education | Primary school | 730 (22.3) | 661 (90.5) | <.01 | 1.59 (0.75‐3.37) |
| High school | 1593 (48.6) | 1503 (94.4) | 1.12 (0.55‐2.29) | ||
| 1‐4 years university | 698 (21.3) | 670 (96.0) | 0.87 (0.40‐1.86) | ||
| >4 years university | 256 (7.8) | 246 (96.1) | Ref. | ||
| Occupation | Employed | 1779 (53.9) | 1707 (96.0) | <.01 | Ref. |
| Retired | 1504 (45.6) | 1377 (91.6) | 1.42 (0.98‐2.06) | ||
| Unemployed | 17 (0.5) | 16 (94.1) | 1.37 (0.17‐10.9) | ||
| Household income (NOK) | ≤484 000 | 822 (24.9) | 735 (89.4) | <.01 | 1.66 (0.92‐3.01) |
| 484 001‐755 000 | 898 (27.2) | 844 (94.0) | 1.18 (0.68‐2.05) | ||
| 755 001‐1 130 000 | 849 (25.7) | 814 (95.9) | 1.05 (0.60‐1.82) | ||
| >1 130 000 | 731 (22.2) | 707 (96.7) | Ref. | ||
| Marital status | Cohabit/married | 2548 (77.2) | 2419 (94.9) | <.01 | Ref. |
| Single/widow | 752 (22.8) | 681 (90.6) | 1.41 (0.97‐2.04) | ||
| Immigration background | Norwegian | 3069 (93.0) | 2895 (94.3) | <.01 | Ref. |
| Immigrant | 231 (7.0) | 205 (88.7) | 2.19 (1.37‐3.49) | ||
| Driving time (minutes) | ≤20 | 1322 (40.6) | 1257 (95.1) | <.01 | Ref. |
| 21‐40 | 1303 (40.1) | 1230 (94.4) | 1.54 (1.03‐2.30) | ||
| >40 | 628 (19.3) | 575 (91.6) | 1.94 (1.29‐2.92) | ||
| Drugs used in diabetes | No use | 3042 (92.2) | 2873 (94.4) | <.01 | Ref. |
| Use | 258 (7.8) | 227 (88.0) | 1.68 (1.08‐2.61) | ||
| Drugs for obstructive airway diseases | No use | 2873 (87.1) | 2711 (94.4) | <.01 | Ref. |
| Use | 427 (12.9) | 389 (91.1) | 1.15 (0.77‐1.70) | ||
| Antithrombotic agents | No use | 2271 (68.8) | 2154 (94.8) | <.01 | Ref. |
| Use | 1029 (31.2) | 946 (91.9) | 1.24 (0.87‐1.77) | ||
| Antihypertensives | No use | 1795 (54.4) | 1703 (94.9) | .01 | Ref. |
| Use | 1505 (45.6) | 1397 (92.8) | 1.07 (0.76‐1.50) | ||
| Cardiac therapy | No use | 3185 (96.5) | 2994 (94.0) | .42 | Ref. |
| Use | 115 (3.5) | 106 (92.2) | 0.78 (0.37‐1.63) | ||
| Anti‐Parkinson drugs | No use | 3273 (99.2) | 3077 (94.0) | .08 | Ref. |
| Use | 27 (0.8) | 23 (85.2) | 2.47 (0.81‐7.59) | ||
| Psychotropic drugs | No use | 2589 (78.5) | 2464 (95.2) | <.01 | Ref. |
| Use | 711 (21.5) | 636 (89.5) | 1.75 (1.26‐2.44) |
Note: Estimates were additionally adjusted by screening centre.
Abbreviations: CI, confidence interval; OR, odds ratio.
Among participants in both arms, male gender, older age, lower education, and use of drugs for obstructive airway diseases were associated with a higher likelihood of advanced neoplasia detection (Tables 4 and S3). Among participants in the FIT arm, lower income and use of antihypertensives, and among participants in the sigmoidoscopy arm, use of antidiabetics were borderline significantly associated with a higher odds of advanced neoplasia detection.
TABLE 4.
Odds ratios for advanced neoplasia among participants in the screening from multivariable logistic regression models a
| Advanced neoplasia | |||
|---|---|---|---|
| Sigmoidoscopy | Faecal immunochemical test | ||
| Characteristic | Comparison | OR (95% CI) | OR (95% CI) |
| Sex | Males vs females | 1.81 (1.60‐2.04) | 1.98 (1.74‐2.26) |
| Age (years) | ≤55 vs >70 | 0.48 (0.39‐0.61) | 0.42 (0.32‐0.54) |
| 56‐60 vs >70 | 0.49 (0.40‐0.61) | 0.53 (0.43‐0.66) | |
| 61‐65 vs >70 | 0.74 (0.61‐0.88) | 0.73 (0.60‐0.88) | |
| 66‐70 vs >70 | 0.93 (0.79‐1.10) | 0.78 (0.66‐0.93) | |
| Education | Primary school vs >4 years university | 1.75 (1.36‐2.24) | 1.62 (1.23‐2.14) |
| High school vs >4 years university | 1.52 (1.22‐1.88) | 1.50 (1.18‐1.94) | |
| 1‐4 years vs >4 years university | 1.20 (0.95‐1.51) | 1.23 (0.95‐1.60) | |
| Occupation | Unemployed vs employed | 0.62 (0.23‐1.70) | 1.43 (0.67‐3.06) |
| Retired vs employed | 0.94 (0.81‐1.08) | 1.14 (0.98‐1.33) | |
| Household income (NOK) | ≤484 000 vs >1 130 000 | 1.09 (0.87‐1.36) | 1.23 (0.96‐1.56) |
| 484 001‐755 000 vs >1 130 000 | 1.05 (0.88‐1.25) | 1.25 (1.02‐1.52) | |
| 755 001‐1 130 000 vs >1 130 000 | 1.06 (0.90‐1.24) | 1.27 (1.06‐1.52) | |
| Marital status | Single/widow vs married/cohabiting | 1.12 (0.95‐1.32) | 1.02 (0.86‐1.22) |
| Immigration background | Immigrant vs Norwegian | 0.84 (0.64‐1.10) | 0.94 (0.73‐1.22) |
| Driving time (minutes) | 21‐40 vs ≤20 | 1.01 (0.88‐1.17) | 1.03 (0.88‐1.20) |
| >40 vs ≤20 | 1.03 (0.87‐1.21) | 1.06 (0.89‐1.25) | |
| Drugs used in diabetes | Use vs no use | 1.21 (0.97‐1.50) | 1.00 (0.79‐1.26) |
| Drugs for obstructive airways disease | Use vs no use | 1.36 (1.14‐1.63) | 1.31 (1.09‐1.58) |
| Antithrombotic agents | Use vs no use | 1.02 (0.88‐1.18) | 1.12 (0.96‐1.30) |
| Antihypertensives | Use vs no use | 1.06 (0.93‐1.20) | 1.15 (1.00‐1.32) |
| Cardiac therapy | Use vs no use | 1.03 (0.72‐1.49) | 0.93 (0.65‐1.34) |
| Anti‐Parkinson drugs | Use vs no use | 0.68 (0.32‐1.46) | 0.65 (0.29‐1.46) |
| Psychotropic drugs | Use vs no use | 0.96 (0.82‐1.12) | 1.00 (0.65‐1.17) |
Abbreviations: CI, confidence interval; OR, odds ratio.
Two hundred faecal immunochemical test attendees did not undergo a colonoscopy, and were excluded from the analysis. Estimates were additionally adjusted by screening centre.
4. DISCUSSION
In this large randomised Norwegian colorectal cancer screening trial, we identified several factors associated with participation in FIT and sigmoidoscopy screening. We showed that young age was associated with nonparticipation in both arms, but particularly in the FIT screening arm. Females were more willing than males to participate in FIT screening. Socioeconomic and immigration status and long driving time to the screening centre were associated with nonparticipation in both arms, but more strongly in sigmoidoscopy screening. Individuals who used antidiabetic and psychotropic drugs had a lower participation in both arms. In addition, the acceptance of follow‐up colonoscopy after a positive FIT was lower in participants with immigrant status, those who lived far from the screening centre, and those using antidiabetic and psychotropic drugs. Among the factors associated with nonparticipation, male sex and low education were associated with the detection of advanced neoplasia in the participants in both arms.
Our results in the FIT arm are comparable with studies from European CRC screening programmes. In the publicly funded screening programmes in Denmark, Finland and Spain, uptake in faecal‐based screening was shown to increase by increasing age, 5 , 7 , 8 but, similarly to our findings, it decreased from the top participation rate after reaching 70 years of age in Denmark. 5 A common feature with our and the other European studies is that participation in faecal‐based screening was higher in women than men. 8 , 19 , 20 We observed that the difference in uptake between males and females was stronger in the FIT than in the sigmoidoscopy arm. Similarly, the Spanish COLONPREV study observed that sex difference was greater in screening with FIT than with primary colonoscopy screening. Women had a higher preference for FIT than colonoscopy as compared to men when given an opportunity to choose. 20 These results, together with ours, indicate that screening participation of women is higher if FIT is the offered method, while for men the method of choice does not significantly affect screening participation. Anxiety related to the procedures has been observed as a major barrier to sigmoidoscopy screening, particularly in women. 21 In our study, screening uptake was, as in other European studies in faecal‐based 5 , 7 , 8 , 10 and sigmoidoscopy‐based 22 screening, lowest in the lowest socioeconomic status groups. Like in Denmark and Finland, we found that FIT uptake was lower in immigrants than native residents. 5 , 8 We also showed that this association was stronger in the sigmoidoscopy than in the FIT arm. All this indicates that individuals with low socioeconomic status, immigrants and those living far from the screening centre may perceive greater barriers to meeting up at a screening centre for an invasive examination than to follow written instructions to take a faecal test at home. In our study, living without a partner was a predictor for not participating, slightly more for men than women. In two studies in Denmark and Finland, living without a partner was also a predictor for nonparticipation in faecal‐based screening, but no difference between men and women was evident. 8 , 19 Although we observed heterogeneity between FIT and sigmoidoscopy for several socio‐demographic factors, the difference in odds for nonparticipation between the screening methods are truly large only for some of them, such as immigrants vs nonimmigrants, high vs low income and long vs short travel time to screening centre.
Our results indicate that individuals on antidiabetic or psychotropic drugs were less likely to participate in both sigmoidoscopy and FIT screening. Importantly, FIT participants with a positive screening test who used antidiabetic or psychotropic drugs were less likely to accept the follow‐up colonoscopy than other FIT‐positive participants. These findings suggest certain health conditions constitute an impairment to attending or completing the screening. In the Spanish FIT screening programme, lower uptake was reported for those with several dominant chronic diseases. 11 Comorbidity has been found as a predictor for low compliance in follow‐up colonoscopy after a positive FIT screening test by several studies. 23 , 24 , 25 The Danish screening programme, similarly to our study, found that individuals with diabetes represented one group with low participation. 25 Given the increased risk of colorectal cancer in diabetic individuals, 16 this group might benefit from specially targeted invitations to primary screening and work‐up colonoscopy. Our results also suggest that several other groups may need additional assistance to attend the work‐up colonoscopy after a positive FIT result. These include retired people, immigrant population, individuals living far from the screening centre and individuals suffering from mental health conditions. Without additional support, access to appropriate screening appear to be reduced for these groups. However, using socioeconomic and health data to identify and offer tailored invitations for certain subgroups of the population raises a number of ethical and privacy issues.
Detection of advanced neoplasia in participants was associated with male gender, low education and use of drugs for obstructive airway diseases. This last observation is not surprising, as use of drugs for airway diseases might be linked to smoking, which in turn is associated with advanced neoplasia. 26 Because low education predicted both nonparticipation and adverse screening findings, our results stress that invitations to screening must be written in a language understandable by people with low health literacy.
An important aspect is the balance between providing information on screening and respecting the individual's own decision to participate. A shared decision‐making process between the health providers and the population, entails that the provider should avoid crossing the line between “persuasive facilitation” of screening and “too good to be rejected” (such as monetary stimuli being used to promote covid19 vaccination). 27 We believe that the goal in cancer screening should not be to persuade people to participate, but to ensure equal access and opportunity to participate. Making the screening free of charge for the participants may be a significant measure to reduce inequity. Equal access can further be achieved by improving the understanding of screening aims and procedures in identified demographic groups (eg, immigrants or those with low education) and by facilitating the participation of people with comorbidities that impede access to the screening. 28 , 29 An invitee without symptoms may perceive a preventive health examination as meaningless if not having understood the purpose of screening. FIT screening, which requires less time and effort for the participant, may be a more acceptable examination for the population groups with low participation rate. At the same time, it should be kept in mind that subjects with certain comorbidities, such as severe lung/heart disease, are advised not to participate because the possible harms of the screening might outweigh its benefits. Earlier successful measures to improve screening participation rates include prenotification of the FIT screening invitation (37.6% vs 32.1% participation rate by sending vs not sending a prenotification, respectively) 30 and reminder letters to long‐term sigmoidoscopy nonparticipants (45.7% vs 41.6% participation by sending vs not sending reminders, respectively). 31 In the present study, all nonparticipants received a reminder after 6 weeks of the initial invitation, and we did not test the effect of reminders. No prenotification was sent in the present study, but that is planned as a standard invitation procedure in the upcoming national screening programme.
The present study has several strengths: the large sample size and the individual data on demographic and socioeconomic status as well as drug prescriptions, all of which were drawn from population registries, the registry data ensuring reduced risk of selection bias. Limitations of the present study include lack of information on previous colonoscopies, which may explain nonparticipation. Also, we had no data on lifestyle behaviours, such as smoking, body mass index, alcohol intake or dietary habits.
5. CONCLUSION
In this randomised clinical trial of two colorectal cancer screening methods, participation was lower in sigmoidoscopy than FIT screening. Female participated more than males in the FIT screening. The predictors of nonparticipation were similar for both methods and included young age, low education and income, being retired or immigrant, living alone, long driving time to screening centre, and use of antidiabetics and psychotropic drugs. However, several socioeconomic factors affected participation in the sigmoidoscopy more than in the FIT arm. The results suggest that FIT may be more acceptable in the population and might guarantee more equal access to screening services than sigmoidoscopy.
CONFLICT OF INTEREST
The authors declare no potential conflict of interests.
AUTHOR CONTRIBUTIONS
Edoardo Botteri, Geir Hoff, Øyvind Holme, Thomas de Lange, Tomm Bernklev, Eline Aas, Benedicte Kirkøen and Paula Berstad were responsible for the study concept and design. Erik Natvig, Benedicte Kirkøen and Paula Berstad were responsible for acquisition of data. Erik Natvig was responsible for data management and data cleaning. Edoardo Botteri performed the statistical analyses. Edoardo Botteri, Geir Hoff, Øyvind Holme and Paula Berstad interpreted the data. Edoardo Botteri, Geir Hoff and Paula Berstad wrote the first draft of the article. All authors made critical revision of the article for important intellectual content and gave final approval of the version to be submitted. All the work reported in the study has been performed by the authors, unless clearly specified in the text.
ETHICS STATEMENT
The trial was approved by the Regional Committee for Medical Research Ethics in South East Norway (2011/1272). The CRC screening participants provided written informed consent on attendance at the screening centre (the sigmoidoscopy arm) or by return of the faecal sample (FIT arm). The Regional Committee for Medical Research Ethics in South East Norway approved use of registry‐based data on everyone who were invited, regardless of consent. Trial registration number and date of registration are NCT 01538550 (clinicaltrials.gov), February 24, 2012.
Supporting information
Table S1Odds ratios for nonparticipation in colorectal cancer screening from multivariable logistic regression models by sex
Table S2Odds ratios for nonparticipation in colorectal cancer screening from multivariable logistic regression models by age
Table S3Characteristics of the participants and association with the detection of advanced neoplasia
Botteri E, Hoff G, Randel KR, et al. Characteristics of nonparticipants in a randomised colorectal cancer screening trial comparing sigmoidoscopy and faecal immunochemical testing. Int J Cancer. 2022;151(3):361‐371. doi: 10.1002/ijc.34025
Funding informationThe trial study is funded by the Norwegian Parliament (Norwegian national budget from 2011) in preparation for a future nationwide colorectal cancer screening programme. The bowel preparation used for colonoscopy was provided free of charge by Ferring Pharmaceuticals. The registry data extraction was funded by the fund of Cancer Registry of Norway.
DATA AVAILABILITY STATEMENT
Access to research data for external investigators, or use outside of the current protocol, will require approval from the Norwegian Regional Committee for Medical and Health Research Ethic and the Bowel cancer screening in Norway steering committee (information available on the project website: https://www.kreftregisteret.no/screening/Tarmscreeningpiloten/). Research data are not openly available because of the principles and conditions set out in articles 6 [1] (e) and 9 [2] (j) of the General Data Protection Regulation (GDPR). Requests to access the dataset should be directed to the corresponding author.
REFERENCES
- 1. Ferlay JEM, Lam F, Colombet M, et al. Global Cancer Observatory: Cancer Today. Lyon, France: International Agency for Research on Cancer; 2020. https://gco.iarc.fr/today. Accessed June 23, 2021 [Google Scholar]
- 2. Cardoso R, Guo F, Heisser T, Hoffmeister M, Brenner H. Utilisation of colorectal cancer screening tests in European countries by type of screening offer: results from the European Health Interview Survey. Cancers (Basel). 2020;12:1409. doi: 10.3390/cancers12061409 [DOI] [PMC free article] [PubMed] [Google Scholar]
- 3. Sano Y, Byeon JS, Li XB, et al. Colorectal cancer screening of the general population in East Asia. Dig Endosc. 2016;28:243‐249. doi: 10.1111/den.12579 [DOI] [PubMed] [Google Scholar]
- 4. Bongaerts TH, Buchner FL, Middelkoop BJ, Guicherit OR, Numans ME. Determinants of (non‐)attendance at the Dutch cancer screening programmes: a systematic review. J Med Screen. 2020;27:121‐129. doi: 10.1177/0969141319887996 [DOI] [PMC free article] [PubMed] [Google Scholar]
- 5. Deding U, Henig AS, Salling A, Torp‐Pedersen C, Boggild H. Sociodemographic predictors of participation in colorectal cancer screening. Int J Colorectal Dis. 2017;32:1117‐1124. doi: 10.1007/s00384-017-2832-6 [DOI] [PubMed] [Google Scholar]
- 6. Mutneja HR, Agrawal R, Bhurwal A, Arora S, Go A, Attar BM. Comparative effectiveness of fecal immunochemical tests versus flexible sigmoidoscopy for colorectal cancer screening: a systematic review and meta‐analysis of randomized clinical trials. J Gastrointestin Liver Dis. 2021;30:267‐273. doi: 10.15403/jgld-3432 [DOI] [PubMed] [Google Scholar]
- 7. Buron A, Auge JM, Sala M, et al. Association between socioeconomic deprivation and colorectal cancer screening outcomes: low uptake rates among the most and least deprived people. PLoS One. 2017;12:e0179864. doi: 10.1371/journal.pone.0179864 [DOI] [PMC free article] [PubMed] [Google Scholar]
- 8. Jantti M, Heinavaara S, Malila N, Sarkeala T. Sociodemographic features and patterns of non‐participation in colorectal cancer screening in Finland. Eur J Public Health. 2021;31:890‐894. doi: 10.1093/eurpub/ckab074 [DOI] [PubMed] [Google Scholar]
- 9. He E, Lew JB, Egger S, et al. Factors associated with participation in colorectal cancer screening in Australia: results from the 45 and up study cohort. Prev Med. 2018;106:185‐193. doi: 10.1016/j.ypmed.2017.10.032 [DOI] [PubMed] [Google Scholar]
- 10. Lal N, Singh HK, Majeed A, Pawa N. The impact of socioeconomic deprivation on the uptake of colorectal cancer screening in London. J Med Screen. 2021;28:114‐121. doi: 10.1177/0969141320916206 [DOI] [PubMed] [Google Scholar]
- 11. Guiriguet C, Pera G, Castells A, et al. Impact of comorbid conditions on participation in an organised colorectal cancer screening programme: a cross‐sectional study. BMC Cancer. 2017;17:524. doi: 10.1186/s12885-017-3516-x [DOI] [PMC free article] [PubMed] [Google Scholar]
- 12. Randel KR, Schult AL, Botteri E, et al. Colorectal cancer screening with repeated fecal immunochemical test versus sigmoidoscopy: baseline results from a randomized trial. Gastroenterology. 2021;160:1085‐96 e5. doi: 10.1053/j.gastro.2020.11.037 [DOI] [PubMed] [Google Scholar]
- 13. Steele RJ, Carey FA, Stanners G, et al. Randomized controlled trial: flexible sigmoidoscopy as an adjunct to faecal occult blood testing in population screening. J Med Screen. 2020;27:59‐67. doi: 10.1177/0969141319879955 [DOI] [PubMed] [Google Scholar]
- 14. Hjerkind KV, Qureshi SA, Moller B, et al. Ethnic differences in the incidence of cancer in Norway. Int J Cancer. 2017;140:1770‐1780. doi: 10.1002/ijc.30598 [DOI] [PMC free article] [PubMed] [Google Scholar]
- 15. Larsen IK, Myklebust TA, Babigumira R, Vinberg E, Moller B, Ursin G. Education, income and risk of cancer: results from a Norwegian registry‐based study. Acta Oncol. 2020;59:1300‐1307. doi: 10.1080/0284186X.2020.1817548 [DOI] [PubMed] [Google Scholar]
- 16. Ling S, Brown K, Miksza JK, et al. Risk of cancer incidence and mortality associated with diabetes: a systematic review with trend analysis of 203 cohorts. Nutr Metab Cardiovasc Dis. 2021;31:14‐22. doi: 10.1016/j.numecd.2020.09.023 [DOI] [PubMed] [Google Scholar]
- 17. Shen X, Wang Y, Zhao R, et al. Metabolic syndrome and the risk of colorectal cancer: a systematic review and meta‐analysis. Int J Colorectal Dis. 2021;36:2215‐2225. doi: 10.1007/s00384-021-03974-y [DOI] [PubMed] [Google Scholar]
- 18. Hart JT. The inverse care law. Lancet. 1971;1:405‐412. doi: 10.1016/s0140-6736(71)92410-x [DOI] [PubMed] [Google Scholar]
- 19. Gram MA, Therkildsen C, Clarke RB, Andersen KK, Morch LS, Tybjerg AJ. The influence of marital status and partner concordance on participation in colorectal cancer screening. Eur J Public Health. 2021;31:340‐346. doi: 10.1093/eurpub/ckaa206 [DOI] [PubMed] [Google Scholar]
- 20. Salas D, Vanaclocha M, Ibanez J, et al. Participation and detection rates by age and sex for colonoscopy versus fecal immunochemical testing in colorectal cancer screening. Cancer Causes Control. 2014;25:985‐997. doi: 10.1007/s10552-014-0398-y [DOI] [PubMed] [Google Scholar]
- 21. Travis E, Ashley L, Pownall M, O'Connor DB. Barriers to flexible sigmoidoscopy colorectal cancer screening in low uptake socio‐demographic groups: a systematic review. Psychooncology. 2020;29:1237‐1247. doi: 10.1002/pon.5443 [DOI] [PubMed] [Google Scholar]
- 22. Charlson ME, Pompei P, Ales KL, MacKenzie CR. A new method of classifying prognostic comorbidity in longitudinal studies: development and validation. J Chronic Dis. 1987;40:373‐383. doi: 10.1016/0021-9681(87)90171-8 [DOI] [PubMed] [Google Scholar]
- 23. Kim BC, Kang M, Park E, et al. Clinical factors associated with adherence to the follow‐up examination after positive fecal occult blood test in National Colorectal Cancer Screening. J Clin Med. 2020;9:260. doi: 10.3390/jcm9010260 [DOI] [PMC free article] [PubMed] [Google Scholar]
- 24. O'Connor EA, Nielson CM, Petrik AF, Green BB, Coronado GD. Prospective cohort study of predictors of follow‐up diagnostic colonoscopy from a pragmatic trial of FIT screening. Sci Rep. 2020;10:2441. doi: 10.1038/s41598-020-59032-0 [DOI] [PMC free article] [PubMed] [Google Scholar]
- 25. Thomsen MK, Rasmussen M, Njor SH, Mikkelsen EM. Demographic and comorbidity predictors of adherence to diagnostic colonoscopy in the Danish Colorectal Cancer Screening Program: a nationwide cross‐sectional study. Clin Epidemiol. 2018;10:1733‐1742. doi:10.2147/CLEp.S176923 [DOI] [PMC free article] [PubMed] [Google Scholar]
- 26. Botteri E, Borroni E, Sloan EK, et al. Smoking and colorectal cancer risk, overall and by molecular subtypes: a meta‐analysis. Am J Gastroenterol. 2020;115:1940‐1949. doi: 10.14309/ajg.0000000000000803 [DOI] [PubMed] [Google Scholar]
- 27. Aas E. Pecuniary compensation increases participation in screening for colorectal cancer. Health Econ. 2009;18:337‐354. doi: 10.1002/hec.1371 [DOI] [PubMed] [Google Scholar]
- 28. Geiger TM. Colorectal cancer screening and diagnosis: a patient‐centered approach to understanding avoidance. Dis Colon Rectum. 2018;61:417‐418. doi: 10.1097/DCR.0000000000000968 [DOI] [PubMed] [Google Scholar]
- 29. Martin J, Halm EA, Tiro JA, et al. Reasons for lack of diagnostic colonoscopy after positive result on fecal immunochemical test in a safety‐net health system. Am J Med. 2017;130:93.e1‐93.e7. doi: 10.1016/j.amjmed.2016.07.028 [DOI] [PMC free article] [PubMed] [Google Scholar]
- 30. Goshgarian G, Sorourdi C, May FP, et al. Effect of patient portal messaging before mailing fecal immunochemical test kit on colorectal cancer screening rates: a randomized clinical trial. JAMA Netw Open. 2022;5:e2146863. doi: 10.1001/jamanetworkopen.2021.46863 [DOI] [PMC free article] [PubMed] [Google Scholar]
- 31. Kerrison RS, Prentice A, Marshall S, et al. Implementation of long‐term non‐participant reminders for flexible sigmoidoscopy screening. Prev Med Rep. 2021;21:101308. doi: 10.1016/j.pmedr.2020.101308 [DOI] [PMC free article] [PubMed] [Google Scholar]
Associated Data
This section collects any data citations, data availability statements, or supplementary materials included in this article.
Supplementary Materials
Table S1Odds ratios for nonparticipation in colorectal cancer screening from multivariable logistic regression models by sex
Table S2Odds ratios for nonparticipation in colorectal cancer screening from multivariable logistic regression models by age
Table S3Characteristics of the participants and association with the detection of advanced neoplasia
Data Availability Statement
Access to research data for external investigators, or use outside of the current protocol, will require approval from the Norwegian Regional Committee for Medical and Health Research Ethic and the Bowel cancer screening in Norway steering committee (information available on the project website: https://www.kreftregisteret.no/screening/Tarmscreeningpiloten/). Research data are not openly available because of the principles and conditions set out in articles 6 [1] (e) and 9 [2] (j) of the General Data Protection Regulation (GDPR). Requests to access the dataset should be directed to the corresponding author.