

Abstract
Two‐photon polymerization (2PP) represents a powerful technique for the fabrication of precise three‐dimensional structures on a micro‐ and nanometer scale for various applications. While many review articles are focusing on the used polymeric materials and their application in 2PP, in this review the class of two‐photon photo initiators (2PI) used for radical polymerization is discussed in detail. Because the demand for highly efficient 2PI has increased in the last decades, different approaches in designing new efficient 2PIs occurred. This review summarizes the 2PIs known in literature and discusses their absorption behavior under one‐ and two‐photon absorption (2PA) conditions, their two‐photon cross sections (σTPA) as well as their efficiency under 2PP conditions. Here, the photo initiators are grouped depending on their chromophore system (D‐π‐A‐π‐D, D‐π‐D, etc.). Their polymerization efficiencies are evaluated by fabrication windows (FW) depending on different laser intensities and writing speeds.
Keywords: microfabrication, photo initiator, two-photon absorption, two-photon cross-section, two-photon polymerization
Two‐photon polymerization has established itself as one of the most important techniques for the fabrication of 3D structures in the micro to nanometer range. To ensure precise and rapid fabrication, photo initiators (PI) are used that have been specially developed for this purpose. In this review article, the PIs known to the literature are listed and compared in particular according to their structural elements, fabrication behavior and two‐photon cross‐section.

1. Introduction
1.1. Two‐photon polymerization and photo initiators
In 1931, Maria Göppert‐Mayer postulated the theoretical possibility of the two‐photon absorption (2PA) by one molecule in her doctoral thesis. [1] In this process, the energies of two photons add up during simultaneous absorption and stimulate the molecule into its excited state. However, this process requires a very precise temporal and spatial resolution, which was not possible during that time because of the lack of the required technical equipment. With the help of a laser, two‐photon absorption was demonstrated by Kaiser et al. in 1962. [2] Since then, and due to rapid technical developments, two‐photon absorption has been intensively studied. Maruo et al. were one of the first to report a fabricated 3D spiral microstructure using the 2PA effect to initiate polymerization. [3] Since then, the technique of two‐photon polymerization (2PP) has found its way into various application areas such as direct laser writing (DLW),[ 4 , 5 ] functional micro devices, [6] biomaterials,[ 7 , 8 ] 3D data storage[ 9 , 10 ] and tissue engineering.[ 11 , 12 , 13 ] The principle of 2PP is based on the fact that a photo initiator in a monomer solution is excited within the focal point of the laser and, thus, initiates polymerization locally within the focal point. While there have been many reviews reporting on the materials produced via 2PP and their applications,[ 14 , 15 , 16 , 17 , 18 , 19 , 20 , 21 , 22 , 23 ] to the best of our knowledge no review has been published yet that addresses the design and efficiencies of the photo initiators. In this review, we will focus on the structural properties, the resulting values, and efficiencies of type I and type II photo initiators for radical 2PP. Type I photo initiators are compounds which generate radicals by cleavage of a bond under excitation. Type II photo initiators initiate polymerization by undergoing an H‐abstraction reaction when irradiated. In literature it is also known that cationic polymerization under 2PA condition is possible. A brief summary on photo acid generators (PAGs) which initiate cationic polymerization under 2PA condition was reported elsewhere recently. [24]
1.2. Commonly used values for 2PIs and their measurement
A repeatedly discussed unit with which two‐photon initiators (2PI) are characterized, is the Göppert‐Mayer value (GM). The Göppert‐Mayer value is the unit of the two‐photon cross‐section (σTPA) and states that at a photon flow of one photon per second and cm2 in a material of density of one molecule per cm3 over a distance of 1 cm one of 1050 photons is absorbed. Two main methods are used to determine the two‐photon cross‐section: The Z‐scan and the two‐photon excited fluorescence.
1.2.1. The Z‐scan technique
During the Z‐scan measurement the light intensity of a focused laser beam is measured while the sample is moved along the z‐axis. [25] Two different setups can be used. The “closed‐aperture” method uses a narrow aperture at the detector. This results in a sensitive output, which depends on intensity changes in the refractive index, thus leading to defocusing or self‐focusing of the laser beam. In contrast, the “open‐aperture” measurement uses a wide aperture and collects all light from the sample, reflecting only the intensity dependent transmission. [26] However, two major effects can influence the 2PA cross‐section measurement with this technique: 1) Due to the nonlinear scattering or the loss of light due to self‐defocusing (due to the wrong adjustment of the detector) an extra contribution to the apparent nonlinear absorption is added. 2) The non‐linear transmission can be influenced by excited‐state absorption (ESA). The influence can be reduced by using wavelengths where the 1PA (one photon absorption) is negligible, short laser pulses (<1 ps), as well as low repetition rates.[ 25 , 27 ]
1.2.2. Two‐photon excited fluorescence (TPEF)
First developed by Xu and Webb the TPEF‐method provides direct information on the efficiency of 2PA. [28] The σTPA‐value is received by comparing the one‐ and two‐fluorescence spectrum of the sample with the spectra of a reference compound. By double‐referencing the obtained data a large number of variables, like the parameters of the excitation light or the wavelength dependence of the detector, are automatically quitted. This technique depents on exact measurements, since a uncertainty in the one‐photon absorption leads directly to an uncertainty in σTPA value. [26] In addition, the TPEF technique has two limitations, since it cannot be applied on regions with one‐photon absorption and the measured sample must bear a photoluminescence. [26] While, the first restriction is general to all σTPA measurement techniques, by quantifying a secondary photochemical process, like the luminescence of single oxygen, the second restriction can be overcome. However, chromophores designed to act as a photo initiator in 2PP have a low fluorescence. Therefore, measurement applying TPEF often requires intensive measuring time. Since the establishment of this technique, it was further optimized and a wide range of accurate reference 2PA spectra of commercially available dyes have been reported. [29] In general, σTPA‐values obtained from Z‐scan measurements tend to be exaggerated compared to TPEF values.[ 30 , 31 ]
1.2.3. Fabrication properties
Besides the determination of the two‐photon cross‐section, there are several other parameters discussed related to the practical fabrication of 2PP‐produced microstructures. For many years, it was assumed that compounds with a high σTPA result in efficient 2PI for 2PP. But besides the σTPA, factors like the fluorescence quantum yield (Φfl), intersystem crossing efficiency, and solubility play also crucial roles in fabricating structures. To estimate the 2PIs potential, fabrication tests with different laser intensities and writing speeds are required. With such arrays, the energy threshold Eth and the burning threshold (also described as Edamage) can be determined. The energy threshold is defined as the minimal laser power which is needed to ensure that fabricated structures survive the development stage. Some groups use the term of the polymerization threshold (Pth), which is defined as the average power before the lens, below which the polymer line cannot be fabricated. The burning threshold Edamage describes the level of laser power at which good quality fabrication can no longer be achieved due to the micro explosions from optical damage that can occur during the fabrication process. [32] The fabrication window (FW) is the power range between the polymerization/energy threshold and the burning threshold (Table 1). [33] Since a standard for the evaluation of 2PIs has not been established yet, many research groups deviate from the mentioned parameters and use other measurands, which are explained thoroughly for each case.
Table 1.
Summary of the essential photophysical and process parameters by which 2PIs are characterized.
|
Abbreviations |
Definition |
|---|---|
|
Eth |
Energy threshold: The minimal laser power which is required to ensure that fabricated structures survive the development stage |
|
Pth |
Polymerization threshold: The average laser power before the lens, below which the polymer line cannot be fabricated |
|
EDamage |
Burning threshold: The level of laser power at which good quality fabrication can no longer be achieved |
|
Rp |
Polymerization rates |
|
FW |
Fabrication window: Power range between the polymerization/energy threshold and the burning threshold |
|
σTPA |
Two‐photon cross‐section: Probability to undergo 2PA |
|
Φfl |
Fluorescence quantum yield |
For the evaluation of a 2PI, the parameters listed in Table 1 cannot be considered individually, but have to be discussed as an interaction of all of them. In addition, parameters like solubility, viscosity and the applied monomer mixtures influences the efficiency of a 2PI. In the following review, the 2PI known to literature will be described by means of their chemical structure, respectively grouped by their chromophore systems. With the development of 2PP fabricated hydrogels for tissue engineering the demand for water‐soluble photo initiators had increased in the last two decades. Therefore, the respective water‐soluble photo initiators are discussed in this review in separate paragraphs for each chromophore system.
2. D‐π‐A‐π‐D Chromophores
2.1. Benzophenones
One of the most prominent representatives of two‐photon initiators (2PI) of the D‐π‐A‐π‐D chromophores is bis(diethylamino)benzophenone (BDAB) known as Michlers’ ethyl ketone (Figure 1). It was used as a common UV initiator in photopolymerizations before Haq et al. discovered its potential to act as a 2PI. They successfully applied BDAB for the 2PP of the monomer EBPADMA (ethoxylated bisphenol A dimethacrylate). [34]
Figure 1.

Schematic representation of the structure of bis(diethylamino)benzophenone (BDAB).
BDAB exhibits a linear absorption at around 400 nm in ethanol and EBPADMA, while in ethyl acetate a maximum at 350 nm was detected. The influence of the solvent was also observed in the measurement of the extinction coefficient ϵ. While in ethanol ϵ exhibits 11,366 M−1 cm−1, it decreases with decreasing polarity. In EBPADMA ϵ was 4450 M−1 cm−1 and in ethyl acetate 65.4 mM−1 cm−1.
The σTPA values for BDAB were determined by using a modified version of the TPEF technique by Song et al. [35] with a concentration of 3×10⁻³ M. With a σTPA of 14 GM BADB exhibits the largest cross‐section in ethanol but only 1 GM when dissolved in the monomer EBPDMA.
In addition to the photophysical properties of BDAB, the parameters for polymerization were determined by using EBPADMA with 1 % BDAB. The parameters like line widths, were investigated as a function of laser power, writing speed, exposure time, and numerical aperture. [36] Figure 2A displays the width of structured lines with different laser powers (0.4, 1.0, and 1.3 mW) versus the writing speed. It should be noted that the line width becomes significantly narrower as the writing speed increases. The opposite effect is observed with the laser power versus the line width (Figure 2B). With increasing laser power, a significant increase in line width can be noticed and the lowest laser power determined for the fabrication of solid lines at a writing speed of 10 mm/min was 80 μW. This determined value was set as the limit value for EBPADMA. It could also be shown that the exposure time is a significant parameter influencing the line width. Even a slight increase of the exposure time leads to an enlargement of the voxel and, thus, to a broadening of the line, as shown in Figure 2C. To achieve high resolutions it is important to adjust the exposure time, as well as the intensity carefully. [36]
Figure 2.

Line width investigations of BDAB in EBPADMA depending on (A) writing speed/velocity, (B) laser power and (C) laser exposure time. [36] Adapted with permission from Ref. [36] © The Optical Society.
3D‐microstructures manufactured for tissue engineering are facing high requirements like stability and degradability. In addition, biocompatibility and cytotoxicity play decisive roles in the development of such scaffolds. Apart from the polymer used, it is also essential that the photo initiator has similar or even identical compatibilities since a considerable proportion remains in the structure. Ovsianikov et al. performed biological tests on PEG‐based structures to investigate the influence of BDAB on cell viability. [37] Structures were prepared with a BDAB concentration of 2 wt.% (Figure 3) and the viability of L929 fibroblasts grown on the obtained scaffolds was determined. It was shown that aging the samples in distilled water for six days led to a reduction of the water soluble toxic compounds to a level where no further cytotoxicity was determined.
Figure 3.

SEM image of fabricated PEG structure with 2 wt% BDAB. [37] Reproduced with the permission of Ref. [37]. Copyright 2011, Elsevier.
Besides polymerization of PEG and PEG copolymers, [38] BDAB has often been used for organic‐inorganic hybrid materials. These hybrid materials, some of which are commercially available, are based on methacryloxypropyl trimethoxysilanes (MAPTMS) and zirconium propoxide (ZPO).[ 13 , 39 , 40 , 41 ] In addition to the application of microstructures for tissue engineering, Xin et al. dealt with the fabrication of specially designed micro helices based on these hybrid materials produced with BDAB as 2PI (Figure 4) for effective drug delivery in the human body. [42]
Figure 4.
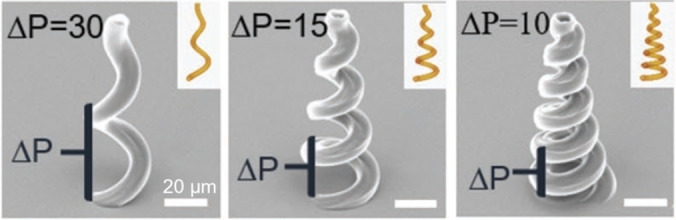
SEM images of microhelices fabricated with a zirconium−silicon hybrid sol‐gel material and 1 wt% BDAB. [42] Adapted with the permission of Ref. [42]. Copyright 2019, John Wiley and Sons.
Although BDAB is such a frequently used 2PI, no fabrication window (FW) is reported yet.
One structural variant of BDAB is the initiator B3BP produced by Liska et al. (Figure 5), which has an extended π‐system via bridging triple bonds. [43]
Figure 5.

Schematic representation of the structure of B3BP.
B3BP exhibits a linear absorption at 405 nm (DCM) and has a fluorescence quantum yield of 0.16 (with fluorescein and coumarin 515 as references). Compared to BDAB, B3BP shows an enormously increased two‐photon cross‐section of 336 GM (Z‐scan at 800 nm). Structuring tests with a 1 : 1 mixture of trimethylolpropane triacrylate (TTA) and ethoxylated (20/3)‐trimethylolpropane triacrylate (ETA) revealed a fabrication window (FW) of around 2.5 to 7 mW.
A series of photo initiators based on the benzophenone core structure were reported by Zhang et al. [44] Similar to B3BP the initiators have expanded π‐systems via a triple bond bridge to different heterocycles and aryl‐substituents (Figure 6).
Figure 6.

Schematic representation of the structures of the benzophenone derivatives.
All photo initiators show absorption maxima between 370 and 400 nm in dichloromethane, which slightly shift in solvents with altered polarity. The measured fluorescence quantum yields of the 2PIs were between 40 % and 50 %, except BT−PTAA−C6 which exhibits a quantum yield below 1 %. While BT−CAA−C6 , BT−CAA−Bn and BT−TPAA exhibit σTPA values in a range of 370 to 500 GM, BT−PTAA−C6 reveals a large σTPA value of 1907 GM (Table 2). Unfortunately, the authors do not report in which solvent the fluorescence quantum yields or the two‐photon cross‐sections were determined, and, for BT−DEA no photophysical data was reported. Polymerization tests were performed using TTA as monomer adding 10 μmol 2PI per gram of monomer. A laser power range of 5 to 50 mW was applied and writing speeds between 100 to 100,000 μm/s were tested. All photo initiators except BT−CAA−Bn revealed good initiation properties even at the highest writing speed. The fabrication windows at 100,000 μm/s for all 2PIs were nearly the same with exception of BT−DEA. BT−TPAA revealed the best overall initiation properties and further polymerization test in different monomers like PETA and bisphenol A epoxyacrylate (BAEA) were performed. These tests showed that by changing the monomer the fabrication window is greatly affected. Thus, in the case of PETA (FW=15 to 50 mW) and BAEA (FW=20 to 50 mW), the fabrication window could be slightly broadened, which shows that the type of monomer used influences the fabrication window.
Table 2.
Photophysical and polymerization data of the benzophenone based photo initiators BT−CAA−C6 to BT−DEA.
|
Compound |
λmax [nm][a] |
Φfl[%] |
σTPA [GM][b] |
FW [mW][c] |
|---|---|---|---|---|
|
BT−CAA−C6 |
375 |
51.70 |
446 |
30 to 50 |
|
BT−CAA−Bn |
370 |
38.52 |
501 |
– |
|
BT−TPAA |
393 |
40.29 |
372 |
30 to 50 |
|
BT−PTAA−C6 |
392 |
0.97 |
1907 |
30 to 50 |
|
BT−DEA |
|
|
|
40–50 |
[a] Measured in dichloromethane. [b] Two‐photon cross‐section were calculated using up‐conversion fluorimetry at 780 nm. [c] Fabrication windows at a writing speed of 100,000 μm/s with TTA as monomer.
2.2. Benzylidenacetones/‐cycloalkanes
The interest in benzylidene derivatives in the development of novel 2PIs for 2PP has grown steadily. One of the main reasons is that the desired D‐π‐A‐π‐D structure can be build up quite effectively by classical aldol condensation. No expensive catalysts are required, because the reaction already proceeds with the help of strong bases or acids. In the case of the benzylidene derivatives mentioned here, the reactions also proceed quickly, in high yields, and are chemoselective, as various references report. Scheme 1 shows the aldol condensation starting from N,N‐dimethylaminobenzaldehyde and acetone to yield BA‐1. [45]
Scheme 1.

Schematic representation of the aldol condensation of acetone and N,N‐dimethylaminobenzaldehyde with NaOH as base.
BA‐1 reveals a linear absorption maximum at 441 nm in chloroform (ϵ of 47000 M−1×cm−1). Two‐photon cross‐section Z‐scan measurements in MeOH and THF show different values. While in MeOH the σTPA is 349 GM, in the less polar THF 269 GM were determined. Structures were written at a 2PI concentration of 6.3×10⁻⁶ mol/g of polymer in a 1 : 1 monomer mixture of trimethylolpropane triacrylate and ethoxylated (20/3) trimethylolpropane triacrylat (writing speed was 50 μm/s). Stable structures without major defects could only be obtained within a range of laser intensity of about 8 to 11 mW. [45] The small FW of BA‐1 can be explained by possible cis‐trans isomerization, which is not blocked by additional substituents.
Lemercier et al. synthesized benzylidene acetones with π‐systems of different lengths (BA‐2 to BA‐5) and stilbene moieties (BA‐6 to BA‐8, Figure 7) and investigated the effects on the two‐photon absorption behavior. [46]
Figure 7.

Schematic representation of the structure of benzylidene acetone derivatives with extended π‐systems.
Figure 8 displays the linear UV/Vis absorption spectra of BA‐2 to BA‐5. By increasing the length of the π‐system the linear absorption maxima were shifted bathochromically (Table 3). In the case of BA‐4, the data obtained are consistent with other literature reports. [47] This behavior can be explained by the extended charge transfer, which is most evident in the largest molecule. The comparison of the absorption maximum to the chain length also reveals a trend of a saturation curve which indicates that a further extension of the chain would reach a certain absorption maximum threshold.
Figure 8.

UV spectrum of BA‐2 to BA‐5 in chloroform. [46] Adapted with permission from Ref. [46]. Copyright 2006, Royal Society of Chemistry.
Table 3.
Linear‐ and two‐photon absorption properties of BA1–BA‐8.
|
Molecule |
λabs [nm] |
λmax TPA [nm] |
σmax TPA [GM] |
|---|---|---|---|
|
BA‐2 |
456 |
800 |
250 |
|
BA‐3 |
486 |
900 |
325 |
|
BA‐4 |
509 |
950 |
200 |
|
BA‐5 |
540 |
– |
– |
|
BA‐6 |
466 |
900 |
200 |
|
BA‐8 |
503 |
– |
– |
The situation is similar for the stilbene based derivatives (Figure 9). There is also a bathochromic shift, which is more prominent for BA‐8 due to the more pronounced donor properties of the azo bridges. Although the chain length and the introduction of the stilbene groups have a clear influence on the absorption, the influence on the two‐photon cross‐section is only slight noticeable (Table 3).
Figure 9.

UV‐Spectra of BA‐6 and BA‐8 in chloroform. [46] Adapted with permission from Ref. [46]. Copyright 2006, Royal Society of Chemistry.
BA‐5 and BA‐8 could not be measured due to their low fluorescence, which is necessary for the up‐conversion fluorescence measurement. Unfortunately, no data for BA‐7 were reported. The investigations show that the compounds BA‐2 to BA‐8 do receive a two‐photon excitation, but no structuring tests were performed to determine the fabrication windows.
As mentioned above, possible cis‐trans isomerization processes are one reason for a reduced performance of a photo initiator. By using other central ketones such as cyclopentanone, cyclohexanone, or substituted variants, photo initiators could be produced which have much better processability. Liska et al. met this challenge by producing photo initiators with differently sized cycloalkane ketones (including BA‐1). [48] These are presented in Figure 10.
Figure 10.

Schematic representation of the structure of various benzylidene photo initiators with different ring sizes.
The change of the central acceptor ketone to cyclopentanone ketones leads to a bathochromic shift of the linear absorption maxima of the 2PIs BcP‐1 and BcP‐2 compared to BA‐1. Interestingly the 2PIs with a cyclohexanone central acceptor BcH‐1 and BcH‐2 reveal a hypsochromic shift of the linear absorption maxima (Table 4). Although the structure of BcH‐2 shows a methyl group in the 4‐position of the cyclohexanone ring, compared to BcH‐1 the two 2PIs share the same linear absorption behavior. While the change in fluorescence quantum yield between BA‐1 and the cyclopentanone 2PIs only changes slightly, the fluorescence quantum yield for the cyclohexanone 2PIs is significantly decreased. The influence of the ring size on the two‐photon cross‐section differs from initiator to initiator. While the cyclopentanone derivative of BA‐1, BcP‐1, reveal an increase from 349 GM to 466 GM, but the σTPA value of BcP‐2 is decreased. The increase for BcP‐1 can be explained by the enhanced stiffness and the higher degree of conjugation, while the large n‐butyl groups of BcP‐2 leads to a distortion of the molecule and, thus, to a deformation of the cyclopentanone ring. This non‐planar nature of the ring could negatively influence the conjugation and thus weaken the 2PA. By replacing the cyclopentanone ring with the lager cyclohexanone in BcH‐1 the σTPA value increases only slightly, however the introduction of a methyl group in the 4‐position, as in BcH‐2, decreases the σTPA drastically. Thus, Liksa et al. could show that not only the ring size of the central cycloalkane ketone but also the substitution of the ring has a decisive role on the TPA properties of a photo initiator. To determine the initiation efficiency of the initiators, whole 3D structures were abdicated under different laser intensities and different writing speeds instead of line tests. For this purpose, woodpile structures (lateral dimming: 50×50 μm, 5 μm hatch distance, 0.7 μm layer distance), made of the same polymer mixture as used with BA‐1, were written. With the exception of BcH‐2, which was tested with 0.2 wt%, all structures were used with a molar 2PI concentration of 6.3×10⁻⁶ mol 2PI/g resin. To illustrate the initiator efficiency, the results with different laser intensities (1 to 30 mW) at a writing speed of 50 μm/s are described. As mentioned above, BA‐1 has a rather small fabrication window. The change to the cyclopentanone moiety to BcP‐1 led to a drastic reduction of the solubility in the monomer, which could not be improved by the addition of different organic solvents and thus was not suitable for structuring. By exchanging the methyl substituents with n‐butyl ones the solubility could be significantly increased and thus BcP‐2 revealed a slightly wider processing window than BA‐1, allowing the production of structures with good stability within a laser intensity of about 9 to 14 mW. This slight increase can be attributed to the higher stiffness of the ring, which limits the possible cis/trans isomerization processes of the double bonds. Similar to BcP‐1, BcH‐1 also shows problems with solubility, so that an exact evaluation of the initiator properties was not possible. However, the introduction of the methyl group significantly increased the solubility. Although BcH‐2 has the smallest σTPA of the mentioned initiators (191 GM) it reveals a wide processing window (approx. 10 to 25 mW). Remarkable about BcH‐2, besides the lowest TPA, is that its fluorescence quantum yield is 5 to 10 times lower compared to that of the other initiators. Although σTPA plays a certain role in initiating efficiency, it is not the decisive factor. Low fluorescence quantum yields are essential for efficient photo initiators because this leads to lower radiation deactivations and, thus, to a higher population of the active state for initiating polymerization. This observation has also been made by other research groups. [49] In addition to the wide processing window, BcH‐2 also showed an extremely fast processability. A model F1 racing car (285×130×50 μm3) was structured with a 0.2 wt% of BcH‐2 solution within 4 min, which corresponded to a writing speed of about 80 mm/s. [48] Recent reports revealed that BcH‐2 has been used for the fabrication of large complex 3D structures up to a volume of 292 mm3, so called buckyballs, for cell cultivation with a writing speed of 1000 mm/s (Figure 11).[ 50 , 51 ]
Table 4.
Photophysical and polymerization data of the photo initiators BA‐1 to BcH‐2.
|
Compound |
λmax [nm][a] |
Φfl [a] |
σTPA [GM] |
FW [mW] |
|---|---|---|---|---|
|
BA‐1 |
441 |
0.15 |
349 |
∼8 to 11 |
|
BcP‐1 |
466 |
0.14 |
466 |
|
|
BcP‐2 |
481 |
0.20 |
327 |
∼9 to 13 |
|
BcH‐1 |
432 |
0.0095 |
352 |
|
|
BcH‐2 |
432 |
0.0095 |
191 |
∼10 to 25 |
[a] Measured in dichloromethane.
Figure 11.

Fabricated scaffolds using BcH‐2. (a) Sample holder with the polymerized structure embedded in the resin. (b) Top view and (c) side view of the fabricated buckyball scaffold. (d) SEM images of the scaffold at serval magnifications. [50] Republish with permission of Ref. [50]. Copyright 2020, IOP Publishing.
Based on these results, several other groups investigated the influence of the ring size on the initiator performance. The 2PIs displayed in Figure 12, possess a larger π‐system with more aryl moieties. Also the influence of triple bonds compared to double bonds has been investigated. [33]
Figure 12.

Schematic representation of the structure of 2PI with different ring sizes of the central ketone and various substituents reported by Nazir et al.
The linear absorption measurements were performed in toluene and benzonitrile. Although structurally very similar, the spectrum for BcB‐2 reveals a bathochromic shift compared to BcB‐1, in toluene as well as in benzonitrile. The installation of the stilbene unit in the different ketones shows the clear influence of the central ketone. While compared to BcB‐1/2 a small hypsochromic shift can be seen at BcB‐3, a very clear blue shift from small to large ring size is observed (BcB‐3‐>BcP‐3‐>BcH‐3). The photophysical data are summarized in Table 5. Looking at the values for BcP‐3 and BcP‐4 it is visible that a hypsochromic shift occurs due to the influence of the triple bond, because they are less polarizable in contrast to double bonds a reduction of the HOMO ‐ LUMO gap is resulting. [52] The influence of the ring size can also be seen in the fluorescence quantum yields. The yields in toluene decrease with increasing ring size (Table 5). The increasing ring size gives the molecules a higher flexibility, which promotes the non‐radiative relaxation of electronically excited states. It should also be noted that for BcB‐3, BcP‐3, BcH‐3 and BcB‐4, fluorescence quantum yields decrease dramatically to less than 1 % as the polarity of the solvent increases. These results indicate that an almost complete charge separation takes place for the 2PIs mentioned.
Table 5.
Photophysical properties of BcB‐1 to BcP‐4 in toluene and benzonitrile.
|
Compound |
Solvent |
λabs [nm] |
λem [nm] |
Δν [cm−1] |
Φfl |
|---|---|---|---|---|---|
|
BcB‐1 |
toluene |
476 |
530 |
2100 |
0.16 |
|
benzonitrile |
488 |
591 |
3600 |
0.36 |
|
|
BcB‐2 |
toluene |
477 |
533 |
2200 |
0.19 |
|
benzonitrile |
503 |
591 |
3100 |
0.29 |
|
|
BcB‐3 |
toluene |
476 |
583 |
4300 |
0.74 |
|
benzonitrile |
488 |
705 |
6300 |
<0.01 |
|
|
BcP‐3 |
toluene |
466 |
556 |
3500 |
0.72 |
|
benzonitrile |
487 |
764 |
7400 |
<0.01 |
|
|
BcH‐3 |
toluene |
444 |
540 |
4000 |
0.40 |
|
benzonitrile |
460 |
742 |
8300 |
<0.01 |
|
|
BcP‐4 |
toluene |
440 |
536 |
4100 |
0.14 |
|
benzonitrile |
458 |
793 |
9200 |
<0.01 |
The σTPA values range from 50 to 370 GM and are thus many times larger compared to the frequently used BDAB (Table 6). Already the introduction of a longer alkyl chain leads to an increase, in this case even a doubling of the σTPA‐ value. [43] Compared to BcP‐1, the cyclobutanone derivative BcB‐1 reveals a much lower value, but the two values were determined in different solvents, making comparability difficult. Compared to the studies with the 2PIs from Liska et al. (Figure 10), the results with a different π‐system show another trend. Here the σTPA value increases with increasing ring size instead of decreasing. BcP‐4 with cyclopentanone as central ketone shows the highest value, which can be explained by blocking of the cis/trans isomerization in the stilbene unit with the triple bond. To determine the fabrication windows, the compounds and BDAB were tested at 1 wt% each with the hybrid material ZPO/MAPTMS (Figure 13). [40]
Table 6.
σTPA Values of the compounds BcB‐1 to BcP‐4 measured by Z‐scan at 800 nm.
|
Compound |
Solvent |
σTPA [GM] |
Conc. [mol L−1] |
|---|---|---|---|
|
BcB‐1 |
CH2Cl2 |
70 |
0.05 |
|
BcB‐2 |
CH2Cl2 |
140 |
0.01 |
|
BcB‐3 |
CH2Cl2 |
50 |
0.01 |
|
BcP‐3 |
CH2Cl2 |
130 |
0.01 |
|
BcH‐3 |
CH2Cl2 |
200 |
0.01 |
|
BcP‐4 |
CH2Cl2 |
370 |
0.01 |
|
BDAB |
1‐propanol |
7 |
7 |
Figure 13.

Fabrication windows of BcB‐1 to BcP‐4. The low‐power end shows polymerization thresholds, whereas the burning threshold is represented in the high‐power end of the scale (red). The green area represents the ideal laser intensities for the fabrication of stable structures. [33] Adapted with permission of Ref. [33]. Copyright 2015, John Wiley and Sons.
The compounds BcP‐3 and BcP‐4 display the widest fabrication windows compared to all other 2PIs. It can be assumed that an enlargement of the π‐system has a positive effect on the manufacturing range. The advantage of the broad fabrication window of BcP‐4 is shown by a series of fabricated cubes where different laser intensities were used at constant writing speed (Figure 14).
Figure 14.

3D dice structures constructed applying different laser powers, with BcP‐4. [33] Adapted with permission of Ref. [33]. Copyright 2015, John Wiley and Sons.
Similar investigations were also carried out for the carbazole derivatives of cycloalkane ketones. [53] For this purpose, carbazole compounds were modified with 2‐(ethyl)hexyl chain and reacted with cyclobutanone, pentanone and 4‐methylhexanone to form the respective photo initiators (Figure 15).
Figure 15.

Schematic representation of the chemical structures of carbazole benzylidene derivatives.
As above also for carbazole benzylidene derivatives, a trend can be seen between the absorption behavior and the ring size. For example, a hypsochromic shift in the UV spectrum (chloroform) from cyclobutanone derivative with 442 nm (BcB‐4) to 4‐methyl‐cyclohexanone derivative with 418 nm (BcH‐4) is observed. The fluorescence emission spectra reveal different values for each compound (Table 7).
Table 7.
Photophysical data of the carbazole benzylidene cycloketones.
|
Compound |
λmax(<400 nm) [nm] |
λem [nm] |
Stokes shift [cm−1] |
ϵmax [104 M−1 cm−1] |
σTPA [GM] |
|---|---|---|---|---|---|
|
BcB‐4 |
442 |
533 |
3862 |
5.08 |
357 |
|
BcP‐5 |
438 |
515 |
3413 |
5.16 |
377 |
|
BcH‐4 |
418 |
560 |
6066 |
5.20 |
340 |
Concerning two‐photon cross‐sections the cyclobutanone BcB‐4 shows a value of 357 GM, when the ring size is increased, the σTPA rises to the highest measured value of 377 GM (BcP‐5). Similar to the results of Liska et al., [48] a further enlargement of the ring (BcH‐4) lowers the σTPA value, in this case to 340 GM. To determine the fabrication window, the respective photo initiators were tested in a concentration of 1.3×10⁻⁶ mol/g resin in a 1 : 1 mixture of trimethylolpropane triacrylate (TMPTA) and ethoxylated trimethylolpropane triacrylate (TMP3EOTA). The 2PI was excited at a wavelength of 780 nm and structures were written at a speed of 750 μm/s. The initiators BcB‐4 and BcH‐4 show almost the same FW despite different GM values (approx. 12 to 28 mW for BcB‐4 and approx. 12 to 27 mW for BcH‐4). In comparison, BcP‐5 reveals a quite extended FW of 10 to 29 mW. In addition to the structuring tests, BcP‐5 was used to write smaller and more complex structures such as a 3D microstructure of the Great Wall of China (Figure 16).
Figure 16.

SEM micrograph of the Great Wall of China fabricated with BcP‐5. [53] Adapted with permission of Ref. [53]. Copyright 2019, SPST.
Coumarin derivatives have proven to represent promising compounds in recent years. Dyes on coumarin bases are well‐known as highly efficient photosensitizers and are used in the field of UV curing. When excited by light, they are able to excite other co‐initiators by electron transfer or to initiate polymerizations themselves.[ 54 , 55 , 56 , 57 , 58 ] Xue et al. and Nazir et al. investigated asymmetric and symmetric coumarin derivatives for their linear and two‐photon absorption behavior.[ 32 , 59 , 60 ] In addition, compounds with different bridging positions were prepared to investigate their properties in more detail. [60] The obtained cumarinylated cycloketones are shown in Figure 17.
Figure 17.

Schematic representation of the structures of the coumarin based benzylidene cycloketones.
Comparing the linear absorption spectra of the coumarin containing 2PIs a bathochromic shift occurs for the symmetric structures (BcP‐7, BcP‐9, BcH‐5) compared to the asymmetric ones (BcP‐6 and BcP‐8). In case of the two‐photon absorption the σTPA values differ significantly from each other. While the discrepancy between the asymmetric (BcP‐6) and the symmetric (BcP‐7) PI is 90 GM, the change of the bridging position (BcP‐6 vs. BcP‐8) reveals a greater difference (Table 8). A much larger difference is observed for the cyclopentanon 2PI BcP‐9 and 4‐methy‐cyclohexanon 2PI BcH‐5, in contrast to the results from Liska et al. [45] the change of the central acceptor to the larger 4‐methyl‐cyclohexanon ring let to a drastic increase of the σTPA value.
Table 8.
Photophysical and polymerization data of the photo initiators BcP‐6 to BcH‐5.
|
Compound |
λmax [nm] |
Φfl |
σTPA [GM] |
FW [mW] |
Eth [μW] |
|---|---|---|---|---|---|
|
BcP‐6 |
500[b] |
0.09 |
300[d] |
|
99 |
|
BcP‐7 |
521[b] |
0.15 |
390[d] |
1.05 to 3.39[g] |
|
|
BcP‐8 |
471[b] |
0.05 |
199[d] |
|
198 |
|
BcP‐9 |
605[a] |
0.313 |
60.0 ±1.2[c] |
∼10 to 46 |
|
|
BcH‐5 |
582[a] |
0.078 |
401.0 ±8.0[c] |
∼10 to 44 |
[a] Measured in dichloromethane, [b] measured in chloroform, [c] measured via Z‐scan technique at 800 nm, [d] measured at 780 nm, [e] measured with 0.1 wt% of the 2PI, [f] maximum of the σTPA measurement and [g] measured with 0.1 wt% 2PI.
2PP tests with 0.4 wt% BcP‐6 and BcP‐8 showed that the threshold energy Eth is 99 and 198 μW respectively (Table 8). Normally, initiator concentrations of 1 to 2 wt% are common for 2PP, but the low Eth of BcP‐6 and BcP‐8 allows a significant reduction of the concentration and, therefore, the amount of remaining initiator in the later structure. Thus, it was possible to write a complex microstructure (Figure 18) even with this low concentration. Although the FW of BcP‐7 is in the range of 1.05 to 3.39 mW, it has a higher Eth, so polymerizations could be carried out even with a small concentration of 0.1 wt%. Polymerizations were also possible with even lower concentrations but the laser power had to be increased to trigger them. Despite the high σTPA value and the low fluorescence quantum yield, BcH‐5 reveals a slightly smaller fabrication window compared to BcP‐9. While BcP‐9 trigger polymerization between 10 to 47 mW, structures made with BcH‐5 show damage and malformations above 44 mW. Both compounds were also tested for their biocompatibility. Preosteoblastic MC3T3‐E1 cells were used, which were applied to films of PLA (polylactic acid) doped with different initiators and incubated. The results show for both initiators a viability of the cells up to 100 % after seven days incubation, which suggests that the compounds are biocompatible and suitable for applications in tissue engineering.
Figure 18.

3D model structure of a giraffe fabricated with BcP‐6 at 163 μW laser power and 110 μm/s writing speed. [60] Reproduced with permission from Ref. [60]. Copyright 2010, American Chemical Society.
The photo initiator BcP‐10 (Figure 19) with its dimethylamino substituted naphthalene residues also has an extended π‐system similar to the coumarin benzylidenes. [61] The linear absorption in dichloromethane shows two maxima at 362 nm and 502 nm. In comparison to BcP‐1 (466 nm, CH2Cl2) a clear bathochromic shift is observed. Furthermore, BcP‐10 reveals a very high Stokes shift of 4700 cm−1, which is caused by the geometric change from non‐planar in ground state to planar in the excited state. It is interesting to note that BcP‐10 has one of the lowest fluorescence quantum yields (0.11 %) among the benzylidene cyclopentanones. The two‐photon absorption spectrum shows the maximum at 725 nm and the σTPA value was determined to be 600 GM. This value is significantly larger compared to the 466 GM of BcP‐1 (Figure 10), which can be explained by the different geometry of the molecule as well as the higher number of π‐electrons. Polymerization tests were performed with an organic‐inorganic silicate mixed with zirconium [40] and show for BcP‐10 a fabrication window of about 7 to 48 mW at a constant speed of 2 mm/s. [61] Since many photo initiators have problems with their solubility in monomer solutions, Poocza et al. developed the BA740 photo initiator for the polymerization of the lactide‐caprolactone‐methacrylate (LCM) [62] system, keeping the maxim “like dissolves like”. This was achieved by modifying the terminal hydroxyethylamio groups with acetic anhydride. The ester groups introduced in this way acted as solubility mediators for the LCM system. The σTPA value of BA740 is 177 GM (805 nm, CHCl3) and is smaller than that of BcP‐1 for this system (315 GM). However, the fluorescence quantum yield for BA740 is 6.4 %, which is significantly lower compared to BcP‐1 with 12.5 %. For the structuring tests, so‐called SchwarzP cells were fabricated, as this structure is a potential candidate for porous biomimetic scaffolds. Figure 20 displays the results of the writing tests at different writing speeds and laser powers. Although a higher laser power is required compared to other polymerizations and initiator mixtures, BA740 reveals a significantly wide fabrication window of 50 to 180 mW at a constant writing speed of 3 mm/s and low 2PI concentration of 0.2 wt%. Figure 20 shows that structures can also be written at higher speeds, although the fabrication window narrows.
Figure 19.

Schematic representation of the structures of BcP‐10, PBDA, BA740 and BDEA.
Figure 20.

Structuring tests with BA740 (0.2 %) in LCM. Representative SEM micrograph (plant view of SchwarzP unit cells with 250 μm). The colored circles represent the obtained results in the heat map. Dark red: Bulk polymerization, loss of structure. Red: Bulk polymerization is sealing the pores. Yellow: Most precise 3D SchwarzP structure, best TPP writing conditions. Blue: Polymerized structures are not stable/load bearing. With x: Not a single trace of polymerization, no TPP writing possible. [62] Reproduced with permission from Ref. [62]. Copyright 2017, John Wiley and Sons.
BA740 also was used in the fabrication of a newly introduced macromonomer based on poly(2‐oxazoline)s PEtOx‐DA for 2PP. In combination with the photo initiator BA740 and the new macromonomer several investigations were performed and showed that highly precise 3D‐microstructures in from of spiderwebs could be fabricated.[ 8 , 63 ]
Huang et al. took advantage of the easy chemical modifiability of the terminal amino residues, similar to BA740. The authors equipped the photo initiator PBDA with acryloyl groups, aiming to bind it to the produced gel during polymerization and thus limit its release or mobility. [64] For evaluation purposes PBDA was compared with BDEA, a compound which exhibits a large σTPA value of 465 GM. [49] The linear absorption spectrum of PBDA shows a bathochromic shift in the maximum at 473.5 nm compared to BDEA (Table 9). The fluorescence quantum yield of PBDA is 0.108 and therefore lower than the quantum yield of BDEA with 0.141. The Z‐scan in DMF gave an σTPA value of 410 GM at 820 nm, which is lower than that of BDEA. Structuring tests with different mixtures of PBDA/BDEA and the monomers trimethylolpropane ethoxylate triacrylate (ETPTA) and polyethylenglycol diacrylate (PEG‐DA 400) resulted in a fabrication window of 0.13 to 9.31 mW for PBDA and 0.09 to 5.84 mW for BDEA. Figure 21 shows a gear structure written with PBDA.
Table 9.
Photophysical and polymerization data of the photo initiators BcP‐6 to BcH‐5.
|
Compound |
λmax [nm] |
Φfl |
σTPA [GM] |
FW [mW] |
|---|---|---|---|---|
|
BcP‐10 |
362/502[a] |
0.011 |
600[d] |
7–48 [g] |
|
BA740 |
– |
0.064 |
177[e] |
50–180[h] |
|
PBDA |
473.5[c] |
0.108 |
410[f] |
0.13–9.31 |
|
BDEA |
487[c] |
0.141 |
465[f] |
0.09–5.84 |
[a] Measured in dichloromethane, [b] measured in chloroform, [c] measured in DMSO, [d] measured via Z‐scan at 725 nm, [e] measured via Z‐scan, [f] measured via TPEF in range of 750 to 880 nm, [g] FW at a writing speed of 2 mm/s and [h] FW at a writing speed of 3 mm/s.
Figure 21.

Gear structure fabricated with PBDA and PEG‐DA 400 as monomer. [64] Reproduced with permission from Ref. [64]. Copyright 2019, Royal Society of Chemistry.
The migration of PBDA and BEDA was investigated by inserting polymer structures which were prepared and then crushed into DMSO. The samples were soaked for seven days and the absorbance of the extracts were measured at 480 nm. For PBDA the absorbance was severely lower compared to BDEA, which indicates that PBDA is mostly linked to the polymer backbone. Biocompatibility tests with L929 cells on polymeric tablets revealed a reduced viability of the cells grown on the structures produced with BDEA (∼85 %) after 48 h compared to the control group. The viability of the cells seeded on structures written with PBDA remained unchanged at 100 %, indicating a significantly lower cytotoxicity due to the covalent binding of PBDA to the polymer scaffold.
2.3. Alkinone
As mentioned in the previous chapters (Chapters 2.1. & 2.2.), cis/trans isomerizations of double bonds are a disturbing process and the performance of the initiator might be impaired. Inspired by the good properties of 1,5‐diphenylpenta‐1,4‐diyn‐3‐one (DPD) in single photon photo polymerization, various derivatives of DPD have been developed.[ 65 , 66 , 67 ] Several compounds with auxochromic groups have been prepared and investigated (Figure 22).
Figure 22.

Schematic representation of the structures of alkinone based 2PIs.
To improve the properties of DPD in two photon polymerization, donor groups were introduced at the terminal phenyl groups. As shown in Figure 22, the focus was mainly on amino derivatives, as these groups possesses a high donor strength.
With increasing donor property of the groups (OMe<SMe<NMe2<NBu2<NPh2) the linear absorption maxima is bathochromically shifted (Table 10). The shifts are particularly strong for the amino‐derivatives, as these have a strong influence on the system. The fluorescence quantum yields are very small for all compounds. Only P3 K and O−DPD show very weak fluorescence quantum yields, for S−DPD no values are reported regarding Φfl and σTPA. The two photon cross‐sections reveal a clear trend, which was also observed for the linear absorptions. The σTPA value increases with increasing donor strength. DPD itself showed no measurable absorption in the two‐photon spectrum and O−DPD a very low value. It is interesting to see that P3 K with 256 GM has a higher value than B3 K. Although the donor strength of diarylamino groups is smaller, their increased number of π‐electrons can lead to an increase in the σTPA value. [26] Heller et al. were the first to test the 2PIs O−DPD, S−DPD and N−DPD for their properties in 2PP. A 1 : 1 mixture of Genomer 1330 (trimethylolpropane triacrylate) and Sartomer 415 (ethoxylated trimethylolpropane triacrylate) as monomer solution was used and polymerized at a constant speed of 1 mm/min (Figure 23).
Table 10.
|
Compound |
λMAX [nm] (MeCN) |
λEM [nm] |
Φfl |
σTPA [GM] |
|---|---|---|---|---|
|
DPD |
322 |
|
0.00 |
|
|
O−DPD |
352 |
526 |
0.02 |
<10 |
|
S−DPD |
375 |
|
|
|
|
N−DPD |
435 |
|
0.00 |
165 |
|
P3 K |
438 |
650 |
8×10⁻⁴ |
256 |
|
B3 K |
449 |
|
0.00 |
238 |
Figure 23.
Fabrication tests with a) O−DPD, b) S−DPD and c) N−DPD at 0.025 wt%. [67] Adapted with permission from Ref. [67]. Copyright 2007, John Wiley and Sons.
The fabrication of complex microstructures with N−DPD was performed at different laser intensities and resulted in stable structures at any laser intensity. In comparison the fabrication of stable and precise structures with O−DPD was only possible at higher laser intensities. Structures fabricated with S−DPD show clear structure defects. Pucher et al. have additionally investigated the influence of longer side chains (B3 K) and phenyl groups (P3 K) on the fabrication properties. [45] The authors used the same monomer system and were able to define the fabrication windows for the respective 2PIs more precisely. [45] S−DPD was not examined more closely in this process. The resulting fabrication windows to obtain well‐defined structures are listed in Table 11.
Table 11.
Fabrication windows of the alkinone based 2PIs.
|
Compound |
Laser intensity [μW] |
|---|---|
|
DPD [a] |
∼5 to 15 |
|
O−DPD [b] |
∼40 to 65 |
|
N−DPD [b] |
∼12.5 to 35 |
|
P3 K [b] |
∼8 to 35 |
|
B3 K [b] |
∼5 to 31 |
[a] Polymerization at 600 nm; [b] Polymerization at 800 nm.
It is evident that all amino derivatives require significantly lower laser intensities and have a broader FW. A complex 3D model of a dragonfly was fabricated using B3 K as initiator (Figure 24). Thereby the overhanging wings of the dragonfly were structured without losing structural integrity.
Figure 24.

Dragonfly model fabricated by 2PP with B3 K as 2PI. [45] Reproduced with permission from Ref. [45]. Copyright 2009, American Chemical Society.
2.4. Anthraquinone and fluorenone
Anthraquinones and fluorenone derivatives are known as dyes for a very long time. Their acceptor properties make them interesting for many different applications, for example as dyes in solar cells.[ 68 , 69 ] Furthermore, anthraquinone derivatives are well established in single photon photopolymerization. [70] Two‐photon fluorescence dyes with an anthraquinone unit are also known to literature.[ 71 , 72 , 73 , 74 , 75 , 76 ] Their good chemical modifiability makes them interesting candidates as photo initiators in two‐photon polymerization.
The two compounds AQ−N and AQ−O (Figure 25) represent two stilbene substituted variants of anthraquinones. [77] The effect of the different donor strength is clearly visible in the linear absorption of the two compounds. AQ−N with 492 nm reveal a clear red shift compared to AQ−O (424 nm). The determined fluorescence quantum yields show a lower yield for AQ−N (Φfl=0.018) compared to AQ−O (Φfl=0.043), can be explained by charge‐transfer bimolecular quenching.
Figure 25.

Schematic representation of the chemical structures of AQ−N and AQ−O.
AQ−N has an enormous value of 1635 GM at 800 nm, a very large value compared to other initiators, while the σTPA value of AQ−O decreases to 995 GM. Fabrication tests with 0.2 wt% AQ−N and AQ−O revealed a lower polymerization limit of 3.67 mW and 8.03 mW, respectively, at a constant speed of 10 μm/s. Line tests were carried out to determine the processability. The line sizes were examined at different laser intensities and three different writing speeds (10, 30 and 50 μm s−1) (Figure 26). As already observed in other studies, the line width decreases with increasing speed due to the shortened exposure time. Also, the line propagation due to increasing laser intensities has been observed several times. The comparison between AQ−N and AQ−O at a laser intensity of 8.03 mW (lower polymerization limit for AQ−O) shows that with AQ−N at this power, the lines produced are wider than with AQ−O. Those results indicate that AQ−N generates more radicals at the given intensities compared to AQ−O, what can be attributed to its higher σTPA value as well as lower fluorescence quantum yield.
Figure 26.

Line width dependence versus the average laser power for AQ−N (a) and AQ−O (b). [77] Adapted with permission from Ref. [77]. Copyright 2007, Elsevier.
Figure 27 displays the structures of B3AN and BB3AN. [43] In contrast to AQ−N and AQ−O the substitution pattern is different (positions 2 and 6 modified) and instead of a double bond triple bonds were introduced. The terminal amino groups carry n‐butyl or a branched ethyl pentyl residue instead of methyl groups. The linear absorption spectrum of B3AN in dichloromethane exhibits a maximum at 485 nm. Although B3AN shows no visible fluorescence in dichloromethane, the fluorescence increases with increasing polarity of the solvent. Unfortunately, no linear measurements were reported on BB3AN. The measured two‐photon cross‐sections show a value of 235 GM for B3AN and 250 GM for BB3AN. In comparison to AQ−N, these values are significantly lower since the triple bond should avoid unwanted cis/trans isomerization and therefore increase the two‐photon cross‐section. The lower σTPA may also be due to the different substitution pattern of B3AN and BB3AN. Structuring tests were performed with a 1 : 1 mixture of TTA and ETA. It turned out that B3AN was not soluble in the monomer solution and, therefore, no structuring tests were possible. The introduction of branched alkyl chains resulting in BB3AN, revealed a slightly increased solubility, but very high laser intensities were necessary for the polymerization. Suitable structures could be fabricated with BB3AN only in a very narrow fabrication window of 22 to 24 mW.
Figure 27.

Schematic representation of the structure of B3AN and BB3AN.
Related to B3AN and BB3AN, the fluorenones B3FL, BB3FL and 3,6‐B3FL are designed in a similar way (Figure 28). Although equipped with the same substituents, they differ in their symmetry. While the anthraquinones are inversion‐symmetrical, the fluorenones are mirror‐symmetrical. In addition, the fluorenones are substituted in different positions. While B3FL and BB3FL carry the substituents in positions 2 and 7, 3,6‐B3FL is modified in positions 3 and 6. The linear absorption spectrum of B3FL shows a maximum at 405 nm and the fluorescence quantum yield is 0.7×10⁻³. The maximum of 3,6‐B3FL is bathochromically shifted at 460 nm, the measured fluorescence quantum yield is 12×10−3. As with the anthraquinones, no absorption or fluorescence measurements were performed for BB3FL. The σTPA values, measured at 800 nm, reveal the highest value for B3FL with 440 GM. By changing to the branched alkyl chains (BB3FL) the σTPA value decreases to 385 GM. 3,6‐B3FL shows a much smaller σTPA value of 308 GM. This is in particular interesting because 3,6‐B3FL should facilitate the intramolecular electron transfer process by its substitution. A possible explanation for the lower σTPA value can be the redshift, which reduces absorption at the given wavelength. For the fabrication tests, the same monomer mixture was used as for the anthraquinone B3AN. In contrast, all fluorenones could be dissolved directly and showed a wider fabrication window. The results are summarized in Table 12.
Figure 28.

Schematic representation of the structures of the fluorenones B3Fl, BB3Fl and 3,6‐B3FL.
Table 12.
Experimental data of the anthraquinone and fluorenon 2PIs.
|
Compound |
λMax [nm] |
Φfl[a] |
σTPA [GM][b] |
FW [mW] |
|---|---|---|---|---|
|
B3AN |
485 |
– |
235 |
– |
|
BB3AN |
– |
– |
250 |
22 to 24 |
|
B3FL |
405 |
0.7×10⁻³ |
440 |
6 to 18 |
|
BB3FL |
– |
|
385 |
4 to 11 |
|
3,6‐B3FL |
460 |
12×10−3 |
308 |
7 to 17 |
[a] values measured in CH2Cl2. [b] Measured at 800 nm.
Figure 29 displays the great manufacturing properties of B3FL. Several complex 3D structures could be fabricated with an ETA/TTA 1 : 1 monomer mixture, such as a tarantula or the St. Stephens Cathedral.
Figure 29.

3D structures: (a) St. Stephen's Cathedral, (b) Tarantula Spider, (c) detail of the London Tower Bridge and (d) detailed view of the woodpile structure. [43] Reproduced with permission from Ref. [43]. Copyright, John Wiley and Sons.
The photo initiators FT−PTAA‐6 and FT−CAA−C6 possess the same core structure as the other fluorenones (Figure 30). Instead of an aminophenyl substituent, Zhang et al. incorporated modified carbazole (FT−CAA−C6) or phenothiazine residues (FT−PTAA−C6). Both substituents were modified with an n‐hexyl chain. [78] Carbazoles and phenothiazines are well‐known donor systems of electron‐rich heteroatoms (nitrogen and sulfur) and because of their optical properties are often found in areas such as organic light‐emitting diodes (OLEDs),[ 79 , 80 , 81 , 82 ] dye‐sensitized solar cells (DSSCs)[ 83 , 84 , 85 , 86 ] and polymeric optical fibers (POFs). [87]
Figure 30.

Schematic representation of the structures of carbazole and phenothiazine modified fluorenone 2PIs.
Both initiators show a weak absorption above 400 nm, whereas the absorption increases strongly below it. The maxima are very close to each other, 295 nm for FT−PTAA−C6 and 300 nm for FT−CAA−C6. The fluorescence quantum yields, however, are very different. For FT−CAA−C6 a yield of 1.65 % could be obtained, for FT−PTAA−C6 0.01 %. The two‐photon‐induced exited fluorescence (TPEF) method was used to determine the TPA value. [28] As a result, FT−PTAA−C6 could not be measured due to the almost non‐existent fluorescence. For FT−CAA−C6 a value of 527 GM at 810 nm could be obtained. Successful 2PP with a 1 : 1 mixture of TTA and ETA were performed with FT−CAA−C6 as initiator, but no fabrication window was reported.
2.5. Thioxanthone
Thioxanthones are well‐known in the literature for their use as single photon initiators in photo polymerizations.[ 88 , 89 ] The electron‐poor structure makes thioxanthone (TX‐1) an interesting acceptor system, which can lead to strong two photon absorbing compounds by introducing different donor groups. By introduction of different amino donors and expanding the π‐system, Nazir et al. were able to obtain various new photo initiators (Figure 31). [90]
Figure 31.

Schematic representation of the structures of the 2PIs TX‐1 to TX‐6 with a thioxanthone core.
The unsubstituted thioxantone TX‐1 itself shows little use in 2PP due to its small σTPA value (3 ±1 GM at 710 nm). [91] The performed modifications clearly demonstrates that the introduction of donor groups has a considerable influence on the two‐photon absorption of the system. Table 13 summarizes the spectroscopic data.
Table 13.
Spectroscopic properties of the thioxanthone derived 2PIs.
|
Compound |
λabs [nm] |
Φfl |
σTPA [GM][a] |
|---|---|---|---|
|
TX‐2 |
463 |
0.25 |
4 |
|
TX‐3 |
366 |
0.015 |
22 |
|
TX‐4 |
497 |
0.16 |
9 |
|
TX‐5 |
380 |
0.015 |
128 |
|
TX6 |
388 |
<0.01 |
73 |
[a] Measured at 800 nm.
The dialkylamino substituted initiators TX‐2 and TX‐4 reveal a strong bathochromic shift in absorption towards 500 nm. In contrast, the expansion of the π‐system did not cause a significant redshift, and the initiators TX‐3, TX‐5 and TX‐6 show an absorption maximum around 400 nm. It should be mentioned that despite the lack of redshift the molar extinction coefficient increases drastically, so that the missing redshift can be seen as an advantage when considering the two‐photon absorption at 800 nm, a typical laser wavelength used in 2PP. [90] The two‐photon cross‐sections clearly reveal an increase of the σTPA value for the initiators with an extended π‐system, in particular TX‐5 with the triple bond bridge, which shows the highest value of 128 GM. The fabrication windows of the different initiators were investigated using the same organic‐inorganic hybrid material as in Ref. [40] (Figure 32).
Figure 32.
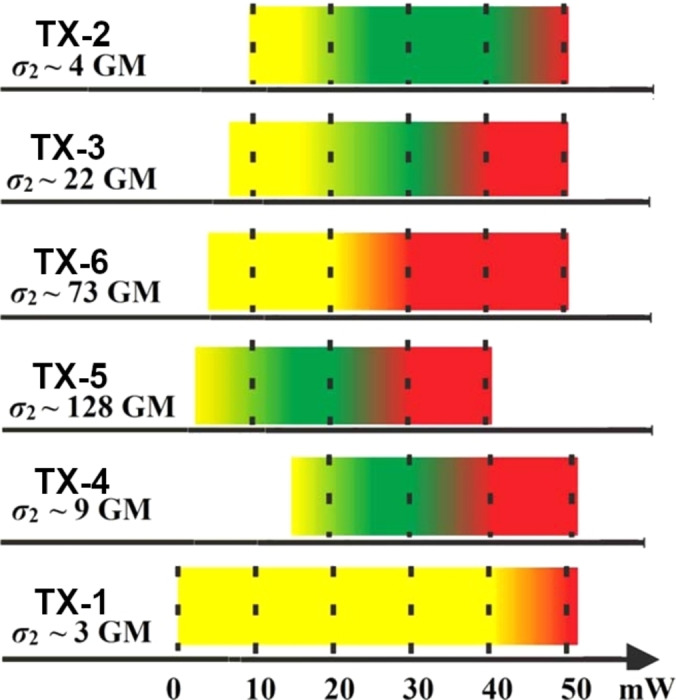
Fabrication windows of thioxanthone based 2PI TX‐1 to TX‐6. Yellow area: Polymerization threshold. Green area: Stable structuring. Red area: Burning threshold. [90] Adapted with permission from Ref. [90]. Copyright 2015, American Chemical Society (https://pubs.acs.org/doi/10.1021/acs.macromol.5b00336).
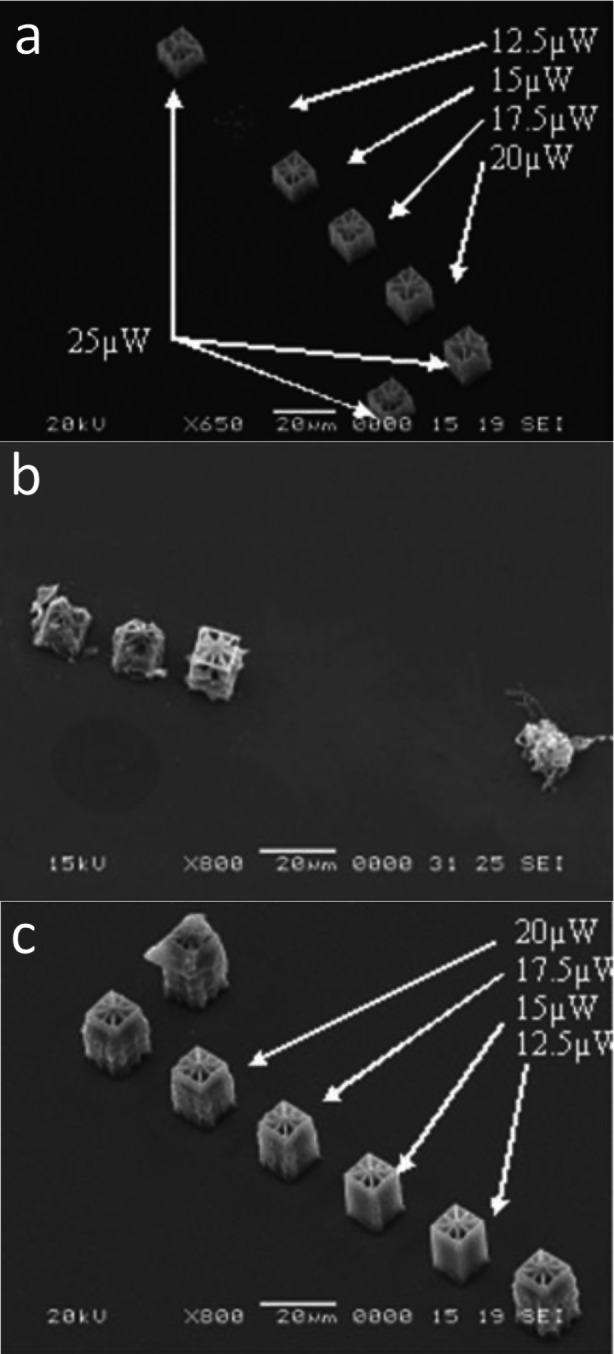
While the initiators TX‐2, TX‐3, TX‐5 and TX‐4 formed structures, TX‐1 and TX‐6 revealed a seamless transition from the lower polymerization limit to the burning threshold. For TX‐2 it is clear that despite the low σTPA value, the initiator‘s radical yield is similar to that of 4,4′‐(dimethylamino)benzophenone and its derivatives. TX‐4 behaves similarly, but a much higher laser intensity is required to write structures. The missing potential of TX‐6 to form radicals can be explained by the presence of the double bond. While radical formation via the intersystem crossing is one possibility, the cis‐trans isomerization of double bonds creates another pathway to release energy from the exited state. TX‐5 shows the best FW among the displayed initiators, this can be attributed to the relatively large σTPA value. Figure 33a displays the fabrication of squares with TX‐2 as initiator and decreasing laser power from left to right. A hollow 3D hemisphere was fabricated using TX‐3 as initiator (Figure 33b).
Figure 33.

(a) SEM recording showing an array of microstructures fabricated with TX‐2. (b) Hollow 3D microstructure with spikes on the surface using TX‐3 as initiator. [90] Adapted with permission from Ref. [90]. Copyright 2015, American Chemical Society (https://pubs.acs.org/doi/10.1021/acs.macromol.5b00336).
Similar to the fluorenone−carbazole/phenothiazine compounds, Zhang et al. also synthesized derivatives with a thioxanthone acceptor (Figure 34). [78] The linear absorption curve shows maxima at 505 nm and 523 nm for TX−PTAA−C6 and TX−CAA−C6. The obtained fluorescence spectrum reveals a quantum yield of 3.56 % for TX−CAA−C6. The TPEF performed showed an σTPA value of 72 GM. Due to the very low fluorescence quantum yield of TX−PTAA−C6 of 0.02 %, no σTPA value could be determined. So far, no structuring tests have been reported with these initiators.
Figure 34.

Schematic representation of the structures of carbazole and phenothiazine modified thioxanthone 2PIs.
Recently, a modified type of two‐photon polymerization has been developed, in which polymerizations with even higher resolution should be possible. In the STED (stimulated‐emission‐depletion)‐method, in addition to the excitation laser that excites electrons from S0 to the S1 state, a second laser beam is used to produce a stimulated emission from S1 to the ground state S0. Since a part of the electrons in the S1 state are tripletted by ISC, the electrons in the S1 state are converted to the S0 state. Isopropyl thioxanthone (ITX) has turned into an interesting photo initiator for this type of polymerization due to its photo initiating and photo inhibiting properties.[ 92 , 93 ] Fischer et al. used ITX as initiator and were able to generate nanolines with a width of 65 nm with this new method. [92] However, the use of ITX requires high laser power, which is due to its low σTPA value of 3 GM. [94]
Therefore, Chi et al. developed new initiators based on the thioxanthone core moiety by expanding the π‐system with various aromatic substituents and by adding a dimethylamino functionality as a donor (Figure 35). [94] While no problems during the synthesis of DBTX were noticed, the isolation of DAPT, BDAPT and DANT was difficult because of their low stability to air and light. BDEPT, DEPT and BDANT could be analyzed but not isolated in an amount enabling evaluation as photo initiator. Table 14 summarizes the photophysical data of the thioxanthone based 2PIs for STED‐DLW (direct laser writing).
Figure 35.

Schematic representation of the structures of thioxanthone based photo initiators made for the investigation in STED‐DLW.
Table 14.
Photophysical data of the thioxanthone based 2PI used for STED‐DLW.
|
Compound |
λmax [nm][a] |
Φfl [%][a] |
σTPA [GM][a] |
|---|---|---|---|
|
ITX |
387 |
1.6 |
3 (±0.4) |
|
DBTX |
–[b] |
–[b] |
22 (±5) |
|
DANT |
380 |
4.4 |
524 (±61) |
|
DAPT |
–[b] |
– |
122 (±21) |
|
BDAPT |
408 |
8.1 |
368 (±45) |
[a] Measured in PETA (pentaerythriol tri acrylate). [b] Insufficient signal in PETA.
In general, all substances reveal a slight bathochromic shift compared to ITX. BDAPT shows the largest measured shift. The σTPA values could also be improved compared to ITX. BDAPT and DANT displayed the best values with 368 GM and 524 GM. A relatively low fluorescence quantum yield was observed in PETA for all initiators (including ITX). This indicates that the nonradiative decay from the excitation is the major process and not the stimulated emission depletion process as assumed. Therefore, it can be expected that the initiators (Figure 35) follow a similar depletion pathway as ITX. [94] Based on the photophysical data BDAPT was the best candidate for STED‐DLW. For this purpose, BDAPT was irradiated with an excitation laser (405 nm) and a trigger laser (633 nm).
A depletion of the fluorescence could be detected, which did not occur at 535 nm (depletion wavelength of ITX).
For demonstration purposes writing experiments with BDAPT in PETA were carried out. Figure 36 shows line experiments in which during writing over a length of 10 μm the depletion laser was activated without switching off the excitation laser. A total inhibition of polymerization was achieved during the exposure of the depletion laser.
Figure 36.
SEM image of photopolymerization with BDAPT and PETA as monomer. The highlighted box displays the area where polymerization was interrupted by the depletion laser. [94] Adapted with permission from Ref. [94]. Copyright 2019, John Wiley and Sons.
Based on the previous results the same authors developed different ITX derivatives for the use in STED‐DLW in a recent study. [95] Although the reported derivatives represents a D‐π‐A/D structure (Figure 37), for the purpose of comparison they will be discussed here. The initiators were equipped with electron withdrawing and donating groups to investigate their applicability in STED‐DLW. In addition, initiators with phenyl or the para‐fluor phenyl residues with more or less neutral electron withdrawing or donating ability were investigated.
Figure 37.

Schematic representation of the structures of the D‐π‐A/D initiators based on ITX.
The linear absorption maxima in toluene of the ITX 2PIs range in a narrow area around 391 to 402 nm, where ITX−pyridine absorbs at the lower range and ITX−thiophene at the upper area. This is clearly attributed to the electron donating effect of the thiophene. Although the authors report fluorescence emission spectra and even phosphorescence life times, no data concerning the fluorescence quantum yield is reported. The two‐photon cross‐sections were determined by the open z‐scan method in THF at 800 nm and the results are shown in Figure 38a. In general the σTPA‐values of the 2PIs are larger compared to ITX, but within the ITX derivates a clear trend is visible. While the initiators with an electron‐withdrawing group exhibit only a little higher value, those equipped with an electron‐donating group revealed the highest values of all initiators, investigated in this study. The writing threshold was determined by fabricating polymer lines with different laser powers at a constant writing speed of 100 μm/s. Hereby the threshold was defined as the minimum laser power, which is needed to fabricate stable structures, which survive the development process. The results are summarized in Figure 38.
Figure 38.

Bar chart of the (a) average two‐photon cross‐section at 800 nm and (b) average writing threshold of the 2PIs with a writing speed of 100 μm/s at 800 nm. [95] Reproduced with permission from Ref. [95]. Copyright 2021, American Society of Chemistry.
Overall, the new ITX derivatives reveal a lower, thus more improved, writing threshold compared to ITX. ITX−phenyl−OCH3 shows the best writing threshold, although compared to ITX−thiophene it shows a lower σTPA‐value. This is in good agreement with the results of other previous mentioned studies that indicate that the polymerization threshold, in this case the writing threshold, does not necessarily improve with higher σTPA‐values. For the purpose to be used in STED‐DLW a “new writing threshold” which depends on the power of the inhibition laser had to be investigated for the ITX derivatives. A better inhibition efficiency should result in increased resolution. The inhibition wavelength was set to 638 nm, which resembles the triplet absorption peak of ITX, thus an inhibition at this wavelength was expected. [96] Figure 39 shows the increased writing thresholds of the ITX derivatives.
Figure 39.
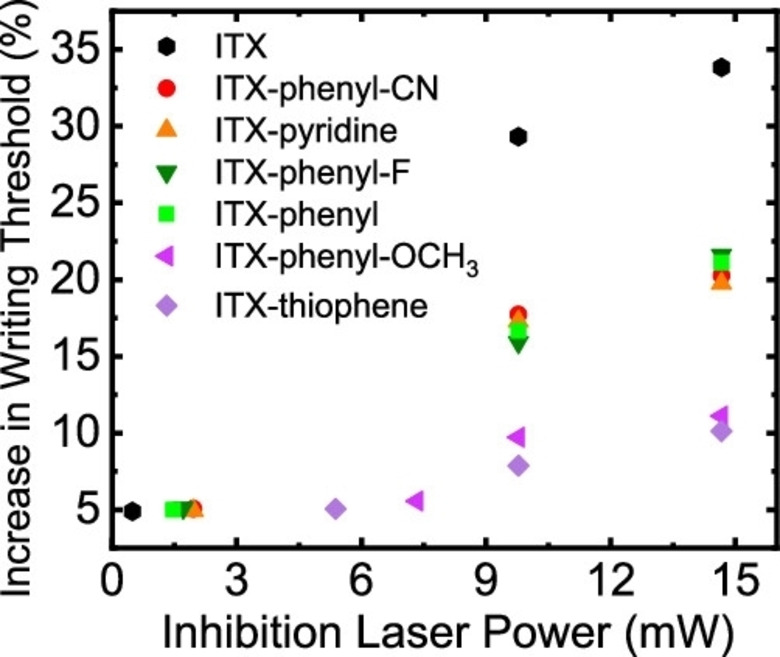
Writing threshold of the ITX derivatives in comparison to ITX under the exposure of the inhibition laser at 638 nm at different laser powers. [95] Reproduced with permission from Ref. [95]. Copyright 2021, American Society of Chemistry.
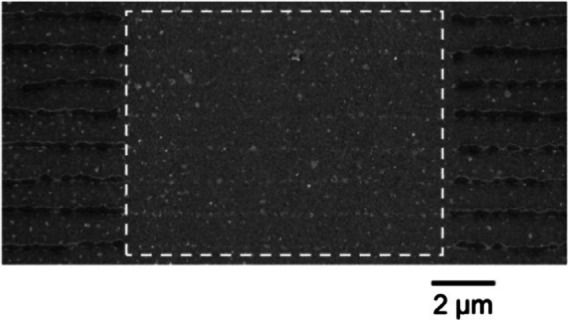
The best inhibition capabilities were determined for the initiators ITX−phenyl−CN, ITX−pyridine, ITX−phenyl and ITX−phenyl−F compared to ITX. ITX−phenyl−OCH3 and ITX−thiophene exhibit the least impressive inhibition effect, which can be attributed to the poor triplet absorption at 638 nm because of their shifted absorption by the electron donating groups. STED‐DLW polymerization tests were performed by using 7 % more power of the inhibition laser compared to the polymerization laser at the writing threshold of the individual initiator. In a ∼70 μm2 area the inhibition laser is turned on with a power of 9.8 mW. All ITX derivatives show no polymerization within that area, even ITX−phenyl−OCH3 and ITX−thiophene (Figure 40).
Figure 40.

SEM image of fabricated lines using ITX−phenyl−OCH3 with the inhibition area, revealing no polymerization during the switched on inhibition laser at 638 nm. [95] Adapted with permission from Ref. [95]. Copyright 2021, American Society of Chemistry.
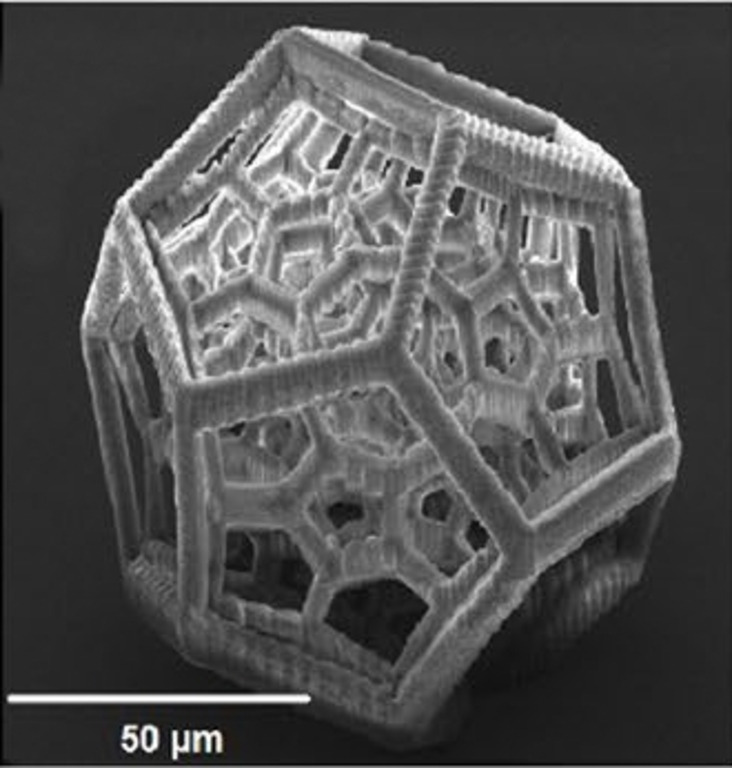
Although isopropyl thioxanthone (ITX) has a relatively low two‐photon cross‐section (3 GM), it was used for serval 2PP studies as initiator alone and in combination with co‐initiators.[ 97 , 98 ] Zhang et al. used ITX in a process termed lithographically patterned nanostructure by chemical etching (LPNCE), where controlled etching of metal surfaces is enabled by polymerization of a protective polymer pattern onto the surface (Figure 41 & 42). [97]
Figure 41.

Overview of the LPNCE process. (a) Sputter coating, (b) dropping photoresist, (c) fabrication of polymer via 2PP using PETA as monomer, (d) removing of the unpolymerized photoresist, (e) etching of the gold with KI3 surface and (f) dissolving of the polymer. [97] Reproduced with permission from Ref. [97]. Copyright 2014, World Scientific Publishing Co. PTE. LTD.
Figure 42.

SEM image of fabricated micro circle via LPNCE. (a) Circles with a radius of 5 μm and a line width of 1.2 μm. (b) Outerring radius and width of 10 μm and 0.9 μm, and inner ring, 5 μm and 0.9 μm, respectively. [97] Reproduced with permission from Ref. [97]. Copyright 2014, World Scientific Publishing Co. PTE. LTD.
2.6. D‐π‐A‐π‐D photo initiators with other structures
Pyridinyl and pyridiniumyl residues are characterized by their strong electron acceptor properties. The pyridiniumyl core leads to high σTPA values, although it should be noted that the molecules under investigation are known as fluorescent dyes.[ 99 , 100 , 101 ] To evaluate the properties, Liska et al. synthesized two initiators M3P and M3P+ (Figure 43). [45]
Figure 43.

Schematic representation of the structure of the pyridinyl and pyridiniumyl based 2PIs.
The linear absorption of M3P in acetonitrile reveals a maximum of 363 nm. By introducing a methyl group, the cationic 2PI M3P+ shows an immense shift of absorption to 489 nm. The cationic character of M3P+ is also evident in the fluorescence emission. While a light fluorescence with a quantum yield of 0.09 can be measured for M3P, for M3P+ no fluorescence was detected. This may be due to the strong acceptor of M3P+, which results from the methylation of the pyridine nitrogen. Due to the ionic structure of M3P+, Z‐scan measurements could not be performed in common solvents such as n‐hexane, THF and MeOH. M3P on the other hand showed a TPA of 23 GM. The determination of the fabrication window was performed with a 1 : 1 mixture of ETA and TTA. It turned out that M3P is insoluble in the monomer mixture and therefore no polymerization could be observed. Surprisingly, M3P+ revealed low solubility in the mixture, resulting in an FW of ∼18 to 29 mW.
By the reaction of dibutylaminobenzaldehyde with 2,4,6,‐trimetyhl‐1,3,5‐triazine (Trz), dipolar (BTrz), quadrupolar (2BTrz) and octopolar (3BTrz) photo initiators were synthesized (Figure 44). [102]
Figure 44.

Schematic representation of the structures of dipolar, quadrupolar and octopolar 2PIs BTrz, 2BTrz and 3BTrz.
The three initiators show a linear absorption around 400 nm. It should be mentioned that the absorption maximum of 2BTrz and 3BTrz differ only by a few nm and the fluorescence quantum yields of both are identical. The measured σTPA values using the Z‐scan method at 796 nm reveal an enormous increase in the σTPA value from the D‐π‐A (BTrz) to the D‐π‐A‐ π‐D chromophore (2BTrz). The additional expansion to an octopolar structure, represented by 3BTrz, causes only a slight increase in the σTPA value (Table 15).
Table 15.
Photophysical data of BTrz, 2BTrz and 3BTrz.
|
Compound |
λmax [nm] |
Φfl |
σTPA [GM][a] |
FW [mW][b] |
|---|---|---|---|---|
|
BTrz |
412 |
0.055 |
60 |
– |
|
2BTrz |
432 |
0.20 |
244 |
18 to 120 |
|
3BTrz |
434 |
0.20 |
275 |
18 to 100 |
[a] Measured in THF at 796 nm, [b] fabrication at 800 nm.
BTrz did not show any real activity in the structuring tests at 800 nm, but the activity could be improved by adjusting the laser wavelength by 15 nm. This adjustment to the maximum σTPA value of BTrz resulted in a significantly higher radical formation. On the other hand, 2BTrz shows the largest fabrication window among the initiators, which could be due to the fact that its σTPA maximum is at 800 nm. 2BTrz generates stable structures even at a high writing speed of 200 mm/s. Figure 45 displays a complex 3D structure written with 2BTrz as photo initiator.
Figure 45.
SEM image of a complex 3D sphere fabricated with 2BTrz as 2PI. [102] Adapted with permission from Ref. [102]. Copyright see http://creativecommons.org/licenses/by/4.0/.
Searching for new heterocycles with interesting acceptor properties, recently developed thiophene based compounds exhibit high σTPA values.[ 103 , 104 ] By combining thiophene as a planar π‐linker with several electron rich triphenylamine donors, new 2PIs (Figure 46) with broad fabrication windows were obtained. [105]
Figure 46.

Schematic representation of the structures of the thiophene based 2PIs.
The data of the linear absorption show mostly maxima at around 400 nm (Table 16). By replacing the electron donating substituents by electron withdrawing groups a hypsochromic shift down to 345 nm occurs. Interestingly, the fluorescence quantum yields decrease when electron withdrawing groups are attached. Although a decrease occurs, the fluorescence quantum yields are in general high. The difference in substituents also has a significant influence on the σTPA value. Substances with more electron withdrawing groups, possess decreased σTPA values (from 379 GM (BMOAT−1T) to 173 GM (BSO2MA−1T), Table 16).
Table 16.
Spectroscopic data of thiophene based 2PIs in THF.
|
Compound |
λabs [nm] |
Φfl |
σTPA [GM][a] |
|---|---|---|---|
|
BMOA−1T 1 |
400 |
0.57 |
379 |
|
BtBuA−1T |
396 |
0.44 |
358 |
|
BMA−1T |
396 |
0.40 |
331 |
|
BTMAS−1T |
394 |
0.40 |
345 |
|
BHA−1T |
390 |
0.34 |
301 |
|
BFA−1T |
387 |
0.33 |
301 |
|
BCNA−1T |
352 |
0.39 |
213 |
|
BSO2MA−1T |
345 |
0.36 |
173 |
[a] Measured via TPEF at 800 nm.
To estimate the fabrication windows of the 2PIs listed in Table 15 defined woodpile structures were fabricated at different laser powers and writing speeds. The well‐established monomer mixture ETA/TTA was applied for the fabrication process. All of the synthesized 2PIs were able to produce well‐defined wood pile structures. Although all 2PIs are able to induce polymerization in general the ones with electron donating substituents show a broader fabrication window (BMTOA−1T, BtBUA−1T, BMA−1T and BTMSA−1T) compared to those bearing electron withdrawing groups (BFA−1T, BCNA−1T and BSO2MA−1T) which only gave good woodpile structures at lower laser intensities and writing speeds. Interestingly the unsubstituted initiator BHA−1T revealed the broadest fabrication window amongst the initiators (Figure 47).
Figure 47.

SEM image of the speed power screening of BHA−1T. Classification by color: (green) excellent structures, (yellow) good structures with slightly contorted shapes, (red) structures with identifiable shapes but with small errors, (blue) not identifiable structures. [105] Adapted with permission from Ref. [105]. Copyright see https://creativecommons.org/licenses/by‐nc/3.0/.
Besides the mentioned heterocycles, quinoxaline compounds were investigated as sensitizers for solar cells components and as two‐photon absorption dyes.[ 106 , 107 , 108 ] Cao et al. investigated compounds consisting of a quinoxaline and benzoquinoxaline as acceptor combined with modified triphenylamine and ethoxybenzene as donor groups (Figure 48). [109]
Figure 48.

Schematic representation of the structures of quinoxaline and benzquioxaline based photo initiators.
The four initiators show absorption maxima between 350 and 470 nm (Table 17). A significant red shift is observed for the structures containing the triphenylamine moiety (TPAQ, TPABQ) compared to the ones with the structures with the alkoxy group (EOQ, EOBQ). The same is observed between the quinoxaline and benzoquinoxaline. Here, the additional benzol ring leads to a red shift in the absorption maximum. The triphenylamine moiety as well as the benzoquinoxaline provides the system with more electrons and a larger degree of conjugation. In general, the quinoxaline compounds reveal lower fluorescence quantum yields comparted to the benzoquinoxalines. This indicates that the benzoquinoxaline is a weaker acceptor than quinoxaline. Moreover, the triphenylamine compounds show higher fluorescence quantum yields than the alkoxy ones. This can be attributed to the stronger donor ability of the triphenylamine moiety.
Table 17.
Linear and nonlinear optical properties of the quinoxalines and benzoquinoxaline based photo initiators in CHCl3.
|
Compound |
λabs [nm] |
λem [nm] |
Φfl [%][a] |
σTPA [GM][b] |
|---|---|---|---|---|
|
EOQ |
290/371 |
439 |
11.6 |
15 |
|
EOBQ |
330/419 |
483 |
4.5 |
25 |
|
TPAQ |
307/419 |
555 |
14.6 |
160 |
|
TPABQ |
304/464 |
573 |
9.8 |
70 |
[a] Compared to coumarin 307, [b] measured via TPEF, maxima at around 780 to 820 nm.
Two‐photon cross‐section measurements resulted in a maximum of around 15, 25, 70 and 160 GM for EOQ, EOBQ, TPABQ and TPAQ, respectively. By combining quinoxaline or benzoquinoxaline with the triphenylamine moiety the σTPA value becomes much higher than with the alkoxyaryl moiety. Although the benzoqunioxaline acceptor shows a higher degree of conjugation, it seems that an expansion of the π‐conjugation, like in quinoxaline, is crucial to obtain compounds with high σTPA‐values. Because of their large two‐photon cross‐section, polymerization tests were performed with TPAQ and TPABQ in a monomer mixture consisting of methyl methacrylic acid (MMA) and dipentaerythritol hexaacrylate (DEP‐6 A) as crosslinker. Figure 49 displays fabricated lines with different laser powers at a relatively slow speed of 10 μm/s and 800 nm.
Figure 49.

SEM image of the fabricated lines using (a) TPAQ or (b) TPABQ as initiators. [109] Adapted with permission from Ref. [109]. Copyright 2009, Royal Society of Chemistry.
Compared to the commercial photo initiator Benzil, the two initiators showed lower threshold energies (0.8 mW TPAQ, 2.6 mW TPABQ, 3.2 mW Benzil). The polymerization rates Rp were determined according to a method developed by Katawa et al. [110] and were determined to be 5.96, 3.89 and 0.66 μm3/s for TPAQ, TPABQ and Benzil, respectively.
Watanabe et al. synthesized and investigated the benzylidenediaminomaleonitrile derivatives BMN‐1 to BMN‐4 (Figure 50) for their use as photo initiators. [111] The replacement of the C−C double bond with an benzol group enhances the extent of the charge transfer from the terminal groups to the center. The two‐photon cross section of the photo initiator BMN‐1 to BMN‐4 were measured via TPEF measurement (Table 18).
Figure 50.

Schematic representation of the structures of the benzylidenediaminomaleonitrile based 2PIs.
Table 18.
Photophysical data of the benzylidenediaminomaleonitrile 2PIs in chloroform.
|
Compound |
1λabs [nm] |
2λex [nm] |
σTPA [GM][a][b] |
Φfl |
|---|---|---|---|---|
|
BMN‐1 |
552 |
840 885 |
180 265 |
0.46 |
|
BMN‐2 |
536 |
820 840 |
2050 1910 |
0.02 |
|
BMN‐3 |
547 |
820 840 |
545 520 |
0.05 |
|
BMN‐4 |
553 |
820 840 |
490 480 |
0.1 |
[a] Measured via TPEF technique with Rhodamine B as reference.
All photophysical measurements were performed in toluene and chloroform, except for BMN‐2 which was only soluble in chloroform. The linear absorption, the two‐photon cross‐section and the fluorescence quantum yield strongly depend on the solvent's polarity. For BMN‐1 the σTPA value in chloroform is decreased by more than half in comparison to the σTPA in toluene. The terminal phenyl groups decrease the polarity of the molecule, as a result BMN‐1 exhibits higher values in toluene than in chloroform. BMN‐3 and BNM‐4 reveal larger σTPA values in chloroform relative to the ones measured in toluene. The small increase of the σTPA value in chloroform can be explained by the replacement of the C−C double bond with the more polar imine group. Initiator BMN‐2 shows a large σTPA value, which can be attributed to its low fluorescence quantum yield.
Microfabrication properties of the 2PIs were tested with a monomer mixture consisting of 70 wt% multifunctional acrylate monomers (SR9008:SR368=1 : 1), 29.9 wt% of poly(styrene‐co‐acrylonitrile) as polymer binder. The 2PI concentration was set to 5×10⁻⁴ M. The newly synthesized 2PIs were compared to a well‐known 2PI ST‐4 (σTPA=900 GM). BMN‐1 and BMN‐2 showed low solubility in the monomer mixture and no polymerization properties could be determined. With BMN‐3 and BMN‐4 as well as with ST‐4 microgrids were fabricated and the polymerization rates Rp were determined by using the equation π(d/2)2νs, where d is the width of the written protruding line and νs is the scanning speed of 50 μm/s.
BMN‐3 and BMN‐4 reveal lower polymerization rates at 755 nm, which are increasing when an excitation wavelength of 820 nm is used, although the laser power at 755 nm (5.0 mW) is higher at 820 nm (3.0 mW) (Table 19). Figure 51 shows fabricated microgrids with BMN‐3 at 755 nm (a) and 820 nm (b).
Table 19.
Polymerization rates of BMN‐3 and BMN‐4 in comparison to ST‐4 at different excitation wavelength.
|
Compound |
2λex [nm] |
σTPA [GM][a] |
Rp [μm3/s] |
d [μm] |
|---|---|---|---|---|
|
ST‐4 |
730 |
900 |
395 |
3 |
|
BMN‐3 |
755 820 |
390 545 |
160 450 |
2 3.4 |
|
BMN‐4 |
755 820 |
315 490 |
120 230 |
1.8 2.4 |
[a] Measured via TPEF technique with Rhodamine B as reference.
Figure 51.

SEM image of fabricated microgrids with BMN‐3 at (a) 755 nm and (b) 820 nm. The scale bar is set to 10 μm. [111] Adapted with permission from Ref. [111]. Copyright 2004, Royal Society of Chemistry.
2.7. Water soluble D‐π‐A‐π‐D photo initiators
Wan et al. develop the water‐soluble photo initiator BSEA (Figure 52) by introducing carboxylic groups to the two‐photon dye 2,5‐bis‐[4‐(diethylamino)‐benzylidene]‐cyclopentanone (BDEA). [112]
Figure 52.

Schematic representation of the structures of BSEA, 2PCK, G2CK and E2CK.
BSEA exhibits an absorption maximum at 513 nm in water and has a small fluorescence quantum yield of 0.0023 compared to Rhodamine B (in methanol) as standard. The σTPA value was measured with the nonlinear transmission (NLT) method [113] as well as with the TPEF method and showed a σTPA value of 287 GM (NLT at 800 nm) [112] and 808 GM (TPEF, maximum with the range of 750 to 840 nm). [114] This might be attributed to the difference of measuring the fluorescence quantum yield. To evaluate the fabrication properties of BSEA, it was compared to Eosin Y as a water‐soluble photosensitizer. Both dyes were used for polymerization tests with PEGda 600 as monomer, with and without the co‐initiator TEA.
The polymerization threshold of BSEA is much smaller, in both cases with and without TEA, compared to Eosin Y (Table 20). In fact, the fabrication window of BSEA decreased if TEA was used, although the polymerization threshold decreased. It is also interesting to see that R4 reveals no Edamage. In fact the whole material would solidify gradually during the line scanning process. One‐photon polymerization tests showed that the initiating efficiency of Eosin Y and TEA was much higher than for BSEA and TEA. Because of these results R1 was chosen for the fabrication of a 3D woodpile structure (Figure 53).
Table 20.
Resin formulation and polymerization data.
|
Resin |
PEGda 600 [wt %] |
BSEA [wt %] |
Eosin [wt %] |
TEA [wt %] |
Eth [mW] |
Edamage [mW] |
|---|---|---|---|---|---|---|
|
R1 |
79.87 |
0.16 |
|
0 |
0.51 |
4.73 |
|
R2 |
79.87 |
|
0.16 |
0 |
2.15 |
4.73 |
|
R3 |
78.6 |
0.16 |
|
1.6 |
0.46 |
4.3 |
|
R4 |
78.6 |
|
0.16 |
1.6 |
1.51 |
– |
Figure 53.

Fabricated woodpile structure fabricated using a writing speed of 110 μm/s, a laser power of 0.8 mW, BSEA as photo initiator and resin R1 in water. [112] Adapted with permission from Ref. [112]. Copyright 2009, Elsevier.
Li et al. synthesized three photo initiators with carboxylic groups similar to BSEA but with different central ketone ring sizes (Figure 52). [115]
The three initiators exhibit a σTPA‐value (Z‐scan at 800 nm) over 150 GM. The σTPA value decreases first when the central ketone is changed from cyclopentanone (P2CK, 176 GM) to 4‐methylcyclohexanone (G2CK, 173 GM). Because the cyclohexanone ring has a lower planarity compared to the cyclopentanone ring, the degree of conjugation in G2CK is lower than in P2CK. By extending the alkyl spacers from methylene to ethylene like in E2CK, an increase to 201 GM was observed, which is higher as for P2CK. The increase to 201 GM in E2CK could be attributed to the better electron donating strength of the ethylene alkyl chain. Another possibility might be that the red shift support a better absorption at the given polymerization wavelength. In comparison to the hydrophobic counterparts (BcP‐1 with 466 GM and BcH‐2 with 191 GM, Figure 10) the cross‐sections of the water‐soluble 2PIs are all lower. This discrepancy could be a solvent effect on the TPA behavior. There are several studies, which demonstrated that the absorption behavior under two‐photon conditions is strongly depended on the solvent polarity. Such a drop in σTPA value is also visible in other studies of water‐soluble 2PIs. [112] Evaluation of the 2PIs were performed by fabrication of 3D microstructures with PEGda 700 at different laser intensities (60 to 410 mW) and writing speeds (1 to 100 mm/s). The fabricated structures were categorized in structures with excellent integrity (green), good integrity with thick hatch‐lines (yellow) and structures with identifying shapes but with mistakes (red). Like their hydrophilic counter parts, the three water‐soluble 2PIs show high initiation efficiency during the 2PP screening. Figure 54 displays that the polymerization threshold of P2CK is lower compared to E2CK or G2CK. It is known that compounds with a central cyclohexanone core, like E2CK and G2CK, exhibit a lower fluorescence quantum yield compared to cyclopentanone compounds, like P2CK. [116] This may explain the lower polymerization threshold of E2CK and G2CK, because low fluorescence quantum yields are crucial for effective initiation via TPA. [43] The two cyclohexanone 2PIs show similar fabrication properties, although E2CK exhibit the largest σTPA value of three 2PIs. The similar efficiency of G2CK may lay in the methyl‐substituted phenylglycine moiety, which is more active compared to other arylamines as co‐initiator in UV polymerizations. [117] Therefore, it is to be assumed that the radicals formed by G2CK are more efficient thus compensating the lower σTPA‐value. Cytotoxicity tests were performed with MG63 osteosarcoma cells and outgrowth endothelial cells (OEC), which were exposed to the 2PIs for 10 and 30 min respectively. Of all the 2PIs only G2CK had a significant impact on the MG63 cells viability in both experiments. When the cell line is changed to the OEC cells a significant decrease in cell viability was observed for E2CK and G2CK. In case of P2CK the cytotoxicity was as low as for the reference (I2959) in the 10 min experiment. This changed when the incubation time was increased to 30 min, where P2CK also decreased the cell viability but not as much as the other two initiators. Although the cell viability was reduced by the photo initiators, P2CK and G2CK were successfully used in fabrication of 3D hydrogels consisting of modified gelatin with and without presence of living cells.[ 118 , 119 ] In a recent study from 2021, Huang et al. compared the two PIs P2CK and BSEA for their ability to fabricate scaffolds in presence of living cells. [120] The authors claim that because of the higher water‐solubility of BSEA (four carboxylic groups compared to P2CK with only two) the cytotoxicity is much lower. They could fabricate scaffolds using a glycidyl methacrylate modified gelatin as resin in the presents of living cells with the help of BSEA.
Figure 54.

Fabrication windows of the water‐soluble 2PIs P2CK, E2CK and G2CK. [115] Adapted with permission from Ref. [115]. Copyright 2013, Royal Society of Chemistry.
Based on the results of BSEA of the same group two more 2PIs with varied central cycloalkane ketones were synthesized (Figure 55). [114]
Figure 55.

Schematic representation of the structure of the 2PIs T1, BESA and T3.
With increasing cycloketone ring size the linear absorption maximum shifts hypsochromically from 522 nm for T1 to 478 nm for T3 (Table 21). The fluorescence quantum yield drops when the ring size increases, as expected. Interestingly at first an increase of the σTPA value is observed from cyclobutanone (T1) to the cyclopentanone derivative (T2, BSEA). However, by increasing the ketone ring size to cyclohexanone (T3) the cross‐section drops significantly, as observed in the hydrophobic 2PIs with a cyclohexanone structure (Table 4 & 5, Chapter 2.2.).
Table 21.
Photophysical data of the 2PIs T1, BSEA and T3.
|
Compound |
λmax [nm] |
Φfl [a] |
σTPA [b] |
|---|---|---|---|
|
T1 |
522 |
1.28 |
567 |
|
BSEA (T2) |
513 |
1.10 |
808 |
|
T3 |
478 |
0.52 |
231 |
[a] Rhodamine B in methanol was used as reference. [b] Measured by TPEF in water. All three maxima lay around 820 nm.
Polymerization tests were performed with three different photocurable resins SR610 (PEGda 600), BSA and a hyaluronic acid derivative (HAGM). In addition, the prepared initiators were compared to the known water‐soluble initiator Eosin Y. The resin composition, polymerization threshold and damage threshold for SR610 are listed in Table 22.
Table 22.
Polymerization results for the resins containing 79.87 wt% SR610 and the different 2PIs (0.16 wt% in water at 820 nm).
|
Resin |
Initiator |
Eth [mW] |
EDamage [mW] |
|---|---|---|---|
|
R1 |
Eosin |
0.51 |
5.24 |
|
R2 |
T1 |
0.37 |
5.93 |
|
R3 |
T2 (BESA) |
0.08 |
6.94 |
|
R4 |
T3 |
0.43 |
5.65 |
Compared to the literature known initiator Eosin all three initiators exhibits broader FWs, with T2 and BSEA showing the broadest FWs (Table 22). These results were also observed when the polymerizations were performed with bovine serum albumin (BSA) as photocurable material. Polymerizations with hyaluronic acid derivative (HAGM) revealed that all three initiators perform better than Eosin but it is interesting to note that T3 in this composition exhibits the broadest fabrication window (Eth(T3): 0.38 mW, Ebr(T3): 8.05 mW; Eth(T2): 0.59 mW, Ebr(T2): 7.37 mW).
Biocompatibility tests were performed with MTT assay using hepatoma cells HepG2. The cells were incubated with 3 mM (2PI concentration during 2PP). After incubation for 24 h the cell viability was nearly 60 % for all 2PIs.
By combining triphenylamine motifs with a cyclopentanone core, Wloka et al. have developed the water‐soluble initiator BTABcP‐1 (Figure 56) with a linear absorbance at 390 nm, nearly half the wavelength of the common polymerization wavelength of 800 nm. [8]
Figure 56.

Schematic representation of the structure of BTABcP‐1.
Z‐scan measurement revealed a σTPA value of 253 GM at 800 nm (not reported in the publication, but measured after wards via Z‐scan). 2PP was performed with newly introduced poly(2‐oxazoline) based macromonomer (PEtOx‐DA) for 2PP. A voxel array with varying laser power and exposure time was prepared (Figure 57). Also, a line array with a constant writing speed of 0.1 mm/s and laser power of 310 mW, while the z‐rise of the laser focal point was increased by one micrometer per line from right to left (Figure 58).
Figure 57.

SEM image of a voxel array of PEtOx‐DA (DP 18) and BTABcP‐1 as initiator. The exposure time ranged from 40 to 400 ms (Δ=40 ms; right to left) and the laser power ranged from 10 to 410 mw (bottom to top, Δ=50 mW). [8] Adapted with permission from Ref. [8]. Copyright 2021, Elsevier.
Figure 58.

SEM images of the line arrays fabricated by 2PP using BTABcP‐1 and PEtOx‐DA. The side view shows the fabricated lines in an 60° angle and the black arrow marks the last alone standing line. [8] Adapted with permission from Ref. [8]. Copyright 2021, Elsevier.
To determine the cytotoxicity of the initiator an alamarBlue™ assay with L929 cells was performed. The cells were incubated for 24 h with various concentration (0.25 μg/mL to 1 mg/mL) and subsequently tested for their viability. From results of the assay the cytotoxic concentration (CC50) was calculated to be 740±20 μg/L.
Using the host‐guest interaction, a method where a molecule is incorporated into a guest molecule, Xing et al. where able to solve the hydrophobic anthracene derivative N in water with the help of cyclodextrin (Figure 59). [121]
Figure 59.

Schematic representation of the structure of the anthracene compound N.
By incorporating N into 2‐hydroxypropyl‐β‐cyclodextrin (2‐Hp‐β‐CD) the water‐soluble complex WI was generated. With this the photophysical properties are influenced (Table 23).
Table 23.
Photophysical data of N and N/2‐Hp‐β‐CD complex WI.
|
Compound |
Solvent |
λmax [nm] |
Φfl [a] |
σTPA [GM][b] |
|---|---|---|---|---|
|
N |
CHCl3 |
327/443 |
0.023 |
612 (820 nm) |
|
WI |
water |
290 |
0.007 |
282 (770 nm) |
[a] Fluorescence quantum yield determined relative to coumarin 307. [b] Measured by TPEF at the stated wavelengths.
N exhibits two linear absorption maxima at 443 nm, which corresponds to the intramolecular charge transfer and at 328 nm which can be assigned to the π‐π* transition. By incorporating N into 2‐Hp‐β‐CD the absorption maxima shift hypsochromically to 290 nm. This shift is mainly attributed to the decreasing polarity of the microenvironment around N. [122] It is also possible that N forms hydrogen bonds between its pentoxy groups and hydroxy groups of the cyclodextrin, which results in electron redistribution and thereby, increasing the stability of N. [123] The fluorescence quantum yield of N with 0.023 is higher compared to the water‐soluble complex WI with 0.007. σTPA values were determined by using the TPEF technique and revealed for N 612 GM (chloroform) and for WI 282 GM. At the polymerization wavelength of 780 nm WI exhibits a σTPA of 200 GM, which is larger than common commercially available water‐soluble photo initiators. [91] The decrease for WI compared to N is caused by the hydrogen bonds which have a major influence on the ICT. By polymerizing PEGda (Mn=700 g/mol) the threshold energy at different writing speeds was determined by fabricating a line array. The threshold energy for WI at a writing speed of 10 μm/s was 8.6 mW, while at a higher writing speed of 50 μm/s the threshold increased to 10.2 mW. 3D woodpile microstructures with good integrity were fabricated with a writing speed of 30 μm/s at a laser power of 9.7 mW (Figure 60).
Figure 60.

SEM image of a fabricated woodpile microstructure with PEGda and the N/2‐Hp‐b‐CD complex WI as photo initiator. [121] Adapted with permission from Ref. [121]. Copyright 2014, Royal Society of Chemistry.
With the same technique N was also encapsulated in the poloxamer Pluronic F127. [124] The formed complex WI−II showed good water solubility and exhibits a linear absorption maximum of 285 nm in water, which is similar to WI. The maximum two‐photon cross‐section of WI−II lies at 760 nm and revealed a σTPA value of 260 GM. Although the σTPA value is slightly lower compared to WI, WI−II also exhibits 200 GM at the polymerization wavelength of 780 nm. Polymerization tests with PEGda as monomer revealed a threshold energy of 6.29 mW, which compared to WI is much lower. A line array performed with different laser intensities from 6.29 to 11.09 mW showed that at a laser power of 6.8 mW lines were fabricated which possessed a width of only 92 nm. The writing speed was constantly kept at 10 μm/s. 3D microstructures in form of an adenovirus were fabricated with different laser intensities to proof the suitability of the initiator complex (Figure 61). From the three SEM images displayed in Figure 61, it is visible that the structure fabricated with 7.27 mW shows the best resolution compared to the structures fabricated with higher laser power. Both WI and WI−II fabricate precise microstructure via 2PP, however in both studies 2‐benzyl‐2‐(dimethylamino)‐4′‐morpholinobutyrophenone was used as photosensitizer. This compound is also known as Irgacue 369,), which is used as a commercial photo initiator in 2PP.[ 125 , 126 , 127 , 128 ] Therefore, it is not quite clear from the publication if the attendance of Irgacure 369 in the formulations influenced the polymerization efficiencies of WI and WI−II.
Figure 61.

SEM pictures of the fabricated 3D microstructures in form of an adenovirus. (a–c) Top view of the structures fabricated with 7.27 mW, 9.46 mW and 11.27 mW. (d) Side view of fabricated adenovirus structure at 8 mW. All structures were fabricated with a writing speed of 110 μm/s. [124] Reproduced with permission from Ref. [124]. Copyright 2015, Royal Society of Chemistry.
3. D‐π‐D Chromophores
D‐π‐D Compounds are able to transfer an electron after one‐ or two‐photon photo excitation, because of their electron rich structure. [9] This also causes large two‐photon cross‐sections comparable to the before mentioned D‐π‐A‐π‐D chromophores.
3.1. Stilbene, benzene and triphenylamine photo initiators
2PIs derived from stilbene or triphenylamines are easily excited and show light induced electron transfer because of their electron rich D‐π‐D chromophores. They are used on their own or in combination.
Cumpston et al. investigated different stilbene based systems. Several compounds were synthesized and evaluated for their use as photo initiators in two‐photon polymerization (Figure 62). [9]
Figure 62.

Schematic representation of the structures of the stilbene based 2PIs ST‐1 to ST‐5.
In general, an enlargement of the π‐system results in a bathochromic shift as well as a higher σTPA value (Table 24). The introduction of weak electron donating groups like the methoxy group to the π‐backbone (ST‐4 and ST‐5) can further enhance the initiators properties. For example, ST‐5 shows a linear absorption at 448 nm and a very high σTPA value of 1250 GM. Unfortunately, the authors did not report the solvent in which measurements where conducted.
Table 24.
Optical and fabrication data for ST‐1 to ST‐5.
|
Compound |
λabs [nm][a] |
λ2 abs [nm][a] |
σTPA [GM][a][b] |
Eth [mJ] |
Pth [μW][e] |
|---|---|---|---|---|---|
|
ST‐1 |
374 |
600 |
210 |
0.3[c] |
|
|
ST‐2 |
390 |
645 |
260 |
0.3[c] |
|
|
ST‐3 |
410 |
730 |
995 |
|
|
|
ST‐4 |
425 |
730 |
900 |
0.2[d] |
200[f] |
|
ST‐5 |
448 |
775 |
1250 |
|
300[g] |
[a] No solvent reported, [b] measured via TPEF technique, [c] at 600 nm, 5 ns pulses, [d] at 730 nm, 5 ns pulses, [e] power threshold Pth, [f] at 730 nm and [g] at 800 nm.
The energy thresholds of ST‐1 and ST‐6 were compared to the commercially available UV photo initiators like 1‐[4‐(methylthio)phenyl]‐2‐methyl‐2‐morpholinopropan‐1‐one (Irgacure 907, I907, further discussed in Chapter 6.). For I907 a Eth of 1.0 mJ was measured whereas ST‐1 and ST‐2 were more photosensitive with an Eth of 0.3 mJ. While I907 exhibit a σTPA value lower than 10 GM, the D‐π‐D structures reveal a much higher value because of their electron richness.
Fabrication tests with the initiators ST‐4 and ST‐5 showed that these compounds, besides ST‐1 and ST‐2, were able to initiate polymerization under two‐photon conditions. Figure 63 displays fabricated cantilevers with 0.1 % stilbene based photo initiator and 70 % of reactive trifunctional acrylate monomer Sartomer SR9008 and SR368, and 29.9 % poly(styrene‐co‐acrylonitrile) (75 : 25).
Figure 63.
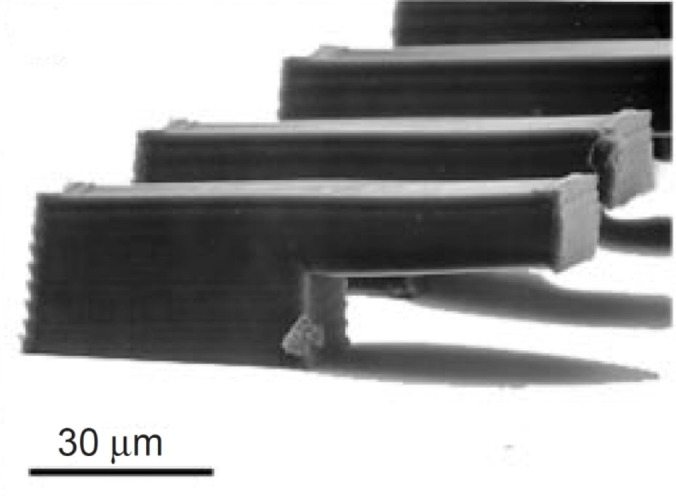
2PP fabricated cantilevers with one of the stilbene based 2PI. [9] Adapted with permission from Ref. [9]. Copyright 1999, Springer Nature.
Because of their electron richness, triphenyl‐ or triarylamino motifs are very interesting compounds for the design of new molecules in two photon applications. The structure of TP‐1 (Figure 64) shows a biphenyl connection between two triphenylamines substituted with one methoxy group on each end.[ 129 , 130 ] Although, TP‐1 exhibits a lower σTPA value compared to other biphenyl centered 2PIs (Table 25) fabrication in a monomer mixture containing 70 % tris(2‐hydroxyethyl)isocyanurate triacrylate and 27 % polymer binder poly(styrene‐co‐acrylonitrile) (75/25) with 3 % of TP‐1 as initiator was possible. By fabrication of polymer lines the energy threshold of TP‐1 was determined to be 136 J/cm2. While nowadays the energy threshold is reported in mW (W=J/s) Martineau and a few other authors reported their results unconventionally in mJ/cm2 , which makes the comparison to other 2PIs difficult.[ 129 , 130 , 131 , 132 , 133 ] Compared to TP‐1 the structure of BTSBP reveals an extended π‐system. [131] By introducing more π‐electrons to the structure, the σTPA is strongly increased to 892 GM (TP‐1 30 GM). However, the σTPA values were obtained with two different techniques, which makes a comparison difficult. Polymerization tests in PETA with 0.4 % BTSBP showed a polymerization threshold of 150 J/cm2 and a burning threshold of 1600 J/cm2 (Table 25).
Figure 64.

Schematic representation of the structures of 2PIs bearing triphenylamine moieties and biphenyl centers and the 2PA dye DPAMOB.
Table 25.
Photophysical data and process parameters of the biphenyl centered 2PIs and DPAMOB.
|
Compound |
λabs [nm] |
Φfl |
σTPA [GM] |
Eth [J/cm2] |
Pth [J/cm2] |
EDamage [J/cm2] |
|---|---|---|---|---|---|---|
|
TP‐1 |
349[a] |
|
30[d] |
136[g] |
|
2500 |
|
BTSBP |
431[b] |
|
892±231[e] |
|
150[h] |
1600[h] |
|
DPAMOB |
423[c] |
0.96 |
1007[e] |
|
|
|
|
BDEVB |
380[a] |
|
87,500[f] |
|
|
|
|
BDPVB |
385[a] |
|
100,900[f] |
|
|
|
|
BDBVB |
389[a] |
|
100,990[f] |
|
|
|
|
BMHVB |
342[a] |
|
115,700[f] |
[a] Measured in dichloromethane, [b] measured in toluene, [c] measured in a doped PMMA block, [d] measured via up‐conversion fluorescence, [e] measured via TPEF‐method, [f] measured via Z‐scan method, [g] Laser power: 1.8 mW, Beam waist: 1.8 μm, writing speed: 30 to 500 μm/s, [h] Laser power: 270 μW, Laser wavelength: 800 nm.
Similar to BTSBP, Gan et al. synthesized four different 2PIs with a biphenylic core and different aminoalkyl substituents (Figure 64). [134]
All Initiators exhibit a linear absorption maximum at around 400 nm with exception of BMHVB with an absorption maximum of 342 nm (Table 21). This can be explained by the ethylhydroxy substituent, because its donor ability is smaller, the absorption undergoes a hypsochromic shift. The Z‐scan measurement revealed for all initiators a large σTPA value. One should mention that the initiator with the highest σTPA value, BMHVB, interestingly is also the one, which structure contain the substituents with the lowest donor strength. Polymerization tests using bisphenyl A epoxide dimethylacrylate as monomer and 0.5 % 2PI showed that all four 2PIs induce polymerization of the acrylate monomer. Figure 65 shows a fabricated micro‐grid using BDBVB where each polymer vein has a width of 3 μm and an interval width of 10 μm. Unfortunately, the authors did not report any energy, polymerization or burning threshold.
Figure 65.

Micro‐grid fabricated with BDBVB as photo initiator. [134] Reproduced with permission from Ref. [134]. Copyright 2009, Springer Nature.
Similar to ST‐4 the initiator DPAMOB uses a methoxy substituted distilbene core but with terminal diphenylamino substituents. [135] It has a linear absorption maximum of 423.5 nm in toluene and shows no further absorption above 500 nm. The single‐photon induced emission spectrum excited with 420 nm, obtains two peaks at 479 nm and 521 nm. The fluorescence quantum yield was determined to be 0.96 for DPAMOB with coumarin 307 as reference. The σTPA value of DPAMOB was measured via TPEF in toluene and a cross‐section of 1007.2 GM was obtained. Fabrication tests with the oligomer SR454 and 0.5 % of the initiator showed successfully fabricated lines at 800 nm with a writing speed of 50 μm/min and a laser power of 50 mW.
The photo initiators PVBB and DPVBB represent two initiators with a modified triphenylamine structure (Figure 66). [136] The linear absorption in p‐xylene revealed a maximum at 381 nm for PVBB, while for the disubstituted DPVBB a small bathochromic shift to 393 nm was measured. Fluorescence quantum yield was determined by the comparison to coumarin 307. PVBB shows a fluorescence quantum yield of 0.55 and DPVBB 0.14, both in p‐xylene. By changing the solvent to methanol, the fluorescence quantum yield is strongly decreased to 0.15 and 0.041, which can be explained with the increased polarity and the twisted intramolecular charge transfer (TICT). According to the TICT model, by increasing the solvents polarity the energy level of the charge‐transfer state is lowered. This causes not only a red shift of the fluorescence peak, but also a rapid nonradiative transition to triplets. In turn this results in a decrease of the fluorescence quantum yield. The two‐photon cross‐section was determined via TPEF, and shows 12.9 GM for PVBB and 63.3 GM for DPVBB in p‐xylene (c=1×10⁻² mol/L).
Figure 66.

Schematic representation of the structures of PVBB and DPVBB.
To evaluate the polymerization properties of the two initiators the polymerization rates (Rp) were compared. The Rps were determined by a method established by Youmei et al. with SR454 (ethoxylated trimethylolpropane triacrylate) as monomer and 0.6 % of initiator. [111] For DPVBB the Rp was 471 μm3/s and 180 μm3/s for PVBB. With a higher σTPA‐value and lower fluorescence quantum yield it is not surprising that DVPBB has a higher photosensitivity along with a higher RP.
Similar to 2BTrz and 3BTrz (Chapter 2.6.) Arnoux et al. synthesized two new initiators bases on an oligo(phenylene−ethynylene) structure. The structures show a two branched quadropolar (V‐Shape) and three branched octapolar (Oct) structure (Figure 67). [137]
Figure 67.

Schematic representation of the structures of the two‐branched (V‐Shape) and the three‐branched (Oct) 2PIs.
The linear absorption spectra in dichloromethane revealed that both compounds exhibit the same absorption maxima at 386 nm. However, the measured fluorescence quantum yields differ around 10 %, showing a quantum yield of 66 % for V‐Shape and 79 % for Oct. This difference becomes even larger for the σTPA values. z‐scan measurements at 532 nm revealed a more than two times higher two‐photon cross‐section for V‐Shape, with 1500±200 GM compared to Oct with 740±150 GM. Polymerizations were performed in a monomer mixture consisting of 20 wt% 1,10‐decanediol diacrylate (DDA) and 80 wt% dipentaerythriol penta‐/hexa‐acrylate (DPPHA). V‐Shape was used in a 1 wt% concentration, while Oct was used in a concentration of 0.66 wt% due to its poor solubility in the formulation. For the determination of Pth polymer lines were fabricated with different laser powers. The polymerization thresholds for V‐Shape and Oct were 120 μW and 90 μW, respectively. Unfortunately, the authors do not report a fabrication window for the 2PIs.
3.2. Fluorene derivatives
The fluorene core provides a larger electron delocalization because of the increased π molecular orbital overlap, compared to the diphenylic core systems. This structural feature enhances the molecular polarity and by increasing the planarity leads to an optimized charge transfer.[ 138 , 139 ]
Martineau et al. investigated the influence of the fluorenyl core in comparison to the biphenylic core structure.[ 129 , 130 ] The structure containing the fluorenyl core (FL‐1, Figure 68) shows a bathochromically shifted absorption maximum compared to the structure with the biphenylic core (TP‐1, Figure 64, Table 24 & 25). 2PA spectra were measured by up‐conversion fluorescence measurement and the σTPA value was determined using 1,4‐bis(2‐methylstryryl)benzene as reference.[ 140 , 141 ] The fluorenyl structure of FL‐1 exhibit a more then two times higher σTPA value compared to the biphenylic structure of TP‐1. This result is in good agreement with an increased charge transfer due to the higher planarity in the fluorenyl core. Threshold energies of the two 2PIs were determined by fabrication of line arrays with different writing speeds. Polymerization was performed with a monomer mixture of 70 % tris(2‐hydroxyethyl) isocyanurate triacrylate, 27 % poly(styrene‐co‐acrylonitrile) (75/25) as polymer binder and 3 % of the initiator. FL‐1 revealed an energy threshold of 95 J/cm2, showing a higher photosensitivity then TL‐1 with 163 J/cm2. Both of the initiators showed a damage energy of 2500 J/cm2.
Figure 68.

Schematic representation of the structures of the fluorenone based 2PIs F(PHT)2 , F(TPA)2 , FL‐1 and FL‐2.
By altering the terminal substituents with an electron donating (triphenylamine) and an electron withdrawing (phthalimide) group Fitilis et al. investigated the 2PIs F(TPA)2 and F(PHT)2 .[ 142 , 143 , 144 ] Different to FL‐1 the terminal end groups in the structures of F(TPA)2 and F(PHT)2 were linked to the fluorene core by a double bond bridge (Figure 68). The linear absorption maximum showed that triphenyl amine containing F(TPA)2 is higher redshifted compared to the phthalimide containing F(PHT)2 . Both 2PIs reveal a larger σTPA value compared to FL‐1 (Table 26). Polymerization tests were performed with bisphenol A ethoxylate diacrylate as monomer and 0.12 wt% of the initiator and revealed a polymerization threshold of 5.6 mW and 3.2 mW for F(PHT)2 and F(TPA)2 , respectively. The threshold was further decreased by adding the co‐initiator 2,6‐diisopropyl‐N,N‐dimethylaniline. Fitilis et al. considered that the rate of the free radical polymerization is not only depending on the σTPA value and the fluorescence quantum yield, but also the radical generation quantum yield as well as the initiation efficiency of the generated radicals are important. [142] To initiate polymerization with such types of photo initiators it is know that an electron transfer must occur after the TPA. [9] In the case of F(TPA)2 the electron donating substituent makes the molecule more chemically active compared to F(PHT)2 .
Table 26.
Photophysical data and process properties of the 2PIs containing a fluorenyl core.
|
Compound |
λabs [nm] |
Φfl |
σTPA [GM] |
Eth [J/cm2] |
Pth [mW] |
EDamage [J/cm2] |
|---|---|---|---|---|---|---|
|
FL‐1 |
374[a] |
|
80[d] |
95 [g] |
|
2500[g] |
|
FL‐2 |
400[b] |
|
470[e] |
|
|
|
|
F(PHT)2 |
378[c] |
0.36 |
835[f] |
|
5.6 [h] |
|
|
F(TPA)2 |
447[c] |
0.65 |
243[f] |
|
3.2 [h] |
[a] Measured in dichloromethane, [b] the authors did not provide the solvent, [c] measured in THF [d] measured via up‐conversion fluorescence, [e] determination method not stated, [f] measured via TPFE in THF at 800 nm, [g] Laser power: 1.8 mW, Beam waist: 1.8 μm, Writing speed: 30 to 500 μm/s, and [h] Laser power: 270 μW, Laser wavelength: 800 nm.
Park et al. developed the initiator FL‐2 with a similar structure to F(TPA)2 (Figure 68). [145] The linear absorption of FL‐2 reveals a maximum of around 400 nm and the two‐photon cross‐section at 780 nm shows a σTPA value of 470 GM (the solvent and method of σTPA determination not reported). The performance of FL‐2 was tested in a concentration of 0.1 wt% with SCR resin (urethane acrylate mono‐ and oligomers). To produce a 2D‐micro object out of a bitmap image, raster graphics type voxel matrix scanning (VMS) was used. Figure 69 displays an array of voxels with 200 nm diameter using this VMS technique.
Figure 69.

Voxel array fabricated using FL‐2 as initiator with a laser power of 5 mW and an exposure time of 2 ms. [145] Reproduced with permission from Ref. [145]. Copyright 2004, Korean Chemical Society.
Figure 70 shows a fabricated 2D structure and its corresponding bitmap image, proofing that with VMS it is possible to translate a bitmap image to an almost identical 2D micro structure.
Figure 70.

Fabricated micro structure using FL‐2 (B) and its corresponding bit map image (A). [145] Reproduced with permission from Ref. [145]. Copyright 2004, Korean Chemical Society.
In order to develop new and efficient photo initiators Henning et al. reported the first triazole containing photo initiators for use in 2PP. [146] The authors used the copper catalyzed azide/alkyne cycloaddition (CuAAC) reaction for the synthesis, because of its wide use in organic chemistry and high yields. [147] It is also known that the also called “click reaction” was used to synthesize UV photo initiators as well as organic dyes and fluorophores.[ 148 , 149 , 150 ] With this approach the authors created mono‐ and difunctionalized photo initiators with a octanyl modified fluorene core (Figure 71).
Figure 71.

Schematic representation of the structures of the triazole bridged fluorene 2PIs.
From the linear absorption spectra, it is evident that the change from the mono‐ to the disubstituted structure has only a slight influence on the absorption maxima. The maxima also only shift very little if the methyl group is substituted by the phenyl group (Table 27). However, the phenyl substituted 2PIs Ph−Mono and Ph−Bis show generally lower fluorescence quantum yields compared to the methyl substituted ones. But in total the here reported 2PIs show quite high fluorescence quantum yields compared to other photo initiators for 2PP. The two‐photon absorption spectra were measured via TPEF method and revealed that the σTPA values did not differ munch comparing the asymmetrical (Me−Mono, Ph−Mono) and symmetrical (Me−Bis, Ph−Bis) initiators (Figure 72). But overall the phenyl containing 2PIs showed higher σTPA values, which can be attributed to the higher number of π‐electrons.
Table 27.
Photophysical data in toluene and process properties of triazole containing 2PIs.
|
Compound |
λabs [nm] |
Φfl [%] |
FW [mW][a] |
FW [mW][b] |
|---|---|---|---|---|
|
Me−Mono |
340 |
50.8 |
18 to 39 |
14 to 24 |
|
Ph−Mono |
338 |
30.0 |
16 to 40 |
13 to 25 |
|
Me−Bis |
343 |
67.3 |
17 to 31 |
– |
|
Ph−Bis |
352 |
58.3 |
13 to 31 |
– |
[a] Fabrication windows with PEG−Da as monomer, writing speed=20 mm/s, Laser wavelength=780 nm, 2PI concentration 4 mM, [b] Fabrication window with PETA as monomer, writing speed=20 mm/s, Laser wavelength=780 nm, 2PI concentration 4 mM.
Figure 72.
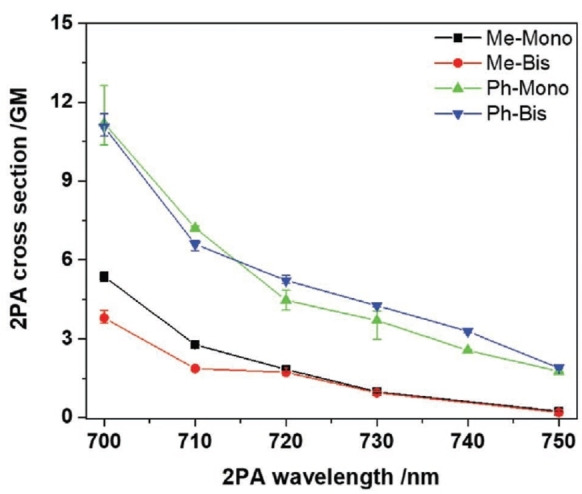
Two‐photon absorption spectra for the triazole containing fluorene 2PIs. [146] Adapted with permission from Ref. [146]. Copyright 2020, John Wiley and Sons.
For the determination of the fabrication windows arrays of small cubes (5×5×5 μm) were fabricated with two different monomers, PEG‐DA and PETA. All initiators were able to initiate polymerization in PEG‐DA, although Me−Bis and Ph−Bis showed poor solubility. Ph−Mono was performing best. The polymerization tests in PETA revealed lower polymerization thresholds compared to PEG‐DA, which indicate that PETA needs lower laser power to polymerize. However, the FW in PETA were narrower compared to the ones in PEG‐DA. For Me−Bis and Ph−Bis no fabrication window was determined because of solubility problems.
For comparison complex 3D structures in form of buckyball domes were fabricated with all of the 2PIs (Figure 73). The structures fabricated with Me−Bis and Ph−Bis show collapsed structures, due to the poor solubility of the photoinitator. More stable structures were obtained with Me−Mono and Ph−Mono, with a stable top part of the dome. Thus, making Me−Mono and Ph−Mono promising candidates for 2PP.
Figure 73.

SEM images of complex 3D structures in form of a buckyball dome fabricated with the triazole containing fluorine based 2PIs. [146] Adapted with permission from Ref. [146]. Copyright 2020, John Wiley and Sons.
3.3. Anthracene derivatives
Anthracene derivatives have been widely investigated as UV photosensitizers or ‐initiators.[ 151 , 152 ] TPA properties of molecules containing anthracene as a central π‐system were thoroughly investigated by several groups.[ 153 , 154 , 155 , 156 ] Yang et al. synthesized serval anthracene derivatives, investigated and compared them to known TPA dyes. [157] The authors were able to synthesize anthracene derivatives with an σTPA value up to 2490 GM and also showed that the overall TPA properties increased by changing the phenyl center to an anthryl one. [157]
Xing et al. synthesized three 2,7‐substituted anthracene derivatives (Figure 74) and investigated their ability as photo initiators in two‐photon polymerization.[ 132 , 133 ]
Figure 74.

Schematic representation of the structures of the anthracene based photo initiators AN‐1 to AN‐3 synthesized by Xing et al.
Table 28 summarizes the influence of a strong electron donating substituent (AN‐1) to a weak (AN‐2) and an electron withdrawing group (AN‐3). Compared to AN‐1 with its N(CH3)2 groups, AN‐2 and AN‐3 show a hypsochromic shift in the absorption maxima. Interesting about that is that AN‐2 with a weak electron donating group reveals a larger hypsochromic shift compared to AN‐3 with a nitrile group. The fluorescence quantum yield measurement shows that AN‐3 has the largest yield, AN‐2 the second largest and AN‐1 the smallest. The TPEF measurement revealed that AN‐1 has the largest value with 466 GM, followed by AN‐3 with 121 GM and at last AN‐2 with 78 GM. This strong enhancement of the σTPA value of AN‐1 is mainly attributed to the strong electron donating groups, since it leads to a large intramolecular charge transfer (ICT).
Table 28.
Photophysical properties of AN‐1 to AN‐3 in CHCl2.
|
Compound |
λmax [nm] |
Φfl |
2λmax [nm] |
σTPA [GM][a] |
|---|---|---|---|---|
|
AN‐1 |
396 |
0.17 |
750 |
466 |
|
AN‐2 |
347 |
0.36 |
700 |
78 |
|
AN‐3 |
355 |
0.22 |
700 |
121 |
[a] Measured via TPEF.
Polymerization tests were performed with methacrylic acid (MAA) as monomer and dipentaerythritol hexaacrylate (DEP‐6 A) as crosslinker. The laser wave length was set to 800 nm and the writing speed was 10 μm/s.
AN‐1 reveals the lowest polymerization threshold as well as the 2PP threshold (Eth) of all the tested initiators (Table 29). The sensitivity of the initiators follows the order AN‐1>AN‐2>Benzil>AN‐3. Line arrays of the polymerization tests are displayed in Figure 75.
Table 29.
Resin formulations and photopolymerization data of AN‐1 to AN‐3 compared to the common used 2PI Benzil.
|
2PI |
MAA [wt %] |
DPE‐6 A [wt %] |
MR [%][a] |
Pth [mW][b] |
Eth [mJ/cm2][c] |
|---|---|---|---|---|---|
|
AN‐1 |
66.47 |
32.59 |
0.18 |
0.64 |
2.77×10⁷ |
|
AN‐2 |
66.53 |
32.61 |
0.18 |
1.60 |
6.93×10⁷ |
|
AN‐3 |
66.50 |
32.61 |
0.18 |
8.37 |
3.56×10⁸ |
|
Benzil |
66.89 |
32.80 |
0.18 |
6.37 |
2.82×10⁸ |
[a] Molar ratio of initiator in resin, [b] threshold power of the initiator in resin and [c] exposure intensity at threshold power.
Figure 75.

SEM pictures of fabricated line arrays using (a) AN‐1, (b) AN‐2, (c) AN‐3 and (d) Benzil. [132] Reproduced with permission from Ref. [132]. Copyright 2012, Royal Society of Chemistry.
To investigate the influence of the concentration of the 2PI on the polymerization threshold several resin formulations with AN‐1 as initiator were prepared (Table 30). The results show that a lower concentration of AN‐1 results in a higher Pth, which indicates a fewer generated radicals. In addition, the dependence of the polymerization threshold to the writing speed (10 to 1000 μm/s) was investigated using the resin formulation R1 . By increasing the writing speed, the exposure time was decreased from 40 ms (10 μm/s) to 0.4 ms (1000 μm/s) and the Pth increased from 0.64 to 2.53 mW.
Table 30.
Polymerization and 2PP thresholds at different concentrations of AN‐1.
|
Resin |
MAA [wt %] |
DPE‐6 A [wt %] |
MR [%][a] |
Pth [mW][b] |
Eth [mJ/cm2][c] |
|---|---|---|---|---|---|
|
R1 |
66.47 |
32.59 |
0.18 |
0.64 |
2.77×10⁷ |
|
R2 |
66.78 |
32.75 |
0.09 |
1.01 |
4.37×10⁷ |
|
R3 |
66.94 |
32.82 |
0.045 |
1.60 |
6.93×10⁷ |
|
R4 |
67.02 |
32.86 |
0.023 |
2.02 |
8.74×10⁷ |
|
R5 |
67.06 |
32.88 |
0.012 |
5.06 |
2.19×10⁸ |
[a] Molar ratio of initiator in resin, [b] threshold power of the initiator in resin and [c] exposure intensity at threshold power.
3.4. Water‐soluble photo initiators with a D‐π‐D structure
Although D‐π‐A‐π‐D chromophores show great potential, other structural chromophores, like D‐π‐D structures, also have been successfully used as water‐soluble initiators. WSPI is a D‐π‐D chromophore, which has a distyrylbenzene core with terminal amino alkyl groups (Figure 76). Frist synthesized by Woo et al. [158] as a TPA chromophore WSPI was later used as a water‐soluble photo initiator in 2PP by the group of Liska et al.[ 159 , 160 ]
Figure 76.

Schematic representation of the structure of WSPI.
WSPI exhibits a linear absorption maximum at 423 nm and a σTPA value of 360 GM measured with the TPEF method at 730 nm. [158] The fluorescence quantum yield was determined to be 0.40 for WSPI with fluorescein and 9,10‐diphenylanthracene as references.
Stampfl et al. were able to fabricate successfully hydrogel structures with WSPI as 2PI and PEGda (700 Da) and embed the living organism Caenorhabditis elegans into a scaffold during 2PP structuring. [159] Therefore, several test structures were fabricated to investigate the fabrication window of this monomer/2PI system. Two formulations were tested, both of them with a 2PI concentration of 2 wt%, one with a water content of 50 wt% and the second with 80 wt%.
Intact structures were obtained at 60 mW at 1 mm/s, 100 mW at 4 mm/s, 140 mW at 7 mm/s, and 220 mW at 10 mm/s, respectively (Figure 77). By increasing the water content to 80 wt% the polymerization threshold shifts to higher laser powers and the threshold for the writing speed is reduced. Polymerization at 300 mW and 10 mm/s occurred but a stable structure was not obtained. [159] Besides PEGda as monomer, fabricating structures from a binary monomer mixture consisting of gelatin hydrolysate vinyl esters (GH‐VE) and reduced derivatives of bovine serum albumin was achieved with WSPI as 2PI. [160]
Figure 77.

Woodpile structures of PEGda with WSPI as photo initiator at a water content of 50 wt%. The laser power range was 10 to 300 mW (Δ=40 mW) and the writing speed was 1 to 10 mm/s (Δ=3 mm/s). [159] This image was adapted with the permission of the publisher and the authors of Ref. [159]. Copyright 2012, SPIE.
For a long time aryl diazosulfone compounds are known to initiate free radical polymerization under thermal conditions, forming phenyl‐ and sulfonyl‐based radicals. [161] Although such initiators have not been used in 2PP, some exhibit a strong absorption within the visible range. Therefore, an absorption under two‐photon conditions around 800 nm was assumed. On this basis the water‐soluble initiator DAS (Figure 78) was developed. [162]
Figure 78.

Schematic representation of the structure of DAS.
DAS exhibits a linear absorption maximum at 370 nm in water, which is strongly blue shifted in comparison to the literature known initiator P2CK (507 nm, Figure 52). This strong shift of DAS is due to the absence of electron donating groups and by the electron withdrawing ability of the azosulfones. To determine the two‐photon cross‐section the white light continuum (WLC) Z‐scan method, developed by Ajami et al., was used. [163] It shows a σTPA value of 40 GM and 140 GM for DAS and P2CK, respectively. Fabrication tests of DAS and P2CK with gelatin methacrylamide revealed that, although DAS has a low σTPA value the polymerization initiation efficiency is high enough. The low σTPA value is compensated by doubling the concentration. The polymerization thresholds for both initiators were tested between 20 to 100 mW laser power and 100 to 1000 mm/s writing speed at different concentrations (Figure 79).
Figure 79.
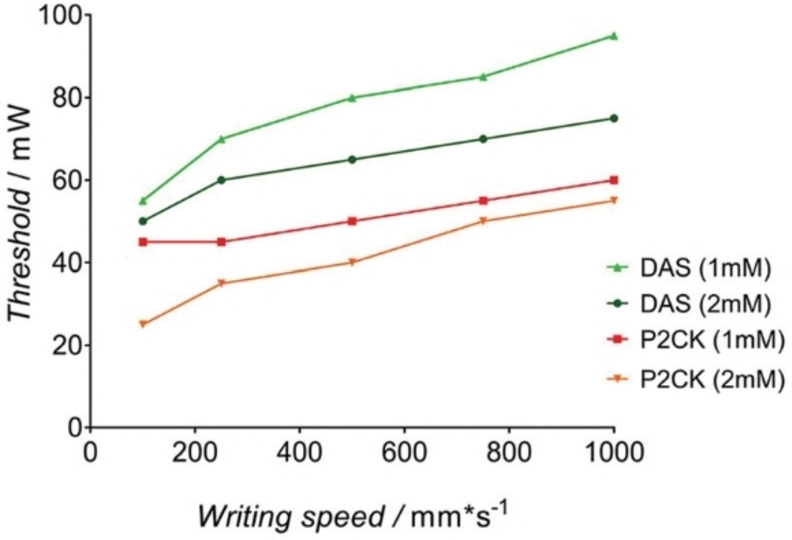
Polymerization thresholds of DAS and P2CK at concentrations of 1 mM and 2 mM. [162] Adapted with permission from Ref. [162]. Copyright 2018, Royal Society of Chemistry.
The tests show that, although P2CK has a lower polymerization threshold, DAS can be used as a suitable photo initiator at higher concentrations. Latter is interesting in particular because cytotoxicity tests using the Presto Blue assay revealed that P2CK reduced the cell viability above a concentration of 0.5 mM immensely (<50 % cell viability). With DAS the cell viability remain also at higher concentrations (>50 % cell viability).
4. A‐π‐D‐π‐A and D‐π‐D‐π‐D Chromophores
Besides the D‐π‐A‐π‐D chromophores, also chromophores with the inverse structure motif A‐π‐D‐π‐A exhibit large σTPA values. But only a limited number of these compounds were investigated as photo initiator for 2PP.
4.1. Carbazole and phenothiazine based initiators
Among these chromophores carbazole based chromophores have been investigated intensively. Figure 80 displays the V‐shaped photo initiators (BAC‐1 to BAC‐4) with carbazole as central core. [110]
Figure 80.

Schematic representation of the structures of V shaped photo initiators based on carbazole.
Compared to the aldehyde derivatives BAC‐1 and BAC‐2, the nitro substituted initiators BAC‐3 and BAC‐4 exhibit very low fluorescence quantum yields. Additional measurements of the fluorescence quantum yield in THF of BAC‐3 and BAC‐4 revealed a slight increase, which results from the difference in contact charge transfer (Table 31). BAC‐1 and BAC‐2 revealed a σTPA value in chloroform of around 300 GM, while BAC‐3 and BAC‐4 showed a value of 645 GM and 916 GM in THF, respectively. Due to the high σTPA values and the low FQ BAC‐3 and BAC‐4 should be promising candidates for initiating 2PP. Polymerization tests were performed with MAA as monomer and DEP‐6 A as crosslinker, at 800 nm laser wavelength and 10 μm/s writing speed.
Table 31.
Photophysical data of the carbazole based photo initiators BAC‐1 to BAC‐4.
|
Compound |
Solvent |
λmax [nm] |
Φfl [a] |
σTPA [GM][b] |
|---|---|---|---|---|
|
BAC‐1 |
CHCl3 |
383 |
0.63 |
337 (730 nm) |
|
BAC‐2 |
CHCl3 |
378 |
0.66 |
308 (730 nm) |
|
BAC‐3 |
CHCl3 THF |
396 390 |
0.005 0.065 |
– 645 (770 nm) |
|
BAC‐4 |
CHCl3 THF |
385 384 |
0.007 0.065 |
– 916 (780 nm) |
[a] Fluorescence quantum yield determined relative to coumarin 307. [b] TPEF measurement. The numbers in parentheses are the wavelengths of the maximum TPA.
As displayed in Table 32 the polymerization thresholds of the initiators are quite different. BAC‐1, with a Pth of 10.11 mW, revealed a much higher threshold compared to the commercial initiator Benzil with a Pth of 6.37 mW. Initiator BAC‐3 shows the third largest Pth, followed by BAC‐2 with 1.60 mW. Due to its high σTPA value and low fluorescence quantum yield compared to the other initiator, BCA‐4 reveals the smallest Pth with 0.80 mW. Therefore, concentration tests with BAC‐4 were performed. The 2PI concentration was decreased from 0.18 wt% to 0.012 wt%. By decreasing the 2PI concentration, the Pth was increasing to a value of 3.20 mW at a 2PI concentration of 0.012 wt%. In addition, the 2PP threshold for different concentrations was calculated, which were for 0.18 wt% and 0.012 wt% values of Eth=3.0×10⁷ and 1.2×10⁸ mJ cm−2.
Table 32.
Polymerization results and formulation conditions for BAC‐1 to BAC‐4 and Benzil as reference.
|
2PI |
MAA [wt %] |
Initiator [wt %] |
DPE‐6 A [wt %] |
MR [%][a] |
Pth [mW] [b] |
|---|---|---|---|---|---|
|
BAC‐1 |
66.62 |
0.72 |
32.66 |
0.18 |
10.11 |
|
BAC‐2 |
66.60 |
0.75 |
32.65 |
0.18 |
1.60 |
|
BAC‐3 |
66.59 |
0.77 |
32.64 |
0.18 |
2.02 |
|
BAC‐4 |
66.57 |
0.80 |
32.63 |
0.18 |
0.80 |
|
Benzil |
66.90 |
0.31 |
32.79 |
0.18 |
6.37 |
[a] Molar ratio of initiator in resin, [b] threshold power of initiator in resin and [c] exposure intensity at threshold power.
Since the resolution of fabricated structures via 2PP is strongly depended on the radicals generated in the focal spot of the laser, a possible way to further enhance the resolution of 2PP is by combining a radical quencher with an existing photo initiator with good initiating properties. Such a chromophore should terminate the photoinduced radicals around the focused spot. Lu et al. developed such a photo initiator (BNMBC) by introducing p‐methoxybenzene (PhOMe, Anisol) into the structure of photo initiator BAC‐4 (Figure 80). [164]
The linear absorption maximum of BNMBC in THF is at 384 nm and is nearly exact the same as for BAC‐4. Although the maxima are quite the same BNMBC exhibit with 0.17 a much larger fluorescence quantum yield in comparison to BAC‐4 with 0.077. Two‐photon cross‐sections were determined by the TPEF as well as the Z‐scan method. σTPA values obtained via TPEF revealed for BNMBC and BAC‐4 a cross‐section of 262 and 500 GM, respectively. Because of the difference in fluorescence quantum yield, an additional measurement with the Z‐scan method was performed. The cross‐sections received from Z‐scan were 2367 and 2285 GM for BNMBC and BAC‐4 respectively, showing that these compounds possess a large σTPA value. Polymerization tests were performed by using MAA as monomer, pentaerythriol triacrylate (PE‐3 A) as crosslinker and the photo initiator systems BAC‐4, BAC‐4/PhOMe (molar ration 1 : 1) and BNMBC. The resin formulations are listed in Table 33.
Table 33.
Resin composition for 2PP polymerization tests.
|
Resin |
2PI |
MAA [wt %] |
Initiator [wt %] |
PE‐3 A [wt %] |
MR [%][a] |
Pth [mW] |
|---|---|---|---|---|---|---|
|
R1 |
BAC‐4 |
80.02 |
0.47 |
19.51 |
0.1 |
|
|
R2 |
BAC‐4/Anisol |
79.95 |
0.57 |
19.49 |
0.1 |
|
|
R3 |
BNMBC |
80 |
0.5 |
19.5 |
0.1 |
|
|
R4 |
BAC‐4 |
80 |
0.1 |
19.9 |
0.02 |
4.02 |
|
R5 |
BAC‐4/Anisol |
80 |
0.1 |
19.9 |
0.02 |
4.82 |
|
R6 |
BNMBC |
80 |
0.21 |
19.9 |
0.02 |
5.53 |
[a] Molar ratio of the initiator.
To investigate whether the intermolecular (BAC‐4/Anisol) or the intramolecular (BNMBC) system performs better at radical quenching, different resins were prepared. Thereby, fibers were fabricated and the obtained heights and widths were compared (Figure 81).
Figure 81.
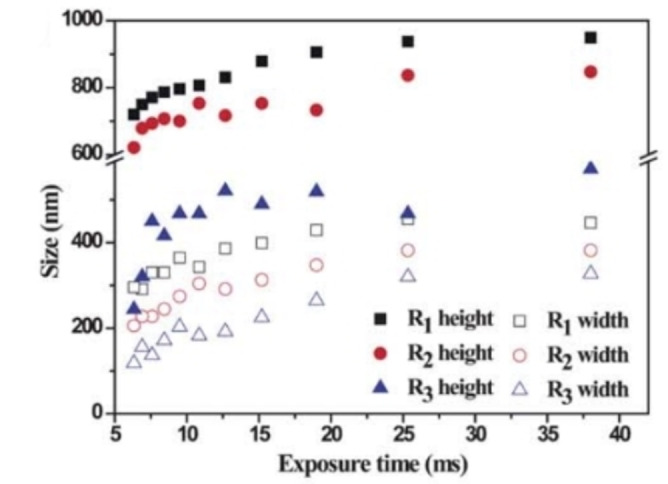
Plot of the fabricated fiber versus the exposure time for the resins R1 , R2 , R3 . The fabrication was performed at a laser power of 3.67 mW. [164] Adapted with permission from Ref. [164]. Copyright 2011, Royal Society of Chemistry.
From the plot is evident that the heights and widths are decreasing from R1 to R3 , what means that BNMBC has a higher radical quenching effect than the BAC‐4/PhOMe system in R2 . In the resin with BNMBC an intramolecular quenching of radicals during the polymerization takes place, while the bimolecular system BAC‐4/PhOMe acts in an intermolecular way, which is much slower compared to the intramolecular process. Similar results were obtained by decreasing the molar ratio of the initiator system to 0.01 %. The polymerization thresholds were investigated with a higher concentration of the initiators, resulting in 4.02, 4.28 and 4.53 mW for R4 , R5 and R6 respectively. Despite the small differences in the σTPA values BNMBC shows a similar polymerization initiating efficiency comparable to BAC‐4. In addition, BNMBC revealed radical‐diffusion control due to the p‐methoxybenzyl group. To demonstrate the potential of BNMBC a complex 3D structure in from of a fly was fabricated using R6 as resin. The fabricated fly has a height of 6.47 μm and a width of 17.61 μm and is 20.90 μm long (Figure 82).
Figure 82.

SEM image of a fly fabricated via 2PP using BMNBC as initiator. [164] Adapted with permission from Ref. [164]. Copyright 2011, Royal Society of Chemistry.
Li et al. developed four carbazole based photo initiators using classical aldol‐conditions. The initiators CRB‐1 and CRB‐2 show a A‐π‐D‐π‐A structure, and were compared to CRB‐3 and CRB‐4 which possess a D‐ π‐D‐ π‐D structure (Figure 83). [165]
Figure 83.

Schematic representation of the structures of carbazole based photo initiators CRB‐1 to CRB‐4.
CBR‐1 and CBR‐2 exhibit a linear absorption maximum at 415 nm and 394 nm in chloroform, respectively. Both absorption maxima from CBR‐3 and CBR‐4 reveal a bathochromic shift to 350 nm and 360 nm, respectively (Figure 84).
Figure 84.

UV‐Vis absorption spectra of CBR‐1 to CBR‐4 in CHCl3. [165] Reproduced with permission from Ref. [165]. Copyright 2018, John Wiley and Sons.
The two‐photon cross‐sections were measured using open aperture Z‐scan analysis at 800 nm in DMSO. Both CBR‐3 and CBR‐4 show a relatively low σTPA value of 20 and 18 GM, respectively. On the other hand, the σTPA value increases by a factor of 10 when the terminal donor groups are exchanged by acceptor groups like nitro or nitrile groups. Therefore CBR‐1 and CBR‐2 exhibit a value of 280 and 220 GM. This increase is attributed to the ICT which is well‐known to be the “driving force” of the two‐photon absorption process.[ 165 , 166 , 167 ] Fabrication tests were performed with a 1 : 1 mixture of TMPTA and TMP3EOTA resin at 800 nm with a writing speed of 60 μm/s. Y shaped structures were fabricated at different laser powers to evaluate the fabrication windows. Figure 85 displays the fabricated structures using CRB‐4 at different laser powers.
Figure 85.

SEM image of the fabricated Y structures evaluating CBR‐4 as photo initiator, (a) full view of the structures along the laser power gradient and (b)–(d) enlargement of different segments of (a). [165] Reproduced with permission from Ref. [165]. Copyright 2018, John Wiley and Sons.
The fabrication windows for all initiators are displayed in Figure 86. CBR‐2 and CBR‐4 reveal the broadest fabrication windows. Although CBR‐4 has the lowest σTPA value of all, it seems to compensate this disadvantage with its electron richness. As shown in Chapter 3. D‐π‐D chromophores initiate polymerization by electron transfer, [9] it seems that CBR‐4 follows a similar pathway in the initiating polymerization. By introduction of the nitro groups the solubility of CBR‐1 was significantly decreased so that no reasonable results were obtained. These results indicate again that although a high σTPA value is desirable, the initiator efficiency is not only depending on that.
Figure 86.
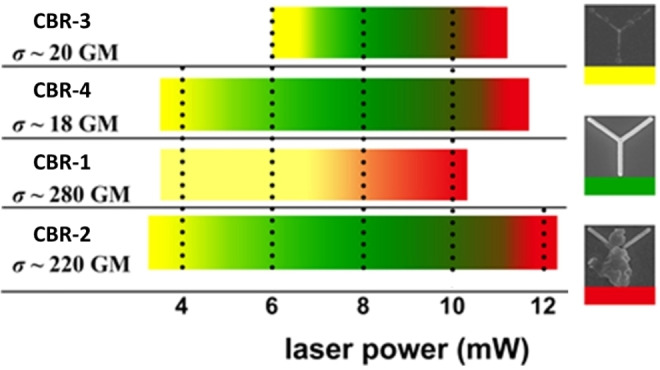
Display of the fabrication windows of the initiators CBR‐1 to CBR‐4. [165] Adapted with permission from Ref. [165]. Copyright 2018, John Wiley and Sons.
Although many neutral compounds have been discussed, there are several research groups which also investigated ionic compounds for their TPA properties.[ 99 , 168 , 169 , 170 , 171 , 172 ] Gu et al. developed carbazole based organic salts with an elongated π‐system. [173] Pyridinium, indolium and benzothiazolium derivatives (BAC‐5 a to e, Figure 87) have also been reported.
Figure 87.

Schematic representation of the structures of BAC‐5(a–e).
The photophysical properties of the different compounds are listed in Table 34. The linear absorption maxima of BAC‐5(a–c) show that the length of the aliphatic chain in the R1 position shifts the absorption maxima only slightly to higher wavelengths. In addition, the impact on the fluorescence quantum yield is only marginal. The σTPA values are high with around 1700 GM but decrease when the pentyl substituent is used. By changing from the pyridinium to either an indolium (d) or a benzothaizolinium (e) substituent the linear absorption shifts to higher wavelengths, while the fluorescence quantum yields and the σTPA decreases.
Table 34.
Photophysical data of the initiators BAC‐5(a–e) in methanol.
|
Compound |
λmax [nm] |
Φfl |
σTPA [GM][a] |
|---|---|---|---|
|
BAC‐5 a |
456 |
0.011 |
1737[c] |
|
BAC‐5 b |
456 |
0.013 |
1740[c] |
|
BAC‐5 c |
458 |
0.013 |
1650[c] |
|
BAC‐5 d |
510 |
0.007 |
474[b][d] |
|
BAC‐5 e |
495 |
0.039 |
151[e] |
[a] Measured via TPEF, [b] measured in glycerol, [c] TPA maximum at 800 nm, [d] TPA maximum at 880 nm and [e] TPA maximum at 840 nm.
From the above‐mentioned photo initiators BAC‐5 c was chosen for further polymerization tests. 0.1 wt% of BAC‐5 c were mixed with 49.9 wt% MAA as monomer and 50.0 wt% DEP‐6 A as crosslinker. The threshold energy of polymerization for BAC‐5 c was calculated by analyzing polymer spots fabricated via single‐spot exposures and a value of 3.0 mW was determined. In addition, a microgrid structure was fabricated using BAC‐5 c with a laser power of 10 mW and an exposure time of 2 ms (Figure 88).
Figure 88.

Microgrid structure fabricated via 2PP using 0.1 wt% BAC‐5 c as 2PI. [173] Reproduced with permission from Ref. [173]. Copyright 2007, Royal Society of Chemistry.
To investigate the influence of the core structure, Li et al. synthesized four different photo initiators, two with a carbazole core and two with a phenothiazine core. [174] In addition, the structures of the initiators showed two different acceptor groups, a thiophen aldehyde and quinoline group, which are linked to the core via triple bond bridges (Figure 89).
Figure 89.

Schematic representation of the structure of the carbazole (CRB‐5 and CRB‐6) and phenothiazine (PHZ‐1 and PHZ‐2) based 2PIs.
In the linear absorption measurement, the compounds revealed that the change of the carbazole to the phenothiazine core shifts the absorptions maxima to higher wavelengths. In addition, also the fluorescence quantum yield of the phenothiazine based initiator are lower in comparison to the carbazole 2PIs, in particular PHZ‐2. From the σTPA values it can be anticipated that the higher donor strength of the thiophen aldehyde group leads to a stronger ICT, which can be seen in the higher σTPA value as well as the red shifted absorption maxima (Table 35). Because of their absorption maxima the 2PIs CRB‐6, PHZ‐1 and PHZ‐2 may be potential candidates to efficiently initiate polymerization at a wavelength at 780 nm, in particular PHZ‐2 with its high σTPA‐value and its low fluorescence quantum yield.
Table 35.
Photophysical data of the carbazole and phenothiazine based 2PIs measured in dichloromethane.
|
Compound |
λabs [nm] |
Φfl [%] |
σTPA [GM][a] |
|---|---|---|---|
|
CRB‐5 |
364 |
84.28 |
– |
|
CRB‐6 |
398 |
51.52 |
198 |
|
PHZ‐1 |
385 |
41.75 |
65 |
|
PHZ‐2 |
419 |
0.86 |
1315 |
[a] Measured via TPEF at 780 nm.
For the polymerization tests all 2PIs were dissolved in TTA and fabrication was performed with different laser intensities and writing speeds. In this report the laser intensity was set to 30 mW which was declared as 100 %. The tests revealed that the thiophen aldehyde containing initiators CRB‐6 and PHZ‐2 successfully initiated polymerization. However, the authors did not report weather CRB‐5 or PHZ‐1 initiate polymerization under the reported conditions. Initiator PHZ‐2 was able to initiate polymerization at higher writing speeds up to 14,000 μm/s at 100 % laser intensity, but with lager deformations of the structure. However, this was avoided by decreasing the writing speed. In comparison CRB‐6 was not able to initiate polymerization at 100 % laser intensity at a writing speed of 1000 μm/s.
Besides the A‐π‐D‐π‐A chromophores Gu et al. also prepared a series of D‐π‐A chromophores with the same donor‐acceptor system but none of them were used in fabrication tests.
Since type I photo initiators generate radicals by α‐cleavage most of the known initiators, especially commercially available UV‐initiators, contain carbonyl groups. However, also oxime esters are other functional groups, which generate radicals under irradiation.[ 175 , 176 ] Hereby, the N−O bond is cleaved thus generating active radials. [177] This is followed by decarboxylation which reduces the probability of recombination of the generated radicals and thus leading to better initiation performance. With this in mind, Hu et al. developed photo initiators with a A‐π‐D‐π‐A structure with a carbazole core containing oxime esters. [178] Besides the initiation properties of the oxime esters, the authors also investigated the influence of the substitution pattern (2,7 and 3,6 position on the carbazole core) as well as the influence on the generated radical by using phenyl and vinyl esters (Figure 90).
Figure 90.

Schematic representation of the oxime ester containing 2PIs with carbazole core.
All four 2PIs reveal a broad absorption band between 250 and 400 nm. The results summarized in Table 36 indicate that the changes in the absorption maximum depending on the substitution pattern is only marginal. However, comparing the derivatives substituted in 3,6‐position (CBR−OXE‐1 & ‐2) to the the ones functionalized in 2,7‐position (CBR−OXE‐3 & ‐4) the molar absorption coefficient (ϵ) is increased. This trend is also visible in the measured two‐photon cross‐sections. The σTPA‐values show an increase when the position of the substituents is changed from 3,6 to 2,7. This can be related to the enhanced absorption properties of CBR−OXE‐1 and ‐2. Steady‐state photolysis experiments revealed that all initiators undergo α‐cleavage at the oxime ester position when irradiated. For 2PP polymerization tests a doughnut shaped structure was fabricated at a writing speed of 750 μm/s and polymerization wavelength of 800 nm with various laser intensities (Figure 91). For this a 1 : 1 mixture of trimethylolpropane triacrylate (TMPTA) and ethoxylated trimethylolpropane triacrylate (TMP3EOTA) with a 2PI concentration of 1.3×10⁻³ mol/g resin was used.
Table 36.
Photophysical data and thermal stability of CBR−OXE‐1 to CBR−OXE‐4.
|
Compound |
λabs [nm][a] |
σTPA [GM][a][b] |
Td [°C][c] |
|---|---|---|---|
|
CRB−OXE‐1 |
377 |
122 |
163 |
|
CRB−OXE‐2 |
377 |
102 |
185 |
|
CRB−OXE‐3 |
371 |
125 |
201 |
|
CRB−OXE‐4 |
371 |
136 |
190 |
[a] Measured in chloroform. [b] Measured via z‐scan at 800 nm. [c] Decomposition temperature.
Figure 91.

(a) Fabrication window of the investigated carbazole 2PIs containing oxime ester moieties and (b) complex 3D‐structure fabricated with CBR−OXE‐4. [178] Adapted with permission from Ref. [178]. Copyright 2020, John Wiley and Sons.
CBR−OXE‐4 exhibits the broadest FW of all four initiators and the lowest polymerization threshold. Comparing CBR−OXE‐1 and ‐2 the vinyl residue seems to have a advantageous influence compared to the phenyl substituent. This may be attributed to the better initiation efficiency of the released vinyl radical in contrast to the phenyl radical. CBR−OXE‐3 showed poor polymerization behavior due to its decreased solubility in the monomer mixture. It is commonly known that UV photo initiators suffer from pot life issues, due to the N−O bond. Thermal stability in the dark is essential for those compounds, therefore the new photo initiators had been investigated by thermal gravimetric analysis (TGA). The results are listed in Table 36 and reveal that the decomposition temperatures (Td) ranges from 160 to 200 °C. Compared to the commercially available UV photo initiator Irgacure OXE01 with a Td of 185 °C the investigated initiators are sufficient for daily storage.
4.2. Triphenylamine based initiators
Based on the work of Prasad et al. and Goodson et al., who reported that triphenylamine‐cored branched structures (TPA‐1) exhibit large TPA cross‐sections,[ 179 , 180 ] Jiang et al. developed several initiators (TPA‐2 to TPA‐6, Figure 92) and evaluated their properties for initiating 2PP. [181]
Figure 92.

Schematic representation of the structures of the tri‐dentrical initiators TPA‐1 to TPA‐6.
UV‐measurements in different solvents revealed that the investigated compounds exhibit solvatochromic behavior. Nearly all of the linear absorption maxima, except the one of TPA‐4, undergo a redshift when the polarity of the solvents is increased. This observation indicates a better stabilization of the excited state in polar solvent compared to the ground state. Table 37 lists the photophysical data of the initiators in toluene and DMF, as well as the two‐photon cross‐sections in DMF. All initiators exhibit their lowest fluorescence quantum yield in ethanol, due to the hydrogen bond interactions between ethanol and the excited state of the molecules.
Table 37.
Photophysical properties of the initiators TPA‐1 to TPA‐6.
|
Compound |
Solvent |
λmax [nm] |
Φfl[a] |
2λmax [nm] |
σTPA [GM][b] |
|---|---|---|---|---|---|
|
TPA‐1 |
Toluene DMF |
379 396 |
0.15 0.06 |
492 536 |
330.8 |
|
TPA‐2 |
Toluene DMF |
387 387 |
0.21 0.10 |
527 |
38.4 |
|
TPA‐3 |
Toluene DMF |
397 387 |
0.57 0.20 |
510 |
57.9 |
|
TPA‐4 |
Toluene DMF |
402 398 |
0.47 0.38 |
522 |
19.8 |
|
TPA‐5 |
Toluene DMF |
387 397 |
0.39 0.16 |
530 |
66.1 |
|
TPA‐6 |
Toluene DMF |
387 388 |
0.03 0.11 |
523 |
19.4 |
[a] Fluorescence quantum yields were determined by comparison to coumarin as standard and. [b] Measured via TPEF.
Using 0.5 wt% TPA‐4 and 99.5 % of the commercial monomer SR349 (ethoxylated bisphenol‐A dimethacrylate) a microgrid structure was fabricated at 780 nm laser wavelength, 500 μW laser power and a writing speed of 50 μm/s (Figure 93). The distance between the fabricated lines is about 10 μm.
Figure 93.

Optical micrograph of the microgrid fabricated with SR349 and 2PI TPA‐4. [181] Reproduced with permission from Ref. [181]. Copyright 2007, Royal Society of Chemistry.
In search of new potential initiators with low fluorescence quantum yields Whitby et al. investigated branched triphenylamine derivates with aromatic ketones. [182] The carbonyl groups of the aromatic ester have two advantages: 1. They act as strong electron acceptors and 2. are efficient spin‐orbit coupling agents, which promote intersystem crossing.[ 46 , 183 , 184 ] In addition, the influence of the degree of substitution of the triphenylamine derivatives (Figure 94) was investigated.
Figure 94.

Schematic representation of the structures of the different branched initiators TPA‐7 to TPA‐9.
The linear absorption maxima of the three derivatives show, that by increasing the degree of substitution the absorption maxima are red shifted, indicating a stabilization of the ICT. From TPA‐7 to TPA‐8 the shift is larger than compared to from TPA‐8 to TPA‐9, suggesting that the third substituent does not have a strong stabilizing effect on the ICT (Table 38). However, the structures containing more than one substituent (TPA‐8 and TPA‐9) exhibit a drastically lower fluorescence quantum yield. This decrease of fluorescence quantum yield is well‐known in literature. [185] The σTPA values reveal a linear increase with increasing number of substituents. The increase is 232 GM per substitution. This “branching effect” of multibranched triphenylamine derivatives is well reported in the literature.[ 26 , 186 ]
Table 38.
One‐ and two‐photon photophysical properties of the initiators TPA‐7 to TPA‐9.
|
Compound |
Solvent |
λmax [nm] |
Φfl[a] |
σTPA [GM][b] |
|---|---|---|---|---|
|
TPA‐7 |
Methanol |
384 |
0.198 |
126[b] |
|
TPA‐8 |
Methanol |
404 |
0.021 |
358[b] |
|
TPA‐9 |
Methanol |
410 |
0.019 |
590[b] |
[a] Fluorescence quantum yields were determined by comparison to quinine bisulfate as standard and [b] Measured by open Z‐scan method at 780 nm in CHCl3.
Polymerization tests were performed with the acrylate resin (50 : 50 wt% SR415/SR351) at 800 nm laser wavelength, 50 μm/s writing speed and different laser intensities. Figure 95 displays the fabrication windows for the 2PIs at different laser powers with a color code displaying the integrity of the fabricated structures.
Figure 95.

Fabrication windows of TPA‐7 to TPA‐9 at 50 μm/s writing speed. [182] Reproduced with permission from Ref. [182]. Copyright 2017, Royal Society of Chemistry.
The obtained polymerization thresholds at 50 μm/s writing speed were 45 μW, 61 μW, and 27 μW for TPA‐7, TPA‐6 and TPA‐9, respectively. From Figure 96 one can see that good structures were obtained for TPA‐7 at about 40 to about 150 μW. For TPA‐8 the window starts at about 50 μW and goes up to 160 μW. Although TPA‐9 reveals the lowest polymerization threshold, it exhibit the smallest FW from about 20 to 100 μW. An example of an excellent fabricated structure is displayed in Figure 96.
Figure 96.
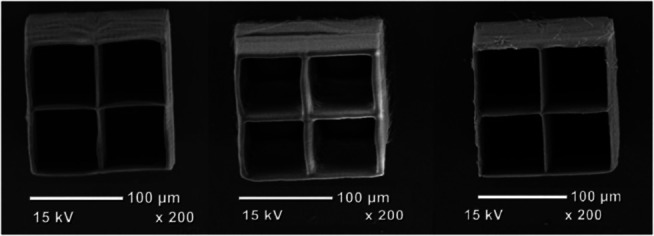
SEM images showing fabricated structures produced via 2PP (from left to right with the initiators TPA‐7 to TPA‐9). [182] Reproduced with permission from Ref. [182]. Copyright 2017, Royal Society of Chemistry.
4.3. Water‐soluble photo initiator with A‐π‐D‐π‐A structure
Zheng et al. were able to develop a new water‐soluble photo initiator system by the host‐guest method as mentioned before. [187] Hereby a complex consisting of vinylpyridine substituted carbazole BMVPC (guest) with a A‐π‐D‐π‐A structure and cucurbit[7]uril CB7 (host) was established (Figure 97). Cucurbit[n]urils are known for their ability to incorporate neutral and cationic molecules. [188]
Figure 97.

Schematic representation of the structures of BMVPC as the guest, and CB7 as the host.
The linear absorption spectrum of pure BMVPC in water exhibits a maximum at 418 nm, which shifts to 471 nm by adding CB7 to the solution. The addition does not affect the absorption, which indicates the non‐covalent interaction of BMVPC and CB7. The successful incorporation of BMVPC into CB7 was proven by isothermal titration calorimetry, which revealed that the host‐guest complexation represents an exothermic process with a calculated free Gibb's energy of −32.9 kJ/mol. The addition of CB7 also had a second effect, which is the enhancement of the fluorescence quantum yield of BMVPC. Within the host‐guest complex with a 10‐fold amount of CB7 the fluorescence of BMVPC enhances to Φfl=0.0463. By restricting the torsional motion of biscyanines through the inclusion interaction, the nonradiative decay is inhibited thus enhancing the fluorescence quantum yield. The measured 2PA spectra in water via TPEF revealed a σTPA value of 613 GM and 2999 GM for BMVPC and the BMVPC/CB7 (1 : 10) complex, respectively. The increase of the cross‐section by a factor of 4.9 is due to the change of the intramolecular charge transfer (ICT) by the interaction between BMVPC and CB7. [189] Fabrication tests with PEGda as monomer revealed that the 2PI complex exhibits a polymerization threshold of 4.5 mW at a writing speed of 10 μ/s and at a laser wavelength of 780 nm. It was possible to construct lines with small structural deformation with a width of 180 nm. A hexagonal grid scaffold was fabricated using those conditions for biological investigations (Figure 116a/b). HeLa cells were co‐incubated with the fabricated scaffold for 48 h and were afterwards stained with the mitochondrial dye MitoTracker™ Deep Red. Figure 98c shows the confocal fluorescence image of the stained cells. The scaffolds with good mechanical performance were noncytotoxic and the cells maintained their morphology. These results indicate that the fabricated scaffolds display good biocompatibility and low cytotoxicity.
Figure 116.

Schematic representation of the structure of Irgacure TPO−L.
Figure 98.

(a) Top view of the SEM image of the hexagonal grid scaffold fabricated using the BMVPC/CB7 complex. (b) Tilted view in the hexagonal grid scaffold. (c) Confocal fluorescence image of the stained HeLa cells and (d) bright‐field image. [187] Reproduced with permission from Ref. [187]. Copyright 2019, American Chemical Society.
5. D‐π‐A Chromophores
α,β‐Unsaturated ketones like benzylidene cycloalkanes (Chapter 2.2.) are well‐known for their good modifiability and large σTPA values. In those D‐π‐A‐π‐D systems mostly ketones are used as strong electron withdrawing groups, which are required to reach large σTPA values. Based on the work of Lalevée et al., who worked on 1,3‐diketone‐based photo initiators for cationic‐ and UV photopolymerization, Nazir et al. developed D‐π‐A structured photo initiators with 1,3‐diketones as a strong electron withdrawing groups (Figure 99).[ 61 , 190 , 191 , 192 ] The 1,3‐diketone group has the advantages of broadening the absorption spectrum, therefore adjusting the laser wavelength for 2PP if necessary. Also, those structures show a decrease of fluorescence quantum yield, which is favorable in 2PP.[ 61 , 192 ] In addition, Nazir et al. combined two large π‐system bridged by a double‐ or triple‐bond to the central anthracene core system.
Figure 99.

Schematic representation of the structures of the 1,3‐diketone based photo initiators DA‐1 to DA‐4.
The cyclohexane‐1,3‐diketone based 2PIs DA‐1 and DA‐3 show a blue shift compared to the indene‐1,3‐diketone based DA‐2 and DA‐4 (Table 39). While the structures containing the cyclohexane‐1,3‐diketone (DA‐1, DA‐3) reveal only a marginal shift in the absorption spectrum by changing from the C−C double bond bridge, the indene‐1,3‐diketones experience a much larger shift (DA‐2, DA‐4). All fluorescence quantum yields were in general below 0.1 % except DA‐3 with a yield of 1.01 %. This is in good agreement with the theory that 1,3‐diketones reduce the fluorescence quantum yield as mentioned before. The Z‐scan measurements show that the 2PIs with the indene moiety possess larger σTPA values compared to the ones with the cyclohexane moiety. Also, the structures equipped with the triple bond exhibit a large σTPA value compared to the ones with a C−C double bond. In addition, the two‐photon cross‐sections were measured via TPEF to investigate how reliable this technique works for compounds with low fluorescence quantum yields. Because the TPEF method compares the TPA emission spectrum with a reference, a low or even zero fluorescence results in a large error. Therefore, the σTPA values from Z‐scan and TPEF vary extremely. In case of DA‐4 the σTPA value could not be measured by TPEF because of the low fluorescence quantum yield, showing that the Z‐scan method is the technique of choice for those compounds. Polymerization tests were performed with a hybrid material consisting of MAPTMS, MAA and ZOP, and the fabrication windows of the 2PIs at 800 nm were determined (Figure 100).
Table 39.
Photophysical properties of the photo initiators DA‐1 to DA‐4 in dichloromethane.
|
Compound |
λmax [nm] |
Φfl [%] |
σTPA (Z‐scan) [GM][a] |
σTPA (TPEF) [GM][b] |
|---|---|---|---|---|
|
DA‐1 |
435 511 |
0.020 |
700 |
<8000 |
|
DA‐2 |
395 542 |
0.010 |
970 |
<2000 |
|
DA‐3 |
470 521 |
1.010 |
1000 |
200 |
|
DA‐4 |
439 561 |
<0.001 |
2500 |
n.d. |
[a] Measured at 725 nm and [b] Measured at 970 nm (DA‐1), 710 nm (DA‐2, DA‐3), n.d.=not detected.
Figure 100.

Determination of the fabrication windows of DA‐1 to DA‐4 using 800 nm as polymerization wavelength. [61] Adapted with permission from Ref. [61]. Copyright 2016, Royal Society of Chemistry.
All initiators reveal broad FWs from around 10 to 55 mW. More complex structures in form of hollow pyramids were fabricated using DA‐3 as initiator with increasing laser power from left to right (Figure 101). The three left pyramids were prepared with a laser power of 15, 25 and 40 mW and display a well‐defined structure. By increasing the average laser power the structures begin to show deformation and over‐polymerization until total collapse of the structure at around 50 mW (pyramids on the right).
Figure 101.

(a) SEM image of the fabricated hollow pyramids with increasing laser power using DA‐3 as initiator. (b) Hollow pyramid fabricated at a laser power of 30 mW with DA‐3. [61] Reproduced with permission from Ref. [61]. Copyright 2016, Royal Society of Chemistry.
While one of the most popular ways to tune the efficiency of a photo initiator is to modify the electron donating or withdrawing substituents or to expand the conjugation, Li et al. chose a different approach. Since the polymerization initiation depends on the generated radicals, Li et al. developed silicon‐based photo initiators (Figure 102) based on studies which describe the photolytically cleavage of the Si−Si bond. [193]
Figure 102.

Schematic representation of the structures of the silyl modified 2PIs DA‐5 to DA‐7.
All compounds show an absorption band in THF of around 450 nm. The modification of 3‐hydroxy‐4‐diethylamino‐4′‐nitrostilben (DA‐5) shifts the absorption maxima only slightly when a silyl group is used (Table 40). The same was observed with the fluorescence quantum yields, which increased slightly from 0.38 for DA‐5 to 0.41 for DA‐6 and DA‐7, respectively. Two‐photon cross‐sections have been determined by an approach of Rebane et al., in which the cross‐section is estimated purely from one‐photon spectral properties.[ 194 , 195 ] The authors demonstrated that the σTPA value can be calculated, when in case of non‐centrosymmetric dipolar molecules, the TPA transition between the ground and the first excited electronic state appears without involving any intermediate states. To determine the fabrication windows of the photo initiators, a 1 : 1 mixture of TMPA and ETA was used. Y‐structures were fabricated at 800 nm and 50 μm/s writing speed at different laser intensities.
Table 40.
Photophysical properties of the photo initiators DA‐5 to DA‐7 in tetrahydrofuran.
|
Compound |
λmax [nm] |
Φfl |
σTPA [GM][a] |
|---|---|---|---|
|
DA‐5 |
458±2 |
0.38 |
90 |
|
DA‐6 |
453±2 |
0.41 |
90 |
|
DA‐7 |
453±2 |
0.41 |
90 |
[a] Measured at 725 nm.
DA‐5 shows the broadest FW of those three initiators, with the lowest polymerization threshold as well with the highest burning threshold (Figure 103). Both of the silyl‐based initiators exhibit a lower FW with higher polymerization thresholds as well as lower burning thresholds. Although the Si−Si bond is a known functionality which undergoes fragmentation induced by light to produce silyl radicals,[ 196 , 197 ] the results indicate that neither the cleavage of the Si−O nor of the Si−Si bond occurred under TPA. This could be achieved by increasing the laser intensity, however the risk of over polymerization and damage to the structure is possible.
Figure 103.

Fabrication windows of the silylated 2PIs DA‐6/DA‐7 and DA‐5 (2PI concentration 6.3×10⁻⁶ mol 2PI/g resin). [193] Adapted with permission from Ref. [193]. Copyright 2017, Royal Society of Chemistry.
It is known that also cationic polymerization under 2PA condition can be performed. Such photo acid generators (PAG) generate protons upon excitement and thus initiate the cationic polymerization. Such PAG initiators have been reviewed recently. [24] However, some of the PAGs can also generate radicals under 2PA conditions by photolysis, like compounds with sulfonium salts. [198] Chen and coworkers developed three different photo initiators for cationic polymerization under 2PA conditions, but also tested them for their ability to initiate radical polymerization under 2PA conditions. Therefore they chose a 1,3,5‐triphenyl‐2‐pyrazoline structure for their initiators (Figure 104), because their interesting non‐linear optical behavior.[ 198 , 199 ]
Figure 104.

Schematic representation of the structures of the 1,3,5‐triphenyl‐2‐pyrazoline 2PIs.
The 2PIs show a linear absorption maximum between 340 and 375 nm in acetonitrile. Steady state fluorescence measurements revealed that all three initiators exhibit a fluorescence quantum yield of under 1 %. The z‐scan measurements of the 2PIs showed that PI−H and PI−CF3 exhibit a σTPA‐ value of 75 and 105 GM, respectively. For PI−EtO no σTPA ‐value was reported. The larger cross‐section of PI−CF3 compared to PI−H can be explained by the stronger D‐π‐A character between the CF3‐group and the pyrazoline ring. Polymerization tests were performed with PETA as monomer at 780 nm polymerization wavelength with different laser powers and writing speeds. Hereby solid lines were fabricated with a 2PI concentration of 1 wt%. Both initiators initiate polymerization, however the polymerization threshold of PI−CF3 is lower compared to the of PI−H. The fabrication window of F and PI−H at 100 μm/s was observed to be 4.5 to 14 mW and 7.5 to 18 mW, respectively. Figure 105 displays the 2PP experiments with PI−CF3.
Figure 105.

SEM image of the fabrication array prepared with PI−CF3 at a concentration of 1 wt% in PETA. [198] Adapted with permission from Ref. [198]. Copyright 2021, Elsevier.
Coumarin based initiators are a well studied compound class which, are known to generate radicals under 2PA conditions as mentioned before. Oxime esters are a new interesting functional, which generate radicals by α‐cleavage as shown before. Qiu et al. investigated 2PIs with a coumarin core equipped with different oxime esters (vinyl‐ & phenylester) at different positions (Figure 106). [200]
Figure 106.

Schematic representation of the oxime esters substituted coumarin 2PIs.
The measured UV/Vis‐absorption spectra in acetonitrile revealed that OEC3‐1 & ‐2 possess absorption maxima at around 405 nm. OEC4 shows a slightly red shifted maximum at 421 nm. Although the change in the absorption maxima seems to be only marginal, by changing the position from 4 to 3 the molar absorption coefficient increases, in case of OEC4 and OEC3‐1 ϵ it is doubled. A study by Wu et al. reports that a coumarin derivative substituted in 4‐position adopted a twisted conformation. In contrast, coumarines substituted at position 3 show a more planar conformation, thus explaining the higher ϵ. [60] This is also reflected in the two‐photon absorption behaviour (at 800 nm). While OCE4 exhibits a two‐photon cross‐section of 208 GM, OEC3‐1 and OEC3‐2 reveal values of 486 and 536 GM. Steady state photolysis experiments showed that all three initiators undergo photolysis by α‐cleavage of the oxime ester, hereby OCE3‐2 shows the fastest photolysis rate. 2PP fabrication experiments were performed using a 1 : 1 mixture of trimethylolpropane triacrylate (TMPTA) and ethoxylated trimethylolpropane triacrylate (TMP3EOTA) with a PI concentration of 1.1×10⁻⁵ mol/g resin using 800 nm as polymerization wavelength. The fabrication window was determined by polymerizing doughnut shaped structures using different laser intensities at a writing speed of 750 μm/s.
While OEC4 exhibit a poor fabrication window due to poor solubility in the monomer mixture, OEC3‐1 and OEC‐2 reveal broad fabrication windows. The best results were achieved with OEC3‐2 as initiator with a fabrication window of 12 to 28 mW (Figure 107). The fabrication of complex 3D‐strucutres was possible with OEC3‐2 as 2PI. As discussed above, it seems that the generated vinyl radical has a higher initiation efficiency compared to the phenyl radical. Since the thermal stability of oxime esters compounds are an issue, TGA measurements were performed. The investigated photo initiators revealed a Td between 189 to 220 °C which is above the Td of the commercial available initiator Irgacure OXE02 showing that the new 2PIs are sufficient for daily storage.
Figure 107.

(a) Fabrication window of the oxime ester substituted coumarin initiators. (b),(c) 3D complex structures fabricated using OEC‐2 as photo initiator. [200] Adapted with permission from Ref. [200]. Copyright 2019, John Wiley and Sons.
OXE is another carbazole based initiator equipped with a oxime ester functionality. This chevron‐shaped initiator was develop by Zhou et al. and investigated for its use in 2PP (Figure 108). [201]
Figure 108.

Schematic representation of the structure of the carbazole based 2PI OXE with an oxime ester group.
The linear absorption spectrum of OXE in acetonitrile revealed an absorption maximum of 374 nm. The determined two‐photon cross‐section via the z‐scan technique revealed a σTPA value of 87±13 GM, which compared to other carbazole based 2PIs with an oxime ester group is quite low. Steady state photolysis experiments showed that the oxime ester group in OXE undergo cleavage under one photon and two photon conditions. To determine the polymerization threshold of the initiator, polymer lines were fabricated with a formulation of PETA and 2.5 mM OXE. The 2PP were performed at 800 nm polymerization wavelength and revealed a Pth of 0.73 mW. This low polymerization threshold shows the great potential of OXE and it was possible to fabricate complex 3D‐strucutres in form of pyramids.
6. Photo Initiators without Extended π‐Systems
Most of commercially available photo initiators are well‐known compounds for single photon photopolymerization. Most of the initiators lack on high two‐photon cross‐sections, which means that higher intensities of the laser power are required to initiate polymerization under 2PP conditions. Schafer et al. investigated the two‐photon cross‐sections of several initiators from the Irgacure and Darocure family (Figure 109). [91] Most of these initiators induce polymerization via the Norrish Type I mechanism, where an α‐cleavage reaction generates the desired radicals. The typical structures are based on α‐aminoketones, α‐hydroxyketones and acylphospine oxides.
Figure 109.

Schematic representation of the structures of the commercially available photo initiators investigated in the studies of Schafer et al.
The linear absorption measurements in methanol revealed that the absorption maxima range from 242 to 328 nm.
The two‐photon cross‐sections vary from 4 to 28 GM (Table 41). Although the σTPA values are rather low, the application of commercial 2PI is often reported in literature. Irgacure 2959 (I2959) (Figure 110) is one of the most used commercial initiators for 2PP throughout literature. I2959 is mostly used in fabrication of hydrogels based on different materials like methacrylamide‐modified gelatin,[ 202 , 203 ] modified hyaluronic acid[ 204 , 205 ] and methacrylated carbohydrates. [206]
Table 41.
Photophysical data of selected commercially available photo initiators.
|
Compound |
λmax [nm] |
λ(2) max [nm] |
σTPA [GM][a] |
|---|---|---|---|
|
Irgacure 184 |
246 |
265 |
23 |
|
Irgacure 261 |
242 |
265 |
<20 |
|
Irgacure 369 |
324 |
335 |
7 |
|
Irgacure 651 |
254 |
265 |
28 |
|
Irgacure 754 |
253 |
265 |
21 |
|
Irgacure 819 |
295 |
300 |
<4 |
|
Irgacure 907 |
306 |
300 |
4 |
|
Irgacure OXE01 |
328 |
330 |
31 |
|
Darocure TPO |
299 |
300 |
<4 |
|
Darocure MBF |
255 |
265 |
27 |
|
Darocure 1173 |
244 |
265 |
<20 |
[a] Measured by Z‐scan technique.
Figure 110.

Schematic representation of the structure of Irgacure 2959.
Käpylä et al. investigated newly synthesized polymerizable amino acids (polyAA) for the use as extracellular matrix (ECM) mimicking material. [207] For this purpose, polyAAs based on methacrylolated (PHEG−MA) and acrylolated (PHEG−A) poly[N 5‐(2‐hydroxyethyl) l‐glutamine]s (PHEGs) were synthesized with different degrees of functionalization (Df). 2PP was applied to fabricate hydrogels with high integrity by using Irgacure 2959 as initiator. Besides the fabrication also the polymerization threshold (Pth) and damage threshold (PD) were investigated. Figure 111 shows the dynamic range (defined as the quotient of PD/Pth) of I2959 in different polyAAs and different PEGda monomers.
Figure 111.

Dynamic range of I2959 in different polyAAs and different PEGda monomers. PHEG−A13 (Df=12.9), PHEG−A9 (Df=9.4), PHEG−MA21 (Df=20.7), PHEG−MA11 (Df=11.2). [207] Adapted with permission from Ref. [207]. Copyright 2014, Elsevier.
The dynamic range clearly depends on the used monomer system. In case of I2959 with the modified polyAAs and PEGda the dynamic range is much broader with PHEG−MA as well as PHEG−A compared to PEGda. In addition, Käpylä et al. estimated the σTPA value of I2959 to be between 0.001 to 0.01 GM, which agrees with the σTPA values of other commercial photo initiators. [91]
Irgacure 369 (I369, Figure 109) is also a frequently used initiator for 2PP fabrication of structures for different applications. Fabricated microneedles, doped with gentamine sulfate, successfully inhibited the growth of Staphylococcus aureus bacteria (Figure 112 a and b). [125] Ovsianikov et al. successfully fabricated scaffolds in the presents of living cells (Figure 112 c and d). [208] Scaffolds for tissue engineering and hypodermic needles, which successfully penetrate cadaveric procine adipose tissue, were fabricated by using the same organic‐inorganic photoresist as in Ref. [15] and 16 (Figure 113).[ 126 , 128 , 209 , 210 , 211 ] Furthermore Koroleva et al. fabricated 3D‐scaffolds out of methacrylate PLA and I369, which enabled and supported the proliferation of Schwann cells. [127] Iron platinum nanoparticle based 3D microrobots for potential applications in medicine, as well as light‐ induced reconfigurable smart materials based on liquid crystalline elastomers were also fabricated with I369.[ 212 , 213 ]
Figure 112.

(a) SEM image of microneedle array fabricated with gentamicin‐doped SR610 (Sartomer, Paris France) and I369. (b) Fabricated microneedle array against Staphylococcus aureus. Growth inhibition area around the array was 26.8 mm large. [125] Adapted with permission from Ref. [125]. Copyright 2010, John Wiley and Sons. (c) CAD design for the hydrogel scaffold structure. (d) SEM image of the scaffold fabricated by using I369 and PEGda. [208] Adapted with permission from Ref. [208]. Copyright 2010, IOP Publishing.
Figure 113.

(a) Hypodermic needle. [126] Adapted with permission from Ref. [126]. Copyright 2007, John Wiley and Sons. (b) Micro grid structure fabricated by 2PP using I369 as 2PI. [128] Adapted with permission from Ref. [128] ©The Optical Society.
Although I369 is used in many applications, no data of fabrication windows is reported.
A representative of the acylphosphine oxide initiators is Irgacure 819 (I819, Figure 109). Despite its low σTPA value of <4 GM (Table 41) I819 is capable to successfully initiate polymerization via 2PP. For example, a monomer mixture of PETA and BisGMA (bisphenol A glycidyl methacrylate) was used to fabricate polymer scaffolds to seed mesenchymal progenitor cells and to stimulate them to produce bone‐forming cells for tissue engineering (Figure 114). [214] By using high molar mass PEGda monomers Scarpa et al. were able to fabricate 3D pH‐responsive microstructures for soft tissue applications. [215]
Figure 114.

SEM image of a three‐level cage structure fabricated with PETA/BisGMA (80/20) and I819 as 2PI. The square pore sizes are 35 μm. [214] Adapted with permission from Ref. [214]. Copyright 2016, John Wiley and Sons.
Harnisch et al. investigated the fabrication windows of several commercial initiators including I819. [216] To evaluate the FW, I819 was used at a concentration of 1 wt% in the commercial hybrid monomer mixture OrmoComp®. The resulting FW of 16 to 32 mW for I819 was determined by fabricating microstructures with different laser intensities (Figure 115).
Figure 115.

SEM image of fabricated microstructures with I819 as 2PI. The laser intensity was increased from 16 to 32 mW in 4 mW steps (left to right). [216] Adapted with permission from Ref. [216] ©The Optical Society.
Zandrini et al. investigated the influence of the viscosity of the monomer solution on the dynamic range. Therefore, different resin formulations were prepared and I819 was used as photo initiator. [217] The resin solutions consisted of the two monomers dipentaerythritol pentaacrylate and 1,3‐butylene glycol oxide diacrylate (Table 42).
Table 42.
Composition of monomer solutions with corresponding viscosity.
|
Resin |
DPEPA [mmol] |
BGDA [mmol] |
I819 [mol %] |
Viscosity, n [mPa‐s] |
|---|---|---|---|---|
|
A |
11.4 |
0 |
3.8 |
10,400 |
|
B |
6.8 |
12.5 |
2.3 |
116 |
|
C |
3.9 |
19.8 |
1.9 |
23 |
|
D |
0.5 |
28.9 |
1.6 |
15 |
To estimate Eth and Edamage, 20 μm long lines were fabricated at a writing speed of 50 μm/s and the laser energies varied from 0.03 nJ/pulse to 0.45 nJ/pulse. Table 43 shows that with decreasing viscosity the energy threshold increases, what leads to a lower dynamic range. Although a large dynamic range is desirable in 2PP to fabricate microstructures, it is also important to have a low viscosity to achieve high resolutions and prevent damage of the structures by overpolymerization. The results indicate that the viscosity of the monomer solution represents another parameter which has to be considered while fabrication of 3D microstructure by 2PP.
Table 43.
Threshold energies and dynamic ranges of the different resins from Table 42.
|
Resin |
Eth [nJ/pulse] |
Edamage [nJ/pulse] |
Dynamic range [%] |
|---|---|---|---|
|
A |
0.04 |
0.49 |
91.8 |
|
B |
0.06 |
0.52 |
88.5 |
|
C |
0.09 |
0.50 |
82.0 |
|
D |
0.19 |
0.53 |
64.2 |
Besides I819, Irgacure TPO−L (formally known as Luricin TPO, Figure 116) is another well‐studied initiator of the acylphosphine oxide class.
Two‐photon absorption measurements performed by Mendonca et al. revealed that Irgacure TPO−L has a σTPA value of 1.2 GM at 610 nm. Figure 117 shows the linear absorption spectrum and two‐photon absorption cross‐section spectrum. [218]
Figure 117.

Linear absorption spectrum (left, curve, c=7×10⁻³ mol/L) and two‐photon absorption cross‐section spectrum (right, circles, c=9×10⁻¹ mol/L) of Irgacure TPO−L in ethanol. [218] Reproduced with permission from Ref. [218]. Copyright 2008, Springer Nature.
To exhibit high σTPA values a molecule requires a high conjugation and molecular planarity. [166] Quantum mechanical calculations revealed that Irgacure TPO−L has a non‐planar structure due to the phosphorus atom in the center of the molecule and a low conjugation length, which results in a low σTPA value. Detailed investigations of the initiator concerning the polymerization performance were conducted by Baldacchini et al. [219] and De Marco et al. [220] Baldacchini et al. investigated the polymerization and damage threshold in dependence to the 2PI concentration (Figure 118). For this purpose different monomer solutions containing ethoxylated(6) trimethylolpropane triacrylate and tris(2‐hydroxyethyl)isocyanurate triacrylate were prepared and investigated.
Figure 118.

Determined polymerization (circle) and damage (triangle) thresholds in dependence on the 2PI concentration. Every sample was irradiated with 725 nm laser wavelength for 5 s. [218] Reproduced with permission from Ref. [218]. Copyright 2004, AIP Publishing.
The polymerization threshold decreased quickly with increasing 2PI concentration until it reaches 1.5 wt% from where it decreases only slowly. It can be assumed that an ideal dynamic range for 2PP fabrication is received starting at a 2PI concentration of 1.5 wt%. Based on this result 3D microstructures were fabricated using 3 wt% of Irgacure TOP−L with a laser power of 2.3 mW and a writing speed of 30 μm/s (Figure 119 a and b).
Figure 119.

(a)/(b) SEM image of the fabricated 3D micro structure “H A I R” on top of a human hair. The scale bars are 10 μm each. [218] Reproduced with permission from Ref. [218]. Copyright 2004, AIP Publishing. (c)/(d) SEM images of a fabricated woodpile structure. [220] Reproduced with permission from Ref. [220]. Copyright 2013, American Chemical Society.
Irgacure TPO−L also was used in polymerization studies of a new a perfluoropolyether‐based resin developed by De Marco et al., which should result in structures of high hydrophobicity and strong chemical resistance. [220] To evaluate the optimal polymerization parameters woodpile structures were fabricated with different laser intensities (x axis) and writing speeds (y axis) at a laser wavelength of 513 nm (Figure 119 c & d)
As expected the polymerization threshold increases with rising writing speed. This demonstrates that Irgacure TPO−L in combination with the perfluoronated monomer is capable of writing complex 3D structures via 2PP at high laser intensities as well as with fast writing speed up to 1000 μm/s (Figure 120). Figure 119 c and d displays a woodpile structure fabricated via the evaluated polymerization parameters. The structure shows high integrity and well‐defined sub micrometer features. Several other groups have performed experiments, where the concentration of either the initiator or the monomer was varied to investigate the possibilities Irgacure TPO−L offers.[ 221 , 222 ] In a recent study Irgacure TPO−L was used for the fabrication of 3D scaffolds for the evaluation of Komagataeibacter xylinus, which produces bacterial celluloses, a polymer which occurs in nature with several properties important for biological applications. [223]
Figure 120.

(a) SEM image of the fabricated woodpile structures fabricated with Irgacure TPO−L. The laser intensities varied from 1.55 mW (left) to 3.5 mW (right) and the writing speed from 100 μm/s (bottom row) to 1000 μm/s (top‐left area) with 100 μm/s steps. (b) Plot of the processing parameters corresponding to the polymerization threshold (circles) and damage threshold (squares). [220] Reproduced with permission from Ref. [220]. Copyright 2013, American Chemical Society.
Ciprofloaxacin (CPF), a commercial available antibiotic drug, has drawn attention after it was discovered that it produces radicals under photo irradiation. [224] Because CPF itself possesses a low lipophilicity Bardakova et al. modified CPF with different substituents to increase the solubility for a successful use in 2PP experiments with methacryloyl modified poly(D,L‐lactide).[ 225 , 226 ]
CPF−Allyl and CPF−VBC (Figure 121) reveal the same optical properties like CPF also the exhibition of the blue fluorescence at 420 to 450 nm, when irradiated at 365 nm. Unfortunately, the authors do not report further information regarding fluorescence quantum yields or two‐photon cross‐sections. Both initiators were able to initiate polymerization at a polymerization wavelength of 525 nm and a writing speed of 50 mm/s. Polymerization with CPF−Allyl was achieved at a laser power of 60 mW, where on the other hand CPF−VBC already initiated polymerization at 35 mW. No fabrication window was reported. [226] CPF−Hex also initiated polymerization at 525 nm but the fabrication window was determined at a faster writing speed of 25,000 μm/s. The FW of CPF−Hex was reported to be 45 to 60 mW. The initiation efficiency at such high writing speeds may be attributed to the low fluorescence quantum yield of 0.079, however no additional information photophysical properties were reported. [225]
Figure 121.

Schematic representation of the structures of modified CPF based photo initiators for 2PP.
7. Conclusion
Since its discovery in 1997, two‐photon polymerization has proven to be a highly versatile polymerization method. Due to the high resolution of this polymerization technique, nanometer scale fabrication is possible, which enables its use in many different fields of research areas such as tissue engineering or functional micro devises.
The efficiency of a photo initiator for the use in the field of two‐photon polymerization depends on many factors. The concentration of the 2PI, the laser intensity, solubility or monomer composition and its viscosity. One value which is always discussed, is the two‐photon cross‐section. It describes how well a molecule undergoes the two‐photon absorption process. For a long time it was believed that a high two‐photon cross‐section results in a high efficiency for the 2PI in the polymerization process. However, many publications report 2PIs with comparable low σTPA values but with broad FW and/or low polymerization thresholds; which indicates that a high cross‐section does not guarantees high efficiency. Additionally, for determination of the two‐photon cross‐section several techniques are used, like the Z‐scan and two‐photo excited fluorescence TPEF. Because the two techniques are based on different measurement principles, values are obtained which differ significantly as seen in the report of Nazir et al. [61] This makes a comparison of the available values difficult.
The fabrication window, the range in which the fabrication of stable structures is possible, describes quite well how efficient an initiator is, but these windows can differ depending on the laser setup, the used numerical aperture of the lenses and what monomer is used. Thus, while comparisons could be drawn between initiators within a review, there is a lack of some kind of standard, which would allow initiators from multiple reports to be compared to each other. Kiefer et al. met this challenge. [227] For that purpose over 70 photoresists from literature were compared in terms of writing speed, polymerization threshold, laser wavelength, laser pulse duration, pulse repetition rate, numerical aperture and 2PI concentration. These factors were combined into an equation, which represents the two‐photon sensitivity of the photoresist. By comparing the sensitivity to a hypothetical reference, a figure of merit was established and the different photoresists could be compared.
The design and synthesis of new and efficient 2PI is a budding challenge, despite the extensive work done in the literature. Also, due to the ongoing development of the technical setups, more and more efficient devices are been developed for the use in two‐photon polymerization. Despite the difficult comparison of the 2PIs, two‐photon polymerization offers great potential to enter further research areas and to become an established technique not only in natural sciences, but also as a technique for the fabrication of electronic microelements or scaffolds in regenerative medicine.
Conflict of interest
The authors declare no conflict of interest.
8.
Biographical Information
Thomas Wloka was born in Ravensburg (Germany) in 1989. He studied Chemistry at the Ludwig Maximilians University (LMU) in Munich (Germany). Since 2017 he has been a PhD student in the group of Prof. Schubert at the Friedrich Schiller University Jena. His research interests cover the development of water‐soluble photo initiators for two‐photon polymerization and the synthesis of macromonomers based on poly(2‐oxazoline)s.

Biographical Information
Michael Gottschaldt was born in Jena (Germany) in 1973. After studying Chemistry in Jena (Germany) and Virginia Tech University (USA), he completed his dissertation in Jena in 2002. After a postdoctoral stay as a Marie Currie Fellow in Nara (Japan) with Prof. S. Yano he returned to Jena and obtained his habilitation in 2010. Since 2018 he is adjunct professor at the Friedrich Schiller University Jena.

Biographical Information
Ulrich S. Schubert was born in Tübingen (Germany) in 1969. He studied chemistry in Frankfurt and Bayreuth (both Germany) and at Virginia Commonwealth University, Richmond (USA). His PhD studies were performed at the Universities of Bayreuth and South Florida. After a post‐doctoral training with J.‐M. Lehn at the University of Strasbourg (France), he moved to the TU Munich (Germany) and obtained his Habilitation in 1999. During 1999 to 2000 he was Professor at the University of Munich and during 2000–20007 Full‐Professor at the TU Eindhoven (the Netherlands). Since 2007, he has been Full‐Professor at the Friedrich Schiller University Jena, Germany.

Acknowledgements
The authors thank the Deutsche Forschungsgemeinschaft (DFG) for funding of this work (SCHU1229/25‐1, LI 916/19‐1 and GO1100/4‐1). Open Access funding enabled and organized by Projekt DEAL.
T. Wloka, M. Gottschaldt, U. S. Schubert, Chem. Eur. J. 2022, 28, e202104191.
Data Availability Statement
The data that support the findings of this study are available from the corresponding author upon reasonable request.
References
- 1. Göppert-Mayer M., Ann. Phys. 1931, 401, 273–294. [Google Scholar]
- 2. Kaiser W., Garrett C. G. B., Phys. Rev. Lett. 1961, 7, 229–231. [Google Scholar]
- 3. Maruo S., Nakamura O., Kawata S., Opt. Lett. 1997, 22, 132–134. [DOI] [PubMed] [Google Scholar]
- 4. Wollhofen R., Buchegger B., Eder C., Jacak J., Kreutzer J., Klar T. A., Opt. Mater. Express 2017, 7, 2538–2559. [Google Scholar]
- 5. Claus T. K., Richter B., Hahn V., Welle A., Kayser S., Wegener M., Bastmeyer M., Delaittre G., Barner-Kowollik C., Angew. Chem. Int. Ed. 2016, 55, 3817–3822; [DOI] [PubMed] [Google Scholar]; Angew. Chem. 2016, 128, 3882–3887. [Google Scholar]
- 6. Xiong Z., Zheng C., Jin F., Wei R., Zhao Y., Gao X., Xia Y., Dong X., Zheng M., Duan X., Sens. Actuators B 2018, 274, 541–550. [Google Scholar]
- 7. Qin X.-H., Gruber P., Markovic M., Plochberger B., Klotzsch E., Stampfl J., Ovsianikov A., Liska R., Polym. Chem. 2014, 5, 6523–6533. [Google Scholar]
- 8. Wloka T., Czich S., Kleinsteuber M., Moek E., Weber C., Gottschaldt M., Liefeith K., Schubert U. S., Eur. Polym. J. 2020, 122, 109295. [DOI] [PMC free article] [PubMed] [Google Scholar]
- 9. Cumpston B. H., Ananthavel S. P., Barlow S., Dyer D. L., Ehrlich J. E., Erskine L. L., Heikal A. A., Kuebler S. M., Lee I. Y. S., McCord-Maughon D., Qin J., Rockel H., Rumi M., Wu X.-L., Marder S. R., Perry J. W., Nature 1999, 398, 51–54. [Google Scholar]
- 10. Strickler J. H., Webb W. W., Opt. Lett. 1991, 16, 1780–1782. [DOI] [PubMed] [Google Scholar]
- 11. Basu S., Rodionov V., Terasaki M., Campagnola P. J., Opt. Lett. 2005, 30, 159–161. [DOI] [PubMed] [Google Scholar]
- 12. Koroleva A., Deiwick A., Nguyen A., Schlie-Wolter S., Narayan R., Timashev P., Popov V., Bagratashvili V., Chichkov B., PLoS One 2015, 10, e0118164. [DOI] [PMC free article] [PubMed] [Google Scholar]
- 13. Raimondi M. T., Eaton S. M., Laganà M., Aprile V., Nava M. M., Cerullo G., Osellame R., Acta Biomater. 2013, 9, 4579–4584. [DOI] [PubMed] [Google Scholar]
- 14. Carlotti M., Mattoli V., Small 2019, 15, 1902687. [DOI] [PubMed] [Google Scholar]
- 15. Raimondi M. T., Eaton S. M., Eaton S. M., Nava M. M., Nava M. M., Laganà M., Laganà M., Cerullo G., Cerullo G., Osellame R., J. Appl. Biomater. Funct. Mater. 2012, 10, 55–65. [DOI] [PubMed] [Google Scholar]
- 16. Ligon S. C., Liska R., Stampfl J., Gurr M., Mülhaupt R., Chem. Rev. 2017, 117, 10212–10290. [DOI] [PMC free article] [PubMed] [Google Scholar]
- 17. Ciuciu A. I., Cywinski P. J., RSC Adv. 2014, 4, 45504–45516. [Google Scholar]
- 18. Liao C., Wuethrich A., Trau M., Appl. Mater. Res. 2020, 19, 100635. [Google Scholar]
- 19. Song J., Michas C., Chen C. S., White A. E., Grinstaff M. W., Adv. Healthcare Mater. 2020, 9, 1901217. [DOI] [PubMed] [Google Scholar]
- 20. Faraji Rad Z., Prewett P. D., Davies G. J., Microsyst. Nanoeng. 2021, 7, 71. [DOI] [PMC free article] [PubMed] [Google Scholar]
- 21. Lao Z., Xia N., Wang S., Xu T., Wu X., Zhang L., Micromachines 2021, 12, 465. [DOI] [PMC free article] [PubMed] [Google Scholar]
- 22. Otuka A. J. G., Tomazio N. B., Paula K. T., Mendonça C. R., Polymer 2021, 13, 1994. [DOI] [PMC free article] [PubMed] [Google Scholar]
- 23. Huang Z., Tsui G. C.-P., Deng Y., Tang C.-Y., Nanotechnol. Rev. 2020, 9, 1118–1136. [Google Scholar]
- 24. Kuznetsova N. A., Malkov G. V., Gribov B. G., Russ. Chem. Rev. 2020, 89, 173–190. [Google Scholar]
- 25. Sheik-Bahae M., Said A. A., Wei T., Hagan D. J., Stryland E. W. V., IEEE J. Quantum Electron. 1990, 26, 760–769. [Google Scholar]
- 26. Pawlicki M., Collins H. A., Denning R. G., Anderson H. L., Angew. Chem. Int. Ed. 2009, 48, 3244–3266; [DOI] [PubMed] [Google Scholar]; Angew. Chem. 2009, 121, 3292–3316. [Google Scholar]
- 27. Kamada K., Matsunaga K., Yoshino A., Ohta K., J. Opt. Soc. Am. B 2003, 20, 529–537. [Google Scholar]
- 28. Xu C., Webb W. W., J. Opt. Soc. Am. B 1996, 13, 481–491. [Google Scholar]
- 29. Makarov N. S., Drobizhev M., Rebane A., Opt. Express 2008, 16, 4029–4047. [DOI] [PubMed] [Google Scholar]
- 30. Signorini R., Ferrante C., Pedron D., Zerbetto M., Cecchetto E., Slaviero M., Fortunati I., Collini E., Bozio R., Abbotto A., Beverina L., Pagani G. A., J. Phys. Chem. A 2008, 112, 4224–4234. [DOI] [PubMed] [Google Scholar]
- 31. Padilha L. A., Webster S., Hu H., Przhonska O. V., Hagan D. J., Van Stryland E. W., Bondar M. V., Davydenko I. G., Slominsky Y. L., Kachkovski A. D., Chem. Phys. 2008, 352, 97–105. [Google Scholar]
- 32. Nazir R., Danilevicius P., Ciuciu A. I., Chatzinikolaidou M., Gray D., Flamigni L., Farsari M., Gryko D. T., Chem. Mater. 2014, 26, 3175–3184. [Google Scholar]
- 33. Nazir R., Bourquard F., Balčiūnas E., Smoleń S., Gray D., Tkachenko N. V., Farsari M., Gryko D. T., ChemPhysChem 2015, 16, 682–690. [DOI] [PubMed] [Google Scholar]
- 34. Haq B. S., Khan H. U., Alam K., Attaullah S., Zari I., Mateenullah M., Appl. Opt. 2015, 54, 7020–7026. [DOI] [PubMed] [Google Scholar]
- 35. Song J. M., Inoue T., Kawazumi H., Ogawa T., Anal. Sci. 1999, 15, 601–603. [Google Scholar]
- 36. Haq B. S., Khan H. U., Alam K., Attaullah S., Sultan M., Appl. Opt. 2016, 55, 228–235. [DOI] [PubMed] [Google Scholar]
- 37. Ovsianikov A., Malinauskas M., Schlie S., Chichkov B., Gittard S., Narayan R., Löbler M., Sternberg K., Schmitz K. P., Haverich A., Acta Biomater. 2011, 7, 967–974. [DOI] [PMC free article] [PubMed] [Google Scholar]
- 38. Claeyssens F., Hasan E. A., Gaidukeviciute A., Achilleos D. S., Ranella A., Reinhardt C., Ovsianikov A., Shizhou X., Fotakis C., Vamvakaki M., Chichkov B. N., Farsari M., Langmuir 2009, 25, 3219–3223. [DOI] [PubMed] [Google Scholar]
- 39. Ovsianikov A., Gaidukeviciute A., Chichkov B. N., Oubaha M., MacCraith B. D., Sakellari I., Giakoumaki A., Gray D., Vamvakaki M., Farsari M., Fotakis C., Laser Chem. 2008, 2008, 1–7. [Google Scholar]
- 40. Ovsianikov A., Viertl J., Chichkov B., Oubaha M., MacCraith B., Sakellari I., Giakoumaki A., Gray D., Vamvakaki M., Farsari M., Fotakis C., ACS Nano 2008, 2, 2257–2262. [DOI] [PubMed] [Google Scholar]
- 41. Skoog S. A., Nguyen A. K., Kumar G., Zheng J., Goering P. L., Koroleva A., Chichkov B. N., Narayan R. J., Biointerphases 2014, 9, 029014. [DOI] [PubMed] [Google Scholar]
- 42. Xin C., Yang L., Li J., Hu Y., Qian D., Fan S., Hu K., Cai Z., Wu H., Wang D., Wu D., Chu J., Adv. Mater. 2019, 31, 1808226. [DOI] [PubMed] [Google Scholar]
- 43. Li Z., Siklos M., Pucher N., Cicha K., Ajami A., Husinsky W., Rosspeintner A., Vauthey E., Gescheidt G., Stampfl J., Liska R., J. Polym. Sci. Part A 2011, 49, 3688–3699. [Google Scholar]
- 44. Zhang S., Li S., Wan X., Ma J., Li N., Li J., Yin Q., Addit. Manuf. 2021, 47, 102358. [Google Scholar]
- 45. Pucher N., Rosspeintner A., Satzinger V., Schmidt V., Gescheidt G., Stampfl J., Liska R., Macromolecules 2009, 42, 6519–6528. [Google Scholar]
- 46. Lemercier G., Martineau C., Mulatier J.-C., Wang I., Stéphan O., Baldeck P., Andraud C., New J. Chem. 2006, 30, 1606–1613. [Google Scholar]
- 47. Martineau C., Lemercier G., Andraud C., Wang I., Bouriau M., Baldeck P. L., Synth. Met. 2003, 138, 353–356. [Google Scholar]
- 48. Li Z., Pucher N., Cicha K., Torgersen J., Ligon S. C., Ajami A., Husinsky W., Rosspeintner A., Vauthey E., Naumov S., Scherzer T., Stampfl J., Liska R., Macromolecules 2013, 46, 352–361. [Google Scholar]
- 49. Zou Q., Zhao Y., Makarov N. S., Campo J., Yuan H., Fang D.-C., Perry J. W., Wu F., Phys. Chem. Chem. Phys. 2012, 14, 11743–11752. [DOI] [PubMed] [Google Scholar]
- 50. Weisgrab G., Guillaume O., Guo Z., Heimel P., Slezak P., Poot A., Grijpma D., Ovsianikov A., Biofabrication 2020, 12, 045036. [DOI] [PubMed] [Google Scholar]
- 51. Arslan A., Steiger W., Roose P., Van den Bergen H., Gruber P., Zerobin E., Gantner F., Guillaume O., Ovsianikov A., Van Vlierberghe S., Dubruel P., Mater. Today 2021, 44, 25–39. [Google Scholar]
- 52. Meier H., Angew. Chem. Int. Ed. 2005, 44, 2482–2506; [DOI] [PubMed] [Google Scholar]; Angew. Chem. 2005, 117, 2536–2561. [Google Scholar]
- 53. Hu P., Zhu J., Liu R., Li Z., J. Photopolym. Sci. Technol. 2019, 32, 257–264. [Google Scholar]
- 54. Specht D. P., Martic P. A., Farid S., Tetrahedron 1982, 38, 1203–1211. [Google Scholar]
- 55. Monroe B. M., Weed G. C., Chem. Rev. 1993, 93, 435–448. [Google Scholar]
- 56. Fouassier J. P., Morlet-Savary F., Yamashita K., Imahashi S., Polymer 1997, 38, 1415–1421. [Google Scholar]
- 57. Allonas X., Fouassier J. P., Kaji M., Miyasaka M., Hidaka T., Polymer 2001, 42, 7627–7634. [Google Scholar]
- 58. Wang T., Zhao Y., Shi M., Wu F., Dyes Pigm. 2007, 75, 104–110. [Google Scholar]
- 59. Xue J., Zhao Y., Wu J., Wu F., J. Photochem. Photobiol. A 2008, 195, 261–266. [Google Scholar]
- 60. Xue J., Zhao Y., Wu F., Fang D.-C., J. Phys. Chem. A 2010, 114, 5171–5179. [DOI] [PubMed] [Google Scholar]
- 61. Nazir R., Thorsted B., Balciunas E., Mazur L., Deperasinska I., Samoc M., Brewer J., Farsari M., Gryko D. T., J. Mater. Chem. C 2016, 4, 167–177. [Google Scholar]
- 62. Poocza L., Gottschaldt M., Markweg E., Hauptmann N., Hildebrand G., Pretzel D., Hartlieb M., Reichardt C., Kuebel J., Schubert U. S., Mollenhauer O., Dietzek B., Liefeith K., Adv. Eng. Mater. 2017, 19, 1600686. [Google Scholar]
- 63. Czich S., Wloka T., Rothe H., Rost J., Penzold F., Kleinsteuber M., Gottschaldt M., Schubert U. S., Liefeith K., Molecules 2020, 25, 5066. [DOI] [PMC free article] [PubMed] [Google Scholar]
- 64. Huang X., Zhang Y., Shi M., Zhang Y., Zhao Y., Polym. Chem. 2019, 10, 2273–2281. [Google Scholar]
- 65. Liska R., Seidl B., J. Polym. Sci. Part A 2005, 43, 101–111. [Google Scholar]
- 66. Infuehr R., Pucher N., Heller C., Lichtenegger H., Liska R., Schmidt V., Kuna L., Haase A., Stampfl J., Appl. Surf 2007, 254, 836–840. [Google Scholar]
- 67. Heller C., Pucher N., Seidl B., Kalinyaprak-Icten K., Ullrich G., Kuna L., Satzinger V., Schmidt V., Lichtenegger H. C., Stampfl J., Liska R., J. Polym. Sci. Part A 2007, 45, 3280–3291. [Google Scholar]
- 68. Li C., Yang X., Chen R., Pan J., Tian H., Zhu H., Wang X., Hagfeldt A., Sun L., Sol. Energy Mater. Sol. Cells 2007, 91, 1863–1871. [Google Scholar]
- 69. Lai L.-F., Qin C., Chui C.-H., Islam A., Han L., Ho C.-L., Wong W.-Y., Dyes Pigm. 2013, 98, 428–436. [Google Scholar]
- 70. Núñez Montoya S. C., Comini L. R., Sarmiento M., Becerra C., Albesa I., Argüello G. A., Cabrera J. L., J. Photochem. Photobiol. B 2005, 78, 77–83. [DOI] [PubMed] [Google Scholar]
- 71. Capodilupo A. L., Vergaro V., Fabiano E., De Giorgi M., Baldassarre F., Cardone A., Maggiore A., Maiorano V., Sanvitto D., Gigli G., Ciccarella G., J. Mater. Chem. B 2015, 3, 3315–3323. [DOI] [PubMed] [Google Scholar]
- 72. Dipold J., Batista R. J. M. B., Fonseca R. D., Silva D. L., Moura G. L. C., dos Anjos J. V., Simas A. M., De Boni L., Mendonca C. R., Chem. Phys. Lett. 2016, 661, 143–150. [Google Scholar]
- 73. Tiao C. J., Hwang L. C., Wen T. C., J. Chin. Chem. Soc. 1998, 45, 659–665. [Google Scholar]
- 74. Sun L., Chen Y., Kuang S., Li G., Guan R., Liu J., Ji L., Chao H., Chem. Eur. J. 2016, 22, 8955–8965. [DOI] [PubMed] [Google Scholar]
- 75. Brodard P., Sarbach A., Gumy J.-C., Bally T., Vauthey E., J. Phys. Chem. A 2001, 105, 6594–6601. [Google Scholar]
- 76. Pullen G. K., Allen N. S., Edge M., Weddell I., Swart R., Catalina F., Navaratnam S., Eur. Polym. J. 1996, 32, 943–955. [Google Scholar]
- 77. Xing J.-F., Chen W.-Q., Dong X.-Z., Tanaka T., Fang X.-Y., Duan X.-M., Kawata S., J. Photochem. Photobiol. A 2007, 189, 398–404. [Google Scholar]
- 78. Zhang S., Wan X. Y., Peng Y. H., Yin Q., Iop. Conf. Ser. Mater. Sci. Eng. 2019, 479, 012109. [Google Scholar]
- 79. Guo R., Wang Y., Huang Z., Zhang Q., Xiang S., Ye S., Liu W., Wang L., J. Mater. Chem. C 2020, 8, 3705–3714. [Google Scholar]
- 80. Tang X., Tao Y., Liu H., Liu F., He X., Peng Q., Li J., Lu P., Front. Chem. 2019, 7, 1–12. [DOI] [PMC free article] [PubMed] [Google Scholar]
- 81. Lee S., Park N., Bang J., Phys. Rev. Mater. 2020, 4, 044603. [Google Scholar]
- 82.R. Yu, P. Wang, X. Meng, L. He, Dalton Trans. 2020, 49, 8967–8975. [DOI] [PubMed]
- 83. Hua T., Huang Z.-S., Cai K., Wang L., Tang H., Meier H., Cao D., Electrochim. Acta 2019, 302, 225–233. [Google Scholar]
- 84. Zhang C., Wang S., Li Y., Sol. Energy 2017, 157, 94–102. [Google Scholar]
- 85. Benhattab S., Nakar R., Rodriguez Acosta J. W., Berton N., Faure-Vincent J., Bouclé J., Tran Van F., Schmaltz B., Dyes Pigm. 2018, 151, 238–244. [Google Scholar]
- 86. Venkateswararao A., Justin Thomas K. R., in Sol. Energy Mater Sol. Cells, John Wiley and Sons, 2013, pp. 41–96. [Google Scholar]
- 87. Gökçeören A. T., Fibers Polym. 2015, 16, 86–94. [Google Scholar]
- 88. Balta D. K., Arsu N., Yagci Y., Jockusch S., Turro N. J., Macromolecules 2007, 40, 4138–4141. [Google Scholar]
- 89. Timpe H. J., Kronfeld K. P., Lammel U., Fouassier J. P., Lougnot D. J., J. Photochem. Photobiol. A 1990, 52, 111–122. [Google Scholar]
- 90. Nazir R., Balčiu̅nas E., Buczyńska D., Bourquard F., Kowalska D., Gray D., Maćkowski S., Farsari M., Gryko D. T., Macromolecules 2015, 48, 2466–2472. [Google Scholar]
- 91. Schafer K. J., Hales J. M., Balu M., Belfield K. D., Van Stryland E. W., Hagan D. J., J. Photochem. Photobiol. A 2004, 162, 497–502. [Google Scholar]
- 92. Fischer J., von Freymann G., Wegener M., Adv. Mater. 2010, 22, 3578–3582. [DOI] [PubMed] [Google Scholar]
- 93. Li L., Gattass R. R., Gershgoren E., Hwang H., Fourkas J. T., Science 2009, 324, 910–913. [DOI] [PubMed] [Google Scholar]
- 94. Chi T., Somers P., Wilcox D. A., Schuman A. J., Iyer V., Le R., Gengler J., Ferdinandus M., Liebig C., Pan L., Xu X., Boudouris B. W., J. Polym. Sci. Part B 2019, 57, 1462–1475. [Google Scholar]
- 95. Chi T., Somers P., Wilcox D. A., Schuman A. J., Johnson J. E., Liang Z., Pan L., Xu X., Boudouris B. W., ACS Appl. Polym 2021, 3, 1426–1435. [Google Scholar]
- 96. Harke B., Dallari W., Grancini G., Fazzi D., Brandi F., Petrozza A., Diaspro A., Adv. Mater. 2013, 25, 904–909. [DOI] [PMC free article] [PubMed] [Google Scholar]
- 97. Zhang H., Jia T., Zhou K., Liu J., Feng D., Zhang S., Sun Z., J. Nonlinear Opt. Phys. Mater. 2014, 23, 1450048. [Google Scholar]
- 98. Ma J., Cheng W., Zhang S., Feng D., Jia T., Sun Z., Qiu J., Laser Phys. Lett. 2013, 10, 085304. [Google Scholar]
- 99. Kamada K., Ohta K., Iwase Y., Kondo K., Chem. Phys. Lett. 2003, 372, 386–393. [Google Scholar]
- 100. Iwase Y., Kamada K., Ohta K., Kondo K., J. Mater. Chem. 2003, 13, 1575–1581. [Google Scholar]
- 101. Kannan R., He G. S., Yuan L., Xu F., Prasad P. N., Dombroskie A. G., Reinhardt B. A., Baur J. W., Vaia R. A., Tan L.-S., Chem. Mater. 2001, 13, 1896–1904. [Google Scholar]
- 102. Tromayer M., Gruber P., Rosspeintner A., Ajami A., Husinsky W., Plasser F., González L., Vauthey E., Ovsianikov A., Liska R., Sci. Rep. 2018, 8, 17273. [DOI] [PMC free article] [PubMed] [Google Scholar]
- 103. Zhou H., Zhou F., Tang S., Wu P., Chen Y., Tu Y., Wu J., Tian Y., Dyes Pigm. 2012, 92, 633–641. [Google Scholar]
- 104. Chow C.-F., RSC Adv. 2013, 3, 18835–18843. [Google Scholar]
- 105. Holzer B., Lunzer M., Rosspeintner A., Licari G., Tromayer M., Naumov S., Lumpi D., Horkel E., Hametner C., Ovsianikov A., Liska R., Vauthey E., Fröhlich J., Mol. Syst. Des. Eng. 2019, 4, 437–448. [Google Scholar]
- 106. Chang D. W., Lee H. J., Kim J. H., Park S. Y., Park S.-M., Dai L., Baek J.-B., Org. Lett. 2011, 13, 3880–3883. [DOI] [PubMed] [Google Scholar]
- 107. Du Y., Lin X., Jia T., Dong J., Opt. Commun. 2015, 338, 257–260. [Google Scholar]
- 108. Lin T.-C., Chien W., Liu C.-Y., Tsai M.-Y., Huang Y.-J., Eur. J. Org. Chem. 2013, 2013, 4262–4269. [Google Scholar]
- 109. Cao X., Jin F., Li Y.-F., Chen W.-Q., Duan X.-M., Yang L.-M., New J. Chem. 2009, 33, 1578–1582. [Google Scholar]
- 110. Xing J.-F., Chen W.-Q., Gu J., Dong X.-Z., Takeyasu N., Tanaka T., Duan X.-M., Kawata S., J. Mater. Chem. 2007, 17, 1433–1438. [Google Scholar]
- 111. Lu Y., Hasegawa F., Goto T., Ohkuma S., Fukuhara S., Kawazu Y., Totani K., Yamashita T., Watanabe T., J. Mater. Chem. 2004, 14, 75–80. [Google Scholar]
- 112. Wan X., Zhao Y., Xue J., Wu F., Fang X., J. Photochem. Photobiol. A 2009, 202, 74–79. [Google Scholar]
- 113. He G. S., Xu G. C., Prasad P. N., Reinhardt B. A., Bhatt J. C., Dillard A. G., Opt. Lett. 1995, 20, 435–437. [DOI] [PubMed] [Google Scholar]
- 114. Huang X., Wang X., Zhao Y., Dyes Pigm. 2017, 141, 413–419. [Google Scholar]
- 115. Li Z., Torgersen J., Ajami A., Muhleder S., Qin X., Husinsky W., Holnthoner W., Ovsianikov A., Stampfl J., Liska R., RSC Adv. 2013, 3, 15939–15946. [Google Scholar]
- 116. Yamashita K., Imahashi S., Ito S., Dyes Pigm. 2008, 76, 748–753. [Google Scholar]
- 117. Lalevée J., Graff B., Allonas X., Fouassier J. P., J. Phys. Chem. A 2007, 111, 6991–6998. [DOI] [PubMed] [Google Scholar]
- 118. Ovsianikov A., Mühleder S., Torgersen J., Li Z., Qin X.-H., Van Vlierberghe S., Dubruel P., Holnthoner W., Redl H., Liska R., Stampfl J., Langmuir 2014, 30, 3787–3794. [DOI] [PubMed] [Google Scholar]
- 119. Sanjuan-Alberte P., Vaithilingam J., Moore J. C., Wildman R. D., Tuck C. J., Alexander M. R., Hague R. J. M., Rawson F. J., Polymer 2021, 13, 1038. [DOI] [PMC free article] [PubMed] [Google Scholar]
- 120. Huang X., Zhang Y., Shi M., Zhang L.-P., Zhang Y., Zhao Y., Eur. Polym. J. 2021, 153, 110505. [Google Scholar]
- 121. Xing J., Liu J., Zhang T., Zhang L., Zheng M., Duan X., J. Mater. Chem. B 2014, 2, 4318–4323. [DOI] [PubMed] [Google Scholar]
- 122. Nag O. K., Nayak R. R., Lim C. S., Kim I. H., Kyhm K., Cho B. R., Woo H. Y., J. Phys. Chem. B 2010, 114, 9684–9690. [DOI] [PubMed] [Google Scholar]
- 123. Saenger W., Steiner T., Acta Crystallogr. Sect. A 1998, 54, 798–805. [Google Scholar]
- 124. Xing J., Liu L., Song X., Zhao Y., Zhang L., Dong X., Jin F., Zheng M., Duan X., J. Mater. Chem. B 2015, 3, 8486–8491. [DOI] [PubMed] [Google Scholar]
- 125. Gittard S. D., Ovsianikov A., Akar H., Chichkov B., Monteiro-Riviere N. A., Stafslien S., Chisholm B., Shin C.-C., Shih C.-M., Lin S.-J., Su Y.-Y., Narayan R. J., Adv. Eng. Mater. 2010, 12, B77–B82. [DOI] [PMC free article] [PubMed] [Google Scholar]
- 126. Weiß T., Hildebrand G., Schade R., Liefeith K., Eng. Life Sci. 2009, 9, 384–390. [Google Scholar]
- 127. Koroleva A., Gill A. A., Ortega I., Haycock J. W., Schlie S., Gittard S. D., Chichkov B. N., Claeyssens F., Biofabrication 2012, 4, 025005. [DOI] [PubMed] [Google Scholar]
- 128. Serbin J., Egbert A., Ostendorf A., Chichkov B. N., Houbertz R., Domann G., Schulz J., Cronauer C., Fröhlich L., Popall M., Opt. Lett. 2003, 28, 301–303. [DOI] [PubMed] [Google Scholar]
- 129. Martineau C., Anémian R., Andraud C., Wang I., Bouriau M., Baldeck P. L., Chem. Phys. Lett. 2002, 362, 291–295. [Google Scholar]
- 130. Martineau C., Lemercier G., Andraud C., Wang I., Bouriau M., Baldeck P. L., in Optical Science and Technology, SPIE′s 48th Annual Meeting, Vol. 5211, SPIE, 2003. [Google Scholar]
- 131. Guo F., Guo R., Jiang Z., Zhang Q., Huang W., Guo B., Biofabrication 2005, 202, 2515–2520. [Google Scholar]
- 132. Xing J.-F., Zheng M.-L., Chen W.-Q., Dong X.-Z., Takeyasu N., Tanaka T., Zhao Z.-S., Duan X.-M., Kawata S., Phys. Chem. Chem. Phys. 2012, 14, 15785–15792. [DOI] [PubMed] [Google Scholar]
- 133. Xing J.-F., Dong X.-Z., Chen W.-Q., Duan X.-M., Takeyasu N., Tanaka T., Kawata S., Appl. Phys. Lett. 2007, 90, 131106. [Google Scholar]
- 134. Gan X., Zhou H., Shi P., Wang P., Wu J., Tian Y., Yang J., Xu G., Zhou Y., Jiang M., Sci. China Ser. B 2009, 52, 2180. [Google Scholar]
- 135. Zhang X., Yu X. Q., Zhang B. Q., Feng Y. G., Tao X. T., Jiang M. H., Chin. J. Chem. 2006, 24, 701–704. [Google Scholar]
- 136. Zhang X., Yu X., Sun Y., Xu H., Feng Y., Huang B., Tao X., Jiang M., Chem. Phys. 2006, 328, 103–110. [Google Scholar]
- 137. Arnoux C., Konishi T., Van Elslande E., Poutougnigni E.-A., Mulatier J.-C., Khrouz L., Bucher C., Dumont E., Kamada K., Andraud C., Baldeck P., Banyasz A., Monnereau C., Macromolecules 2020, 53, 9264–9278. [Google Scholar]
- 138. Lemercier G., Mulatier J.-C., Martineau C., Anémian R., Andraud C., Wang I., Stéphan O., Amari N., Baldeck P., C. R. Chim. 2005, 8, 1308–1316. [Google Scholar]
- 139. Belfield K. D., Schafer K. J., Liu Y., Liu J., Ren X., Stryland E. W. V., J. Phys. Org. Chem. 2000, 13, 837–849. [Google Scholar]
- 140. Kennedy S. M., Lytle F. E., Anal. Chem. 1986, 58, 2643–2647. [Google Scholar]
- 141. Fisher W. G., Wachter E. A., Lytle F. E., Armas M., Seaton C., Appl. Spectrosc. 1998, 52, 536–545. [Google Scholar]
- 142. Fitilis I., Fakis M., Polyzos I., Giannetas V., Persephonis P., J. Photochem. Photobiol. A 2010, 215, 25–30. [Google Scholar]
- 143. Fitilis I., Fakis M., Polyzos I., Giannetas V., Persephonis P., Mikroyannidis J., J. Phys. Chem. A 2008, 112, 4742–4748. [DOI] [PubMed] [Google Scholar]
- 144. Fitilis I., Fakis M., Polyzos I., Giannetas V., Persephonis P., Vellis P., Mikroyannidis J., Chem. Phys. Lett. 2007, 447, 300–304. [Google Scholar]
- 145. Park S. H., Lim T.-W., Yang D.-Y., Kong H. J., Kim R.-H., Kim K.-S., Lee K.-S., Bull. Korean Chem. Soc. 2004, 25, 1119–1120. [Google Scholar]
- 146. Henning I., Woodward A. W., Rance G. A., Paul B. T., Wildman R. D., Irvine D. J., Moore J. C., Adv. Funct. Mater. 2020, 30, 2006108. [Google Scholar]
- 147. Kolb H. C., Sharpless K. B., Drug Discovery Today 2003, 8, 1128–1137. [DOI] [PubMed] [Google Scholar]
- 148. Brunel D., Dumur F., New J. Chem. 2020, 44, 3546–3561. [Google Scholar]
- 149. Maroulis A. J., Hadjiantoniou-Maroulis C. P., Georgiou B., Seretoudi G., Sideridou-Karayannidou I., J. Macromol. Sci. A 1994, 31, 487–494. [Google Scholar]
- 150. Yuan M.-S., Wang D.-E., Xue P., Wang W., Wang J.-C., Tu Q., Liu Z., Liu Y., Zhang Y., Wang J., Chem. Mater. 2014, 26, 2467–2477. [Google Scholar]
- 151. Nelson E. W., Carter T. P., Scranton A. B., Macromolecules 1994, 27, 1013–1019. [Google Scholar]
- 152. Tanaka K., Koizumi Y., Igarashi T., Sakurai T., Macromolecules 2006, 39, 8556–8558. [Google Scholar]
- 153. Yang W. J., Kim C. H., Jeong M.-Y., Lee S. K., Piao M. J., Jeon S.-J., Cho B. R., Chem. Mater. 2004, 16, 2783–2789. [Google Scholar]
- 154. Kim S., Zheng Q., He G. S., Bharali D. J., Pudavar H. E., Baev A., Prasad P. N., Adv. Funct. Mater. 2006, 16, 2317–2323. [Google Scholar]
- 155. Yang W. J., Seo M. S., Wang X. Q., Jeon S.-J., Cho B. R., J. Fluoresc. 2008, 18, 403–411. [DOI] [PubMed] [Google Scholar]
- 156.W. J. Yang, D. Y. Kim, M.-Y. Jeong, H. M. Kim, S.-J. Jeon, B. R. Cho, Chem. Commun. 2003, 2618–2619. [DOI] [PubMed]
- 157. Yang W. J., Kim D. Y., Jeong M.-Y., Kim H. M., Lee Y. K., Fang X., Jeon S.-J., Cho B. R., Chem. Eur. J. 2005, 11, 4191–4198. [DOI] [PubMed] [Google Scholar]
- 158. Woo H. Y., Liu B., Kohler B., Korystov D., Mikhailovsky A., Bazan G. C., J. Am. Chem. Soc. 2005, 127, 14721–14729. [DOI] [PubMed] [Google Scholar]
- 159. Torgersen J., Ovsianikov A., Mironov V., Pucher N., Qin X., Li Z., Cicha K., Machacek T., Liska R., Jantsch V., Stampfl J., BIOMEDO 2012, 17, 105008–105008. [DOI] [PubMed] [Google Scholar]
- 160. Qin X. H., Torgersen J., Saf R., Mühleder S., Pucher N., Ligon S. C., Holnthoner W., Redl H., Ovsianikov A., Stampfl J., Liska R., J. Polym. Sci. Part A 2013, 51, 4799–4810. [Google Scholar]
- 161. Nuyken O., Knepper T., Voit B., Makromol. Chem. 1989, 190, 1015–1024. [Google Scholar]
- 162. Tromayer M., Dobos A., Gruber P., Ajami A., Dedic R., Ovsianikov A., Liska R., Polym. Chem. 2018, 9, 3108–3117. [Google Scholar]
- 163. Ajami A., Husinsky W., Tromayer M., Gruber P., Liska R., Ovsianikov A., Appl. Phys. Lett. 2017, 111, 071901. [Google Scholar]
- 164. Lu W.-E., Dong X.-Z., Chen W.-Q., Zhao Z.-S., Duan X.-M., J. Mater. Chem. 2011, 21, 5650–5659. [Google Scholar]
- 165. Li Z., Hu P., Zhu J., Gao Y., Xiong X., Liu R., J. Polym. Sci. Part A 2018, 56, 2692–2700. [Google Scholar]
- 166. Albota M., Beljonne D., Brédas J.-L., Ehrlich J. E., Fu J.-Y., Heikal A. A., Hess S. E., Kogej T., Levin M. D., Marder S. R., McCord-Maughon D., Perry J. W., Röckel H., Rumi M., Subramaniam G., Webb W. W., Wu X.-L., Xu C., Science 1998, 281, 1653. [DOI] [PubMed] [Google Scholar]
- 167. Ramakrishna G., Goodson T., J. Phys. Chem. A 2007, 111, 993–1000. [DOI] [PubMed] [Google Scholar]
- 168. Wang X., Wang D., Zhou G., Yu W., Zhou Y., Fang Q., Jiang M., J. Mater. Chem. 2001, 11, 1600–1605. [Google Scholar]
- 169. Abbotto A., Beverina L., Bozio R., Facchetti A., Ferrante C., Pagani G. A., Pedron D., Signorini R., Org. Lett. 2002, 4, 1495–1498. [DOI] [PubMed] [Google Scholar]
- 170. Zhou Y.-F., Meng F.-Q., Zhao X., Feng S.-Y., Jiang M.-H., Chem. Phys. 2001, 269, 441–445. [Google Scholar]
- 171. Zhao C. F., He G. S., Bhawalkar J. D., Park C. K., Prasad P. N., Chem. Mater. 1995, 7, 1979–1983. [Google Scholar]
- 172. Ray P. C., Leszczynski J., J. Phys. Chem. A 2005, 109, 6689–6696. [DOI] [PubMed] [Google Scholar]
- 173. Gu J., Yulan W., Chen W.-Q., Dong X.-Z., Duan X.-M., Kawata S., New J. Chem. 2007, 31, 63–68. [Google Scholar]
- 174. Li S., Lu C., Wan X., Zhang S., Li J., He Z., Zhang L., Mater. Today Commun. 2020, 24, 101219. [Google Scholar]
- 175. Ma X., Gu R., Yu L., Han W., Li J., Li X., Wang T., Polym. Chem. 2017, 8, 6134–6142. [Google Scholar]
- 176. Xu J., Ma G., Wang K., Gu J., Jiang S., Nie J., J. Appl. Polym. Sci. 2012, 123, 725–731. [Google Scholar]
- 177. Fast D. E., Lauer A., Menzel J. P., Kelterer A.-M., Gescheidt G., Barner-Kowollik C., Macromolecules 2017, 50, 1815–1823. [Google Scholar]
- 178. Hu P., Qiu W., Naumov S., Scherzer T., Hu Z., Chen Q., Knolle W., Li Z., ChemPhotoChem 2020, 4, 224–232. [Google Scholar]
- 179. Chung S.-J., Kim K.-S., Lin T.-C., He G. S., Swiatkiewicz J., Prasad P. N., J. Phys. Chem. B 1999, 103, 10741–10745. [Google Scholar]
- 180. Bhaskar A., Ramakrishna G., Lu Z., Twieg R., Hales J. M., Hagan D. J., Van Stryland E., Goodson T., J. Am. Chem. Soc. 2006, 128, 11840–11849. [DOI] [PubMed] [Google Scholar]
- 181. Tian Y.-P., Li L., Zhang J.-Z., Yang J.-X., Zhou H.-p., Wu J.-y., Sun P.-p., Tao L.-m., Guo Y.-h., Wang C.-K., Xing H., Huang W.-h., Tao X.-T., Jiang M.-H., J. Mater. Chem. 2007, 17, 3646–3654. [Google Scholar]
- 182. Whitby R., Ben-Tal Y., MacMillan R., Janssens S., Raymond S., Clarke D., Jin J., Kay A., Simpson M. C., RSC Adv. 2017, 7, 13232–13239. [Google Scholar]
- 183. Malval J.-P., Jin M., Morlet-Savary F., Chaumeil H., Defoin A., Soppera O., Scheul T., Bouriau M., Baldeck P. L., Chem. Mater. 2011, 23, 3411–3420. [Google Scholar]
- 184. Wu J., Shi M., Zhao Y., Wu F., Dyes Pigm. 2008, 76, 690–695. [Google Scholar]
- 185. Strickler S. J., Berg R. A., J. Chem. Phys. 1962, 37, 814–822. [Google Scholar]
- 186. Terenziani F., Katan C., Badaeva E., Tretiak S., Blanchard-Desce M., Adv. Mater. 2008, 20, 4641–4678. [Google Scholar]
- 187. Zheng Y.-C., Zhao Y.-Y., Zheng M.-L., Chen S.-L., Liu J., Jin F., Dong X.-Z., Zhao Z.-S., Duan X.-M., ACS Appl. Mater. Interfaces 2019, 11, 1782–1789. [DOI] [PubMed] [Google Scholar]
- 188. Lagona J., Mukhopadhyay P., Chakrabarti S., Isaacs L., Angew. Chem. Int. Ed. 2005, 44, 4844–4870; [DOI] [PubMed] [Google Scholar]; Angew. Chem. 2005, 117, 4922–4949. [Google Scholar]
- 189. Petrov N. K., Ivanov D. A., Golubkov D. V., Gromov S. P., Alfimov M. V., Chem. Phys. Lett. 2009, 480, 96–99. [Google Scholar]
- 190. Xiao P., Dumur F., Graff B., Morlet-Savary F., Vidal L., Gigmes D., Fouassier J. P., Lalevée J., Macromolecules 2014, 47, 26–34. [Google Scholar]
- 191. Tehfe M.-A., Dumur F., Graff B., Morlet-Savary F., Fouassier J.-P., Gigmes D., Lalevée J., Macromolecules 2013, 46, 3761–3770. [Google Scholar]
- 192. Tehfe M.-A., Dumur F., Graff B., Gigmes D., Fouassier J.-P., Lalevée J., Macromolecules 2013, 46, 3332–3341. [Google Scholar]
- 193. Li Z., Rosspeintner A., Hu P., Zhu G., Hu Y., Xiong X., Peng R., Wang M., Liu X., Liu R., Polym. Chem. 2017, 8, 6644–6653. [Google Scholar]
- 194. Drobizhev M., Meng F., Rebane A., Stepanenko Y., Nickel E., Spangler C. W., J. Phys. Chem. B 2006, 110, 9802–9814. [DOI] [PubMed] [Google Scholar]
- 195. Rebane A., Drobizhev M., Makarov N. S., Beuerman E., Haley J. E., Krein D. M., Burke A. R., Flikkema J. L., Cooper T. M., J. Phys. Chem. A 2011, 115, 4255–4262. [DOI] [PubMed] [Google Scholar]
- 196. Lalevée J., Blanchard N., El-Roz M., Graff B., Allonas X., Fouassier J. P., Macromolecules 2008, 41, 4180–4186. [Google Scholar]
- 197. Lalevée J., Blanchard N., Tehfe M. A., Fries C., Morlet-Savary F., Gigmes D., Fouassier J. P., Polym. Chem. 2011, 2, 1077–1084. [Google Scholar]
- 198. Chen S., Cao C., Shen X., Qiu Y., Kuang C., Wan D., Jin M., Eur. Polym. J. 2021, 153, 110525. [Google Scholar]
- 199. Mori T., Saomoto H., Machitani K., Inoue K., Aoki Y., Koshitani T., Koumura N., Murakami T. N., RSC Adv. 2016, 6, 13964–13970. [Google Scholar]
- 200. Qiu W., Hu P., Zhu J., Liu R., Li Z., Hu Z., Chen Q., Dietliker K., Liska R., ChemPhotoChem 2019, 3, 1090–1094. [Google Scholar]
- 201. Zhou R., Malval J.-P., Jin M., Spangenberg A., Pan H., Wan D., Morlet-Savary F., Knopf S., Chem. Commun. 2019, 55, 6233–6236. [DOI] [PubMed] [Google Scholar]
- 202. Ovsianikov A., Deiwick A., Van Vlierberghe S., Pflaum M., Wilhelmi M., Dubruel P., Chichkov B., Materials 2011, 4, 288. [DOI] [PMC free article] [PubMed] [Google Scholar]
- 203. Ovsianikov A., Deiwick A., Van Vlierberghe S., Dubruel P., Möller L., Dräger G., Chichkov B., Biomacromolecules 2011, 12, 851–858. [DOI] [PubMed] [Google Scholar]
- 204. Kufelt O., El-Tamer A., Sehring C., Schlie-Wolter S., Chichkov B. N., Biomacromolecules 2014, 15, 650–659. [DOI] [PubMed] [Google Scholar]
- 205.G. D. Giustina, S. Giulitti, L. Brigo, M. Zanatta, M. Tromayer, R. Liska, N. Elvassore, G. Brusatin, Macromol. Rapid Commun. 2017, 38, 1600570. [DOI] [PubMed]
- 206. Chibac A. L., Buruiana T., Melinte V., Mangalagiu I., Epurescu G., Buruiana E. C., Des. Monomers Polym. 2016, 19, 12–23. [Google Scholar]
- 207. Käpylä E., Sedlačík T., Aydogan D. B., Viitanen J., Rypáček F., Kellomäki M., Mater. Sci. Eng. C 2014, 43, 280–289. [DOI] [PubMed] [Google Scholar]
- 208. Ovsianikov A., Gruene M., Pflaum M., Koch L., Maiorana F., Wilhelmi M., Haverich A., Chichkov B., Biofabrication 2010, 2, 014104. [DOI] [PubMed] [Google Scholar]
- 209. Ovsianikov A., Chichkov B., Mente P., Monteiro-Riviere N. A., Doraiswamy A., Narayan R. J., Int. J. Appl. Ceram. Technol. 2007, 4, 22–29. [Google Scholar]
- 210. Schlie S., Ngezahayo A., Ovsianikov A., Fabian T., Kolb H.-A., Haferkamp H., Chichkov B. N., J. Biomater. Appl. 2007, 22, 275–287. [DOI] [PubMed] [Google Scholar]
- 211. Nava M. M., Maggio N. D., Zandrini T., Cerullo G., Osellame R., Martin I., Raimondi M. T., J. Tissue Eng. Regener. Med. 2017, 11, 2836–2845. [DOI] [PMC free article] [PubMed] [Google Scholar]
- 212. Giltinan J., Sridhar V., Bozuyuk U., Sheehan D., Sitti M., Adv. Intell. Syst 2021, 3, 2000204. [DOI] [PMC free article] [PubMed] [Google Scholar]
- 213. Yeung K.-W., Dong Y., Chen L., Tang C.-Y., Law W.-C., Tsui G. C.-P., Engstrøm D. S., Nanotechnol. Rev. 2020, 9, 418–426. [Google Scholar]
- 214. Heitz J., Plamadeala C., Wiesbauer M., Freudenthaler P., Wollhofen R., Jacak J., Klar T. A., Magnus B., Köstner D., Weth A., Baumgartner W., Marksteiner R., J. Biomed. Mater. Res. Part A 2017, 105, 891–899. [DOI] [PMC free article] [PubMed] [Google Scholar]
- 215. Scarpa E., Lemma E. D., Fiammengo R., Cipolla M. P., Pisanello F., Rizzi F., De Vittorio M., Sens. Actuators B 2019, 279, 418–426. [Google Scholar]
- 216. Harnisch E., Russew M., Klein J., König N., Crailsheim H., Schmitt R., Opt. Mater. Express 2015, 5, 456–461. [Google Scholar]
- 217. Zandrini T., Liaros N., Jiang L. J., Lu Y. F., Fourkas J. T., Osellame R., Baldacchini T., Opt. Mater. Express 2019, 9, 2601–2616. [Google Scholar]
- 218. Mendonca C. R., Correa D. S., Baldacchini T., Tayalia P., Mazur E., Appl. Phys. A 2008, 90, 633–636. [Google Scholar]
- 219. Baldacchini T., LaFratta C. N., Farrer R. A., Teich M. C., Saleh B. E. A., Naughton M. J., Fourkas J. T., J. Appl. Phys. 2004, 95, 6072–6076. [Google Scholar]
- 220. De Marco C., Gaidukeviciute A., Kiyan R., Eaton S. M., Levi M., Osellame R., Chichkov B. N., Turri S., Langmuir 2013, 29, 426–431. [DOI] [PubMed] [Google Scholar]
- 221. Cônsoli P. M., Otuka A. J. G., Balogh D. T., Mendonça C. R., J. Polym. Sci. Part B 2018, 56, 1158–1163. [Google Scholar]
- 222. Ummethala G., Jaiswal A., Chaudhary R. P., Hawal S., Saxena S., Shukla S., Polymer 2017, 117, 364–369. [Google Scholar]
- 223. Otuka A. J. G., Domeneguetti R. R., Moraes J. Q. R., Balogh D. T., Ribeiro S. J. L., Mendonça C. R., J. Phys. Photon. 2021, 3, 024003. [Google Scholar]
- 224. Soldevila S., Consuelo Cuquerella M., Lhiaubet-Vallet V., Edge R., Bosca F., Free Radical Biol. Med. 2014, 67, 417–425. [DOI] [PubMed] [Google Scholar]
- 225. Bardakova K. N., Faletrov Y. V., Epifanov E. O., Minaev N. V., Kaplin V. S., Piskun Y. A., Koteneva P. I., Shkumatov V. M., Aksenova N. A., Shpichka A. I., Solovieva A. B., Kostjuk S. V., Timashev P. S., Polymer 2021, 13, 3385. [DOI] [PMC free article] [PubMed] [Google Scholar]
- 226. Epifanov E. O., Timashev P. S., Faletrov Y. V., Piskun Y. A., Kostjuk S. V., Minaev N. V., Bardakova K. N., Bull. Russ. Acad. Sci.: Phys. 2020, 84, 1406–1410. [Google Scholar]
- 227. Kiefer P., Hahn V., Nardi M., Yang L., Blasco E., Barner-Kowollik C., Wegener M., Adv. Opt. Mater. 2020, 8, 2000895. [Google Scholar]
Associated Data
This section collects any data citations, data availability statements, or supplementary materials included in this article.
Data Availability Statement
The data that support the findings of this study are available from the corresponding author upon reasonable request.