

Summary
Plant‐derived Vitamin C (l‐ascorbic acid (AsA)) is crucial for human health and wellbeing and thus increasing AsA content is of interest to plant breeders. In plants GDP‐l‐galactose phosphorylase (GGP) is a key biosynthetic control step and here evidence is presented for two new transcriptional activators of GGP.
AsA measurement, transcriptomics, transient expression, hormone application, gene editing, yeast 1/2‐hybrid, and electromobility shift assay (EMSA) methods were used to identify two positively regulating transcription factors.
AceGGP3 was identified as the most highly expressed GGP in Actinidia eriantha fruit, which has high fruit AsA. A gene encoding a 1R‐subtype myeloblastosis (MYB) protein, AceMYBS1, was found to bind the AceGGP3 promoter and activate its expression. Overexpression and gene‐editing show AceMYBS1 effectively increases AsA accumulation. The bZIP transcription factor AceGBF3 (a G‐box binding factor), also was shown to increase AsA content, and was confirmed to interact with AceMYBS1. Co‐expression experiments showed that AceMYBS1 and AceGBF3 additively promoted AceGGP3 expression. Furthermore, AceMYBS1, but not GBF3, was repressed by abscisic acid, resulting in reduced AceGGP3 expression and accumulation of AsA.
This study sheds new light on the roles of MYBS1 homologues and ABA in modulating AsA synthesis, and adds to the understanding of mechanisms underlying AsA accumulation.
Keywords: abscisic acid (ABA), Actinidia, ascorbate, fruit, GDP‐galactose phosphorylase, Nicotiana benthamiana, vitamin C
Introduction
In plants, l‐ascorbic acid (AsA; vitamin C) is a major antioxidant with roles in photosynthesis, respiration, cell division, growth regulation, integrating phytohormone signalling and ageing (Sanmartin et al., 2003; Barth et al., 2006; Kotchoni et al., 2009; Smirnoff, 2011; Hanxia et al., 2015; Bu et al., 2016; Y. Yu et al., 2019; Zhang et al., 2020; Bulley et al., 2021). As an essential micronutrient that humans have lost the ability to produce, AsA is required for key metabolic functions in humans and must be obtained from the diet, mainly from fruits and vegetables. Today, eating sufficient amounts of fruits and vegetables to consistently maintain optimum AsA concentrations is still a challenge for people in both developed and developing countries (Troesch et al., 2012). Having higher plasma vitamin C concentrations is associated with positive health benefits such as reducing the risk of stroke, supporting the immune system, supporting cardiovascular health and reducing skin age appearance (Myint et al., 2008; Moser & Chun, 2016; Carr & Maggini, 2017; Pullar et al., 2017). Considering the important role of AsA in human health, studies on the molecular mechanism underlying AsA accumulation in the fruit of some very high AsA‐containing species, those with c. 500–3000 mg 100 g−1 FW could help breeders increase the AsA content of crop plants in the future (Macknight et al., 2017). Examples of these AsA superfruits include some species of the Actinidia genus (kiwifruit), Rosa roxburghii (chestnut rose), Myrciaria dubia (camu–camu) (Castro et al., 2015), Terminalia ferdinandiana (Kakadu plum) and Malpighia glabra (acerola) (Badejo et al., 2007). Indeed the high AsA trait carried by A. eriantha recently has been mapped to chromosome 26 and segregates as a large nonrecombinant portion of chromosome in A. eriantha × A. deliciosa × A. chinensis hybrids (McCallum et al., 2019).
In plants, the accumulation of AsA is maintained in homeostasis through synthesis, recycling and degradation, as well as intra‐ and intercellular transport (Horemans et al., 2000; Green & Fry, 2005a,b; Venkatesh & Park, 2014). It is well‐known that AsA biosynthesis occurs through l‐galactose, l‐galacturonate and possibly l‐myoinositol in certain instances (Wheeler et al., 1998; Agius et al., 2003; Lorence et al., 2004; Bulley & Laing, 2016). The l‐galactose pathway is the predominant route through which AsA accumulates in higher plants. All of the genes involved in this pathway have been characterized, and the flux‐limiting steps in this pathway are the conversion of d‐mannose‐1‐P to l‐galactose‐1‐P, which is catalyzed in succession by the enzymes GDP‐d‐mannose pyrophosphorylase (GMP), GDP‐d‐mannose 3′,5′ epimerase (GME) and GDP‐l‐galactose‐phosphorylase (GGP). Mounting evidence suggests that GGP is the key conduit for regulating AsA biosynthesis in plants (Dowdle et al., 2007; Laing et al., 2007, 2015; Linster et al., 2007; Bulley et al., 2009; Mellidou & Kanellis, 2017; Fenech et al., 2021). Overexpressing the GGP gene consistently results in significant increases in AsA in a wide range of plant species (Macknight et al., 2017). For example, up to a six‐fold increase in AsA was achieved by overexpressing GGP in tomato (Bulley et al., 2012).
The classical view of transcription factors (TFs) is that they regulate plant developmental and physiological processes by recognizing specific cis‐acting elements and binding to promoters of target genes to control gene expression. To date, a number of TFs have been reported to be involved in AsA biosynthesis. These include the AP2 ethylene response factors ERF98 (Zhang et al., 2012) and ABI4 (expressed only in roots) (Y. Yu et al., 2019), the F‐box protein ascorbic acid mannose pathway regulator 1 (AMR1) (Zhang et al., 2009), the basic helic‐loop‐helix bHLH59 (Ye et al., 2019), the HD‐Zip family TF SlHZ24 (Hu et al., 2016), and a novel ethylene‐responsive TF (BcERF070) in cabbage (Brassica rapa ssp. chinensis) that binds to the dehydration‐responsive elements (DREs) of seven target gene promoters to alter the AsA content (Yuan et al., 2020). These factors, however, function differently and have relatively subtle effects (≤ 1.7‐fold) on the AsA content.
In the present study, we analyzed the AsA content in 48 Actinidia species and identified a new R1‐MYB TF (AceMYBS1; MYB, myeloblastosis) from A. eriantha, whose fruit have a very high AsA content (500–1200 mg 100 g−1 FW, > 10 times the AsA content of an orange fruit or > 50–120 times that of potato). This MYB appears to be a significant regulator of fruit AsA accumulation. We also identify a bZIP transcription factor AceGBF3 (GBF, G‐box binding factor) which also can increase AsA and physically interacts with AceMYBS1. We also show that AceMYBS1, but not GBF3, is repressed by ABA which provides new insight about the molecular regulatory mechanism underlying AsA biosynthesis in kiwifruit.
Materials and Methods
Plant materials and growth conditions
Fruit samples were collected from field‐grown plants in Hubei, China, during the 2016–2018 growing season. The l‐ascorbic acid (AsA) content in the fruit of 48 Actinidia Lindl. species and one cross‐population (A. eriantha Benth. × A. rufa (Siebold & Zucc.) Planch. ex Miq.) were measured during 2017–2019. Six kiwifruit taxa with significant variations in AsA content (> 150‐fold), A. eriantha Benth., A. latifolia (Gardner & Champ.) Merr., A. deliciosa (A. Chev.) C.F. Liang and A.R. Ferguson, A. chinensis Planch., A. rufa (Siebold & Zucc.) Planch. ex Miq and A. cylindrica C.F. Liang, were selected to study the changes in AsA during fruit development. The media and protocols used were the same as those described previously (Z. Wang et al., 2018). Tissue‐cultured materials for both tobacco (Nicotiana benthamiana Domin) and kiwifruit (A. eriantha Benth.) were grown at 23–25°C under long‐day conditions (16 h : 8 h, light : dark photoperiod). Transgenic and gene‐edited plants were potted and grown in containment glasshouse‐1 at the Wuhan Botanical Garden, Chinese Academy of Sciences, Hubei, China (14 h : 10 h, light : dark photoperiod, 18°C min, 30°C max). Samples collected from individual plants were considered to be biological replicates.
Illumina RNA‐seq and transcriptome analysis
The detailed procedures of Illumina RNA‐seq and transcriptome analysis are described in Supporting Information Methods S1, and the sequence data were uploaded to GenBank of NCBI (https://www.ncbi.nlm.nih.gov/) under accession nos. PRJNA771781 and PRJNA771785.
AsA measurement
Measurement of total AsA concentration was performed following the method as described previously, with minor modifications (Queval & Noctor, 2007; Li et al., 2016; Liu et al., 2021). Approximately 1.0 g of sample was harvested and immediately frozen in liquid nitrogen. The frozen samples were ground to a fine powder and extracted with 5 ml 0.1% metaphosphoric acid solution. After centrifuging at 8000 g for 10 min at 4°C, the supernatants and AsA standards (GWL8‐54KE, China) were neutralized with NaOH and the final pH of all samples was between 5 and 6. The neutralized supernatants were pre‐treated with 5 mM DL‐dithiothreitol (DTT) for 30 min at room temperature. Next, the supernatants were filtered through a 0.22‐μm filter and 10.0 μl of the supernatant was injected into Accela 1250 HPLC system (Thermo Fisher Scientific, Waltham, MA, USA) on a monomeric C18 column (Wondasil C18, Columns 5 µm, 4.6 × 150 mm; GL Sciences Inc., Shanghai, China) with a mobile phase of 0.1% metaphosphoric acid and acetonitrile (98 : 2, v/v). The flow rate of 0.5 ml min−1 and injection volume of 10.0 μl. The standard curve was drawn from the measured values of the AsA standard sample. The standard curves for AsA were generated as references to quantify the AsA content in the samples.
RNA extraction and quantitative reverse transcription (RT)‐PCR analysis
Total RNA was isolated with an RNA Extraction Kit (Tiangen, Beijing, China) and the quantitative (q)RT‐PCR analysis as described previously (Z. Wang et al., 2018); additional details are described in Methods S1 and primer sequences are listed in Table S1.
Phylogenetic analysis and tree construction
A phylogenetic tree for myeloblastosis (MYB)S1 was constructed using mega7.0 (Kumar et al., 2016) software with kiwifruit and other species sequences retrieved from the kiwifruit database (http://kiwifruitgenome.org/) and the GenBank database (Table S2), respectively. Genetic distances were calculated using the Jukes–Cantor distance matrix and evolutionary relationships were inferred using the neighbour‐joining method with 1000 bootstrap resampling.
Vector construction and kiwifruit transformation
The coding DNA sequences (CDS) of AceGGP3, AceMYBS1 and AceGBF3 were amplified from cDNA of A. eriantha and cloned into the overexpression vector POE‐3Flag‐DN (from Wuhan Botanical Garden laboratory) which has 35S promoter driven expression as well as resistance screening markers G418 (Geneticin; Invitrogen) and kanamycin to generate 35S::AceGGP3, 35S::AceMYBS1, 35S::AcrMYBS1 and 35S::AceGBF3, respectively G‐box binding factor (GBF).
The AceGGP3 and AceMYBS1 were edited by CRISPR/Cas9 as described previously (Z. Wang et al., 2018). CRISPR RGEN Tools (http://www.rgenome.net/?tdsourcetag=s_pcqq_aiomsg) was used to select specific sgRNAs that targeted AceGGP3 and AceMYBS1, respectively, and the sgRNAs were cloned into CRISPR/Cas9 vector to generate Cas9‐AceGGP3 and Cas9‐AceMYBS1 editing vectors. Using Agrobacterium‐mediated transformation, the recombinant plasmids were transformed into the calli of A. eriantha following methods described previously (Akbaş et al., 2009; X. Wang et al., 2018; Z. Wang et al., 2018). The primers used for vector construction and identification of transgenic lines are listed in Table S1.
Transient expression assay in kiwifruit and tobacco
The antisense viral vectors Anti‐AceGGP3, Anti‐AceMYBS1 and Anti‐AceGBF3 were obtained by cloning the CDS of AceGGP3, AceMYBS1 and AceGBF3 into TRV2 vector (An et al., 2019; M. Yu et al., 2019) respectively. TRV1 vector was used as an auxiliary plasmid. The TRV1 and TRV2 vectors each were transformed into Agrobacterium tumefaciens GV3101 and mixed each other when injected or transfected into the fruits and calli of A. eriantha. The same method was used for transient overexpression experiments with 35S‐driven AceGGP3, AceMYBS1 and AceGBF3 vectors in A. eriantha and N. benthamiana (tobacco) leaves.
Yeast one‐hybrid assay
Yeast one‐hybrid (Y1H) assay was performed as described previously (Lin et al., 2007; Cheng et al., 2021; Fu et al., 2021). The promotor sequence of AceGGP3 (2.6‐kb; Table S2) were amplified and inserted into the corresponding sites of the reporter plasmid pLacZi (Clontech; TaKaRa Bio Inc., Shiga, Japan) to generate AceGGP3 pro::LacZ. The CDS of AceMYBS1 were cloned separately into pJG4‐5 vectors (Clontech; TaKaRa Bio Inc.) to construct pJG‐AceMYBS1. The NcoI‐cut AceGGP3 pro::LacZ vector was co‐transformed with pJG‐AceMYBS1 vector into yeast strain EGY48 using a high‐efficiency yeast transformation method (Gietz & Schiestl, 2007), respectively. The p53::LacZ+pJG‐p53 was used as positive control and the AceGGP3pro::LacZ add the pJG4‐5 empty vector was the negative control. Transformants grew on SD/‐Trp‐Ura dropout medium. We selected transformants on the medium with 6.7 g l−1 yeast nitrogen base, 20 g l−1 Galactose, 10 g l−1 Raffinose, 2 g l−1 dropout mix‐TRP‐URA and 20 g l−1 agar. After sterilization at 121°C for 15 min, 100 ml 10 × BU salt (contain 70 g l−1 Na2HPO4·7H2O and 30 g l−1 NaH2PO4, pH = 7.0) and 0.08 mg ml−1 X‐gal were added for colorimetric screening. All of the yeast strains were incubated at 30°C for 3 d. The primers are listed in Table S1.
Yeast two‐hybrid assay
Construction of a cDNA library of kiwifruit for yeast two‐hybrid (Y2H) experiments was carried out by GeneCreate Biological Engineering Co. Ltd (Wuhan, China) using mRNA from the leaves and fruits. Details are described in Methods S1.
Transcriptional activation analysis
The full‐length cDNA of AceMYBS1 and AceGBF3 were PCR‐amplified and fused into pGBKT7 vector to generate two constructs (BD‐AceMYBS1 and BD‐AceGBF3) which were transformed into the yeast strain AH109. The transcriptional activation analysis was performed as described previously (Geng & Liu, 2018).
Dual‐luciferase assay
For the Dual‐luciferase (Dual‐LUC) assay, the full‐length promoter of AceGGP3 (2.6 kb, Notes S1) or their truncated fragments were cloned into the pGreen0800‐Luc vector (Hellens et al., 2005) to obtain reporters: AceGGP3pro‐2660:: LUC (P2660 ), AceGGP3pro‐1106::LUC (P1106 ), AceGGP3pro‐1606::LUC (P1606 ) and AceGGP3pro‐2088::LUC (P2088 ). The 35S: AceMYBS1 and 35S: AceGBF3 were transformed into A. tumefaciens strain EHA105. Mixed effector and reporter construct carrying cultures (5 : 1, v/v, respectively) were co‐infiltrated into 4‐wk‐old tobacco leaves as described previously (Gao et al., 2020). After incubation for 2–3 d at 23°C, the promoter activities were determined by measuring Firefly Luciferase to Renilla Luciferase (LUC/REN) ratios using a Dual‐luciferase Kit (TransGen, Beijing, China) with a Chemiluminescence Imaging System (Clinx, Shanghai, China).
Protein expression and electrophoretic mobility shift assay
The full‐length AceMYBS1 CDS was inserted into the pET32a vector (Novagen; Merck KGaA, Darmstadt, Germany) containing 6xHis (fusion both in the N‐terminal and C‐terminal) and expressed using E. coli strain BL21 (TransGen) to produce recombinant AceMYBS1‐His protein. An E. coli strain expressing 6xHis was used as a negative control. Escherichia coli was cultivated for 12 h at 16°C and then diluted 1 : 100 (v/v) into fresh medium and grown on for another 2–3 h at 37°C. When cell growth reached the logarithmic phase, IPTG was added to 0.5 mM final concentration and induced protein expression proceeded at 16°C for 10–12 h. The fusion protein was purified according to manufacturer instructions using Proteinlso Ni‐NAT Resin (TransGen). The oligonucleotide probes (Table S1) containing the AceMYBS1 binding sequences of AceGGP3, which was predicted by jaspar2020 (http://jaspar.genereg.net/) were synthesized and labelled with biotin. Double‐strand DNA probes were obtained by annealing two complementary oligonucleotides. The fusion protein AceMYBS1‐His was mixed with probes and incubated at room temperature for 20 min. DNA gel mobility shift assay was performed using the EMSA Kit (Beyotime Biotechnology, Jiangsu, China) following the manufacturer’s protocol.
Subcellular localization
The AceMYBS1‐YFP or AceGBF3‐YFP mixed with NLS‐mCherry‐RFP were co‐infiltrated into tobacco leaves with infiltration buffer as described previously (Gao et al., 2020). Fluorescence was observed 48 h post‐infiltration by Confocal Microscopy (Leica TCS‐SP8; excitation wavelength with YFP: 510 nm and RFP: 552 nm).
Bimolecular fluorescence complementation assay
The full‐length AceMYBS1 CDS was fused with C‐terminal YFP ( CYFP), and AceGBF3 was fused with N‐terminal YFP ( NYFP). The recombinant vectors or control (empty vectors) were transformed into A. tumefaciens strain EHA105 and then co‐transformed into onion epidermal cells with infiltration buffer (Zhu et al., 2020). YFP fluorescence was detected by Confocal Microscopy (Leica TCS‐SP8; excitation wavelength with YFP: 510 nm and DAPI: 488 nm) 48 h after infiltration.
Pull down
The full‐length CDS of AceGBF3 was cloned into pGEX‐4T vector (GE Healthcare, Chicago, IL, USA) in which it is fused to glutathione‐S‐transferase (GST) sequence. The recombinant vectors were introduced into BL21 cells to produce AceGBF3‐GST fusion protein, and expressed AceGBF3‐GST and AceMYBS1‐6xHis fusion protein was purified as described previously (Xu, 2020). Aliquots (20 μl) of AceGBF3‐GST and AceMYBS1‐His proteins were mixed with 1 ml binding buffer (50 mM Tris–HCl (pH = 7.5), 100 mM NaCl, 0.25% Triton‐X100 (v/v), 35 mM β‐Mercaptoethanol), then 50 μl Proteinlso GST Resin or 50 μl Proteinlso Ni‐NAT Resin (TransGen) was added and the mixture was rotated at 4°C for 3–4 h. The samples were washed four times with binding buffer, with expressed GST or 6xHis used as negative controls. 6xSDS protein loading buffer was added to samples (to 1× final) and samples were denatured by boiling for 10 min before electrophoresis. After electrophoresis the gels analyzed by Western blot using anti‐HiS (1 : 10 000 (v/v), Proteintech, 66005‐1‐lg) and anti‐GST (1 : 10 000 (v/v), Proteintech, 66002‐2‐lg; both sourced from Wuhan Sanying, Wuhan, China) antibodies.
Bimolecular luminescence complementation assay
Bimolecular luminescence complementation (BiLC) assay was performed as described previously (Chen et al., 2008). The full‐length of AceMYBS1 and AceGBF3 CDS were inserted into pCAMBIA1300‐cLUC and pCAMBIA1300‐nLUC vector to create AceMYBS1‐cLUC and AceGBF3‐nLUC constructs, respectively. Agrobacterium cultures harbouring the different constructs were mixed at 1 : 1 (v/v) and co‐transformed into tobacco leaves. Plants were incubated under dark for 12 h and then transferred to light conditions at 25°C for 48 h. Immediately before LUC activity observation, the transformed tobacco leaves were soaked in 0.15 mg ml−1 d‐Luciferin potassium (Coolaber, Beijing, China) for 2–3 min and images were captured using a Chemiluminescence Imaging System (Clinx, Shanghai, China).
ABA treatment
Different concentrations and durations of ABA treatment were used to investigate the effects of ABA on AsA biosynthesis in different materials of kiwifruit. First, ABA (GoldBio, St Louis, MO, USA) was added (0, 1, 2, 3, 5, 10 μM) to the callus media of A. eriantha, which were allowed to grow for 3 d under 16 h : 8 h, light : dark photoperiod at 25°C. Secondly, fruit from 80 d after flowering (DAF) A. eriantha on a vine or in vitro were sprayed with 20 μM ABA (or water for control) and then sampled at different times (0, 3, 5, 8, 10 d) thereafter.
Statistical analyses
One‐way ANOVA was performed using spss v.20 (IBM Corp., Armonk, NY, USA), and Student’s t‐test was performed using GraphPad 8.0 software. Significant differences were detected by Student’s t‐tests. In the figures, the following notations are used: *, P < 0.05; **, P < 0.01; and ***, P < 0.001. In figures, the different letters above the bars denote significance groupings (P < 0.05) as determined by ANOVA, the data represent the mean values, and error bars represent SD.
Accession numbers
The sequence information for this study was obtained from http://kiwifruitgenome.org, https://solgenomics.net/organism/Nicotiana_benthamiana/genome, and https://www.ncbi.nlm.nih.gov/ databases. Additionally, corresponding Acc gene models from A. chinensis (genotype Red5) are also referred to, and are the PS1.1.69.0 version gene models (Pilkington et al., 2018). The GenBank accession numbers are listed in Table S2.
Results
In order to determine the AsA variation among members of the Actinidia genus, the AsA content in the fruit of 48 species was determined by HPLC. The concentration varied 269‐fold, ranging from 4.4 to 1185 mg 100 g−1 FW (Fig. 1a). Species with low (0–30 mg 100 g−1 FW), moderate (31–200 mg 100 g−1 FW) and high AsA (201–1200 mg 100 g−1 FW) contents constituted 29.1%, 56.3% and 14.6% of the species, respectively. Changes in AsA contents during the growing season were determined in six Actinidia species representing low, moderate and high AsA concentrations (Fig. 1b). AsA content in Actinidia species with high or moderate fruit AsA content accumulated AsA rapidly after fertilization, peaking at DAF40–60, before decreasing as the fruit progressed towards maturity, whereas that of low‐AsA content species stayed low during the whole growing season (Fig. 1b). AsA biosynthesis during early fruit development appears to be the main reason for AsA accumulation among members of the Actinidia genus, and differences in AsA synthesis at this stage might constitute the main determinant of AsA variation among Actinidia species.
Fig. 1.
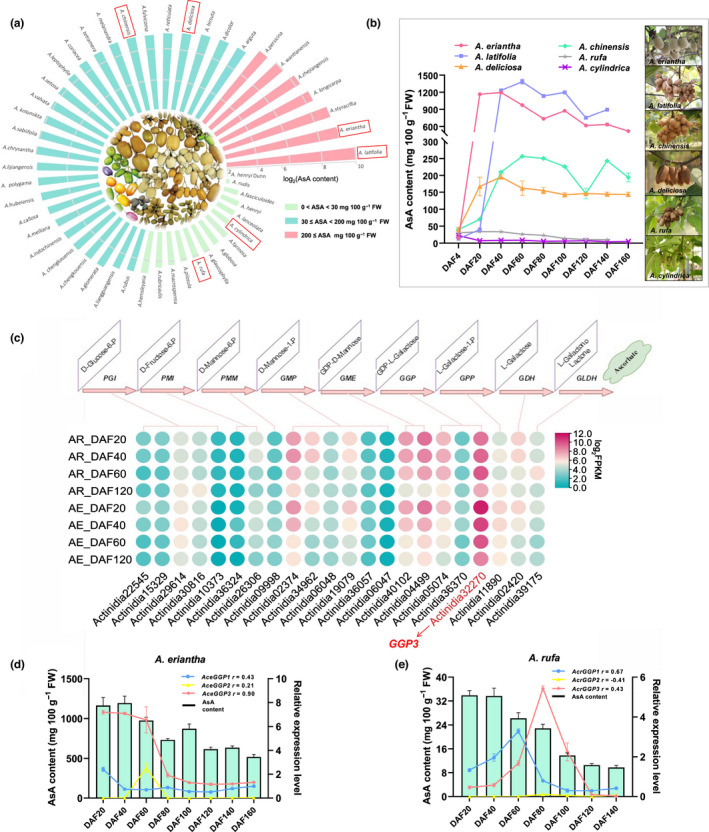
The variation of fruit ascorbic acid (AsA) content and key gene expression analysis in Actinidia species. (a) The circle bar charts showing the AsA content (log2) of 48 different Actinidia species. The AsA content of the different species was classified into three classes: red bars, high AsA content (AsA ≥ 200 mg 100 g−1 FW); blue bars, medium AsA content (30 ≤ AsA < 200 mg 100 g−1 FW); and green bars, low AsA content (AsA < 30 mg 100 g−1 FW). The red rectangles marked six Actinidia species with high (A. eriantha and A. latifolia), medium (A. chinensis and A. deliciosa) and low (A. rufa and A. cylindrica) fruit AsA concentration. (b) Changes of fruit AsA concentration in six species during growing season. (c) Circle heatmap showing the expression profile (log2FPKM) of orthologous genes in the l‐galactose pathway in the kiwifruit. The gene model associated with GGP3 is highlighted in red text. The correlation between the expression of GGP (GGP1, GGP2 and GGP3) and AsA content of (d) A. eriantha and (e) A. rufa in fruit developmental stage (every 20 d). Error bars indicate ± SD (n = 3).
In order to identify potential AsA regulatory genes, transcriptome sequencing of fruit at 20, 40, 60 and 120 DAF time points was performed for A. eriantha and A. rufa, whose fruit presented a > 30‐fold difference in AsA content. A total of 24 415 differentially expressed genes (DEGs) were identified by pairwise comparisons (Fig. S1a), and gene ontology (GO) enrichment analysis revealed that these DEGs were significantly enriched in biological processes related to the response to catalytic activity and biosynthetic processes (Fig. S1b). The transcript Actinidia32270, encoding GGP3, was identified in A. eriantha on the basis of the increased transcript abundance in the l‐galactose pathway (Fig. 1c). Three GGP homologous genes were further subjected to qRT‐PCR and correlation analysis of AsA contents in the fruits of A. eriantha, A. rufa and their hybrids at different developmental stages (Figs 1d,e, S2). GGP3 in A. eriantha (AceGGP3) was most highly expressed and positively correlated with the high AsA content in the fruits (Figs 1d,e, S2). Furthermore, GGP3 expression also was correlated to AsA concentration in the A. eriantha × A.rufa hybrid (Fig. S3a,b), and the expression of AceGGP3 allele derived from A. eriantha was significantly higher than the expression of the A. rufa‐derived allele AcrGGP3 (Fig. S3c).
AceGGP3 overexpression leads to a sharp accumulation of AsA in kiwifruit
Transient expression assay experiments were performed to confirm the function of AceGGP3 in AsA accumulation using 35S‐driven AceGGP3 overexpression and silencing constructs in on‐vine kiwifruit and calli in tissue culture. At 7 d postinfiltration AceGGP3 expression and AsA content were slightly higher than in the control fruit (Fig. 2a,b). Moreover, silencing of AceGGP3 in fruiting plants led to a c. 24.0% decrease in AsA compared with that in fruit infiltrated with bacteria harbouring empty vectors (Fig. 2b). In transient assays of A. eriantha calli, overexpression of AceGGP3 significantly increased the AsA content (Fig. S4). It is likely that the small AsA increase in transient fruit expression is a consequence of challenges with performing transient expression in on‐vine fruit with potentially inconsistent results. Callus tissue showed much higher increases in AsA.
Fig. 2.
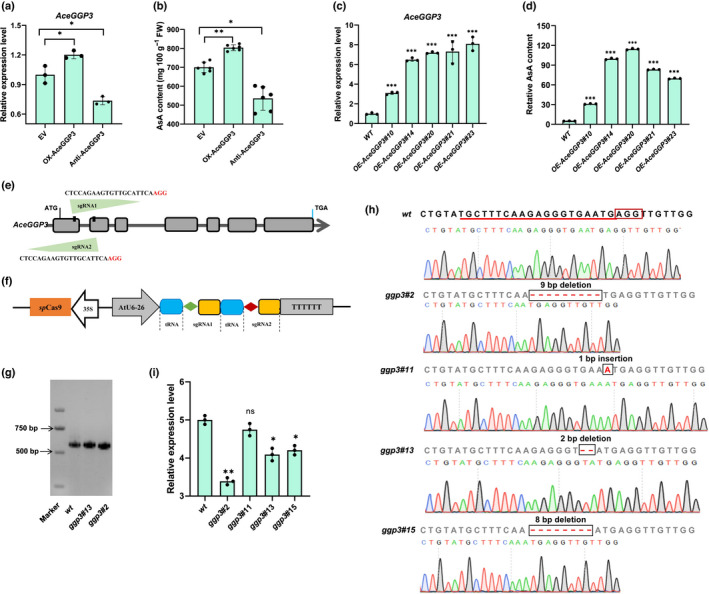
Over‐ or knock‐down expression of GDP‐l‐galactose‐phosphorylase (AceGGP3) alters ascorbic acid (AsA) concentration in Actinidia eriantha fruit and calli. (a) Analysis of AceGGP3 expression abundance and (b) AsA content of A. eriantha fruits with transiently expressed‐AceGGP3 7 d after vector infiltration. EV, empty vector; OX‐AceGGP3, AceGGP3‐overexpression; TRV‐AceGGP3, AceGGP3‐antisense expression. Experiments were performed in six kiwifruits per genotype. (c) Quantitative reverse‐transcription (qRT)‐ PCR analysis of AceGGP3 and (d) relative AsA content in the five transgenic calli of A. eriantha with AceGGP3‐overexpressed. WT, wild‐type; OE‐GGP3#10, OE‐GGP3#14, OE‐GGP3#20, OE‐GGP3#21 and OE‐GGP3#23 represent five different transgenic lines. (e) Schematic map of the sgRNA targeted sited on the exon regions of AceGGP3. Lines, intergenic region and introns; grey boxes, exons; red bases, PAM motifs (NGG). (f) Schematic diagram of the CRISPR/Cas9 vector and target site selection in the AceGGP3 gene. Sequences of the two sgRNA: sgRNA1 (CTCCAGAAGTGTTGCATTCAAGG) and sgRNA2 (TGCTTTCAAGAGGGTGAATGAGG). (g) Example of amplification using gene‐specific primers, which identified the deletion in AceGGP3 in lines ggp3#13 and ggp3#2, the wild‐type (wt) as a control. (h) Sequencing results and chromatograms of the AceGGP3 homozygous mutant lines from the T1 generation. Red box, PAM motif; underlining, target sequence; dashes, deletions; and red letters, insertions. (i) Relative AsA content of A. eriantha calli in CRISPR/Cas9‐induced mutants in the AceGGP3. ggp3#2, ggp3#11, ggp3#13 and ggp3#15 represent four gene editing lines (wt, wild‐type). Each experiment of (c), (d) and (i) was performed in three replicates. All error bars denote ± SD. Significant differences were detected by Student’s t‐test using GraphPad prism 8: *, P < 0.05; **, P < 0.01; ***, P < 0.001; ns, not significant. Black circles in bar charts represent individual data points.
In order to further analyze AceGGP3 function, transgenic kiwifruit lines were generated by Agrobacterium transformation of calli. Five independent transgenic lines of A. eriantha overexpressing AceGGP3 were obtained. Compared with wild‐type (WT) plants, the transgenic plants exhibited varying degrees of AceGGP3 gene expression, from 3.1‐ to 8.1‐fold (Fig. 2c), and AsA contents increased by 6.3‐, 20.0‐, 22.7‐, 16.7‐ and 14.1‐fold, respectively (Fig. 2d). AceGGP3 then was mutated in kiwifruit via the CRISPR/Cas9 system, and the two targeted sites were located on the first and second exons of AceGGP3 (Fig. 2e,f). In total, four G418‐resistant lines containing three types of homozygous mutant AceGGP3 genes (ggp3#2, a 9‐bp deletion; ggp3#11 and #15, an 8‐bp deletion; ggp3#13, a 2‐bp insertion; Fig. 2g,h) were selected. Three mutations resulted in frameshift mutations or amino acid deletions that induced premature termination or truncation of the predicted protein, causing a loss of the AceGGP3 gene function. The AsA content in the fruit of the ggp3 mutants decreased by 32.2%, 5.11% (not statistically significant), 18.2% and 15.9% compared with that of the WT (Fig. 2i). The 1‐bp insertion in gg3#11 was predicted to cause a non‐sense frameshift but AsA amounts remained effectively unchanged. However, a scan of open reading frames (ORFs) in this mutated CDS showed that translation initiation from the fourth ATG codon downstream would produce a truncated version of GGP missing 53 amino acids from the N‐terminus, and the unchanged AsA content in gg3#11 suggests that this variant has functional GGP activity. Collectively, the results show that up‐ or downregulated expression of AceGGP3 has a large effect on AsA accumulation in A. eriantha.
AceMYBS1 acts as a transcriptional activator of AceGGP3
Through transcriptome analysis a TF, Actinidia31027 (Actinidia chinensis (Hongyang) protein v3; Acc18653.1: Actinidia chinensis Red5 Genome, LG16‐18681898 … 18 684 251; DTZ79_16g09490: Actinidia eriantha White Genome, Chr16: 11 608 690 … 11 611 254), whose expression was strongly correlated with Actinidia32270 (GGP3) expression, was identified (Table S3), and qRT‐PCR analysis also showed that its expression was highly correlated with both AceGGP3 expression and AsA content in A. eriantha (Fig. S5a,b). A phylogenetic tree comprising the sequences of amino acids of Actinidia31027 and MYBs of other plant species showed that Actinidia31027 was most closely related to TwMYBS1 from Tripterygium wilfordii, as they shared 86% amino acid sequence identity, whereas it was most distant to CcMYB5 from Citrus clementina (Fig. S5c). We thus designated this protein as AceMYBS1. Multiple alignments performed on the smart website (http://smart.embl‐heidelberg.de/) (Schultz et al., 1998; Letunic et al., 2020) showed that Actinidia31027 contains two SANT/MYB regions. A SANT domain is a protein domain that allows many chromatin remodelling proteins to interact with histones (Boyer et al., 2002, 2004), and because SANT domains share many similarities with MYB DNA binding domains, they are often conflated. SANT and MYB domains can be distinguished by the predicted isolectric point (pI) of the domain peptide, with histone‐interacting SANT domains having acidic pIs, and MYB DNA binding domains having basic pI (Ko et al., 2008). The N‐terminal SANT of Actinidia31027 has a predicted acidic pI and the second SANT/MYB region has a predicted basic pI (Fig. S6). Therefore, this predicts that AceMYBS1 has one histone‐interacting domain at its N‐terminus side and a MYB DNA‐binding domain in the middle of the protein (Fig. S6).
In order to reveal the mechanism by which AceGGP3 is regulated by AceMYBS1, we first conducted a Y1H assay. All of the yeast cells grew well on SD/‐Trp/‐Ura media, whereas only the positive control and bait vector AceGGP3pro::LacZ co‐transformed with the prey vector pJG‐AceMYBS1 had blue cells on media supplemented with X‐gal showing AceMYBS1‐promoted expression of LacZ driven by the AceGGP3 promoter (Fig. 3a,b). The AceMYBS1 and AceGGP3 promoter co‐transfected tobacco also had a much higher relative LUC/REN ratio than control in a Dual‐LUC assay supporting interaction (Fig. S7).
Fig. 3.
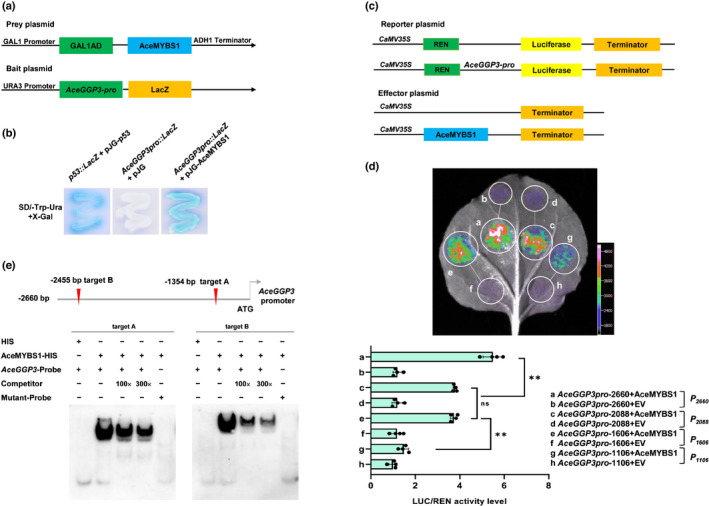
The promoter of GDP‐l‐galactose‐phosphorylase (AceGGP3) is the direct target of AceMYBS1 (MYB, myeloblastosis). (a) Schematic diagram of the prey plasmid and bait plasmid in yeast one‐hybrid (Y1H) assay. The promoter fragment of AceGGP3 was cloned into the pLacZi vector to generate bait plasmid and the prey plasmid was generated by recombining the AceMYBS1 gene into pJG4‐5 vector. (b) Y1H assay showing the interaction between AceMYBS1 and AceGGP3 promoter (AceGGP3pro::Lacz). The yeast strains were grown on SD/‐Trp/‐Ura/+X‐gal media for 3 d. The p53::LacZ+pJG‐p53: positive control; AceGGP3pro::LacZ+pJG: negative control. (c) Schematic diagram of the reporter vector and effector vector. The promoter fragment of AceGGP3 was cloned into the pGreenII 0800‐LUC vector to generate the reporter construct. The effector was generated by recombining the AceMYBS1 gene into an overexpression vector (POE‐3×Flag‐DN). (d) Dual‐luciferase (LUC) assay in Nicotiana benthamiana leaves showing that AceMYBS1 activates transcription of different‐length fragments of AceGGP3 promoters (P 2660, P 2088, P 1606, P 1106). The empty vector is the control. Representative photographs were taken (above), and LUC/Renilla Luciferase (REN) activity detection to verify that AceMYBS1 activates the transcription of AceGGP3 (below). Error bars: ± SD. Significant differences were detected by Student’s t‐test: **, P < 0.01; ns, not significant. Black circles in bar chart represent individual data points. (e) Position of two AceMYBS1 predicted binding targets on the AceGGP3 promoter and electrophoretic mobility shift assay (EMSA) showing the binding of AceMYBS1 to the AceGGP3 promoter. The unlabelled probes were used as competitors. 100× and 300× represent the rates of the competitor. The target A probes 5′‐TAATTAAATAGATAAGAAAAGAGAAAAAGG‐3′ were replaced with 5′‐TAATTAAATAAAAAAAAAAAGAGAAAAAGG‐3′; target B probes 5′‐AAATAAGGGCAATCTTATCATTTATGTCAA‐3′ were replaced with 5′‐AAATAAGGGCAAAAAAAAAATTTATGTCAA‐3′. All the probe sequences are listed in Supporting Information Table S1.
The cis‐elements of MYBS1 were predicted by JASPAR 2020 (Fornes et al., 2019). Among many predicted MYBS1 cis‐elements, two main cis‐elements were identified within the AceGGP3 promoter (−2455 bp, TCTTATC; −1534 bp, TCTTATC) (Fig. S8a). Four 5′‐truncated AceGGP3 promoters (designated P1106 , P1606 , P2088 and P2660 ) were amplified from A. eriantha, and the transcriptional activity was assessed with a Dual‐LUC reporter system (Fig. 3c,d). The activities of P1606 and P2660 were higher than those of P1106 and P2088 , indicating that cis‐elements are likely to be located between positions −1106–1606 bp and −2088–2660 bp, which is the same interval as the predicted position. To verify the binding specificity of AceMYBS1 to these motifs, we carried out electrophoretic mobility shift assays (EMSAs) and found that AceMYBS1‐HIS fusion proteins (Fig. S8b) could bind DNA probes containing the motifs, whereas nonlabelled competing probes effectively reduced the binding ability of AceMYBS1 in a dose‐dependent manner, and mutation of the core sequence abolished the binding (Fig. 3e). These results indicate that AceMYBS1 binds directly to the AceGGP3 promoter and acts as a transcriptional activator of AceGGP3.
In order to explore the AceMYBS1 expression profiles of A. eriantha, qRT‐PCR was performed to assess transcript accumulation in the fruit. Consistent with AsA content, AceMYBS1 was highly expressed in the early fruit development stage and was positively correlated with the expression of AceGGP3 (Fig. S5a,b). A transient expression assay in A. eriantha fruit (Fig. 4a–d) confirmed that the overexpression of AceMYBS1 increased the expression of AceGGP3 by 1.4‐fold (Fig. 4b,c), leading to a 1.7‐fold increase in the AsA content in the fruit (Fig. 4d). By contrast, the expression level of AceGGP3 in the Anti‐AceMYBS1 fruit decreased by 30% (Fig. 4b,c). As in fruit, overexpression of AceMYBS1 in A. eriantha calli equally led to increased expression of AceGGP3 (1.8‐fold) and content of AsA (2.36‐fold), and compared with empty vector‐infected calli, Anti‐AceMYBS1‐infected calli exhibited significantly decreased AceGGP3 expression and AsA content (Fig. 4e–g). When AceGGP3 was suppressed by Anti‐AceGGP3, AsA content did not increase, even when AceMYBS1 was overexpressed in A eriantha calli and transgenic lines (Fig. 4f,g), suggesting that AceMYBS1 is an upstream regulatory gene of AceGGP3.
Fig. 4.
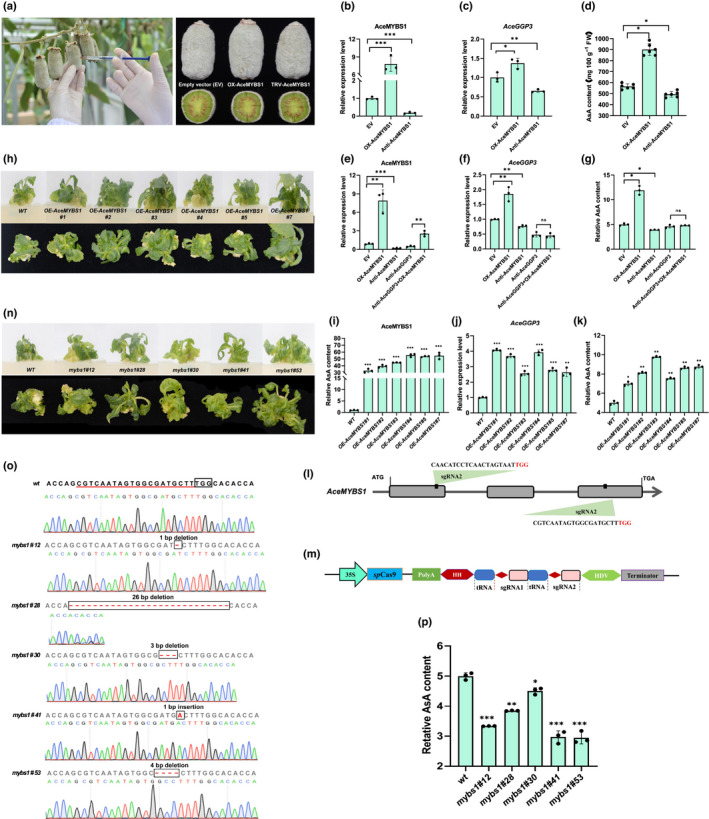
AceMYBS1 positively regulates ascorbic acid (AsA) content in Actinidia eriantha fruit and calli (MYB, myeloblastosis). (a) Transient expression assay performed in on‐tree fruits of A. eriantha at 80 d after flowering (80DAF). Quantitative reverse‐transcription (qRT)‐PCR analysis of (b) AceMYBS1, and (c) AceGGP3 and (d) AsA content of A. eriantha fruits with transient expressed‐AceMYBS1 7 d after vector infiltration. EV, empty vector; OX‐AceMYBS1, AceMYBS1‐overexpression; Anti‐AceMYBS1, AceMYBS1‐antisense expression. Experiments were performed in six kiwifruits per genotype. qRT‐PCR analysis expression of (e) AceMYBS1 and (f) AceGGP3 transcripts, and (g) relative AsA content of AceMYBS1 and AceGGP3 transient expressed in A. eriantha calli. Anti‐AceGGP3: AceGGP3‐antisense expression; Anti‐AceGGP3+OX‐AceMYBS1: overexpressed AceMYBS1 in Anti‐AceGGP3 background. (h) Wild‐type (WT) and six AceMYBS1‐overexpression transgenic kiwifruit (A. eriantha) lines in tissue culture. OE‐AceMYBS1#1, OE‐AceMYBS1#2, OE‐AceMYBS1#3, OE‐AceMYBS1#4, OE‐AceMYBS1#5 and OE‐AceMYBS1#7 represent six different transgenic lines respectively. qRT‐PCR analysis of (i) AceMYBS1 and (j) AceGGP3 in transgenic kiwifruit lines in (h). (k) Relative AsA content of AceMYBS1‐overexpression transgenic kiwifruit calli in (h). (l) Schematic map of the sgRNA targeted sited on the genomic regions of AceMYBS1. Lines, intergenic region and introns; grey boxes, exons; and red bases, PAM motifs (NGG). (m) Schematic diagram of the CRISPR/Cas9 vector. Sequences of sgRNA: sgRNA1 (CGTCAATAGTGGCGATGCTTTGG) and sgRNA2 (CAACATCCTCAACTAGTAATTGG). (n) Phenotype of WT and five AceMYBS1‐editing mutant lines: mybs1#12, mybs1#28, mybs1#30, mybs1#41 and mybs1#53. (o) Sequencing results and chromatograms of the AceMYBS1 homozygous mutant lines from the T1 generation with PAM motif boxed. (p) Relative AsA content of AceMYBS1‐edited kiwifruit calli (l); note each experiment of (e–g), (i–k) and (p) were performed in three replicates (wt, wild‐type). All of the above error bars denote standard deviation (±SD). Significant differences to WT were detected by Student’s t‐test using GraphPad prism 8: *, P < 0.05; **, P < 0.01; ***, P < 0.001. Black circles in bar charts represent individual data points.
In order to gain further understanding of the regulatory roles of AceMYBS1, six stable overexpression transgenic kiwifruit lines were generated (Fig. 4h–k). qRT‐PCR confirmed that the six independent transgenic lines accumulated high levels of AceMYBS1 transcripts (> 32‐ to 55‐fold; Fig. 4i), which in turn increased the expression levels of AceGGP3 by 2.5‐ to 4‐fold (Fig. 4j). AsA content increased by 1.4‐, 1.6‐, 2.0‐, 1.5‐, 1.7‐ and 1.8‐fold in comparison to those of controls, respectively (Fig. 4k). Using the CRISPR/Cas9 system, we further mutated AceMYBS1 in A. eriantha (Fig. 4, 6). The two targeted sites were located within the first and third exons (Fig. 4l,m). In total, five independent AceMYBS1 mutants (mybs1#12, a 1‐bp deletion; mybs1#28, a 26‐bp deletion; mybs1#30, a 3‐bp deletion; mybs1#41, a 1‐bp insertion; mybs1#53, a 4‐bp deletion) (Fig. 4o) were identified. The AsA contents of the AceMYBS1‐edited lines decreased by 33.2%, 23.1%, 9.8%, 40.4% and 40.0%, respectively (Fig. 4p). For mybs1#30 which only had a 9.8% reduction in AsA content, while the 3 bp deletion of ATG was not in‐frame, the effect was only slight because the result was effectively synonymous owing to degeneracy, and the only difference to WT was the loss of an aspartic acid at position 205 (just over 20 amino acids downstream from MYB DNA binding domain). Taken together, these findings support that AceMYBS1 is a positive factor that modulates AsA synthesis.
Fig. 6.
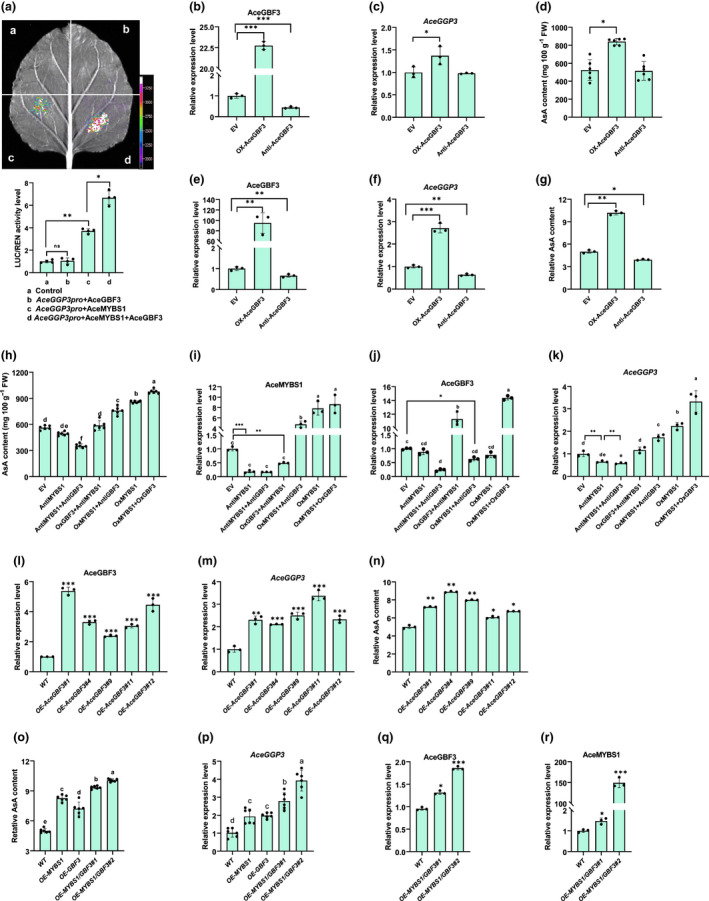
AceGBF3 interacts with AceMYBS1 to modulate ascorbic acid (AsA) synthesis in an additive manner (GBF, G‐box binding factor; MYB, myeloblastosis). (a) Dual‐luciferase (LUC) assay in Nicotiana benthamiana leaves showing that the transcription of AceGGP3 is activated by AceMYBS1 and AceGBF3 individually or collectively (representative photographs are above and detected LUC/Renilla Luciferase (REN) activity is below). Quantitative reverse‐transcription (qRT)‐PCR analysis of (b) AceGBF3 and (c) AceGGP3 at 7 d after transformation of Actinidia eriantha fruit. EV, empty vector; OX‐AceGBF3, AceGBF3‐overexpression; Anti‐AceGBF3, AceGBF3‐antisense expression. (d) AsA content of fruit in (b). Experiments were performed in six kiwifruits per genotype. qRT‐PCR analysis of (e) AceGBF3 and (f) AceGGP3 in transiently expressed A. eriantha calli. (g) Relative AsA content of A. eriantha calli in (e). (h) Fruit AsA content of transiently co‐expressed AceMYBS1 and AceGBF3 (A. eriantha). AceMYBS1‐overexpression; AntiMYBS1+AntiGBF3, co‐antisense expression AceMYBS1 and AceGBF3; OxMYBS1+OxGBF3, co‐overexpression AceMYBS1 and AceGBF3; OxMYBS1+AntiGBF3, AceMYBS1‐overexpression in the AceGBF3‐antisense expression background; OxGBF3+AntiMYBS1, AceGBF3‐overexpression in the AceMYBS1‐antisense expression background. Experiments were performed in six kiwifruits per genotype. qRT‐PCR analysis of (i) AceMYBS1, (j) AceGBF3 and (k) AceGGP3 in the fruit in (h). qRT‐PCR analysis of (l) AceGBF3 and (m) AceGGP3 in transgenic A. eriantha calli. WT, wild‐type; OE‐AceGBF3#1, OE‐AceGBF3#4, OE‐AceGBF3#9, OE‐AceGBF3#11 and OE‐AceGBF3#12 represent five independent transgenic lines, respectively. (n) Relative AsA content of AceGBF3‐overexpression transgenic calli in (l). (o) Relative AsA content of individual AceMYBS1 and AceGBF3 as well as their co‐overexpression in transgenic A. eriantha calli. OE‐MYBS1/GBF3#1 and OE‐‐MYBS1/GBF3#2, two transgenic lines of AceMYBS1 and AceGBF3 co‐overexpression. qRT‐PCR analysis expression of (p) AceGGP3, (q) AceGBF3 and (r) AceMYBS1 in the transgenic kiwifruit calli of OE‐AceMYBS1/AceGBF3#2. Error bars represent ± SD with three technical repeats for each experimental group. Significant differences were detected by Student’s t‐test: *, P < 0.05; **, P < 0.01; ***, P < 0.001; ns, not significant. Different letters above the bars indicate significant difference (P < 0.05) as obtain by one‐way ANOVA test. Black circles in bar charts represent individual data points.
AceGBF3 functions additively with AceMYBS1 to upregulate the expression of AceGGP3 and increase the synthesis of AsA in kiwifruit
In order to further study the function of AceMYBS1 a Y2H screen was conducted to identify AceMYBS1‐interacting proteins. A total of 85 yeast transformants were screened, and eight positive clones were identified as containing the same cDNA as its full‐length sequence. This sequence encodes a bZIP protein (Actinidia27344), whose expression also correlated with AceGGP3 expression (Table S3); this protein then was designated as AceGBF3 based on bioinformatic analysis (Figs 5a,b, S9). Further domain mapping analysis revealed that the N‐terminal region (AceGBF3‐N, amino acids 1–151) but not the C‐terminal half (AceGBF3‐C, amino acids 152–300) of AceGBF3 interacted with AceMYBS1 (Fig. S10a). An additional transcriptional activity assay was performed. Yeast cells transformed with BD‐AceMYBS1 or BD‐AceGBF3 but not the empty pGBKT7 vector grew normally and turned blue on SD/‐T/‐H/‐A/+X‐α‐Gal medium (Fig. S10b). Subcellular localization assays were performed in tobacco leaves transformed with a nuclear marker to visualize the subcellular locations of AceMYBS1 and AceGBF3 and fluorescence of the AceMYBS1 and AceGBF3‐fused yellow fluorescent protein (YFP) proteins was detected only in the nucleus and perfectly merged with nuclear markers (Fig. S11).
Fig. 5.
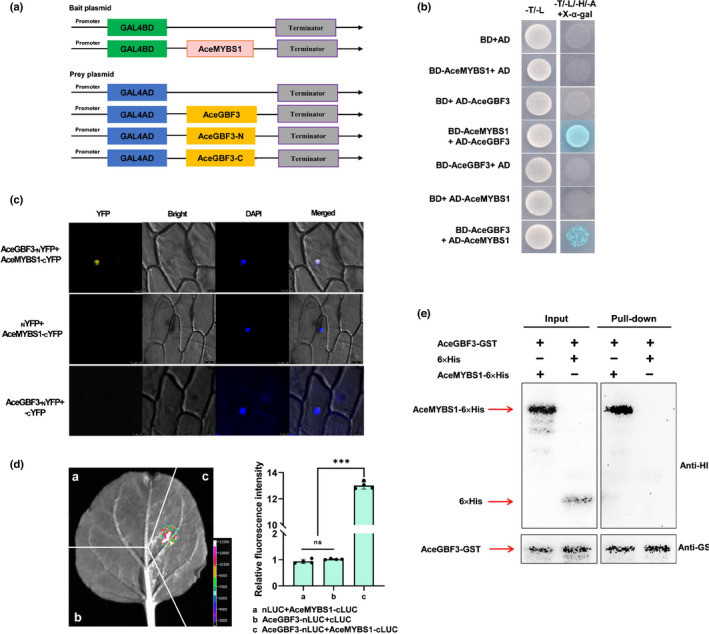
AceMYBS1 interacts with AceGBF3 (GBF, G‐box binding factor; MYB, myeloblastosis). (a) Schematic diagram of yeast two‐hybrid assay. (b) Transformed yeast cells were grown on SD/‐Trp/‐Leu (‐T‐L) and SD/‐Trp/‐Leu/‐His/‐Ade/+X‐α‐gal (‐T‐L‐H‐A+X‐α‐gal) media with empty pGADT7 (AD) used as negative control. (c) Bimolecular fluorescence complementation (BiFC) analysis of the interaction between AceMYBS1 and AceGBF3 in onion (Allium cepa) epidermal cells. Blue and yellow fluorescence represent DAPI and YFP signal, respectively, and the empty NYFP or CYFP vector was used as negative control. (d) Bimolecular luminescence complementation (BiLC) assay demonstrating that AceMYBS1 interacts with AceGBF3 in vivo in transient expression assay in Nicotiana benthamiana leaf where Agrobacterium cultures containing the respective recombinant plasmids were combined at 1 : 1 (v/v). Left, representative picture; right, measured relative fluorescence intensity ht. Error bars ± SD; significant differences were detected by Student’s t‐test: ***, P < 0.001; ns, not significant. Black circles in bar chart represent individual data points. (e) In vitro pull‐down assay where AceGBF3‐GST protein was incubated with immobilized AceMYBS1‐6×His or 6×His protein, and immunoprecipitated fractions were detected by Anti‐GST antibody (GST, glutathione‐S‐transferase).
In order to further explore potential interactions between the AceGBF3 and AceMYBS1 proteins, three different methods were employed. First, a BiFC experiment was selected as a method for an in vivo assay using a cell biology approach. AceMYBS1 and AceGBF3 proteins were fused to the C‐terminus of YFP (AceMYBS1‐CYFP) and the N‐terminus of YFP (AceGBF3‐NYFP), respectively, and then transiently transformed into onion epidermal cells. The YFP signal localized to the nucleus showing close interaction between AceMYBS1 and AceGBF3 as well as nuclear localization (Fig. 5c). To confirm this interaction, AceMYBS1 was fused to the C‐terminal half of LUC (AceMYBS1‐CLUC) and AceGBF3 was fused to the N‐terminal half of LUC (AceGBF3‐nLUC) and the constructs were transiently expressed in tobacco leaves (N. benthamiana). Only leaves co‐transformed with AceMYBS1‐CLUC and AceGBF3‐nLUC produced a strong LUC signal (Fig. 5d). Finally, AceMYBS1‐AceGBF3 physical interactions were confirmed via an in vitro pull‐down assay using recombinant purified proteins. The AceGBF3‐GST fusion protein (Fig. S8b) was precipitated with AceMYBS1‐6× His but not with 6× His alone when GST resin was used (Fig. 5e).
In order to test the hypothesis that AceGBF3 and AceMYBS1 co‐regulate AsA synthesis, we performed Dual‐LUC, overexpression and virus‐induced gene silencing experiments. These showed that AceMYBS1 and AceMYBS1 plus AceGBF3 but not AceGBF3 alone were capable of inducing the expression of AceGGP3 (which increased by 3.74‐ and 6.67‐fold, respectively; Fig. 6a). Transient overexpression of AceGBF3 in different plant materials, including kiwifruit (Fig. 6b–d), calli (Fig. 6e–g) and tobacco leaves (Fig. S12), consistently promoted the accumulation of AsA (Figs 6b–g, S12). Furthermore, co‐overexpression of AceGBF3 together with AceMYBS1 promoted the accumulation of AsA additively (Figs 6h–k, S13). When AceMYBS1 was silenced in A. eriantha fruit, both the expression level of AceGGP3 and the content of AsA were notably reduced or unchanged, regardless of whether AceGBF3 was overexpressed or suppressed, confirming that AceGBF3 has to interact with AceMYBS1 to upregulate the transcription of AceGGP3 (Fig. 6h–k). Moreover, five transgenic A. eriantha lines constitutively overexpressing AceGBF3 were generated (Fig. 6l), and their AceGGP3 transcript levels (Fig. 6m) and AsA contents increased by 2.11–3.38‐fold and 1.22–1.78‐fold (Fig. 6n), respectively, consistent with previous results. The average AsA content in transgenic calli (which was c. two‐fold higher than that in WT calli) of the AceGBF3 and AceMYBS1 co‐expression lines was significantly higher than those in the calli of the AceGBF3 (1.4‐fold) and AceMYBS1 (1.6‐fold) lines alone (Fig. 6o–r). Taken together, these results show that AceGBF3 interacts with AceMYBS1 to co‐regulate AceGGP3 expression to form an AceGBF3‐AceMYBS1‐AceGGP3 regulatory network involved in the synthesis and metabolism of AsA in kiwifruit.
ABA inhibits the AceGBF3‐AceMYBS1‐AceGGP3‐mediated regulation of AsA synthesis networks via AceMYBS1
Accumulating evidence has demonstrated that ABA plays a role in the biosynthesis of AsA (Y. Yu et al., 2019; Kakan et al., 2021). To determine the effects of ABA on the AceGBF3‐AceMYBS1‐AceGGP3 regulatory network, calli were treated with ABA (0, 1, 2, 3, 5 and 10 μM) and this showed that ABA inhibits the synthesis of AsA, especially at 2 μM (Fig. S14). A Dual‐LUC assay was used to test how ABA influences the interaction of AceMYBS1 and AceGBF3. Given that AceMYBS1 and AceGBF3 coexist with the AceGGP3 promoter, the LUC/REN ratio was higher than that of the control when AceMYBS1 was co‐expressed with the AceGGP3 promoter‐LUC, and it sharply declined when 2 μM ABA was added (Fig. 7a). Consistent with these findings, the fluorescence intensity of activated AceMYBS1‐CLUC and AceGBF3‐NLUC in the BiLC assay was notably reduced in response to ABA (Fig. 7b).
Fig. 7.
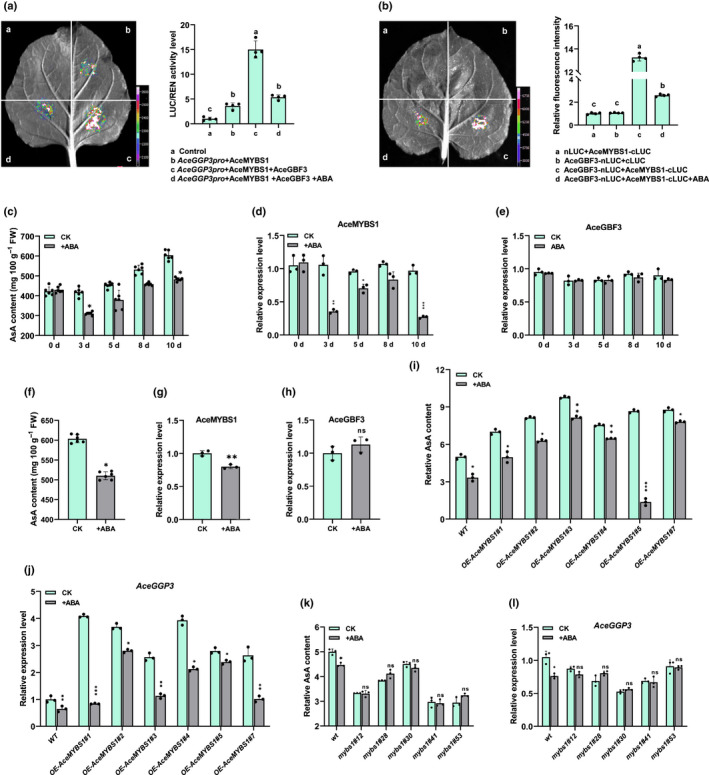
Abscisic acid (ABA) represses ascorbic acid (AsA) biosynthesis by repressing AeMYBS1 (MYB, myeloblastosis). (a) Dual‐luciferase (LUC) assay in Nicotiana benthamiana leaves showing the effects on transcription of AceGGP3 by AceMYBS1, AceMYBS1 and AceGBF3, and AceMYBS1 and AceGBF3 with 2 μM ABA (with empty vector as a control) (GBF, G‐box binding factor; GGP, GDP‐l‐galactose‐phosphorylase). Left, representative photographs; right, detected LUC/Renilla Luciferase (REN) activity. (b) Bimolecular luminescence complementation (BiLC) assay using AeGBF3‐nLUC and AeMYBS1‐cLUC constructs; Agrobacterium cultures were combined at a 1 : 1 (v/v) ± 2 μM ABA, then infiltrated into N. benthamiana leaves. Representative picture shown on left and measured relative fluorescence intensity measured is on right. (c) AsA content of 20 μM ABA‐treated Actinidia eriantha fruits over time (CK, sample without ABA treatment). Experiments contained three to six kiwifruits per group. Quantitative reverse‐transcription (qRT)‐PCR analysis expression of (d) AceMYBS1 and (e) AceGBF3 in experimental group in (c). (f) AsA content of A. eriantha fruits sprayed with 20 μM ABA at 80 d after flowering (80 DAF) and stored at 25°C for 3 d. qRT‐PCR analysis of (g) AceMYBS1 and (h) AceGBF3 expression of fruit in (f). (i) Relative AsA content of AceMYBS1‐overexpresson lines treated with 2 μM ABA (without ABA is control) (WT, wild‐type). (j) qRT‐PCR analysis AceGGP3 in overexpression lines in (i). (k) Relative AsA content of AceMYBS1 mutant lines treated with 2 μM ABA (no ABA as a control) (wt, wild‐type). (l) qRT‐PCR analysis of AceGGP3 in AceMYBS1‐edited kiwifruit calli in (k). All of the above experiments were performed in three replicates. Error bars denoted standard deviation (±SD). Significant differences were detected by Student’s t‐test: *, P < 0.05; **, P < 0.01; ***, P < 0.001; ns, not significant. Different letters above the bars indicate significant difference (P < 0.05) as obtain by one‐way ANOVA test. Black circles in bar charts represent individual data points.
In order to determine which TFs are affected by ABA, we sprayed A. eriantha fruit on the vine with 20 µM ABA, and the results showed that ABA inhibited the synthesis of AsA especially on days 3 and 10 after treatment (Fig. 7c). qRT‐PCR analysis showed that AceMYBS1, but not AceGBF3 expression, was repressed by ABA treatment (Fig. 7d,e). Moreover, the fruit of A. eriantha were sprayed with ABA in vitro (Fig. 7f–h) and consistent with previous results, ABA inhibited the AsA synthesis and expression of AceMYBS1, and there was little change in AceGBF3 expression (Fig. 7f–h). AceMYBS1‐overexpression lines treated with ABA showed a decrease in AsA concentration and expression of AceGGP3 (Fig. 7i,j), whereas in ABA treated gene‐edited lines of mybs1, AsA contents lines did not change (Fig. 7k). In particular, the expression of AceGGP3 was unaffected by ABA if the AceMYBS1 TF was mutated (Fig. 7l). The above results were confirmed in a transient experiment involving A. eriantha calli, and no significant changes in AsA content were observed after ABA treatment as long as AceMYBS1 was silenced (Fig. S15). These data imply that ABA represses AsA content mainly by repressing the expression of AceMYBS1.
Discussion
l‐ascorbic acid (AsA, vitamin C) is an essential human micronutrient obtained predominately from plants, especially from AsA‐rich fruits and/or vegetative parts (Mittler, 2002; Gill & Tuteja, 2010; De Tullio, 2012). Kiwifruit are excellent sources of AsA, with ≤ 10‐fold higher content than that in apple and pear fruits, placing kiwifruit in the top echelon of available dietary sources of vitamin C. However, the AsA content in the fruits of Actinidia species varies considerably: from as low as 4–5 mg 100 g−1 FW in the fruit of A. henryi to astonishingly high amounts (671–2140 mg 100 g−1 FW) in A. latifolia (Huang et al., 2004; Du et al., 2009; Latocha et al., 2010) (Fig. 1a). Our research indicates that the extreme variation in AsA contents among Actinidia species is probably due to the level of AsA synthesis activity during early fruit development, especially within the first 60 d (Figs 1b–e, S2). Within this window the expression of GDP‐d‐mannose pyrophosphorylase (GMP), GDP‐d‐mannose 3′,5′ epimerase (GME) and AceGGP3 (GDP‐l‐galactose‐phosphorylase) positively correlated with AsA accumulation, and expression of GGP3 was more strongly correlated with AsA content in A. eriantha than in A. rufa (Figs 1c–e, S2). Thus, genotypes with higher expression of GGP are likely to have higher AsA content, and this is supported by conclusions from previous studies in kiwifruit and other species (Laing et al., 2007; Bulley et al., 2009, 2012; Zhou et al., 2012; Li et al., 2013b; Zhang et al., 2015; Mellidou & Kanellis, 2017; Fenech et al., 2021).
AceMYBS1 activates the transcription of AceGGP3 to modulate the AsA content in A. eriantha
Transcription factors (TFs) are a group of regulators that play crucial roles in many biological and developmental processes in plants by regulating spatiotemporal gene expression through recognition of specific DNA sequences in promoters (Mitsuda & Ohme‐Takagi, 2009). Although the biosynthesis of AsA is most responsive to GGP activity in kiwifruit, knowledge about the mechanisms involved in the regulation of GGP transcription is fairly limited. The TFs SlHZ24 (Hu et al., 2016) and SlNFYA10 (Chen et al., 2020) bind to VTC1, GGP and GME to promote or reduce AsA synthesis. More recently, a kiwifruit ethylene response factor AcERF91 has been found to increase the expression of AcGGP3 (Chen et al., 2021), but overexpression of this gene produced only a modest increase in AsA. In this study we identified a kiwifruit 1R‐subtype myeloblastosis (MYB) TF whose expression correlates with AceGGP3 expression and AsA content, with overexpression leading to larger increases in AsA. MYBS1 governs the sugar‐ and gibberellin‐mediated regulation of α‐amylase gene expression in cereals and rice (Lu et al., 2002; Hong et al., 2012), but plays an opposite role in sugar and ABA signalling during seed germination and early seedling development (Yang et al., 2018). MYBS1 is inducible by NaCl, polyethylene glycol or ABA, and regulates the transcription of AtP5CS to enhance the salt tolerance of Arabidopsis (Dong et al., 2017). These findings suggest that a variety of MYBS1 sequences in different plant species from the same clade are involved in various metabolic mechanisms, and thus a new function in regulating AsA biosynthesis is presented in this study. Overexpression of AceMYBS1 significantly enhanced the expression of AceGGP3 and the content of AsA (Fig. 4c,d,f,g,j,k) and these levels were reduced when AceMYBS1 was mutated via CRISPR/Cas9 (Fig. 4p). Yeast one‐hybrid (Y1H), Dual‐luciferase (LUC) and electrophoretic mobility shift assays (EMSA) showed that AceMYBS1 acts by binding the promoter of AceGGP3 and activates AceGGP3 transcription (Figs 3, S7).
There is very similar MYBS1 on chr26 which lies within the recently identified high AsA quantitative trait loci (QTL) interval (McCallum et al., 2019) but it has much lower expression than the chr16 AeMYBS1 gene described here. The high similarity suggests that it might also activate GGP transcription and the A. eriantha allele has some interesting polymorphisms which could alter its TF properties (data not presented here). This locus deserves additional investigation.
The interaction of AceMYBS1 and AceGBF3 increases the synthesis of AsA in A. eriantha in an AceGGP3‐dependent manner
This study also identified an AceMYBS1‐interacting protein, AceGBF3, a member of the bZIP TFs, which also is correlated with the AsA content of A. eriantha in different developmental stages (Table S3). G‐box binding factor (GBFs) belong to the G‐group of bZIP superfamily TFs and have been shown to bind specifically to the G‐box sequences in the promoter regions of several environmentally regulated genes in Arabidopsis (Menkens et al., 1995; Shinozaki & Yamaguchi‐Shinozaki, 1997). To date, GBF3 has been shown, mainly by expression analysis, to participate in light, cold, salt, osmotic and drought stress responses (Lu et al., 1996; Ma & Bohnert, 2008; Ramegowda et al., 2017). In our study, we found that AceGBF3 interacts together with AceMYBS1 to additively promote AsA synthesis and AceGGP3 expression (Figs 6h,k,o, S13). Various light, stress and hormone conditions also have been shown to affect the expression of the GGP, GME and GPP genes in kiwifruit (Li et al., 2013a,b), but these studies did not determine the underlying regulatory mechanism(s). Here, we add new knowledge about upstream regulatory factors of GGPs, which have developmental‐based expression but also respond to exogenous signals to stimulate AsA accumulation in kiwifruit.
ABA represses AsA synthesis by repressing AeMYBS1 expression
ABA is a classic plant hormone that affects the expression of thousands of genes, is widely involved in the process of plant growth, and plays an important role in the abiotic stress response (Dong et al., 2015; Vishwakarma et al., 2017). ABA also affects the synthesis of AsA: a PTP‐like nucleotidase (PTPN) mediates the tandem regulation of the ABA signalling pathway and AsA biosynthesis pathway in maize to mediate drought resistance (Zhang et al., 2020). Overexpression of ABA INSENSITIVE 4 (ABI4) was shown to decrease AsA content under salt stress, whereas ETHYLENE INSENSITIVE 3 (EIN3) antagonizes the inhibitory effect of ABA on AsA synthesis (Y. Yu et al., 2019; Kakan et al., 2021). Treatment with ABA and methyl jasmonate (MeJA) significantly reduced AsA content in kiwifruit (Li et al., 2013a) and there also is a feedback response to exogenously elevated AsA in terms of elevated 9‐cis‐Epoxycarotenoid Dioxygenase 3 expression (NCED3), which results in increased ABA production (Bulley et al., 2021). However, there are few reports on regulators involved in ABA‐mediation of AsA synthesis, and the underlying molecular mechanism through which ABA modulates AsA content is unclear. One of the next areas to explore is whether this action by ABA is very direct and limited to AeMYBS1, or whether the regulatory effect is transmitted through acascade of genes, of which AeMYBS1 is a downstream member. Gaining a better understanding of such cross‐talk will help to better understand the implications for plant biology. This study found that one of the ways in which ABA represses AsA content in fruit tissue is through repressing AceMYBS1 expression (Figs 7, S15) and how ABA inhibits the expression of AceMYBS1 is an area for future exploration. This complements studies by other groups which have shown that in roots, at least, ABA inhibits ascorbate biosynthesis through ABI4‐mediated repression of GGP expression.
In conclusion, AceMYBS1 and AceGBF3 are positive regulators of AsA content, and AceMYBS1 directly binds the AceGGP3 promoter and activates its expression, whereas AceGBF3 interacts together with AceMYBS1 to additively increase the expression of AceGGP3 and the synthesis of AsA (Fig. 8). It is well‐documented that developed world diets often are lacking in vitamin C and that improving vitamin C contents in natural dietary sources such as fruit and vegetables is one way to address this. Kiwifruit are very well‐known as a rich dietary source and studies using germplasm like this indicate the potential to improve vitamin C contents even more in commercial cultivars.
Fig. 8.
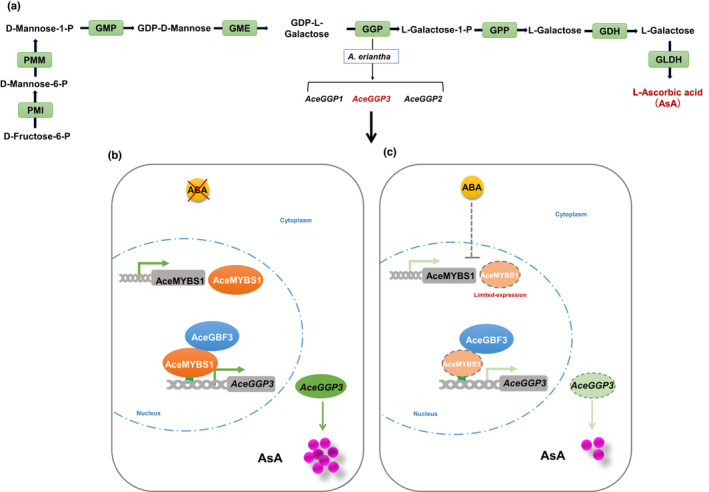
A working model of abscisic acid (ABA)‐mediated AceGBF3‐AceMYBS1‐AceGGP3 networks regulating the AsA synthesis in kiwifruit (Actinidia eriantha) (GBF, G‐box binding factor; GGP, GDP‐l‐galactose‐phosphorylase; MYB, myeloblastosis). (a) AsA biosynthetic genes of the l‐galactose pathway. (b) AceMYBS1 binds to the AceGGP3 promoter (position signified by green arrow) and activates the expression of AceGGP3, thereby promoting AsA synthesis. AceGBF3 interacts with AceMYBS1 to further activate the AceGGP3 expression and enhance AsA synthesis. Without exogenous ABA, the AceGBF3‐AceMYBS1‐AceGGP3 networks positively regulate AsA synthesis. (c) In the presence of ABA, AceMYBS1 is repressed, resulting in reduced AsA synthesis.
The other benefit of increasing ascorbate is to increase overall plant resiliency to abiotic stresses such as drought, heat, soil water logging and soil salinity. These stresses are being exacerbated by climate change. Therefore, AeMYBS1 and GBF3 transcription factors could be potentially useful new tools for biotech manipulation targeting increased plant resiliency to abiotic stresses.
Author contributions
DL and XL planned and designed the research; XL, CZ and DL performed experiments and conducted fieldwork; XL, SMB, RW and DL analyzed data; and DL and SMB wrote the manuscript.
Supporting information
Fig. S1 Differentially expressed genes.
Fig. S2 Expression of GGP1, GGP3 and AsA content.
Fig. S3 Gene expression in Actinidia eriantha and A. rufa hybrids.
Fig. S4 Transient expression AceGGP3 in Actinidia eriantha calli.
Fig. S5 Correlation and phylogenetic analysis of AceMYBS1.
Fig. S6 Disorder and ‘SMART’ domain architecture predictions.
Fig. S7 AceMYBS1 activated the AceGGP3 promoter.
Fig. S8 The predicted binding sequence motif of AceMYBS1.
Fig. S9 Phylogenetic analysis of GBF3.
Fig. S10 AceMYBS1 interacts with AceGBF3.
Fig. S11 Subcellular localization of AceMYBS1 and AceGBF3 protein.
Fig. S12 Transiently overexpressed AceGBF3 in tobacco.
Fig. S13 Transiently overexpressed AceGBF3, AceMYBS1 and co‐expression in tobacco leaves.
Fig. S14 ABA inhibits AsA synthesis.
Fig. S15 ABA inhibits AsA synthesis via AceMYBS1.
Methods S1 Details of methods.
Notes S1 Promoter sequence of AceGGP3; CDS of AcrGGP3; CDS of AcrGGP1; CDS of AcrGGP2 in fasta format.
Table S1 Sequences of primers and other oligonucleotides used in this study.
Table S2 The GenBank accession numbers used in this study.
Table S3 The summary of the expression profile of transcript factors that was related with AsA and the correlation coefficient between these transcript factor and GGP3.
Please note: Wiley Blackwell are not responsible for the content or functionality of any Supporting Information supplied by the authors. Any queries (other than missing material) should be directed to the New Phytologist Central Office.
Acknowledgements
The authors would like to thank the referees for their comments and suggestions. The authors also thank William Laing for comments and suggestions to manuscript as well as the PFR Science Publication Office staff for proof reading and formatting. This project was supported by the National Key R&D Program of China (2019YFD1000201) and Science and Technology Department of Hubei Province (2020DFE016).
Contributor Information
Sean M. Bulley, Email: sean.bulley@plantandfood.co.nz.
Caihong Zhong, Email: caihongzhong@wbgcas.cn.
Dawei Li, Email: lidawei@wbgcas.cn.
Data availability
The data that support the findings of this study are available in the supplementary material of this article. RNAseq data are openly available in NCBI at https://www.ncbi.nlm.nih.gov, Genbank accession no. PRJNA771781 and PRJNA771785.
References
- Agius F, Gonzalez‐Lamothe R, Caballero J, Munoz‐Blanco J, Botella M, Valpuesta V. 2003. Engineering increased vitamin C levels in plants by overexpression of a D‐galacturonic acid reductase. Nature Biotechnology 21: 177–181. [DOI] [PubMed] [Google Scholar]
- Akbaş F, Işikalan C, Namli S. 2009. Callus induction and plant regeneration from different explants of Actinidia deliciosa . Applied Biochemistry and Biotechnology 158: 470–475. [DOI] [PubMed] [Google Scholar]
- An JP, Zhang XW, You CX, Bi SQ, Wang XF, Hao YJ. 2019. MdWRKY40 promotes wounding‐induced anthocyanin biosynthesis in association with MdMYB1 and undergoes MdBT2‐mediated degradation. New Phytologist 224: 380–395. [DOI] [PubMed] [Google Scholar]
- Badejo AA, Jeong ST, Goto‐Yamamoto N, Esaka M. 2007. Cloning and expression of GDP‐d‐mannose pyrophosphorylase gene and ascorbic acid content of acerola (Malpighia glabra L.) fruit at ripening stages. Plant Physiology and Biochemistry 45: 665–672. [DOI] [PubMed] [Google Scholar]
- Barth C, De Tullio M, Conklin PL. 2006. The role of ascorbic acid in the control of flowering time and the onset of senescence. Journal of Experimental Botany 57: 1657–1665. [DOI] [PubMed] [Google Scholar]
- Boyer LA, Langer MR, Crowley KA, Tan S, Denu JM, Peterson CL. 2002. Essential role for the SANT domain in the functioning of multiple chromatin remodeling enzymes. Molecular Cell 10: 935–942. [DOI] [PubMed] [Google Scholar]
- Boyer LA, Latek RR, Peterson CL. 2004. The SANT domain: a unique histone‐tail‐binding module? Nature Reviews Molecular Cell Biology 5: 158–163. [DOI] [PubMed] [Google Scholar]
- Bu Y, Sun B, Zhou A, Zhang X, Takano T, Liu S. 2016. Overexpression of AtOxR gene improves abiotic stresses tolerance and vitamin C content in Arabidopsis thaliana . BMC Biotechnology 16: 69. [DOI] [PMC free article] [PubMed] [Google Scholar]
- Bulley SM, Cooney JM, Laing W. 2021. Elevating ascorbate in Arabidopsis stimulates the production of abscisic acid, phaseic acid, and to a lesser extent auxin (IAA) and jasmonates, resulting in increased expression of DHAR1 and multiple transcription factors associated with abiotic stress tolerance. International Journal of Molecular Sciences 22: 6743. [DOI] [PMC free article] [PubMed] [Google Scholar]
- Bulley S, Laing W. 2016. The regulation of ascorbate biosynthesis. Current Opinion in Plant Biology 33: 15–22. [DOI] [PubMed] [Google Scholar]
- Bulley SM, Rassam M, Hoser D, Otto W, Schunemann N, Wright M, MacRae E, Gleave A, Laing W. 2009. Gene expression studies in kiwifruit and gene over‐expression in Arabidopsis indicates that GDP‐l‐galactose guanyltransferase is a major control point of vitamin C biosynthesis. Journal of Experimental Botany 60: 765–778. [DOI] [PMC free article] [PubMed] [Google Scholar]
- Bulley S, Wright M, Rommens C, Yan H, Rassam M, Lin‐Wang K, Andre C, Brewster DI, Karunairetnam S, Allan AC et al. 2012. Enhancing ascorbate in fruits and tubers through over‐expression of the l‐galactose pathway gene GDP‐L‐galactose phosphorylase . Plant Biotechnology Journal 10: 390–397. [DOI] [PubMed] [Google Scholar]
- Cai X, Zhang C, Ye J, Hu T, Ye Z, Li H, Zhang Y. 2015. Ectopic expression of FaGalUR leads to ascorbate accumulation with enhanced oxidative stress, cold, and salt tolerance in tomato. Plant Growth Regulation 76: 187–197. [Google Scholar]
- Carr AC, Maggini S. 2017. Vitamin C and immune function. Nutrients 9: 1211. [DOI] [PMC free article] [PubMed] [Google Scholar]
- Castro JC, Cobos M, Maddox JD, Imán SA, Egoavil A, Torres J, Gutierrez F. 2015. Gene expression and enzyme activities of the d‐mannose/l‐galactose pathway influence l‐ascorbic acid content in Myrciaria dubia . Biologia Plantarum 59: 783–787. [Google Scholar]
- Chen H, Zou Y, Shang Y, Lin H, Wang Y, Cai R, Tang X, Zhou JM. 2008. Firefly luciferase complementation imaging assay for protein‐protein interactions in plants. Plant Physiology 146: 368–376. [DOI] [PMC free article] [PubMed] [Google Scholar]
- Chen W, Hu T, Ye J, Wang B, Liu G, Wang Y, Yuan L, Li J, Li F, Ye Z et al. 2020. A CCAAT‐binding factor, SlNFYA10, negatively regulates ascorbate accumulation by modulating the d‐mannose/l‐galactose pathway in tomato. Horticulture Research 7: 200. [DOI] [PMC free article] [PubMed] [Google Scholar]
- Chen Y, Shu P, Wang R, Du X, Xie Y, Du K, Deng H, Li M, Zhang Y, Grierson D et al. 2021. Ethylene response factor AcERF91 affects ascorbate metabolism via regulation of GDP‐galactose phosphorylase encoding gene (AcGGP3) in kiwifruit. Plant Science 313: 111063. [DOI] [PubMed] [Google Scholar]
- Cheng C, Yu Q, Wang Y, Wang H, Dong Y, Ji Y, Zhou X, Li Y, Jiang CZ, Gan SS et al. 2021. Ethylene‐regulated asymmetric growth of the petal base promotes flower opening in rose (Rosa hybrida). Plant Cell 33: 1229–1251. [DOI] [PubMed] [Google Scholar]
- De Tullio MC. 2012. Beyond the antioxidant: the double life of vitamin C. SubCellular Biochemistry 56: 49–65. [DOI] [PubMed] [Google Scholar]
- Dong T, Park Y, Hwang I. 2015. Abscisic acid: biosynthesis, inactivation, homoeostasis and signalling. Essays in Biochemistry 58: 29–48. [DOI] [PubMed] [Google Scholar]
- Dong W, Song Y, Zhao Z, Qiu NW, Liu X, Guo W. 2017. The Medicago truncatula R2R3‐MYB transcription factor gene MtMYBS1 enhances salinity tolerance when constitutively expressed in Arabidopsis thaliana . Biochemical and Biophysical Research Communications 490: 225–230. [DOI] [PubMed] [Google Scholar]
- Dowdle J, Ishikawa T, Gatzek S, Rolinski S, Smirnoff N. 2007. Two genes in Arabidopsis thaliana encoding GDP‐L‐galactose phosphorylase are required for ascorbate biosynthesis and seedling viability. The Plant Journal 52: 673–689. [DOI] [PubMed] [Google Scholar]
- Du G, Li M, Ma F, Liang D. 2009. Antioxidant capacity and the relationship with polyphenol and Vitamin C in Actinidia fruits. Food Chemistry 113: 557–562. [Google Scholar]
- Fenech M, Amorim‐Silva V, Esteban del Valle A, Arnaud D, Ruiz‐Lopez N, Castillo AG, Smirnoff N, Botella MA. 2021. The role of GDP‐L‐galactose phosphorylase in the control of ascorbate biosynthesis. Plant Physiology 185: 1574–1594. [DOI] [PMC free article] [PubMed] [Google Scholar]
- Fornes O, Castro‐Mondragon JA, Khan A, van der Lee R, Zhang XI, Richmond PA, Modi BP, Correard S, Gheorghe M, Baranašić D et al. 2019. JASPAR 2020: update of the open‐access database of transcription factor binding profiles. Nucleic Acids Research 48: D87–D92. [DOI] [PMC free article] [PubMed] [Google Scholar]
- Fu X, Peng B, Hassani D, Xie L, Liu H, Li Y, Chen T, Liu P, Tang Y, Li L et al. 2021. AaWRKY9 contributes to light‐ and jasmonate‐mediated to regulate the biosynthesis of artemisinin in Artemisia annua . New Phytologist 231: 1858–1874. [DOI] [PubMed] [Google Scholar]
- Gao Y, Wei W, Fan Z, Zhao X, Zhang Y, Jing Y, Zhu B, Zhu H, Shan W, Chen J et al. 2020. Re‐evaluation of the nor mutation and the role of the NAC‐NOR transcription factor in tomato fruit ripening. Journal of Experimental Botany 71: 3560–3574. [DOI] [PMC free article] [PubMed] [Google Scholar]
- Geng J, Liu JH. 2018. The transcription factor CsbHLH18 of sweet orange functions in modulation of cold tolerance and homeostasis of reactive oxygen species by regulating the antioxidant gene. Journal of Experimental Botany 69: 2677–2692. [DOI] [PMC free article] [PubMed] [Google Scholar]
- Gietz RD, Schiestl RH. 2007. High‐efficiency yeast transformation using the LiAc/SS carrier DNA/PEG method. Nature Protocols 2: 31–34. [DOI] [PubMed] [Google Scholar]
- Gill SS, Tuteja N. 2010. Reactive oxygen species and antioxidant machinery in abiotic stress tolerance in crop plants. Plant Physiology and Biochemistry 48: 909–930. [DOI] [PubMed] [Google Scholar]
- Green MA, Fry SC. 2005a. Apoplastic degradation of ascorbate: novel enzymes and metabolites permeating the plant cell wall. Plant Biosystems 139: 2–7. [Google Scholar]
- Green MA, Fry SC. 2005b. Vitamin C degradation in plant cells via enzymatic hydrolysis of 4‐O‐oxalyl‐l‐threonate. Nature 433: 83–87. [DOI] [PubMed] [Google Scholar]
- Hellens RP, Allan AC, Friel EN, Bolitho K, Grafton K, Templeton MD, Karunairetnam S, Gleave AP, Laing WA. 2005. Transient expression vectors for functional genomics, quantification of promoter activity and RNA silencing in plants. Plant Methods 1: 1–14. [DOI] [PMC free article] [PubMed] [Google Scholar]
- Hong Y‐F, Ho T‐HD, Wu C‐F, Ho S‐L, Yeh R‐H, Lu C‐A, Chen P‐W, Yu L‐C, Chao A, Yu S‐M. 2012. Convergent starvation signals and hormone crosstalk in regulating nutrient mobilization upon germination in cereals. Plant Cell 24: 2857–2873. [DOI] [PMC free article] [PubMed] [Google Scholar]
- Horemans N, Foyer CH, Potters G, Asard H. 2000. Ascorbate function and associated transport systems in plants. Plant Physiology and Biochemistry 38: 531–540. [Google Scholar]
- Hu T, Ye J, Tao P, Li H, Zhang J, Zhang Y, Ye Z. 2016. The tomato HD‐Zip I transcription factor SlHZ24 modulates ascorbate accumulation through positive regulation of the d‐mannose/l‐galactose pathway. The Plant Journal 85: 16–29. [DOI] [PubMed] [Google Scholar]
- Huang H, Wang Y, Zhang Z, Jiang Z, Wang S. 2004. Actinidia germplasm resources and kiwifruit industry in China . HortScience 39: 1165–1172. [Google Scholar]
- Kakan X, Yu Y, Li S, Li X, Huang R, Wang J. 2021. Ascorbic acid modulation by ABI4 transcriptional repression of VTC2 in the salt tolerance of Arabidopsis. BMC Plant Biology 21: 1–12. [DOI] [PMC free article] [PubMed] [Google Scholar]
- Ko ER, Ko D, Chen C, Lipsick JS. 2008. A conserved acidic patch in the Myb domain is required for activation of an endogenous target gene and for chromatin binding. Molecular Cancer 7: 1–20. [DOI] [PMC free article] [PubMed] [Google Scholar]
- Kotchoni SO, Larrimore KE, Mukherjee M, Kempinski CF, Barth C. 2009. Alterations in the endogenous ascorbic acid content affect flowering time in Arabidopsis. Plant Physiology 149: 803–815. [DOI] [PMC free article] [PubMed] [Google Scholar]
- Kumar S, Stecher G, Tamura K. 2016. MEGA7: molecular evolutionary genetics analysis v.7.0 for bigger datasets. Molecular Biology and Evolution 33: 1870–1874. [DOI] [PMC free article] [PubMed] [Google Scholar]
- Laing WA, Martínez‐Sánchez M, Wright MA, Bulley SM, Brewster DI, Dare AP, Rassam M, Wang D, Storey R, Macknight RC et al. 2015. An upstream open reading frame is essential for feedback regulation of ascorbate biosynthesis in Arabidopsis. Plant Cell 27: 772–786. [DOI] [PMC free article] [PubMed] [Google Scholar]
- Laing WA, Wright MA, Cooney J, Bulley SM. 2007. The missing step of the l‐galactose pathway of ascorbate biosynthesis in plants, an l‐galactose guanyltransferase, increases leaf ascorbate content. Proceedings of the National Academy of Sciences, USA 104: 9534–9539. [DOI] [PMC free article] [PubMed] [Google Scholar]
- Latocha P, Krupa T, Wołosiak R, Worobiej E, Wilczak J. 2010. Antioxidant activity and chemical difference in fruit of different Actinidia sp. International Journal of Food Sciences and Nutrition 61: 381–394. [DOI] [PubMed] [Google Scholar]
- Letunic I, Khedkar S, Bork P. 2020. SMART: recent updates, new developments and status in 2020. Nucleic Acids Research 49: D458–D460. [DOI] [PMC free article] [PubMed] [Google Scholar]
- Li J, Cui M, Li M, Wang X, Liang D, Ma F. 2013a. Expression pattern and promoter analysis of the gene encoding GDP‐d‐mannose 3′,5′‐epimerase under abiotic stresses and applications of hormones by kiwifruit. Scientia Horticulturae 150: 187–194. [Google Scholar]
- Li J, Liang D, Li M, Ma F. 2013b. Light and abiotic stresses regulate the expression of GDP‐l‐galactose phosphorylase and levels of ascorbic acid in two kiwifruit genotypes via light‐responsive and stress‐inducible cis‐elements in their promoters. Planta 238: 535–547. [DOI] [PubMed] [Google Scholar]
- Li S, Wang J, Yu Y, Wang F, Dong J, Huang R. 2016. D27E mutation of VTC1 impairs the interaction with CSN5B and enhances ascorbic acid biosynthesis and seedling growth in Arabidopsis. Plant Molecular Biology 92: 473–482. [DOI] [PubMed] [Google Scholar]
- Lin R, Ding L, Casola C, Ripoll DR, Feschotte C, Wang H. 2007. Transposase‐derived transcription factors regulate light signaling in Arabidopsis. Science 318: 1302–1305. [DOI] [PMC free article] [PubMed] [Google Scholar]
- Linster CL, Gomez TA, Christensen KC, Adler LN, Young BD, Brenner C, Clarke SG. 2007. Arabidopsis VTC2 encodes a GDP‐L‐galactose phosphorylase, the last unknown enzyme in the Smirnoff‐wheeler pathway to ascorbic acid in plants. Journal of Biological Chemistry 282: 18879–18885. [DOI] [PMC free article] [PubMed] [Google Scholar]
- Liu X, Xie X, Zhong C, Li D. 2021. Comparative transcriptome analysis revealed the key genes regulating ascorbic acid synthesis in Actinidia . International Journal of Molecular Sciences 22: 12894. [DOI] [PMC free article] [PubMed] [Google Scholar]
- Lorence A, Chevone B, Mendes P, Nessler C. 2004. Myo‐inositol oxygenase offers a possible entry point into plant ascorbate biosynthesis. Plant Physiology 134: 1200–1205. [DOI] [PMC free article] [PubMed] [Google Scholar]
- Lu C‐A, T‐hD HO, Ho S‐L, Yu S‐M. 2002. Three novel MYB proteins with one DNA binding repeat mediate sugar and hormone regulation of alpha‐amylase gene expression. Plant Cell 14: 1963–1980. [DOI] [PMC free article] [PubMed] [Google Scholar]
- Lu G, Paul AL, McCarty DR, Ferl RJ. 1996. Transcription factor veracity: is GBF3 responsible for ABA‐regulated expression of Arabidopsis Adh? Plant Cell 8: 847–857. [DOI] [PMC free article] [PubMed] [Google Scholar]
- Ma S, Bohnert HJ. 2008. Gene networks in Arabidopsis thaliana for metabolic and environmental functions. Molecular Biosystems 4: 199–204. [DOI] [PubMed] [Google Scholar]
- Macknight RC, Laing WA, Bulley SM, Broad RC, Johnson AAT, Hellens RP. 2017. Increasing ascorbate levels in crops to enhance human nutrition and plant abiotic stress tolerance. Current Opinion in Biotechnology 44: 153–160. [DOI] [PubMed] [Google Scholar]
- McCallum J, Laing W, Bulley S, Thomson S, Catanach A, Shaw M, Knaebel M, Tahir J, Deroles S, Timmerman‐Vaughan G et al. 2019. Molecular characterisation of a supergene conditioning super‐high vitamin C in kiwifruit hybrids. Plants 8: 237. [DOI] [PMC free article] [PubMed] [Google Scholar]
- Mellidou I, Kanellis AK. 2017. Genetic control of ascorbic acid biosynthesis and recycling in horticultural crops. Frontiers in Chemistry 5: 50. [DOI] [PMC free article] [PubMed] [Google Scholar]
- Menkens AE, Schindler U, Cashmore AR. 1995. The G‐box: a ubiquitous regulatory DNA element in plants bound by the GBF family of bZIP proteins. Trends in Biochemical Sciences 20: 506–510. [DOI] [PubMed] [Google Scholar]
- Mitsuda N, Ohme‐Takagi M. 2009. Functional analysis of transcription factors in Arabidopsis. Plant and Cell Physiology 50: 1232–1248. [DOI] [PMC free article] [PubMed] [Google Scholar]
- Mittler R. 2002. Oxidative stress, antioxidants and stress tolerance. Trends in Plant Science 7: 405–410. [DOI] [PubMed] [Google Scholar]
- Moser MA, Chun OK. 2016. Vitamin C and heart health: a review based on findings from epidemiologic studies. International Journal of Molecular Sciences 17: 1328. [DOI] [PMC free article] [PubMed] [Google Scholar]
- Myint PK, Luben RN, Welch AA, Bingham SA, Wareham NJ, Khaw K‐T. 2008. Plasma vitamin C concentrations predict risk of incident stroke over 10 y in 20 649 participants of the European prospective investigation into cancer Norfolk prospective population study. American Journal of Clinical Nutrition 87: 64–69. [DOI] [PubMed] [Google Scholar]
- Pilkington SM, Crowhurst R, Hilario E, Nardozza S, Fraser L, Peng Y, Gunaseelan K, Simpson R, Tahir J, Deroles SC et al. 2018. A manually annotated Actinidia chinensis var. chinensis (kiwifruit) genome highlights the challenges associated with draft genomes and gene prediction in plants. BMC Genomics 19: 1–19. [DOI] [PMC free article] [PubMed] [Google Scholar]
- Pullar JM, Carr AC, Vissers MCM. 2017. The roles of vitamin C in skin health. Nutrients 9: 866. [DOI] [PMC free article] [PubMed] [Google Scholar]
- Queval G, Noctor G. 2007. A plate reader method for the measurement of NAD, NADP, glutathione, and ascorbate in tissue extracts: application to redox profiling during Arabidopsis rosette development. Analytical Biochemistry 363: 58–69. [DOI] [PubMed] [Google Scholar]
- Ramegowda V, Gill US, Sivalingam PN, Gupta A, Gupta C, Govind G, Nataraja KN, Pereira A, Udayakumar M, Mysore KS et al. 2017. GBF3 transcription factor imparts drought tolerance in Arabidopsis thaliana . Scientific Reports 7: 9148. [DOI] [PMC free article] [PubMed] [Google Scholar]
- Sanmartin M, Drogoudi PA, Lyons T, Pateraki I, Barnes J, Kanellis AK. 2003. Over‐expression of ascorbate oxidase in the apoplast of transgenic tobacco results in altered ascorbate and glutathione redox states and increased sensitivity to ozone. Planta 216: 918–928. [DOI] [PubMed] [Google Scholar]
- Schultz J, Milpetz F, Bork P, Ponting CP. 1998. SMART, a simple modular architecture research tool: identification of signaling domains. Proceedings of the National Academy of Sciences, USA 95: 5857–5864. [DOI] [PMC free article] [PubMed] [Google Scholar]
- Shinozaki K, Yamaguchi‐Shinozaki K. 1997. Gene expression and signal transduction in water‐stress response. Plant Physiology 115: 327–334. [DOI] [PMC free article] [PubMed] [Google Scholar]
- Smirnoff . 2011. Vitamin C: the metabolism and functions of ascorbic acid in plants. Advances in Botanical Research 59: 107–177. [Google Scholar]
- Troesch B, Hoeft B, McBurney M, Eggersdorfer M, Weber P. 2012. Dietary surveys indicate vitamin intakes below recommendations are common in representative Western countries. British Journal of Nutrition 108: 692–698. [DOI] [PubMed] [Google Scholar]
- Venkatesh J, Park SW. 2014. Role of L‐ascorbate in alleviating abiotic stresses in crop plants. Botanical Studies 55: 38. [DOI] [PMC free article] [PubMed] [Google Scholar]
- Vishwakarma K, Upadhyay N, Kumar N, Yadav G, Singh J, Mishra RK, Kumar V, Verma R, Upadhyay RG, Pandey M et al. 2017. Abscisic acid signaling and abiotic stress tolerance in plants: a review on current knowledge and future prospects. Frontiers in Plant Science 8: 161. [DOI] [PMC free article] [PubMed] [Google Scholar]
- Wang X, Tu M, Wang D, Liu J, Li Y, Li Z, Wang Y, Wang X. 2018. CRISPR/Cas9‐mediated efficient targeted mutagenesis in grape in the first generation. Plant Biotechnology Journal 16: 844–855. [DOI] [PMC free article] [PubMed] [Google Scholar]
- Wang Z, Wang S, Li D, Zhang Q, Li L, Zhong C, Liu Y, Huang H. 2018. Optimized paired‐sgRNA/Cas9 cloning and expression cassette triggers high‐efficiency multiplex genome editing in kiwifruit. Plant Biotechnology Journal 16: 1424–1433. [DOI] [PMC free article] [PubMed] [Google Scholar]
- Wheeler GL, Jones MA, Smirnoff N. 1998. The biosynthetic pathway of vitamin C in higher plants. Nature 393: 365–369. [DOI] [PubMed] [Google Scholar]
- Xu C. 2020. Pull‐down and co‐immunoprecipitation assays of interacting proteins in plants. Chinese Bulletin of Botany 55: 62–68. [Google Scholar]
- Yang B, Song Z, Li C, Jiang J, Zhou Y, Wang R, Wang Q, Ni C, Liang Q, Chen H et al. 2018. RSM1, an Arabidopsis MYB protein, interacts with HY5/HYH to modulate seed germination and seedling development in response to abscisic acid and salinity. PLoS Genetics 14: e1007839. [DOI] [PMC free article] [PubMed] [Google Scholar]
- Ye J, Li W, Ai G, Li C, Liu G, Chen W, Wang B, Wang W, Lu Y, Zhang J et al. 2019. Genome‐wide association analysis identifies a natural variation in basic helix‐loop‐helix transcription factor regulating ascorbate biosynthesis via D‐mannose/L‐galactose pathway in tomato. PLoS Genetics 15: e1008149. [DOI] [PMC free article] [PubMed] [Google Scholar]
- Yu M, Man Y, Wang Y. 2019. Light‐ and temperature‐induced expression of an R2R3‐MYB gene regulates anthocyanin biosynthesis in red‐fleshed kiwifruit. International Journal of Molecular Sciences 20: 5228. [DOI] [PMC free article] [PubMed] [Google Scholar]
- Yu Y, Wang J, Li S, Kakan X, Zhou Y, Miao Y, Wang F, Qin H, Huang R. 2019. Ascorbic acid integrates the antagonistic modulation of ethylene and abscisic acid in the accumulation of reactive oxygen species. Plant Physiology 179: 1861–1875. [DOI] [PMC free article] [PubMed] [Google Scholar]
- Yuan J, Yu Z, Lin T, Wang L, Chen X, Liu T, Wang J, Hou X, Li Y. 2020. BcERF070, a novel ERF (ethylene‐response factor) transcription factor from non‐heading Chinese cabbage, affects the accumulation of ascorbic acid by regulating ascorbic acid‐related genes. Molecular Breeding 40: 1–18. [Google Scholar]
- Zhang G‐Y, Liu R‐R, Zhang C‐Q, Tang K‐X, Sun M‐F, Yan G‐H, Liu Q‐Q. 2015. Manipulation of the rice L‐galactose pathway: evaluation of the effects of transgene overexpression on ascorbate accumulation and abiotic stress tolerance. PLoS ONE 10: e0125870. [DOI] [PMC free article] [PubMed] [Google Scholar]
- Zhang H, Xiang Y, He N, Liu X, Liu H, Fang L, Zhang F, Sun X, Zhang D, Li X et al. 2020. Enhanced vitamin C production mediated by an ABA‐induced PTP‐like nucleotidase improves plant drought tolerance in Arabidopsis and maize. Molecular Plant 13: 760–776. [DOI] [PubMed] [Google Scholar]
- Zhang W, Lorence A, Gruszewski HA, Chevone BI, Nessler CL. 2009. AMR1, an Arabidopsis gene that coordinately and negatively regulates the mannose/L‐galactose ascorbic acid biosynthetic pathway. Plant Physiology 150: 942–950. [DOI] [PMC free article] [PubMed] [Google Scholar]
- Zhang Z, Wang J, Zhang R, Huang R. 2012. The ethylene response factor AtERF98 enhances tolerance to salt through the transcriptional activation of ascorbic acid synthesis in Arabidopsis. The Plant Journal 71: 273–287. [DOI] [PubMed] [Google Scholar]
- Zhou Y, Tao QC, Wang ZN, Fan R, Li Y, Sun XF, Tang KX. 2012. Engineering ascorbic acid biosynthetic pathway in Arabidopsis leaves by single and double gene transformation. Biologia Plantarum 56: 451–457. [Google Scholar]
- Zhu W, Zhou H, Lin F, Zhao X, Jiang Y, Xu D, Deng XW. 2020. COLD‐REGULATED GENE27 integrates signals from light and the circadian clock to promote hypocotyl growth in Arabidopsis. Plant Cell 32: 3155–3169. [DOI] [PMC free article] [PubMed] [Google Scholar]
Associated Data
This section collects any data citations, data availability statements, or supplementary materials included in this article.
Supplementary Materials
Fig. S1 Differentially expressed genes.
Fig. S2 Expression of GGP1, GGP3 and AsA content.
Fig. S3 Gene expression in Actinidia eriantha and A. rufa hybrids.
Fig. S4 Transient expression AceGGP3 in Actinidia eriantha calli.
Fig. S5 Correlation and phylogenetic analysis of AceMYBS1.
Fig. S6 Disorder and ‘SMART’ domain architecture predictions.
Fig. S7 AceMYBS1 activated the AceGGP3 promoter.
Fig. S8 The predicted binding sequence motif of AceMYBS1.
Fig. S9 Phylogenetic analysis of GBF3.
Fig. S10 AceMYBS1 interacts with AceGBF3.
Fig. S11 Subcellular localization of AceMYBS1 and AceGBF3 protein.
Fig. S12 Transiently overexpressed AceGBF3 in tobacco.
Fig. S13 Transiently overexpressed AceGBF3, AceMYBS1 and co‐expression in tobacco leaves.
Fig. S14 ABA inhibits AsA synthesis.
Fig. S15 ABA inhibits AsA synthesis via AceMYBS1.
Methods S1 Details of methods.
Notes S1 Promoter sequence of AceGGP3; CDS of AcrGGP3; CDS of AcrGGP1; CDS of AcrGGP2 in fasta format.
Table S1 Sequences of primers and other oligonucleotides used in this study.
Table S2 The GenBank accession numbers used in this study.
Table S3 The summary of the expression profile of transcript factors that was related with AsA and the correlation coefficient between these transcript factor and GGP3.
Please note: Wiley Blackwell are not responsible for the content or functionality of any Supporting Information supplied by the authors. Any queries (other than missing material) should be directed to the New Phytologist Central Office.
Data Availability Statement
The data that support the findings of this study are available in the supplementary material of this article. RNAseq data are openly available in NCBI at https://www.ncbi.nlm.nih.gov, Genbank accession no. PRJNA771781 and PRJNA771785.