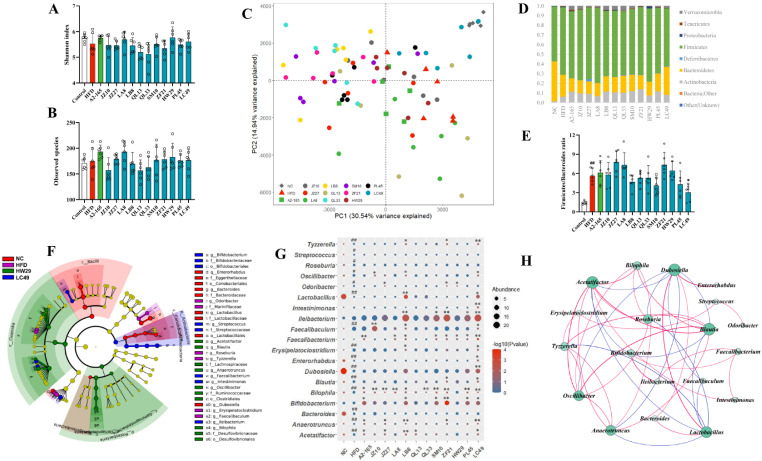
Figure 4.
The effect of F. prausnitzii strains on gut microbial composition in NAFLD mice. (A,B) Shannon index and observed species; (C) Principal coordinates analysis; (D) Changes in the abundance of phylum level; (E) The ratio of Firmicute/Bacteroidetes; (F) Cladogram depicting the differentially abundant taxa (LDA score > 2 and p < 0.05) among all groups. The right panel presents the differential taxa labeled with various tags; (G) The relative abundance of taxa remarkedly changed by HFD feeding and F. prausnitzii treatment. The size and color of the circles display the average abundance and p value, respectively; (H) Interaction network analysis among microbial biomarkers. The circle size indicates the contribution, and the line color represents a positive (red) or negative correlation (blue), respectively (p < 0.05, r > 0.3 or r < −0.3). Data are shown as means with SD; # p < 0.05, ## p < 0.01 vs. NC group, unpaired Student’s t-test; * p < 0.05, ** p < 0.01 vs. HFD group, one-way ANOVA followed by Dunnett’s test.

