

Abstract
Background
Contemporary seminal vesicle invasion (SVI) rates in National Cancer Comprehensive Network (NCCN) high‐risk prostate cancer (PCa) patients are not well known but essential for treatment planning. We examined SVI rates according to individual patient characteristics for purpose of treatment planning.
Materials and Methods
Within Surveillance, Epidemiology, and End Results (SEER) database (2010–2015), 4975 NCCN high‐risk patients were identified. In the development cohort (SEER geographic region of residence: South, North‐East, Mid‐West, n = 2456), we fitted a multivariable logistic regression model predicting SVI. Its accuracy, calibration, and decision curve analyses (DCAs) were then tested versus previous models within the external validation cohort (SEER geographic region of residence: West, n = 2519).
Results
Out of 4975 patients, 28% had SVI. SVI rate ranged from 8% to 89% according to clinical T stage, prostate‐specific antigen (PSA), biopsy Gleason Grade Group and percentage of positive biopsy cores. In the development cohort, these variables were independent predictors of SVI. In the external validation cohort, the current model achieved 77.6% accuracy vs 73.7% for Memorial Sloan Kettering Cancer Centre (MSKCC) vs 68.6% for Gallina et al. Calibration was better than for the two alternatives: departures from ideal predictions were 6.0% for the current model vs 9.8% for MSKCC vs 38.5% for Gallina et al. In DCAs, the current model outperformed both alternatives. Finally, different nomogram cutoffs allowed to discriminate between low versus high SVI risk patients.
Conclusions
More than a quarter of NCCN high‐risk PCa patients harbored SVI. Since SVI positivity rate varies from 8% to 89%, the currently developed model offers a valuable approach to distinguish between low and high SVI risk patients.
Keywords: high‐risk, prostate cancer, radical prostatectomy, Surveillance, Epidemiology, and End Results (SEER), SVI
1. INTRODUCTION
National Comprehensive Cancer Network (NCCN) high‐risk prostate cancer (PCa) patients account for 25% of most contemporary nonmetastatic PCa cases in the United States. 1 Of those PCa patients, 38% harbor non‐organ confined (NOC) disease. 2 , 3 Unfortunately, specific seminal vesicle invasion (SVI, pT3b) rates are not known, since SVI rates have invariably been reported in combination with ECE (pT3a/pT3b) and/or with higher stage (pT3b/pT4). Nonetheless, in high‐risk PCa patients, the specific knowledge of SVI is important in decision making. For example, when radiation therapy is considered for NCCN high‐risk PCa patients, dose modulation, delineation of clinical target volumes, as well as other technical refinements are applied to patients according to the level of SVI suspicion. 4 , 5 Similarly, when radical prostatectomy (RP) is considered, SVI resection with a wider margin should be planned preoperatively according to the level of SVI suspicion. 6 , 7 In consequence, pretreatment estimation of SVI risk is paramount, as much as is presence of ECE or LNI. 8 However, existing methods for predicting SVI might be suboptimal, since most relied on low and intermediate‐risk PCa patients and may not properly apply to contemporary NCCN high‐risk PCa patients, when estimation of SVI risk is sought. To address this void, we examined contemporary SVI rates, specifically in NCCN high‐risk PCa patients. Moreover, we explored the range of SVI rates according to independent patient characteristics, as well as to the number and type of NCCN high‐risk criteria. Subsequently, we fitted a multivariable model to predict SVI and compared it to existing tools within an independent external validation cohort. We hypothesized that SVI rates may not be in perfect agreement with historical observations and that contemporary tabulation and prediction of SVI probability may be better accomplished using the most recent population‐based data.
2. MATERIALS AND METHODS
2.1. Study population
The Surveillance, Epidemiology, and End Results (SEER) database samples 26% of the United States and approximates the United States in terms of geographic and demographic composition, as well as cancer incidence. 9 Within SEER database spanning years 2010–2015, we identified all nonmetastatic RP patients, aged between 40 and 75 years old, with histologically confirmed adenocarcinoma of the prostate, diagnosed at biopsy (International Classification of Disease for Oncology [ICD‐O‐3] code 8140 site code C61.9), who fulfilled the NCCN high‐risk criteria (≥cT3a and/or biopsy Gleason Grade Group [GGG] IV/V and/or prostate‐specific antigen [PSA] > 20 ng/ml 10 , 11 ).
We excluded patients with clinical stage cT4, PSA > 50 ng/ml, number of biopsy cores <10 or >14, as well as cases with missing information (PSA, pathologic T stage, clinical T stage (cT), biopsy GGG, and number of positive prostate biopsy cores).
2.2. Statistical analyses
First, we relied on the entire patient population to examine overall SVI, as well as specific SVI rates, according to baseline characteristics, such as age, PSA (ng/ml), percentage of positive biopsy cores, biopsy GGG, and cT.
Second, we divided the overall population according to SEER geographic region of residence (South, North‐East, Mid‐West, and West) between development (South, North‐East, Mid‐West, and West) and external (West) validation cohorts.
Within the development cohort, we fitted a multivariable logistic regression model predicting SVI using PSA (logarithmic transformation), cTs (cT1, cT2a, cT2b, cT2c, cT3a, and cT3b), biopsy GGG (I, II, III, IV, and V) and percentage of positive biopsy cores, as predictors. The logistic regression model was graphically displayed in nomogram format. 12 Subsequently, the multivariable logistic regression model was applied in the external validation cohort, and its accuracy, calibration properties, and decision curve analysis (DCA) were computed. 13 Similarly, accuracy, calibration, and DCA were also computed for the Gallina et al. nomogram 14 and for the updated online version of the Kattan nomogram (Memorial Sloan Kettering Cancer Center, MSKCC). 15
Finally, to allow clinical decision making, we tabulated several nomogram cutoffs for prediction of SVI, to show their effect on the numbers and percentages of patients at low risk of SVI (below the cutoff) versus those at high risk of SVI. All tests were two‐sided with a level of significance set at p < 0.05 and R software environment for statistical computing and graphics (version 3.4.3) was used for all analyses.
3. RESULTS
3.1. Study population characteristics
Overall, 4975 NCCN high‐risk PCa patients were identified (Table 1). Median age, median PSA, and median percentage of positive biopsy cores were respectively 63 years (interquartile range [IQR], 58–67), 8 ng/ml (IQR, 6–16), and 50% (IQR, 29–70). Rates of cT1, cT2a, cT2b, cT2c, cT3a, and cT3b were 63% versus 10% versus 7% versus 8% versus 7% versus 5%, respectively. Moreover, rates of biopsy GGG I, II, III, IV, and V were 3% versus 9% versus 7% versus 51% versus 30%, respectively.
Table 1.
Descriptive characteristics of 4975 NCCN high‐risk prostate cancer patients stratified according to SEER geographic region of residence in development versus external validation cohorts
| Overall, N = 4975a | Development cohort, n = 2456a (49.4%) | Validation cohort, n = 2519a (50.6%) | p b | |
|---|---|---|---|---|
| Age (years) | 63 (58, 67) | 63 (58, 67) | 64 (59, 68) | <0.001 |
| PSA (ng/ml) | 8 (6, 16) | 8 (5, 14) | 8 (6, 17) | <0.001 |
| Percentage of biopsy positive cores (%) | 50 (29, 70) | 50 (30, 67) | 50 (25, 71) | >0.9 |
| Biopsy Gleason Grade Group | 0.08 | |||
| I | 168 (3.4%) | 76 (3.1%) | 92 (3.7%) | |
| II | 422 (8.5%) | 205 (8.3%) | 217 (8.6%) | |
| III | 370 (7.4%) | 159 (6.5%) | 211 (8.4%) | |
| IV | 2539 (51%) | 1275 (52%) | 1264 (50%) | |
| V | 1476 (30%) | 741 (30%) | 735 (29%) | |
| Clinical T stage | <0.001 | |||
| cT1c | 3115 (63%) | 1613 (66%) | 1502 (60%) | |
| cT2a | 495 (9.9%) | 214 (8.7%) | 281 (11%) | |
| cT2b | 327 (6.6%) | 140 (5.7%) | 187 (7.4%) | |
| cT2c | 416 (8.4%) | 157 (6.4%) | 259 (10%) | |
| cT3a | 354 (7.1%) | 195 (7.9%) | 159 (6.3%) | |
| cT3b | 268 (5.4%) | 137 (5.6%) | 131 (5.2%) | |
| Seminal vesicle invasion c | 0.6 | |||
| Positive | 1410 (28%) | 705 (29%) | 705 (28%) | |
| SEER geographic region of residence | ||||
| Midwest | 515 (10%) | 515 (21%) | 0 (0%) | |
| North‐East | 1004 (20%) | 1004 (41%) | 0 (0%) | |
| South | 937 (19%) | 937 (38%) | 0 (0%) | |
| West | 2519 (51%) | 0 (0%) | 2519 (100%) |
Abbreviations: IQR, interquartile range; NCCN, National Cancer Comprehensive Network; PSA, prostate‐specific antigen; SEER, Surveillance, Epidemiology, and End Results.
Median (IQR); n (%).
Wilcoxon rank‐sum test; Pearson's Chi‐squared test.
Seminal vesicle invasion was evaluated at final pathological examination and staged as pathologic T stage pT3b.
Whitin those, 28% harbored SVI at RP (Table 2). SVI positive patients exhibited higher median PSA (10 vs. 8 ng/ml, p < 0.001), as well as higher median percentage of positive biopsy cores (67% vs. 42%, p < 0.001). SVI rates ranged from 23% to 37% according to PSA categories (<10, 10–20, and >20), from 17% to 41% according to biopsy GGG (I, IV, II, III, and V), and from 13% to 87% according to cTs (cT3a, cT2a, cT1, cT2b, cT2c, and cT3b) and from 12% to 47% according to percentage of positive biopsy cores tertiles (<33%, 33%–58%, >58%), respectively.
Table 2.
Descriptive characteristics of 4975 NCCN high‐risk prostate cancer patients according to seminal vesicle invasion (SVI) status: SVI negative versus SVI positive
| SVI negative, n = 3565a (72%) | SVI positive,b n = 1410a (28%) | p c | |
|---|---|---|---|
| PSA (ng/ml) | 8 (5, 14) | 10 (6, 21) | <0.001 |
| Percentage of biopsy positive core (%) | 42 (25, 58) | 67 (43, 92) | <0.001 |
| PSA category | <0.001 | ||
| <10 ng/ml | 2312 (77%) | 696 (23%) | |
| 10–20 ng/ml | 598 (64%) | 331 (36%) | |
| >20 ng/ml | 655 (63%) | 383 (37%) | |
| Percentage of positive biopsycores (tertiles) | <0.001 | ||
| ≤33% | 1547 (88%) | 217 (12%) | |
| 33%–58% | 1168 (73%) | 433 (27%) | |
| >58% | 850 (53%) | 760 (47%) | |
| Clinical T stage | <0.001 | ||
| cT1c | 2336 (75%) | 779 (25%) | |
| cT2a | 392 (79%) | 103 (21%) | |
| cT2b | 229 (70%) | 98 (30%) | |
| cT2c | 266 (64%) | 150 (36%) | |
| cT3a | 308 (87%) | 46 (13%) | |
| cT3b | 34 (13%) | 234 (87%) | |
| Biopsy Gleason Grade Group | <0.001 | ||
| I | 139 (83%) | 29 (17%) | |
| II | 294 (70%) | 128 (30%) | |
| III | 223 (60%) | 147 (40%) | |
| IV | 2036 (80%) | 503 (20%) | |
| V | 873 (59%) | 603 (41%) |
Abbreviations: IQR, interquartile range; NCCN, National Cancer Comprehensive Network; PSA, prostate‐specific antigen; SEER, Surveillance, Epidemiology, and End Results.
Median (IQR); n (%).
Seminal vesicle invasion was evaluated at final pathological examination and staged as pathologic T stage pT3b.
Wilcoxon rank‐sum test; Pearson's Chi‐squared test.
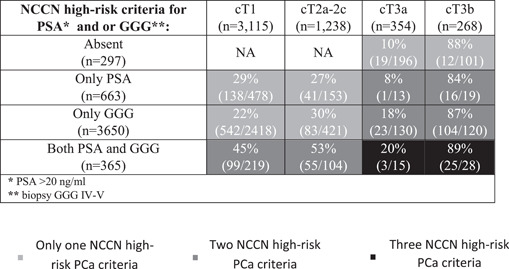
Subsequently, we analyzed SVI rates according to different combinations of NCCN high‐risk PCa criteria. SVI rates ranged from 8% to 20% in cT3a patients, from 22% to 45% in cT1c patients, from 27% to 53% in cT2a–2c patients and from 84% to 89% in cT3b patients (Table 3).
Table 3.
Seminal vesicle invasion rates in 4975 NCCN high‐risk prostate cancer (PCa) patients according to different combinations of NCCN high‐risk criteria (PSA > 20 ng/ml, biopsy GGG IV–V and cT3a or cT3b)
|
Abbreviations: GGG, Gleason Grade Group; NCCN, National Cancer Comprehensive Network; PSA, prostate‐specific antigen.
3.2. Prediction of SVI in NCCN high‐risk PCa patients
Stratification of the overall cohort according to SEER geographic region of residence resulted in a development cohort of 2456 patients (49%) and an external validation cohort of 2519 patients (51%). No meaningful differences were recorded regarding PSA, cT, biopsy GGG, percentage of positive biopsy cores, and SVI rates between the two cohorts (Table 1). Within the development cohort, we fitted a multivariable logistic regression model predicting SVI (Table 4). All variables (PSA, cT, biopsy GGG, and percentage of positive biopsy cores) were independent predictors (all p ≤ 0.02), and the model was graphically depicted in the nomogram format (Figure 1). Within the external validation cohort (n = 2519), accuracy was 77.6% for the current model versus 73.7% for the MSKCC model versus 68.6% for the Gallina et al. model. Calibration plots (Figure 2) within the external validation cohort exhibited lowest departures from ideal predictions for the current model (6.0%) versus intermediate for MSKCC (9.8%) versus highest for Gallina et al. (38.5%). In DCA, the current model resulted in greater net benefit for virtually all threshold probabilities, from 0% to 87%, relative to both MSKCC and Gallina et al. nomograms (Figure 3).
Table 4.
Multivariable logistic regression model predicting seminal vesicle invasion (SVI) at radical prostatectomy in NCCN high‐risk prostate cancer patients in the development cohort
| Multivariable logistic regression model predicting SVIa | |||
|---|---|---|---|
| Variables | OR | 95% CI | p |
| PSA b | 1.50 | 1.26–1.80 | 0.001 |
| Clinical T stage | |||
| cT2a | 0.78 | 1.54–1.11 | 0.2 |
| cT2b | 1.02 | 0.67–1.52 | 0.9 |
| cT2c | 0.83 | 0.55–1.23 | 0.4 |
| cT3a | 0.34 | 0.20–0.55 | 0.001 |
| cT3b | 32.7 | 12.2–63.05 | 0.001 |
| Biopsy GGG | |||
| GGG II | 2.07 | 0.88–5.38 | 0.11 |
| GGG III | 2.32 | 0.98–6.12 | 0.07 |
| GGG IV | 2.57 | 1.16–6.44 | 0.03 |
| GGG V | 6.32 | 2.84–15.93 | 0.001 |
| Percentage of biopsy positive cores (%) | 1.03 | 1.02–1.03 | 0.001 |
| C‐indexc | 77.6 | 75.5–79.5 | |
Abbreviations: CI, confidence interval; GGG, Gleason Grade Group; NCCN, National Cancer Comprehensive Network; OR, odds ratio; PSA, prostate‐specific antigen.
Seminal vesicle invasion was evaluated at final pathological examination and staged as pathologic T stage pT3b.
PSA was subjected to logarithmic transformation.
C‐index is calculated in the validation cohort with a bootstrapped 95% Confidence interval.
Figure 1.
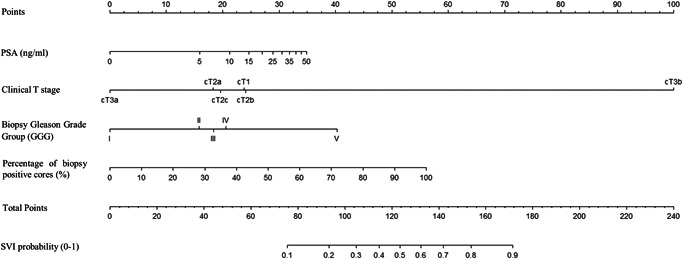
Nomogram predicting the individual probability of seminal vesicle invasion (SVI) in NCCN high‐risk prostate cancer patients. PSA, prostate‐specific antigen. NCCN, National Cancer Comprehensive Network.
Figure 2.
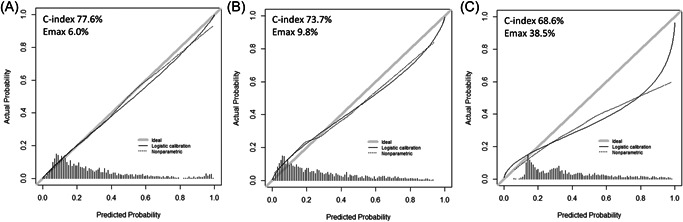
External validation of calibration properties of different models predicting seminal vesical invasion in prostate cancer patients: in the current model (A) relative to previous alternative by MSKCC (B) or by Gallina et al. (C). Accuracy (C‐index) and departures from ideal predictions (Emax) were reported for each separate model. MSKCC, Memorial Sloan Kettering Cancer Center.
Figure 3.
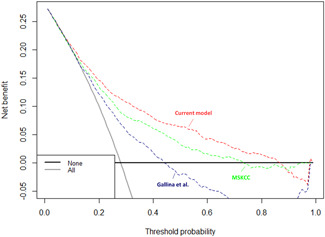
Decision curve analysis depicting the net benefit of the current model (red) relative to Gallina et al. (blue), as well as MSKCC (green) in the external validation cohort. MSKCC, Memorial Sloan Kettering Cancer Center. [Color figure can be viewed at wileyonlinelibrary.com].
3.3. Nomogram cutoffs for identification of NCCN high‐risk PCa patients at low risk of SVI
Several nomogram cutoffs may be applied to discriminate between low versus high SVI probability (Table 5). For example, a 12% cutoff would identify 641 out of 2519 individuals (25.5%) at low SVI risk (below the nomogram cutoff), at the price of missing SVI in 52 patients of these patients (8.1%).
Table 5.
Analyses of seminal vesicle invasion (SVI) nomogram cutoffs in the validation cohort of 2519 NCCN high‐risk PCa patients focusing on patients at low SVI risk
| Nomogram cutoff | Number of patients with lower risk of SVI according to probability threshold (below the nomogram cutoff) | Number of patients below the probability threshold harboring SVI (missing SVI patients) |
|---|---|---|
| 0.05 | 66/2519 (2.6%) | 3/66 (4.6%) |
| 0.07 | 176/2519 (7.0%) | 12/176 (6.8%) |
| 0.10 | 466/2519 (18.5%) | 32/466 (6.9%) |
| 0.12 | 641/2519 (25.5%) | 52/641 (8.1%) |
| 0.15 | 877/2519 (34.8%) | 88/877 (10.03%) |
| 0.17 | 1010/2519 (40.1%) | 108/1010 (10.7%) |
| 0.20 | 1177/2519 (46.7%) | 142/1177 (12%) |
Abbreviations: NCCN, National Cancer Comprehensive Network; PCa, prostate cancer.
Alternatively, a lower cutoff (10%) would identify 466 out of 2519 (18.5%) at the price of missing SVI in 32 of these patients (6.9%). If a higher rate of missed SVI within the low‐risk individuals could be accepted, a potential cutoff could be 17%, which would identify 1010 out of 2519 (40.1%) at the price of missing SVI in 108 of these patients (10.7%).
4. DISCUSSION
In the current study, we hypothesized that SVI rates may not be in perfect agreement with historical observations and that contemporary tabulation and prediction of SVI probability may be better accomplished using the most recent population‐based data. Our study led to several noteworthy observations.
First, more than one in four contemporary NCCN high‐risk PCa patients harbored SVI (28%). This result is in agreement with previous North American and European institutional studies investigating SVI rates in D'Amico high‐risk patients. 16 , 17 , 18 However, in two institutional NCCN high‐risk PCa cohorts this rate was higher (35% and 36%). 19 , 20 In consequence, we are the first to specifically validate SVI rates in a contemporary large‐scale, population‐based cohort of NCCN high‐risk PCa patients. Interestingly, we reported unexpected low rates of SVI in cT3a NCCN high‐risk patients (13%). This finding is in agreement with an European institutional study reporting 16% rate of SVI among cT3a patients treated with RP. 21 Moreover, Joniau et al. 22 published pretreatment tables predicting probability of pathologic outcomes (ECE, SVI, etc.) in cT3a patients, while accounting for GGG at biopsy and PSA. The authors observed that the association between cT3a and SVI is potentially influenced by the presence of other high‐risk features. Notably, more than half of cT3a patients in the current NCCN high‐risk cohort are considered high‐risk exclusively because of the clinical stage (196/354) with only 8% exhibiting PSA > 20 ng/ml and 40% harboring GGG IV–V. Conversely, cT1–2 patients exhibited PSA > 20 ng/ml in 22% and biopsy GGG IV–V in 86% of cases. To further support the importance of other high‐risk features beyond clinical stage, Hoeh et al. 23 reported an unexpected high rate of non‐organ confined disease (51%) in exclusive PSA high‐risk PCa patients. Consequently, lower rate of SVI in cT3a compared to cT2 patients might be due to the fact that these patients harbored less aggressive features (PSA and GGG) than cT2 counterparts when NCCN high‐risk only PCa patients are considered. Moreover, it should be noted that clinical stage was determined by DRE alone, as advocated by guidelines, and this assessment may vary from one physician to another. Nonetheless, lack of data on preoperative imaging in our database prevented us from addressing the impact of imaging techniques such as CT and MRI on the assessment of clinical stage.
Second, SVI rates varied according to baseline patient characteristics. They ranged from 8% to 89% and increased with number and type of PCa high‐risk criteria. These observations illustrate the heterogeneity of SVI rates according to clinical patient characteristics and established NCCN high‐risk PCa criteria. To the best of our knowledge, we are first to record this relationship. As consequence within NCCN high‐risk PCa patients, it is possible to risk‐stratify SVI rates according to available clinical characteristics. Based on the above variability, it may be postulated that treatment delivery in NCCN high‐risk PCa patients may require adjustments according to SVI risk. For example, ESTRO ACROP consensus guideline recommends specific delineation of the clinical target volume of the seminal vesicle according to SVI risk. 4 Moreover, NCCN guidelines suggest avoiding rectal space implantation before radiotherapy, when the SVI risk is elevated. 24 Additionally, Goupy et al. 25 also reported on the importance of SVI risk in radiotherapy planning, where intensity‐modulated radiotherapy represents a valuable option according to elevated SVI risk. Similar, considerations are required for robotic RP planning to maximize functional outcomes without affecting oncologic safety. 6 , 7 , 26 Unfortunately, current SVI risk estimation may only be accomplished with methods that predominantly relied on low and intermediate‐risk PCa patients. Such approach does not lend itself to use in high‐risk PCa patients, since SVI rate radically differs between those patient groups. 8 To address this limitation, we developed and tested a contemporary model predicting SVI in an exclusive population of NCCN high‐risk PCa patients.
To achieve this objective, we fitted a multivariable logistic regression model within the development cohort. Subsequently, we performed head‐to‐head comparisons of its accuracy, calibration, and DCA outcomes, relative to two existing models (MSKCC 15 and Gallina et al. 14 ). The current model outperformed the two alternatives in accuracy (77.6% vs. 73.7% vs. 68.6%), calibration properties (6.0% vs. 9.8% vs. 38.5%) and DCA. Taken together, the current multivariable model is better capable of identifying patients at either low or high SVI risk than previously reported alternatives. 14 , 15
Finally, we explored the use of several nomogram cutoffs for discriminating between SVI negative versus positive patients. For example, a 12% cutoff would identify 641 low SVI risk individuals within the cohort of 2519 (25.5%), at the price of missing 52 SVI positive patients within those 641 below the nomogram cutoff (8.1%). Alternatively, a lower cutoff (10%) would identify 466 low SVI risk individuals within the cohort of 2519 (18.5%), at the price of missing 32 SVI positive patients within those 466 below the nomogram cutoff (6.9%). If a higher rate of missed SVI within low‐risk individuals could be accepted, a potential cutoff of 17% might be proposed. The latter would identify 1010 out of 2519 (40.1%), at the price of missing 108 SVI‐positive patients within those 1010 below the nomogram cutoff (10.7%). Implementation of the above nomogram cut‐offs may help identifying low SVI risk patients, in whom high‐intensity RT or wider resection at RP might be obviated.
Our study is not devoid of limitations. First, grading in SEER data may not be as accurate as in institutional studies with dedicated GU pathologists. Indeed, two previous studies reported a significant risk of undergrading Gleason pattern 5. 27 , 28 In consequence, a more accurate grading could affect the nomogram by making GG5 potentially even more powerful. To test this hypothesis a further validation of the current model within an institutional database, reviewed by GU pathologists, will be required. Second, SEER database does not provide information on total length of biopsy cores, percentage of positive length, and biopsy schemes (i.e., SV target‐biopsy). To date, only Koh et al. 29 published a nomogram predicting SVI which included percentage of positive core at prostate base. However, this model was developed in a cohort of men diagnosed with the use of sextant biopsies. In consequence, cancer characteristics of these men may no longer be reflective of contemporary patients, who are subjected to extended biopsy schemes. Third, imaging data are unavailable in the SEER database. Two previous investigators (Gandaglia et al. 30 and Martini et al. 31 ) integrated MRI findings within a nomogram predicting SVI. However, neither investigator relied exclusively on high‐risk PCa patients nor have they provided information on absolute number or specific proportions of high‐risk PCa patients, within their study cohorts. 30 , 31 Moreover, both studies relied on institutional cohorts with relatively small sample sizes (n = 504 31 and n = 614 30 ). Additionally, Gandaglia et al. developed their nomogram based on European patients, which are known not to be comparable to their North American counterparts. 32 In consequence, despite the novelty and high value of their contributions, a direct comparison with our study cannot be drawn. Finally, only the Gandaglia nomogram relied on an external validation cohort to test its accuracy and net benefit, relative to MSKCC nomogram. 33 Unfortunately, their newly developed model failed to exhibit higher accuracy (69% vs 70%) and greater net benefit was shown only for a narrow range of probability threshold between 0% and 7.5%, but not for higher probability threshold (7.5%–00%) where both models virtually overlapped one another. 33 Interestingly, other investigators also failed to show added benefit in SVI prediction, when MRI findings were included to established clinical predictors within the MSKCC nomogram. 34 , 35 In consequence, it is debatable whether MRI findings may improve the accuracy of a nomogram predicting SVI based on clinical characteristics, such as cT stage, PSA, biopsy GGG and percentage of positive biopsy cores. This concept remains to be tested in contemporary cohorts of NCCN high‐risk PCa patients with universally available MRI findings.
5. CONCLUSION
More than a quarter of NCCN high‐risk PCa patients harbored SVI. Since SVI positivity rate varies from 8% to 89%, the currently developed model offers a valuable approach to distinguish between low and high SVI risk patients.
CONFLICTS OF INTEREST
The authors declare no conflicts of interest.
ACKNOWLEDGMENT
The research was conducted in the absence of any commercial or financial relationships that could be construed as a potential conflict of interest. Open Access Funding provided by Universita degli Studi di Roma La Sapienza within the CRUI‐CARE Agreement.
Flammia RS, Hoeh B, Sorce G, et al. Contemporary seminal vesicle invasion rates in NCCN high‐risk prostate cancer patients. The Prostate. 2022;82:1051‐1059.
DATA AVAILABILITY STATEMENT
All data generated for this analysis were from the SEER database. The code for the analyses will be made available upon request.
REFERENCES
- 1. Wenzel M, Würnschimmel C, Ruvolo CC, et al. Increasing rates of NCCN high and very high‐risk prostate cancer versus number of prostate biopsy cores. Prostate. 2021;81:874‐881. https://onlinelibrary.wiley.com/doi/full/10.1002/pros.24184 [DOI] [PubMed] [Google Scholar]
- 2. Fossati N, Passoni NM, Moschini M, et al. Impact of stage migration and practice changes on high‐risk prostate cancer: results from patients treated with radical prostatectomy over the last two decades. BJU Int. 2016;117:740‐747. https://pubmed‐ncbi‐nlm‐nih‐gov.ezproxy.uniroma1.it/25787671/ [DOI] [PMC free article] [PubMed] [Google Scholar]
- 3. Pompe RS, Karakiewicz PI, Tian Z, et al. Oncologic and functional outcomes after radical prostatectomy for high or very high risk prostate cancer: European Validation of the Current NCCN® Guideline. J Urol. 2017;198:354‐361. [DOI] [PubMed] [Google Scholar]
- 4. Salembier C, Villeirs G, De Bari B, et al. ESTRO ACROP consensus guideline on CT‐ and MRI‐based target volume delineation for primary radiation therapy of localized prostate cancer. Radiother Oncol. 2018;127:49‐61. https://pubmed‐ncbi‐nlm‐nih‐gov.ezproxy.uniroma1.it/29496279/ [DOI] [PubMed] [Google Scholar]
- 5. Ghadjar P, Fiorino C, Munck af Rosenschöld P, Pinkawa M, Zilli T, van der Heide UA. ESTRO ACROP consensus guideline on the use of image guided radiation therapy for localized prostate cancer. Radiother Oncol. 2019;141:5‐13. [DOI] [PubMed] [Google Scholar]
- 6. Mazzone E, Dell'oglio P, Rosiello G, et al. Technical refinements in superextended robot‐assisted radical prostatectomy for locally advanced prostate cancer patients at multiparametric magnetic resonance imaging. Eur Urol. 2021;80:104‐112. [DOI] [PubMed] [Google Scholar]
- 7. Kumar A, Samavedi S, Bates AS, et al. Safety of selective nerve sparing in high risk prostate cancer during robot‐assisted radical prostatectomy. J Robot Surg. 2017;11:129‐138. https://pubmed‐ncbi‐nlm‐nih‐gov.ezproxy.uniroma1.it/27435701/ [DOI] [PubMed] [Google Scholar]
- 8. Eifler JB, Feng Z, Lin BM. An updated prostate cancer staging nomogram (Partin tables) based on cases from 2006 to 2011. BJU Int. 2013;111:22‐29. [DOI] [PMC free article] [PubMed] [Google Scholar]
- 9. About the SEER Program . n.d. Accessed September 22, 2021. https://seer.cancer.gov/about/
- 10. Hoeh B, Würnschimmel C, Flammia RS, et al. Cancer‐specific survival after radical prostatectomy versus external beam radiotherapy in high‐risk and very high‐risk African American prostate cancer patients. Prostate. 2022;82:120‐131. [DOI] [PubMed] [Google Scholar]
- 11. Chierigo F, Wenzel M, Würnschimmel C, et al. Survival after radical prostatectomy versus radiation therapy in high‐risk and very high‐risk prostate cancer. J Urol. 2022;207:375‐384. https://pubmed‐ncbi‐nlm‐nih‐gov.ezproxy.uniroma1.it/34555930/ [DOI] [PubMed] [Google Scholar]
- 12. Wenzel M, Würnschimmel C, Chierigo F, et al. Nomogram predicting downgrading in national comprehensive cancer network high‐risk prostate cancer patients treated with radical prostatectomy. Eur Urol Focus. 2021. https://pubmed‐ncbi‐nlm‐nih‐gov.ezproxy.uniroma1.it/34334344/ [DOI] [PubMed] [Google Scholar]
- 13. Ellis RJ, Kalma B, Del Vecchio SJ, et al. Chronic kidney cortical damage is associated with baseline kidney function and albuminuria in patients managed with radical nephrectomy for kidney tumours. Pathology. 2019;51:32‐38. http://www.ncbi.nlm.nih.gov/pubmed/30477884 [DOI] [PubMed] [Google Scholar]
- 14. Gallina A, Chun FK, Briganti A, et al. Development and split‐sample validation of a nomogram predicting the probability of seminal vesicle invasion at radical prostatectomy. Eur Urol. 2007;52:98‐105. [DOI] [PubMed] [Google Scholar]
- 15.Hereditary Prostate Cancer. Memorial Sloan Kettering Cancer Center. https://www.mskcc.org/nomograms/prostate/pre_op
- 16. Ploussard G, Masson‐Lecomte A, Beauval JB, et al. Radical prostatectomy for high‐risk prostate cancer defined by preoperative criteria: oncologic follow‐up in national multicenter study in 813 patients and assessment of easy‐to‐use prognostic substratification. Urology. 2011;78:607‐613. [DOI] [PubMed] [Google Scholar]
- 17. Pierorazio PM, Ross AE, Han M, Epstein JI, Partin AW, Schaeffer EM. Evolution of the clinical presentation of men undergoing radical prostatectomy for high‐risk prostate cancer. BJU Int. 2012;109:988‐993. https://onlinelibrary.wiley.com/doi/full/10.1111/j.1464‐410X.2011.10514.x [DOI] [PMC free article] [PubMed] [Google Scholar]
- 18. Walz J, Joniau S, Chun FK, et al. Pathological results and rates of treatment failure in high‐risk prostate cancer patients after radical prostatectomy. BJU Int. 2011;107:765‐770. https://onlinelibrary.wiley.com/doi/full/10.1111/j.1464‐410X.2010.09594.x [DOI] [PubMed] [Google Scholar]
- 19. Reichard CA, Kukreja J, Gregg JR, et al. Prediction of organ‐confined disease in high‐ and very‐high‐risk prostate cancer patients staged with magnetic resonance imaging: implications for clinical trial design. Eur Urol Focus. 2021;7:71‐77. [DOI] [PubMed] [Google Scholar]
- 20. Tward JD, O'neil B, Boucher K, et al. Metastasis, mortality, and quality of life for men with NCCN High and very high risk localized prostate cancer after surgical and/or combined modality radiotherapy. Clin Genitourin Cancer. 2020;18:274‐283. [DOI] [PubMed] [Google Scholar]
- 21. Joniau S, Hsu CY, Lerut E, et al. A pretreatment table for the prediction of final histopathology after radical prostatectomy in clinical unilateral T3a prostate cancer. Eur Urol. 2007;51:388‐396. https://pubmed‐ncbi‐nlm‐nih‐gov.ezproxy.uniroma1.it/16901622/ [DOI] [PubMed] [Google Scholar]
- 22. Joniau S, Spahn M, Briganti A, et al. Pretreatment tables predicting pathologic stage of locally advanced prostate cancer. Eur Urol. 2015;67:319‐325. https://pubmed.ncbi.nlm.nih.gov/24684960/ [DOI] [PubMed] [Google Scholar]
- 23. Hoeh B, Flammia RS, Hohenhorst L, et al. Non‐organ confined stage and upgrading rates in exclusive PSA high‐risk prostate cancer patients. Prostate. 2022;82:687‐694. http://www.ncbi.nlm.nih.gov/pubmed/35188982 [DOI] [PubMed] [Google Scholar]
- 24. Schaeffer E, Srinivas S, Antonarakis ES, et al. NCCN guidelines insights: prostate cancer, version 1.2021. J Natl Compr Cancer Netw. 2021;19(2):134‐143. https://jnccn.org/view/journals/jnccn/19/2/article‐p134.xml [DOI] [PubMed] [Google Scholar]
- 25. Goupy F, Supiot S, Pasquier D, et al. Intensity‐modulated radiotherapy for prostate cancer with seminal vesicle involvement (T3b): a multicentric retrospective analysis. PLOS One. 2019;14:0210514. https://pubmed‐ncbi‐nlm‐nih‐gov.ezproxy.uniroma1.it/30682036/ [DOI] [PMC free article] [PubMed] [Google Scholar]
- 26. Nyarangi‐Dix JN, Görtz M, Gradinarov G, et al. Retzius‐sparing robot‐assisted laparoscopic radical prostatectomy: functional and early oncologic results in aggressive and locally advanced prostate cancer. BMC Urol. 2019;19:1‐7. https://bmcurol.biomedcentral.com/articles/10.1186/s12894‐019‐0550‐9 [DOI] [PMC free article] [PubMed] [Google Scholar]
- 27. Al‐Hussain TO, Nagar MS, Epstein JI. Gleason pattern 5 is frequently underdiagnosed on prostate needle‐core biopsy. Urology. 2012;79:178‐181. https://pubmed‐ncbi‐nlm‐nih‐gov.ezproxy.uniroma1.it/22035764/ [DOI] [PubMed] [Google Scholar]
- 28. Fajardo DA, Miyamoto H, Miller JS, Lee TK, Epstein JI. Identification of Gleason pattern 5 on prostatic needle core biopsy: frequency of underdiagnosis and relation to morphology. Am J Surg Pathol. 2011;35:1706‐1711. https://pubmed‐ncbi‐nlm‐nih‐gov.ezproxy.uniroma1.it/21997691/ [DOI] [PubMed] [Google Scholar]
- 29. Koh H, Kattan MW, Scardino PT, et al. A nomogram to predict seminal vesicle invasion by the extent and location of cancer in systematic biopsy results. J Urol. 2003;170:1203‐1208. [DOI] [PubMed] [Google Scholar]
- 30. Gandaglia G, Ploussard G, Valerio M, et al. The key combined value of multiparametric magnetic resonance imaging, and magnetic resonance imaging–targeted and concomitant systematic biopsies for the prediction of adverse pathological features in prostate cancer patients undergoing radical prostatectomy. Eur Urol. 2020;77:733‐741. [DOI] [PubMed] [Google Scholar]
- 31. Martini A, Gupta A, Cumarasamy S, et al. Novel nomogram for the prediction of seminal vesicle invasion including multiparametric magnetic resonance imaging. Int J Urol. 2019;26:458‐464. https://pubmed‐ncbi‐nlm‐nih‐gov.ezproxy.uniroma1.it/30659663/ [DOI] [PubMed] [Google Scholar]
- 32. Gallina A, Chun FK, Suardi N, et al. Comparison of stage migration patterns between Europe and the USA: an analysis of 11 350 men treated with radical prostatectomy for prostate cancer. BJU Int. 2008;101:1513‐1518. https://onlinelibrary.wiley.com/doi/full/10.1111/j.1464‐410X.2008.07519.x [DOI] [PubMed] [Google Scholar]
- 33. Diamand R, Ploussard G, Roumiguié M, et al. External validation of a multiparametric magnetic resonance imaging‐based nomogram for the prediction of extracapsular extension and seminal vesicle invasion in prostate cancer patients undergoing radical prostatectomy. Eur Urol. 2021;79:180‐185. https://pubmed‐ncbi‐nlm‐nih‐gov.ezproxy.uniroma1.it/33023770/ [DOI] [PubMed] [Google Scholar]
- 34. Feng TS, Sharif‐Afshar AR, Wu J, et al. Multiparametric MRI improves accuracy of clinical nomograms for predicting extracapsular extension of prostate cancer. Urology. 2015;86:332‐337. [DOI] [PubMed] [Google Scholar]
- 35. Weaver JK, Kim EH, Vetter JM, et al. Prostate magnetic resonance imaging provides limited incremental value over the memorial sloan kettering cancer center preradical prostatectomy nomogram. Urology. 2018;113:119‐128. [DOI] [PubMed] [Google Scholar]
Associated Data
This section collects any data citations, data availability statements, or supplementary materials included in this article.
Data Availability Statement
All data generated for this analysis were from the SEER database. The code for the analyses will be made available upon request.