

Abstract
Fermentation at elevated hydrostatic pressure is a novel strategy targeting product selectivity. However, the role of inoculum history and cross‐resistance, that is, acquired tolerance from incubation under distinctive environmental stress, remains unclear in high‐pressure operation. In our here presented work, we studied fermentation and microbial community responses of halotolerant marine sediment inoculum (MSI) and anaerobic digester inoculum (ADI), pre‐incubated in serum bottles at different temperatures and subsequently exposed to mild hydrostatic pressure (MHP; < 10 MPa) in stainless steel reactors. Results showed that MHP effects on microbial growth, activity, and community structure were strongly temperature‐dependent. At moderate temperature (20°C), biomass yield and fermentation were not limited by MHP; suggesting a cross‐resistance effect from incubation temperature and halotolerance. Low temperatures (10°C) and MHP imposed kinetic and bioenergetic limitations, constraining growth and product formation. Fermentation remained favorable in MSI at 28°C and ADI at 37°C, despite reduced biomass yield resulting from maintenance and decay proportionally increasing with temperature. Microbial community structure was modified by temperature during the enrichment, and slight differences observed after MHP‐exposure did not compromise functionality. Results showed that the relation incubation temperature—halotolerance proved to be a modifier of microbial responses to MHP and could be potentially exploited in fermentations to modulate product/biomass ratio.
Keywords: anaerobic fermentation, halotolerance, mild hydrostatic pressure, piezotolerance, psychrotolerance
Fermentation at elevated hydrostatic pressure is a novel strategy to increase product selectivity. Ceron‐Chafla et al. used marine sediment and anaerobic digester inoculum to show the effect of pre‐incubation conditions (temperature and salinity) on biomass yield, product spectrum, and community structure in fermentation at mild hydrostatic pressure (MHP; <10 MPa). Growth and fermentation activity were not limited by moderate temperature and MHP, contrasting the observations at low and higher temperatures. Community structure was strongly modified by temperature and slightly by MHP.

1. INTRODUCTION
Operation at elevated hydrostatic pressure (HP) has been evaluated to optimize fermentation processes and biopolymer production. HP conditions induce the synthesis of stress metabolites with industrial relevance, such as trehalose and glutathione (Dong & Jiang, 2016). Elevated HP also steers the fermentation product spectrum towards alternative value‐added products, for example, ethanol (Bothun et al., 2004). Concerning biopolymer production, HP increases the intracellular polymer content with adjusted density and composition (Mota et al., 2019). Lowered biomass productivity and growth (Iwahashi et al., 2005; Molina‐Höppner et al., 2003; Mota et al., 2015; Tholosan et al., 1999), as well as increased microbial maintenance requirements (Mota et al., 2018; Wemekamp‐Kamphuis et al., 2002) have been identified as drawbacks but without detailed mechanistic explanations for their occurrence. HP‐operation bottlenecks depend on the specific response of the involved microorganisms to elevated HP, that is, whether or not the biomass shows piezotolerance (Bothun et al., 2004), which constitutes a defining feature to promote the usage of this technology.
Piezotolerance refers to the ability of microorganisms to grow when exposed to elevated HP and is widely spread in subsurface ecosystems like the deep‐sea (Canganella & Wiegel, 2011; Tamburini et al., 2013). It is also encountered in shallow surface waters and coastal sediments (Jebbar et al., 2015; Marietou & Bartlett, 2014; Vossmeyer et al., 2012), as well as in specific industrial strains (Pavlovic et al., 2008; Vanlint et al., 2011). In particular, Lactobacillus and Clostridium spp. have shown piezotolerance after short‐term treatments with HP (7–50 MPa), or it was attributed to developed cross‐resistance (Mota et al., 2013).
Cross‐resistance refers to the microbial capacity to resist negative impacts of environmental stress potentially resulting from (a) pre‐incubation under other environmental stress conditions, for example, low to high temperature variation, non‐neutral pH, water activity, and salinity extremes; (b) differences in the growth stage of microbial cells and (c) starvation effects (Abe, 2007; Gao et al., 2022; Lanciotti et al., 1996; Scheyhing et al., 2004). In natural habitats, cross‐resistance develops from the exposure to local‐scale environmental gradients occurring due to tidal, seasonal, and depth variations (Johnson et al., 2009; Tholosan et al., 1999). The stress‐response associated with cross‐resistance effects comprises adaptations at the cellular level such as accumulation of compatible solutes and salts, protein synthesis, and reorganization of cell membrane lipids (Kish et al., 2012). As well, it includes the modulation of metabolic pathways and growth rates (Gao et al., 2022) and ultimately the modification of microbial community functionality and composition due to differences in stress tolerance, energy investment, and exacerbated competition between microbial species (Rillig et al., 2015).
There is increasing evidence that microbial piezotolerance is related to halotolerance and thermotolerance (Booker et al., 2019; Harrison et al., 2013). Halotolerance adaptations at the physiological level, namely membrane configuration and composition, synthesis of compatible solutes (Martin et al., 2002), and cytoplasmic accumulation of salts (Kish et al., 2012), have also been observed in piezotolerant microorganisms. Changes in the central carbon metabolism and production of extracellular polymeric substances (EPS) are also interlinked with piezotolerance (Booker et al., 2017, 2019). Regarding temperature, exposure to low temperatures (≤10°C) decreases the cell membrane fluidity and may alter its lipid composition (Macdonald, 1984), which is similar to the effects of HP exposure. Conversely, high‐temperature increases fluidity; hence, it might counteract the effects of high HP on the cell membrane (Fichtel et al., 2015; Winter & Jeworrek, 2009). Thermal stress triggers the synthesis of heat and cold shock proteins, also further upregulated in the stress response under HP (Wemekamp‐Kamphuis et al., 2002). The growth rate of piezotolerant microorganisms can be affected by high HP and low temperature due to physiological and kinetic constraints (Jebbar et al., 2015). However, previous work shows that low growth rates observed in Halomonas spp. after exposure to >35 MPa at 2°C and 4% total salts were enhanced when the total salt concentration of the medium was adjusted to 11% in a parallel experiment (Kaye & Baross, 2004). The observed phenomenon was attributed to opposing effects of osmotic stress and HP in protein production and lipid saturation that resulted in a modified membrane spatial configuration.
Significant changes in the microbial community structure were observed when mesophilic oil‐degrading marine sediments were exposed to 4°C and 22 MPa (Fasca et al., 2018) or sinking fecal pellets were incubated at 13°C and 40 MPa (Tamburini et al., 2009). Other studies have highlighted temperature as the predominant modifier of taxonomic diversity in marine sediment degrading hydrocarbons at 30 MPa and 5 or 20°C (Perez Calderon et al., 2019). Recent works also indicate that specific phyla such as Proteobacteria, Bacteroidetes, Actinobacteria, and Firmicutes became predominant at high HP (Marietou & Bartlett, 2014; Perez Calderon et al., 2019).
In this study, we investigated whether the combination of inoculum halotolerance—temperature adaptation can trigger cross‐resistance mechanisms to mild HP (MHP; <10 MPa), leading to enhanced/sustained carboxylate production under environmental stress. Fermentation experiments at MHP with two halotolerant inocula adapted to different operational temperatures were conducted to test our cross‐resistance hypothesis. In alignment with the mentioned links between temperature and HP, adjusting operational temperature might be a viable operational process strategy to improve process performance under HP (Lopes et al., 2019). Metabolic energy analysis was performed to identify energy limitations as part of the explanatory mechanism for reduced biomass/product yields and changes in product spectrum. Finally, these results are discussed concerning their influence on process efficacy and resilience.
2. MATERIALS AND METHODS
2.1. Enrichment
Two anaerobic inocula without prior exposure to MHP were used in the experiments. Marine sediment inoculum (MSI) was enriched from a manually homogenized mixture of three sediment samples obtained from a subtidal mud accumulation site located approximately 5 km offshore from Oostende (51°16.30 N, 2°54.30E) at an average water depth of 12 m (HP of 0.12 MPa; van de Velde et al., 2016). Mesophilic anaerobic digestion inoculum (ADI) was enriched from a sample of a full‐scale up‐flow anaerobic sludge blanket (UASB) reactor of 5.5 m height (HP of maximally 0.05 MPa at the bottom of the reactor), treating saline wastewater from a petrochemical industry. The physicochemical characterization of both inocula is presented in Table S1.
The medium described in Table S2 with adjusted salinity and glucose as substrate (2.45 g COD L−1) was used to enrich MSI and ADI for 27 and 20 days, respectively, with enrichment cycles lasting 5–7 days. MSI enrichment experiments were carried out at 10 and 20°C (MSI‐10 and MSI‐20). These temperatures are comparable to the seasonal environmental regime of the site of sediment collection. An additional experiment was conducted at 28°C (MSI‐28), a temperature close to the typical range for anaerobic carboxylates production (Arslan et al., 2016; Infantes et al., 2011) and in the upper range for growth of psychrotolerant marine bacteria (Groudieva et al., 2003). ADI enrichment was carried out at the operational temperature of the UASB of origin, that is, 37°C (ADI‐37). Initial MSI inoculation was done from re‐suspended sediment to final volatile solids (VS) concentration of 1.4 mg VS ml−1 in serum bottles, prepared according to Table S2. In parallel, ADI was first diluted with marine medium to the same initial VS concentration as MSI and added to prepared serum bottles. Effective volume reached 45 ml after inoculation and the liquid to gas ratio was kept at 1.7:1.0.
An in‐house developed flush system was used to exchange the headspace of the serum bottles with a mixture of N2:CO2 (90:10). On average, 20 cycles per bottle were applied to guarantee anaerobic conditions after inoculation and set an initial overpressure of 0.005 ± 0.001 MPa. Enrichment cycles were concluded when recovered COD‐glucose into carboxylates corresponded to ≥70%. Afterward, 5 ml non‐pooled transfers (that is, replicates were not combined) to fresh anaerobic saline medium were carried out. All the experimental treatments were conducted out in triplicates plus a negative control without substrate. Serum bottles were shaken at 120 rpm in orbital shakers.
2.2. MHP experiments
A non‐pooled transfer from each biological replicate and negative control of the last cycle of the MSI and ADI enrichment was performed to sterile 5 ml syringes, previously flushed with N2:CO2 (90:10; Figure 1). The same liquid to gas ratio as in the serum bottles was kept. After inoculation and medium addition, syringes were closed using two‐way valves and positioned inside six high‐pressure stainless‐steel reactors (Parr) filled with deionized water. Due to reactor availability, MHP experiments at different temperatures were carried out in a sequential incubation. The increment of hydrostatic pressure to 5 and 8 MPa, to achieve CO2 partial pressures comparable to our previous work (Ceron‐Chafla et al., 2020, 2021), was done by pumping distilled water inside the reactors using a manual hydraulic pump. One syringe from each replicate and negative control of the enrichment was incubated in parallel under atmospheric conditions (atmospheric controls; ACs) at a pressure of 0.1 MPa (Figure 1). Experiments lasted between 8 and 12 days depending on each pressure, temperature and inoculum tested. On the final day, reactors were depressurized through liquid release. Syringes were left to stabilize to atmospheric pressure (0.1 MPa) for 30 min. Afterward, total liquid content was recovered and distributed as follows: (a) carboxylates determination, (b) DNA extraction from biomass pellet to be stored at −20°C, and (c) flow cytometry measurement (FCM) from samples fixed with 1% glutaraldehyde.
Figure 1.

Experimental design applied for the inoculum enrichment at atmospheric pressure and the non‐pooled biomass transfer for the glucose conversion experiments at mild hydrostatic pressure (MHP) of 5 and 8 MPa. Experiments with marine sediment inoculum—MSI were carried out at 10, 20, and 28°C, and the experiments with anaerobic digestion inoculum—ADI at 37°C. For all the experiments, triplicate incubation syringes (biological replicates) plus a negative control without substrate were placed inside the pressure reactors. The time points where samples from sacrificial pressure reactors were recovered are represented by t1, t2, and t3
2.3. Analyses
2.3.1. Flow cytometry measurements
After pretreatment (Supporting Information Methods Section 1.2, Figure S1), cells were counted using flow cytometry. Diluted samples (×1000) were stained with SYBR Green I and incubated at 37°C for 13 min following the protocol of van Nevel et al. (2013) and immediately analyzed in an Accuri C6+ flow cytometer (BD Biosciences). The Accuri C6+ was equipped with four fluorescence detectors (530/30, 585/40, >670, and 675/25 nm), two scatter detectors, and a 20‐mW 488‐nm laser, and was operated with Milli‐Q (Merck Millipore) as sheath fluid. Statistical testing applied to FCM data is described in Supporting Information Methods Section 1.2.
2.3.2. Microbial community analysis
The DNA extraction was carried out according to the protocol of Vilchez‐Vargas et al. (2013). Agarose gel electrophoresis and PCR analysis were used to determine the quality of DNA extracts. The PCR was carried out using the bacterial primers 341F and 785Rmod following an in‐house PCR protocol (Boon et al., 2002). After quality validation, DNA extracts were sent to LGC Genomics GmbH for amplicon sequencing of the bacterial community through the 16S rRNA gene V3–V4 hypervariable region on the Illumina MiSeq platform. After processing the amplicon sequencing data (Supporting Information Methods Section 1.3.1), a table was generated with the relative abundances of the different operational taxonomic units (OTUs) and their taxonomic assignment of each sample. Next, absolute abundances were estimated based on the FCM data according to Props et al. (2017) and statistically analyzed as described in Supporting Information Methods Section 1.4.
2.3.3. Chemical analyses
The chemical oxygen demand (COD), volatile solids (VS), pH, and alkalinity were measured according to Standard Methods (American Public Health Association, 2017), whereby alkalinity measurements used an automatic titration unit (Metrohm). Electroconductivity was measured using an electroconductivity meter (C833 Consort). Organic acids (lactate, formate, acetate, propionate, and butyrate) were measured using ion chromatography (Metrohm 930 Compact IC Flex) and a Metrosep Organic acid 250/7.8 column coupled to a Metrosep Organic acids Guard/4.6 column using 0.001 M H2SO4 as eluent. The lower detection limit was 1 mg L−1 for all the acids.
2.3.4. Bioenergetics calculation
The catabolic Gibbs free energy change () is the amount of Gibbs free energy from a redox reaction between an electron donor and acceptor (Heijnen & Kleerebezem, 2010). We calculated based on the final product spectrum of each temperature‐adapted treatment at 5, 8 MPa and AC (see Supporting Information Methods Section 1.5 and Table S3). Based on each , (a) the energy requirements for maintenance (m – J d−1) to sustain the initial biomass in the inoculum and (b) the “theoretical” biomass (X) yield (Y X/S ) on the substrate were estimated.
3. RESULTS
3.1. Effects of MHP exposure on cell density of temperature adapted enrichments
As a proxy for biomass growth, cell density was monitored via FCM, simultaneously with carboxylates production. The absolute change in cell density in temperature incubations and AC (Figure 2) was calculated by subtracting endogenous decay estimated from controls without substrate. A decreasing trend in the final cell density is observed in most cases except for condition MSI‐20, where the absolute change is positive over time and higher than the absolute maximum change observed during the enrichment (Figure 2b). The most negative absolute change was assessed for MSI‐28 (Figure 2c) and in particular for ADI‐37 (Figure 2d).
Figure 2.

Absolute change in the final cell concentration in the marine sediment inoculum (MSI) at 10 (a), 20 (b), and 28°C (c) and in the anaerobic digester inoculum (ADI) at 37°C (d) along the incubation at MHP of 5 and 8 MPa. The atmospheric control (0.1 MPa) was measured only at the end of the incubation. Bars represent the average of three biological replicates in pressure treatments and six replicates in the atmospheric controls. Bars with striped pattern differentiate the final time point for each experiment. Error bars correspond to the standard deviation. Dotted red line corresponds to the maximal absolute change in cell density measured during the enrichment before MHP incubation. MHP, mild hydrostatic pressure
Differences in the absolute cell density change were evaluated by the nonparametric Kruskal–Wallis H‐test using temperature and MHP as grouping variables. In experiments with MSI at 5, 8 MPa and the AC, significant differences in cell density absolute change were found considering incubation temperature as determining parameter (p = 0.0002). Differences evaluated with MHP as determining parameter were nonsignificant (p = 0.09). Post hoc tests revealed that MSI‐20 was significantly different from MSI‐28 and MSI‐10 (p = 0.0002 and 0.005, respectively). There were no significant differences (p = 0.26) ascribed to MHP exposure for the case of ADI‐37.
3.2. Effects of MHP exposure on the final product spectrum of temperature adapted enrichments
The product spectrum (expressed in mg COD L−1) in the glucose conversion experiments at 5 and 8 MPa using temperature‐adapted halotolerant enrichments is presented in Figure 3. Measurements were performed at three time points for pressurized incubations and the endpoint for AC. Product spectrum in all incubations is consistent with glucose primary fermentation to lactate and secondary fermentation to propionate and acetate. A similar composition was observed during the enrichment at different temperatures (see Appendix A). The statistical analysis (Kruskal–Wallis) showed that there were significant differences in lactate (p = 0.001), as well as propionate and formate concentrations (p < 0.001) of MSI incubations at the three different temperatures. In addition, significant differences in acetate concentrations were found when MSI incubations were analyzed in function of temperature (p < 0.001) or applied MHP (p = 0.01).
Figure 3.
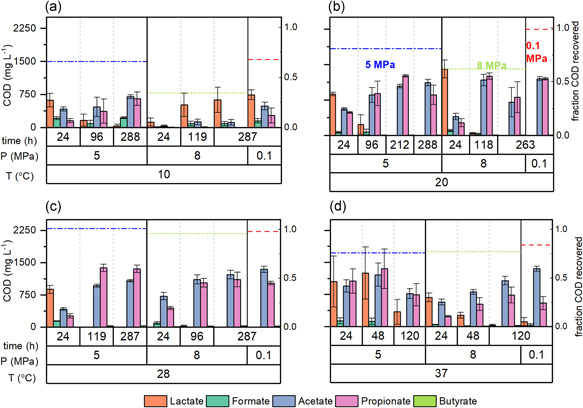
Product spectrum (in mg COD L−1) at three selected time points during anaerobic glucose conversion by temperature‐adapted halotolerant enrichments. The marine sediment inoculum (MSI) was evaluated at 10 (a), 20 (b), and 28°C (c) and the anaerobic digester inoculum (ADI) at 37°C (d). The pressure of atmospheric controls was 0.1 MPa (included in the subplots as reference) and the hydrostatic pressures were 5 and 8 MPa. Bars represent the average of three biological replicates in pressure treatments and six replicates in the atmospheric controls. Error bars correspond to the standard deviation. Dotted lines represent the average fraction of COD recovered with glucose as feed in the atmospheric controls (red) and in the experiments at 5 (blue) and 8 MPa (green). COD, chemical oxygen demand
Regarding carboxylates production for ADI‐37 incubated at different MHPs, significant differences were only found for acetate (p = 0.009) and to a lesser degree for propionate (p = 0.08). The fraction of initial COD recovered as soluble products is presented in the different subplots as dotted colored lines. For incubations, MSI‐10 and MSI‐20 at 8 MPa, a notable reduction in the percentage of COD recovered as soluble products was observed compared to the AC (Figure 3a,b). COD recovery was almost identical for all tested conditions in MSI‐28 (Figure 3c). Similarly, just a slight decrease in COD recovery was determined for ADI‐37 (Figure 3d).
3.3. Effects at the community level: Taxonomic diversity and community structure
The MSI inoculum replicates presented distinctive differences in absolute and relative abundance of the top 13 OTUs (Figures 4 and S7) despite the initial homogenization. Absolute abundances in MHP treatments were impacted by the exposure to 5 and 8 MPa. In MSI‐10, the exposure to 5 MPa resulted in a generalized, but statistically nonsignificant decrease in the average absolute abundance of genera such as Marinifiilum, Dethiosulfatibacter, and Psychromonas compared to the AC. The abundance of fermentative bacteria was negatively impacted by MHP of 8 MPa, which led to the predominance of Trichococcus. For MSI‐20, the exposure to 5 MPa caused a distinct increase in the average absolute abundance of genera Psychromonas, Marinifillum, and a decrease in Trichococcus and Dethiosulfatibacter (p = 0.05). At 8 MPa, the average absolute abundance of identified genera decreased except for Desulfomicrobium (Figure 4a). In MSI‐28, the average absolute abundance of Trichococcus (p = 0.04) increased after exposure to 5 MPa. However, the absolute abundances of sulfate‐reducing bacteria (SRB) genera, namely Dethiosulfatibacter and Desulfomicrobium (p = 0.05) decreased. The exposure to 8 MPa decreased absolute abundances of predominant fermentative genera, excluding Ilyobacter, which became the main fermenter (Figure 4a). For ADI‐37, average absolute numbers of Ercella, Proteiniphilum, Desulfomicrobium (p = 0.05), Halolactibacillus, and Dethiosulfovibrio also decreased after exposure to 5 and 8 MPa compared to AC (Figure 4b).
Figure 4.

Absolute abundances of bacterial top 13 OTUs in the different experimental treatments and calculated based on flow cytometry data. Columns represent biological replicates for the atmospheric controls (0.1 MPa) and the mild hydrostatic pressure (MHP) experiments at 5 and 8 MPa. (a) Marine sediment inoculum—MSI experiments for different temperature (10, 20, and 28°C)—MHP combinations. (b) Anaerobic digester inoculum—ADI experiments at 37°C and different MHP. OTU, operational taxonomic unit
Significant differences in MSI richness (H 0, p = 0.006) were found in function of incubation temperature rather than MHP (Figure S2). Conversely, when analyzed as a function of MHP‐exposure, H 0 in the ADI experiments was significantly different (p = 0.020). In terms of β‐diversity, we found significant differences in community structure when incubation temperature was the grouping variable (p = 0.001, Figure 5). However, when grouped by MHP, differences were nonsignificant (p = 0.84, Figure S3). Additionally, significant differences in community structure were identified as a function of formate (p = 0.0136), propionate (p = 0.0001) and butyrate (p = 0.013) concentrations (Figure S4).
Figure 5.

Nonmetric distance scaling (NMDS) analysis of the Bray–Curtis dissimilarity index of the bacterial community at OTU level for the marine sediment inoculum at 10, 20, and 28°C and the anaerobic digester inoculum at 37°C. OTU, operational taxonomic unit
3.4. Metabolic energy analysis
Figure 6a summarizes the for each incubation condition at MHP and its corresponding AC. The lowest values for were found for MSI‐10 and MSI‐20 at 8 MPa. A low indicates a low ATP yield, considering an energy requirement of +31.8 kJ mol−1 ATP based on the hydrolysis of acetyl coenzyme‐A (Thauer et al., 1977). Y X/S showed a decreasing trend with increasing MHP (Figure 6d), particularly for MSI‐10 and MSI‐20. Notably, only for MSI‐10 at 8 MPa, the calculated m was higher than the value for AC (Figure 6b).
Figure 6.

(a) Gibbs free energy available to carry out catabolism () for each temperature incubation at 0.1 MPa (atmospheric control—AC) and mild hydrostatic pressure (MHP) of 5 and 8 MPa. (b) Gibbs free energy requirements for maintenance (m) to sustain the initial biomass density used to inoculate AC and the pressurized treatments. (c) Measured biomass yield (YX/S ) based on cell numbers converted to units of C‐mol biomass. (d) Theoretical biomass yield calculated based on proposed stoichiometries for the different incubations. Each subplot has a different scale and units for visualization purposes. Data correspond to the marine sediment inoculum at 10, 20, and 28°C and the anaerobic digester inoculum at 37°C
Slight differences were observed in , m, and Y X/S for incubations MSI‐28 and ADI‐37 at 5 and 8 MPa in reference to the AC (Figure 6). However, following their dependency on temperature, calculated values for maintenance coefficients (m G ) were 6.0 and 13.4 kJ mol−1 × h−1 at 28°C and 37°C, respectively. At low (10°C) and moderate (20°C) temperatures, m G decreased to 1.0 and 2.8 kJ C‐mol−1 × h−1, respectively. Despite these differences, calculations showed that maintaining initial cell density in all treatments for the entire experiment duration would have required less than 3% of the initially available glucose biochemical energy.
Results showed differences of three orders of magnitude in the theoretical Y X/S and those estimated from the conversion of cell numbers to C‐mol biomass (Figure 6c,d). This large discrepancy is attributed to using theoretical approximations for cell volume that might not reflect HP effects on cell morphology (Molina‐Höppner et al., 2003). Thus, the theoretical and estimated Y X/S values are not directly comparable but provide insight into the effects of temperature, the composition of the product spectrum, and MHP on Y X/S.
4. DISCUSSION
4.1. Biomass yield and fermentative activity are modulated by interaction effects of incubation temperature and MHP
MSI‐20 was the only condition where growth, expressed as a positive absolute change in cell density, occurred after MHP incubation (Figure 2b). Therefore, we hypothesized that observed growth in MSI‐20 at MHP could be attributed to a cross‐resistance effect originating from adaptation to moderate temperature and salinity. This hypothesis aligns with a previously reported analogous stress response to low temperature and HP (Abe, 2007). However, this cross‐resistance effect positively impacting cell densities was not evident in conditions MSI‐10, MSI‐28, and ADI‐37 at 5 and 8 MPa.
In MSI‐10 the incubation temperature was lower than the presumed optimum for psychrotolerant growth (T opt ≈ 20°C); thus, declining growth rates (µ) were expected following the Arrhenius equation (Infantes et al., 2012). Literature has revisited the relationship between µ, maintenance (m), and YX/S , indicating that it is more complex than suggested by previous models (“Herbert model,”“Pirt model”; Wang & Post, 2012) and dependent on growth conditions (Bonk et al., 2019; Lipson, 2015). In slow‐growing microorganisms, for example, psychrotolerant/psychrophilic microorganisms, a “growth rate‐yield tradeoff” has been observed at T < T opt , leading to high YX/S at low temperatures (Nedwell & Rutter, 1994). Holding onto this premise, an increase in cell density in MSI‐10 could have been anticipated. However, the lowest values were calculated for MSI‐10 (Figure 6a); thus, limited growth might have resulted from energetic constraints. Furthermore, if protective mechanisms linked to low temperature and piezotolerance were upregulated, such as synthesis of cold shock proteins and EPS, it would have come at a high energy cost, further limiting growth: 0.39 mmol ATP/g protein and 12.8 mmol ATP/g polysaccharides (Kim & Gadd, 2008). Thus, considering that some energy is also dissipated during anabolism, the generated catabolic energy may only have sufficed to produce cryoprotective structures such as EPS, but not for the synthesis of complex cellular components enabling growth (Nichols et al., 2005).
The hypothesis concerning EPS production aligns well with some investigations in marine microorganisms (Decho & Gutierrez, 2017). EPS synthesis is considered a survival strategy to counteract low temperatures and/or saline conditions (Aslam et al., 2012). Previous work indicates that at high glucose concentrations (Decho, 1990), increased salinity, low/moderate temperatures (15–25°C), and fluctuating nutrient availability, bacterial EPS production is favored (Degeest et al., 2001). Also, enhanced EPS production has been observed at temperatures lower than T opt in both psychrophilic (Nichols et al., 2005) and mesophilic organisms (Degeest et al., 2001). EPS formation cannot be discarded in all the other treatments, since visual inspection of the bottom of the syringes after reactor depressurization indicated biomass agglomeration. However, it is recommended to follow up our current work with future HP fermentation experiments, using larger sample volumes that enable an in‐depth quantification of EPS concentrations.
In terms of fermentative activity, in MSI‐10 and MSI‐20 incubations at 5 and 8 MPa, differences were observed regarding the COD recovered as measured soluble products compared to their respective AC (Figure 3a,b). These differences might be partially explained due to the effect of incubation temperature on process kinetics exacerbated as MHP increased. According to the Arrhenius equation, decreasing temperatures exponentially decrease biochemical reaction rates and may compromise enzymatically driven processes (Arnosti et al., 1998). Similar to temperature, also pressure has an exponential relation to the reaction rate constant, in co‐dependence of the reaction activation volume according to Equation (1) (Morild, 1981; Somero, 1990):
| (1) |
where k p (h−1) is the rate constant at pressure P (atm), k 0 is the rate constant at atmospheric pressure (h−1), ΔV ‡ is the activation volume, R the universal gas constant (L atm K−1 mol−1) and T the reaction temperature (K). Equation (1) follows that HP decreases the rate of reactions with positive ΔV ‡ . Glycolytic enzymes such as glyceraldehyde‐phosphate‐dehydrogenase (ΔV ‡ = +60 cm3 mol−1), pyruvate kinase (ΔV ‡ = +11 to +26 cm3 mol−1) have positive ΔV ‡ ; thus, their activity could be compromised by MHP regardless of low‐temperature adaptations (Morild, 1981). Consequently, they could become a bottleneck for glucose conversion at low temperatures and MHP, explaining the dissimilarities in the recovered COD between MHP treatments and AC in MSI‐10 and MSI‐20.
We were not able to collect sufficient data points for adequate calculation of production and consumption rates due to sampling constraints associated with the reactor configuration. However, evaluation of the individual metabolite concentration per cell over time pinpointed a “slowing down” of intermediates consumption. As an example, reduced lactate consumption in MSI‐10 at 8 MPa is noticeable and could have hindered subsequent fermentation (Figures S5 and S6). This observation is in alignment with previous enzymatic studies, which suggested that HP and low temperatures significantly decrease lactate dehydrogenase activity, an enzyme that reversibly catalyzes pyruvate to lactate conversion (Gillen, 1971).
Another limitation on substrate and intermediates conversion at low temperatures, for example, in MSI‐10, might have come from energy requirements in transmembrane transport. Rodríguez et al. (2006) proposed that more energy is required for the active transport of organic acids when extracellular concentrations increase, as foreseen in batch fermentations (Table 1). Additionally, since increased pressure enhances acid dissociation due to negative ΔV ‡ (Low & Somero, 1975), more energy would have been required for proton (H+) transport to keep homeostasis, further limiting energy allocation to anabolic processes.
Table 1.
Gibbs energy change for active transport of acid molecule (HA) through the cell membrane ΔGTr‐HA (kJ mmol−1) for different organic acids measured in the experiments of glucose conversion at mild hydrostatic pressure (MHP) using marine sediment inoculum—MSI and anaerobic digester inoculum—ADI at different temperatures
| Extracellular concentration | Intracellular concentration | MSI | MSI | MSI | ADI | |
|---|---|---|---|---|---|---|
| ΔGTr‐HA | ΔGTr‐HA | ΔGTr‐HA | ΔGTr‐HA | |||
| (mM) | (mM)a | (10°C) | (20°C) | (28°C) | (37°C) | |
| Lactic acid | 15.11 | 10 | 2.74 | 2.78 | 2.86 | 2.95 |
| 5 | 19.34 | 19.68 | 20.22 | 20.82 | ||
| Propionic acid | 18.9 | 10 | 15.38 | 15.64 | 16.07 | 16.55 |
| 5 | 31.98 | 32.54 | 33.42 | 34.42 | ||
| Acetic acid | 24.20 | 10 | 9.57 | 9.74 | 10.00 | 10.30 |
| 5 | 26.18 | 26.63 | 27.36 | 28.17 |
Intracellular concentration taken from Rodriguez et al. (2006).
The combined effect of moderately high temperature and MHP was detrimental for biomass yield in MSI‐28 and ADI‐37 incubations at 5 and 8 MPa (Figure 2b,c); however, it did not severely compromise carboxylates production (Figure 3c,d). Hence, our experimental observations suggest that limited growth with conserved metabolic activity resulted from an increased susceptibility to MHP due to prolonged exposure to moderately high temperatures. Studies with pure cultures of psychrotolerant Listeria monocytogenes and Yarrowia lipolytica incubated at high HP have shown that increasing incubation temperature coincided with intensified pressure susceptibility and ultimately reflected on higher microbial inactivation (death) rates (Lanciotti et al., 1996). This observation aligns well with the cell density results of incubations MSI‐28 (compared to MSI‐20 and MSI‐10) and ADI‐37 (Figure 2). The same study reported that inactivation of mesophilic Escherichia coli was comparable to psychrotolerant strains at 20°C but showed an increasing trend in the interval 20–35°C (Lanciotti et al., 1996). Consequently, literature suggests a relatively strong effect of MHP on Y X/S for mesophilic microorganisms, which may explain the observed high negative absolute change in cell density in ADI‐37 (Figure 2d).
It is known that microbial µ exponentially increases with temperature within a certain span. For psychrotolerant microorganisms, temperatures higher than T opt (T > 20°C, e.g., MSI‐28) are associated with a decreasing µ (Bakermans & Nealson, 2004; Kaye & Baross, 2004; Knoblauch & Jorgensen, 1999). Consequently, an increased YX/S could have been foreseen on the grounds of the “growth rate‐yield trade‐off” theory. However, prolonged exposure to moderate high temperatures resulted in increased substrate turnover to fulfill the higher maintenance (m) requirements due to (a) the Arrhenius dependency of m on temperature (Figure 6b) and (b) the proposed increased susceptibility to MHP after prolonged exposure to moderate high temperature. Hence, despite more favorable bioenergetics in MSI‐28 than in MSI‐20 and MSI‐10 (Figure 6a) energy was deviated from growth (YX/S ) to satisfy increasing m requirements. Moreover, low‐temperature stress response shares commonalities with the one triggered by MHP attributable to similar effects at the cell membrane level (Allen & Bartlett, 2000). Hence, it is reasonable to suspect that relevant enzymatic machinery already in place was upregulated in microorganisms from MSI‐10 and MSI‐20 incubations, implying that a smaller fraction of the energy budget was allocated for m (Figure 6). Pressure and temperature fluctuation responses are not entirely equal; thus, particular mechanisms triggered by MHP could have still occurred. For example, the synthesis of heat shock proteins (Welch et al., 1993) is likely to occur in psychrotolerant organisms at temperatures from 28°C onwards (Potier et al., 1990), implying energy deviation for other anabolic processes than growth in MSI‐28.
The exclusively temperature‐dependent m calculations presented here should be used as a first approximation since only the major and not all carbon and energy‐deriving processes have been considered. If proton leakage, cell death, intracellular carbon storage, membrane fluidity conservation, and pathway shifts (van Bodegom, 2007) would have been included, higher overall maintenance (m tot ) and a further constrained µ and Y X/S would have been obtained. These requirements constitute part of the initial halotolerance and a postulated temperature‐MHP adaptation. Hence, carbon and energy derivation towards m likely have occurred under all experimental conditions (Schimel et al., 2007) but may have been overlooked due to process complexity and methodological simplifications.
A higher µ was expected for ADI‐37 since it was incubated at T ≈ T opt (Figure 7) and due to differences in the order of magnitude of mesophilic and psychrotolerant µ in microorganisms grown under laboratory conditions (Nedwell & Rutter, 1994). A higher decay rate (k d ) and m requirements (Figure 6b) were anticipated for this treatment due to temperature dependence of k d , m, and µ (Biselli et al., 2020); thus, a lower µ net ascribed to temperature effects in ADI‐37 when compared to MSI‐28 could be reasonably expected. Moreover, in ADI‐37 additional stress response mechanisms needed to be fully upregulated to counteract MHP effects on susceptible biomass resulting from prolonged exposure to moderate high temperature. Moreover, prolonged incubation could have triggered the utilization of biomass to satisfy increasing m tot requirements when carbon was less available (Bradley et al., 2018). If unsaturated lipids would have been produced to safeguard membrane fluidity, it would have come at the price of diverting energy from growth to maintenance (Casadei et al., 2002; Kaneko et al., 2000). Lipid synthesis is a less energy‐intensive process (0.015 mmol ATP/g lipids; Kim & Gadd, 2008) in comparison to the synthesis of proteins and carbohydrates, which could also have been part of the general microbial stress response in ADI‐37 (Gross & Watson, 1996).
Figure 7.

Graphical summary of foreseen effects of incubation temperature (T) (left) and T + mild hydrostatic pressure (MHP; right) on kinetic and bioenergetic parameters. Columns correspond to the experimental treatments with marine sediment inoculum (MSI) at 10, 20, and 28°C and anaerobic digester inoculum (ADI) at 37°C. Colored blue bars represent a qualitative indication of the expected range for the parameter (one = low, two = moderate, three = high, and four = highest). Upward green arrows in MHP column indicate an incremental effect whereas downward red arrows indicate a detrimental effect
4.2. Product spectrum is defined by inoculum enrichment strategy and minorly impacted by the interaction temperature—MHP
Our results showed that the enrichment strategy predominantly impacted the product spectrum (see Appendix A), while both incubation temperature and MHP played a minor and indirect role (Figure 3). High substrate concentration, high biomass load, complex medium, and sequencing batch incubations can be considered the process parameters with the most substantial influence on the product spectrum. Rombouts et al. (2020) and Hoelzle et al. (2021) have proposed that complex medium and high glucose concentrations favor lactate production over butyrate, propionate, and acetate, which are typically observed in mixed culture conversions at low substrate concentration and even occur at elevated operational pressure (Ceron‐Chafla et al., 2021).
We did not observe significant differences in the product spectrum of the different incubations due to MHP. However, other studies highlighted deviations in product formation after the exposure to higher HP (30–35 MPa) and associated this phenomenon with changes in the central carbon metabolism (Booker et al., 2019; Scoma et al., 2019). Their results showed that propionate and butyrate were formed to dispose of reducing equivalents under limited hydrogen production. A declined hydrogen production is expected when the lactate pathway is favored (Ghimire et al., 2015) and could also result from the hindered hydrogenase activity by elevated HP (Booker et al., 2019). Consequently, the favored disposal of reducing equivalents in the form of propionate/butyrate and formate production to act as “aqueous electron carrier” are reasonable outputs of MHP incubations (Figure 3). However, formate production is not an exclusive outcome of combined incubation temperature and MHP. Previous studies reported formate as an alternative electron sink to H2 in, for example, glucose conversion carried out at pH > 6 (Temudo et al., 2007) and during shock loads of substrate at circumneutral pH (Voolapalli & Stuckey, 1999). Moreover, formate production may also be a characteristic fermentation pathway in organisms from temperate marine sediments, as postulated by previous work (Kondo et al., 1993).
4.3. Understanding the interaction effects of MHP and temperature on microbial community composition
The taxonomic diversity diverged from the original inoculum in response to substrate concentration and incubation temperature after the enrichment (see Appendix A). Due to insufficient homogenization in the MSI samples, replicate 3 was different in composition and abundance from the other inoculum replicates. These differences in composition remained observable in the experiments at mild selective pressure, that is, low temperature and MHP (Figure 4). Under an apparently stronger “selective pressure”, that is, moderate‐high temperature and MHP, the inoculum variability effect was no longer observed and changes in absolute abundance due to temperature and MHP became more evident and reproducible as in other studies dealing with environmental disturbance effects in community structure (Pagaling et al., 2014). After MHP‐exposure, specific genera lost their predominance or became absent, but fermentative activity was conserved. At 10 and 20°C in MSI, a minor decrease in absolute abundance was identified in groups with recognized fermenting metabolism such as Marinifilum, Psychromonas, Halilactibacillus, and Trichococcus after MHP was applied. This was also the case for some of the identified SRB, Dethiosulfatibacter, and Desulfomicrobium (Figure 4a). Piezotolerant/piezophilic strains were previously identified in coastal marine sediments with no apparent exposure to significant pressure gradients (Marietou & Bartlett, 2014; Tamburini et al., 2009). Most of those microorganisms additionally have a psychrotolerant nature with T opt between 10 and 20°C (Fu et al., 2018; Xu et al., 2003), supporting the previously described link between low/moderate temperature adaptation and pressure resistance.
In MSI‐28, general multitrophic microorganisms belonging to the genera Trichococcus and Ilyobacter, as well as Proteiniphilum and Ercella, in ADI‐37 showed some degree of tolerance to MHP (Figure 4a,b). So far, proven piezotolerance in these genera has not been reported. Nonetheless, piezotolerant/piezophilic strains in marine sediments (Bhattarai et al., 2018; Fasca et al., 2018; Wannicke et al., 2015) and high‐pressure anaerobic digesters (Lindeboom et al., 2016) belong to the phyla Firmicutes and Bacteroidetes, which comprise the genera mentioned above. Innate adaptations in these species might allow a certain degree of piezotolerance. Microorganisms from the genus Trichococcus (Pikuta & Hoover, 2014) and Ilyobacter (Schink, 1984) produce mucopolysaccharides for adaptation to low temperatures, which might confer adaptability to more extreme conditions such as MHP (Yin et al., 2019). An increase in the proportion of unsaturated fatty acids (UFAs) is a mechanism to safeguard membrane fluidity via homeo‐viscous adaptation (Wang et al., 2014). Members of the genus Ercella (van Gelder et al., 2014) and Proteiniphillum (Wang et al., 2014) are characterized by a high content of UFAs and ante‐iso‐branched fatty acids in their cell membranes. This innate feature could counteract the reduced fluidity caused by increased MHP.
4.4. Extrapolation of cross‐resistance effects toward the process level
The use of stress conditions such as MHP to promote new products synthesis and bioprocess selectivity, while limiting biomass growth, has gained interest in latest years (Mota et al., 2017). However, microbial resilience is still a bottleneck in operation under environmental stressors such as MHP (Lopes et al., 2019). Inoculum history, thermal adaptation, and halotolerance could promote cross‐resistance effects, which can be further exploited depending on desired process outcome. In yield‐dependent processes, for example, biopolymer production, whose properties seem interestingly modified by MHP, operation at mild temperature could be advisable to obtain a balanced biomass‐product output. If the microbial community is already temperature‐adapted, the predominance of product‐accumulating organisms should not be compromised by MHP exposure. On the other hand, if excess biomass growth needs to be controlled, operation at MHP in combination with increased temperature, high organic loading rate, and rich medium could promote uncoupling of catabolism and anabolism. As indicated by our experimental results, this could occur without the abundance of key genera being jeopardized.
5. CONCLUSIONS
Effects of an environmental stressor (MHP) on metabolic activity and community structure could be modulated by cross‐resistance effects associated with incubation temperature and halotolerance. At mild temperatures, an apparent cross‐resistance effect balanced growth and fermentation under MHP. At low temperatures and MHP, compromised growth and carboxylates production resulted from bioenergetic and kinetic constraints. High temperature positively impacted carboxylates production and combined with MHP, further limited biomass yield due to high maintenance requirements and decay. Fermentative activity was conserved despite absolute abundances of predominant groups in MSI, being compromised by temperature and, to a minor extent, MHP. Community composition in mesophilic ADI also underwent slight modifications after MHP exposure. We anticipate that fermentation resilience to environmental stress relies on understanding how cross‐resistance effects at the physiological level could influence microbial community composition and, ultimately, process yield.
Nomenclature
- AC
atmospheric control
- ADI
anaerobic digestion inoculum
- C‐mol
Carbon mole (mol)
- FCM
flow cytometry measurement
- HP
hydrostatic pressure
- m
Gibbs energy change for maintenance (J d−1)
- m G
Gibbs energy coefficient for maintenance purposes (kJ C‐mol−1 X h−1)
- MHP
mild hydrostatic pressure
- MSI
marine sediment inoculum
- m tot
Overall maintenance (C‐mol substrate C‐mol−1 X h−1)
- qs
overall substrate conversion flux (mol substrate mol‐X−1 h−1)
- X
biomass (mol)
- YX/S
Biomass yield on substrate (C‐mol X mol glucose−1)
- µ
growth rate (h−1)
- ΔGTr‐HA
Gibbs energy change for active transport acid molecule (HA) through the membrane (kJ mmol−1)
- µmax
maximal growth rate (h−1)
- µnet
net growth rate (h−1)
Gibbs energy change for catabolism corrected for biological pH=7 (J/reaction)
- ΔV
change in reaction volume (cm3 mol−1)
CONFLICTS OF INTEREST
The authors declare no conflicts of interest.
Supporting information
Supporting information.
ACKNOWLEDGMENTS
This study was funded by the European Union's Horizon 2020 Research and Innovation Program under the Marie Skłodowska‐Curie grant agreement No 676070 (SuPER‐W). This communication reflects only the author's view, and the Research Executive Agency of the EU is not responsible for any use that may be made of the information it contains. Cristina García‐Timermans has been funded by the Flemish Fund for Scientific Research (FWO G020119N) and by the Geconcerteerde Onderzoeksacties (GOA) research grant from Ghent University (BOF15/GOA/006). Jo De Vrieze has been supported as postdoctoral fellow by the Research Foundation Flanders (FWO‐Vlaanderen). The authors would also like to acknowledge Tim Lacoere for his expert help with DNA extraction and Illumina sequencing data analysis. Tyler Arbour is acknowledged for his assistance with the experimental design. Xiaoting Zhang and Josefine van Landuyt are recognized for their technical assistance.
1. Enrichment of halotolerant mixed microbial culture: Product spectrum and microbial community dynamics
After the final cycle of enrichment, inocula MSI and ADI showed differences in the final product spectrum, cell numbers, and community diversity. Regarding the measured metabolites as soluble COD, MSI‐28 showed a balanced production: 54% of the soluble COD corresponded to acetate and 45% to propionate. In MSI‐20, there was a marginal increase in propionate production compared to acetate: 53% versus 47%. For MSI‐10, the product spectrum was composed of acetate, formate, and lactate: 45%, 29%, and 14%, respectively. ADI‐37 showed a product spectrum also dominated by acetate and propionate: 56% versus 41%, respectively. The achieved cell density at the end of the enrichment is presented in Table A1.
Table A1.
Cell density measured by flow cytometry at the end of the first cycle of the enrichment for the marine sediment inoculum (MSI) at incubation temperatures of 10, 20, and 28°C and the anaerobic digester inoculum (ADI) at 37°C
| Temperature (°C) | Cell density (cells ml−1) |
|---|---|
| 10 | 3.6 ± 0.4 × 10⁶ |
| 20 | 1.7 ± 0.2 × 10⁶ |
| 28 | 9.9 ± 1.0 × 10⁶ |
| 37 | 2.3 ± 0.3 × 10⁷ |
Changes were observed in predominant OTUs identified in MSI and ADI samples after the enrichment at atmospheric conditions. Psychromonas, a fermentative genus distinctively identified in MSI original inoculum, lost predominance against Marinifilum, Psychromonas, Halolactibacillus, Trichococcus at 10, 20, and 28°C and Ilyobacter, only at 28°C in most of the biological replicates while in few of them remained dominant at low and moderate temperature. Two genera associated with SRB, namely Dethiosulfatibacter and Desulfomicrobium were further identified. In the case of ADI, the transition occurred from genera such as JS1 and RBG‐13‐54‐9 to fermentative halotolerant, neutrophilic bacteria as Proteiniphillium, Ercella, Halolactibacillus, and the SRB Dethiosulfovibrio and Desulfomicrobium.
Ceron‐Chafla, P. , García‐Timermans, C. , de Vrieze, J. , Ganigué, R. , Boon, N. , Rabaey, K. , van Lier, J. B. , & Lindeboom, R. E. F. (2022). Pre‐incubation conditions determine the fermentation pattern and microbial community structure in fermenters at mild hydrostatic pressure. Biotechnology and Bioengineering, 119, 1792–1807. 10.1002/bit.28085
DATA AVAILABILITY STATEMENT
The raw fastq files used to create the OTU table, which served as a basis for the microbial community analysis, have been deposited in the National Center for Biotechnology Information (NCBI) database (Accession number PRJNA682158).
REFERENCES
- Abe, F. (2007). Exploration of the effects of high hydrostatic pressure on microbial growth, physiology and survival: Perspectives from piezophysiology. Bioscience, Biotechnology, and Biochemistry, 71(10), 2347–2357. 10.1271/bbb.70015 [DOI] [PubMed] [Google Scholar]
- Allen, E. E. , & Bartlett, D. H. (2000). FabF is required for piezoregulation of cis‐vaccenic acid levels and piezophilic growth of the deep‐sea bacterium Photobacterium profundum strain SS9. Journal of Bacteriology, 182(5), 1264–1271. 10.1128/JB.182.5.1264-1271.2000 [DOI] [PMC free article] [PubMed] [Google Scholar]
- American Public Health Association . (2017). Standard methods for the examination of water and wastewater (23rd ed.). [Google Scholar]
- Arnosti, C. , Jørgensen, B. , Sagemann, J. , & Thamdrup, B. (1998). Temperature dependence of microbial degradation of organic matter in marine sediments: Polysaccharide hydrolysis, oxygen consumption, and sulfate reduction. Marine Ecology Progress Series, 165, 59–70. 10.3354/meps165059 [DOI] [Google Scholar]
- Arslan, D. , Steinbusch, K. J. J. , Diels, L. , Hamelers, H. V. M. , Strik, D. P. B. T. B. , Buisman, C. J. N. , & De Wever, H. (2016). Selective short‐chain carboxylates production: A review of control mechanisms to direct mixed culture fermentations. Critical Reviews in Environmental Science and Technology, 46(6), 592–634. 10.1080/10643389.2016.1145959 [DOI] [Google Scholar]
- Aslam, S. N. , Cresswell‐Maynard, T. , Thomas, D. N. , & Underwood, G. J. C. (2012). Production and characterization of the intra‐ and extracellular carbohydrates and polymeric substances (Eps) of three sea‐ice diatom species, and evidence for a cryoprotective role for Eps. Journal of Phycology, 48(6), 1494–1509. 10.1111/jpy.12004 [DOI] [PubMed] [Google Scholar]
- Bakermans, C. , & Nealson, K. H. (2004). Relationship of critical temperature to macromolecular synthesis and growth yield in Psychrobacter cryopegella . Journal of Bacteriology, 186(8), 2340–2345. 10.1128/JB.186.8.2340-2345.2004 [DOI] [PMC free article] [PubMed] [Google Scholar]
- Bhattarai, S. , Zhang, Y. , & Lens, P. N. L. (2018). Effect of pressure and temperature on anaerobic methanotrophic activities of a highly enriched ANME‐2a community. Environmental Science and Pollution Research, 25(30), 30031–30043. 10.1007/s11356-018-2573-2 [DOI] [PubMed] [Google Scholar]
- Biselli, E. , Schink, S. J. , & Gerland, U. (2020). Slower growth of Escherichia coli leads to longer survival in carbon starvation due to a decrease in the maintenance rate. Molecular Systems Biology, 16(6), 1–13. 10.15252/msb.20209478 [DOI] [PMC free article] [PubMed] [Google Scholar]
- Bonk, F. , Popp, D. , Weinrich, S. , Sträuber, H. , Becker, D. , Kleinsteuber, S. , Harms, H. , & Centler, F. (2019). Determination of microbial maintenance in acetogenesis and methanogenesis by experimental and modeling techniques. Frontiers in Microbiology, 10, 1–13. 10.3389/fmicb.2019.00166 [DOI] [PMC free article] [PubMed] [Google Scholar]
- Booker, A. E. , Hoyt, D. W. , Meulia, T. , Eder, E. , Nicora, C. D. , Purvine, S. O. , Daly, R. A. , Moore, J. D. , Wunch, K. , Pfiffner, S. M. , Lipton, M. S. , Mouser, P. J. , Wrighton, K. C. , & Wilkins, M. J. (2019). Deep‐subsurface pressure stimulates metabolic plasticity in shale‐colonizing Halanaerobium spp. Applied and Environmental Microbiology, 85, 18–19. 10.1128/AEM.00018-19 [DOI] [PMC free article] [PubMed] [Google Scholar]
- Booker, A. E. , Borton, M. A. , Daly, R. A. , Welch, S. A. , Nicora, C. D. , Hoyt, D. W. , Wilson, T. , Purvine, S. O. , Wolfe, R. A. , Sharma, S. , Mouser, P. J. , Cole, D. R. , Lipton, M. S. , Wrighton, K. C. , & Wilkins, M. J. (2017). Sulfide generation by dominant Halanaerobium microorganisms in hydraulically fractured shales. mSphere, 2(4), 1–13. 10.1128/mspheredirect.00257-17 [DOI] [PMC free article] [PubMed] [Google Scholar]
- Boon, N. , De Windt, W. , Verstraete, W. , & Top, E. M. (2002). Evaluation of nested PCR‐DGGE (denaturing gradient gel electrophoresis) with group‐specific 16S rRNA primers for the analysis of bacterial communities from different wastewater treatment plants. FEMS Microbiology Ecology, 39(2), 101–112. 10.1016/S0168-6496(01)00198-2 [DOI] [PubMed] [Google Scholar]
- Bothun, G. D. D. , Knutson, B. L. L. , Berberich, J. A. A. , Strobel, H. J. J. , & Nokes, S. E. E. (2004). Metabolic selectivity and growth of Clostridium thermocellum in continuous culture under elevated hydrostatic pressure. Applied Microbiology and Biotechnology, 65(2), 149–157. 10.1007/s00253-004-1554-1 [DOI] [PubMed] [Google Scholar]
- Bradley, J. A. , Amend, J. P. , & LaRowe, D. E. (2018). Bioenergetic controls on microbial ecophysiology in marine sediments. Frontiers in Microbiology, 9, 1–8. 10.3389/fmicb.2018.00180 [DOI] [PMC free article] [PubMed] [Google Scholar]
- Canganella, F. , & Wiegel, J. (2011). Extremophiles: From abyssal to terrestrial ecosystems and possibly beyond. Naturwissenschaften, 98(4), 253–279. 10.1007/s00114-011-0775-2 [DOI] [PubMed] [Google Scholar]
- Casadei, M. A. , Mañas, P. , Niven, G. , Needs, E. , & Mackey, B. M . (2002). Role of Membrane Fluidity in Pressure Resistance of Escherichia coli NCTC 8164. Applied and Environmental Microbiology,68(12), 5965–5972. 10.1128/aem.68.12.5965-5972.2002 [DOI] [PMC free article] [PubMed] [Google Scholar]
- Ceron‐Chafla, P. , Kleerebezem, R. , Rabaey, K. , van Lier, J. B. , & Lindeboom, R. E. F. (2020). Direct and indirect effects of increased CO2 partial pressure on the bioenergetics of syntrophic propionate and butyrate conversion. Environmental Science & Technology, 54(19), 12583–12592. 10.1021/acs.est.0c02022 [DOI] [PMC free article] [PubMed] [Google Scholar]
- Ceron‐Chafla, P. , Chang, Y. , Rabaey, K. , van Lier, J. B. , & Lindeboom, R. E. F. (2021). Directional selection of microbial community reduces propionate accumulation in glycerol and glucose anaerobic bioconversion under elevated pCO2. Frontiers in Microbiology, 12, 1583. 10.3389/fmicb.2021.675763 [DOI] [PMC free article] [PubMed] [Google Scholar]
- Decho, A. W. (1990). Microbial exopolymer secretions in ocean environments: Their role(s) in food webs and marine processes. Oceanography and Marine Biology, 28, 73–153. [Google Scholar]
- Decho, A. W. , & Gutierrez, T. (2017). Microbial extracellular polymeric substances (EPSs) in ocean systems. Frontiers in Microbiology, 8(May), 1–28. 10.3389/fmicb.2017.00922 [DOI] [PMC free article] [PubMed] [Google Scholar]
- Degeest, B. , Janssens, B. , & De Vuyst, L. (2001). Exopolysaccharide (EPS) biosynthesis by Lactobacillus sakei 0‐1: Production kinetics, enzyme activities and EPS yields. Journal of Applied Microbiology, 91(3), 470–477. 10.1046/j.1365-2672.2001.01404.x [DOI] [PubMed] [Google Scholar]
- Dong, Y. , & Jiang, H. (2016). Microbial production of metabolites and associated enzymatic reactions under high pressure. World Journal of Microbiology and Biotechnology, 32(11):178. 10.1007/s11274-016-2136-y [DOI] [PubMed] [Google Scholar]
- Fasca, H. , de Castilho, L. V. A. , de Castilho, J. F. M. , Pasqualino, I. P. , Alvarez, V. M. , de Azevedo Jurelevicius, D. , & Seldin, L. (2018). Response of marine bacteria to oil contamination and to high pressure and low temperature deep sea conditions. MicrobiologyOpen, 7(2), 1–10. 10.1002/mbo3.550 [DOI] [PMC free article] [PubMed] [Google Scholar]
- Fichtel, K. , Logemann, J. , Fichtel, J. , Rullkötter, J. , Cypionka, H. , & Engelen, B. (2015). Temperature and pressure adaptation of a sulfate reducer from the deep subsurface. Frontiers in Microbiology, 6(Oct):1078. 10.3389/fmicb.2015.01078 [DOI] [PMC free article] [PubMed] [Google Scholar]
- Fu, T. , Jia, C. , Fu, L. , Zhou, S. , Yao, P. , Du, R. , Sun, H. , Yang, Z. , Shi, X. , & Zhang, X. H. (2018). Marinifilum breve sp. nov., a marine bacterium isolated from the Yongle Blue Hole in the south China sea and emended description of the genus Marinifilum . International Journal of Systematic and Evolutionary Microbiology, 68(11), 3540–3545. 10.1099/ijsem.0.003027 [DOI] [PubMed] [Google Scholar]
- Gao, X. , Kong, J. , Zhu, H. , Mao, B. , Cui, S. , & Zhao, J. (2022). Lactobacillus, Bifidobacterium and Lactococcus response to environmental stress: Mechanisms and application of cross‐protection to improve resistance against freeze‐drying. Journal of Applied Microbiology, 132(2), 802–821. 10.1111/jam.15251 [DOI] [PubMed] [Google Scholar]
- Ghimire, A. , Frunzo, L. , Pirozzi, F. , Trably, E. , Escudie, R. , Lens, P. N. L. , & Esposito, G. (2015). A review on dark fermentative biohydrogen production from organic biomass: Process parameters and use of by‐products. Applied Energy, 144, 73–95. 10.1016/j.apenergy.2015.01.045 [DOI] [Google Scholar]
- Gillen, R. G. (1971). The effect of pressure on muscle lactate dehydrogenase activity of some deep‐sea and shallow‐water fishes. Marine Biology, 8(1), 7–11. 10.1007/BF00349340 [DOI] [Google Scholar]
- Gross, C. , & Watson, K. (1996). Heat Shock Protein Synthesis and Trehalose Accumulation Are Not Required for Induced Thermotolerance in Depressed Saccharomyces cerevisiae.Biochemical and Biophysical Research Communications, 220(3), 766–772. 10.1006/bbrc.1996.0478 [DOI] [PubMed] [Google Scholar]
- Groudieva, T. , Grote, R. , & Antranikian, G. (2003). Psychromonas arctica sp. nov., a novel psychrotolerant, biofilm‐forming bacterium isolated from Spitzbergen. International Journal of Systematic and Evolutionary Microbiology, 53(2), 539–545. 10.1099/ijs.0.02182-0 [DOI] [PubMed] [Google Scholar]
- Harrison, J. P. , Gheeraert, N. , Tsigelnitskiy, D. , & Cockell, C. S. (2013). The limits for life under multiple extremes. Trends in Microbiology, 21(4), 204–212. 10.1016/j.tim.2013.01.006 [DOI] [PubMed] [Google Scholar]
- Heijnen, J. J. , & Kleerebezem, R. R. (2010). Bioenergetics of microbial growth, Encyclopedia of industrial biotechnology (pp. 1–66). John Wiley & Sons, Inc. 10.1002/9780470054581.eib084 [DOI] [Google Scholar]
- Hoelzle, R. D. , Puyol, D. , Virdis, B. , & Batstone, D. (2021). Substrate availability drives mixed culture fermentation of glucose to lactate at steady state. Biotechnology and Bioengineering, 118(4), 1636–1648. 10.1002/bit.27678 [DOI] [PubMed] [Google Scholar]
- Infantes, D. , González del Campo, A. , Villaseñor, J. , & Fernández, F. J. (2011). Influence of pH, temperature and volatile fatty acids on hydrogen production by acidogenic fermentation. International Journal of Hydrogen Energy, 36(24), 15595–15601. 10.1016/J.IJHYDENE.2011.09.061 [DOI] [Google Scholar]
- Infantes, D. , González del Campo, A. , Villaseñor, J. , & Fernández, F. J . (2012). Kinetic model and study of the influence of pH, temperature and undissociated acids on acidogenic fermentation. Biochemical Engineering Journal, 66, 66–72. 10.1016/j.bej.2012.04.017 [DOI] [Google Scholar]
- Iwahashi, H. , Odani, M. , Ishidou, E. , & Kitagawa, E. (2005). Adaptation of Saccharomyces cerevisiae to high hydrostatic pressure causing growth inhibition. FEBS Letters, 579(13), 2847–2852. 10.1016/j.febslet.2005.03.100 [DOI] [PubMed] [Google Scholar]
- Jebbar, M. , Franzetti, B. , Girard, E. , & Oger, P. (2015). Microbial diversity and adaptation to high hydrostatic pressure in deep‐sea hydrothermal vents prokaryotes. Extremophiles, 19(4), 721–740. 10.1007/s00792-015-0760-3 [DOI] [PubMed] [Google Scholar]
- Johnson, K. , Kleerebezem, R. , & van Loosdrecht, M. C. M. (2009). Model‐based data evaluation of polyhydroxybutyrate producing mixed microbial cultures in aerobic sequencing batch and fed‐batch reactors. Biotechnology and Bioengineering, 104(1), 50–67. 10.1002/bit.22380 [DOI] [PubMed] [Google Scholar]
- Kaneko, H. , Takami, H. , Inoue, A. , & Horikoshi, K. (2000). Effects of hydrostatic pressure and temperature on growth amf lipid composition of the inner membrane of barotoleran Pseudomonassp. BT1 Isolated from the Deep‐sea. Bioscience, Biotechnology, and Biochemistry, 64(1), 72–79. 10.1271/bbb.64.72 [DOI] [PubMed] [Google Scholar]
- Kaye, J. Z. , & Baross, J. A. (2004). Synchronous effects of temperature, hydrostatic pressure, and salinity on growth, phospholipid profiles, and protein patterns of four Halomonas species isolated from deep‐sea hydrothermal‐vent and sea‐surface environments. Applied and Environmental Microbiology, 70(10), 6220–6229. 10.1128/AEM.70.10.6220 [DOI] [PMC free article] [PubMed] [Google Scholar]
- Kim, B. H. , & Gadd, G. M. (2008). Bacterial physiology and metabolism (2nd ed.). Cambridge University Press. [Google Scholar]
- Kish, A. , Griffin, P. L. , Rogers, K. L. , Fogel, M. L. , Hemley, R. J. , & Steele, A. (2012). High‐pressure tolerance in Halobacterium salinarum NRC‐1 and other non‐piezophilic prokaryotes. Extremophiles, 16(2), 355–361. 10.1007/s00792-011-0418-8 [DOI] [PubMed] [Google Scholar]
- Knoblauch, C. , & Jorgensen, B. B. (1999). Effect of temperature on sulphate reduction, growth rate and growth yield in five psychrophilic sulphate‐reducing bacteria from Arctic sediments. Environmental Microbiology, 1(5), 457–467. 10.1046/j.1462-2920.1999.00061.x [DOI] [PubMed] [Google Scholar]
- Kondo, R. , Nishijima, T. , & Hata, Y. (1993). Effect of temperature on the production of low molecular fatty acids within an anoxic marine sediment slurry. Nippon Suisan Gakkaishi, 59(7), 1189–1194. 10.2331/suisan.59.1189 [DOI] [Google Scholar]
- Lanciotti, R. , Gardini, F. , Sinigaglia, M. , & Guerzoni, M. E. (1996). Effects of growth conditions on the resistance of some pathogenic and spoilage species to high pressure homogenization. Letters in Applied Microbiology, 22(2), 165–168. 10.1111/j.1472-765X.1996.tb01134.x [DOI] [PubMed] [Google Scholar]
- Lindeboom, R. E. F. , Shin, S. G. , Weijma, J. , van Lier, J. B. , & Plugge, C. M. (2016). Piezo‐tolerant natural gas‐producing microbes under accumulating pCO2. Biotechnology for Biofuels, 9(236), 98–127. 10.1186/s13068-016-0634-7 [DOI] [PMC free article] [PubMed] [Google Scholar]
- Lipson, D. A. (2015). The complex relationship between microbial growth rate and yield and its implications for ecosystem processes. Frontiers in Microbiology, 6(June), 1–5. 10.3389/fmicb.2015.00615 [DOI] [PMC free article] [PubMed] [Google Scholar]
- Lopes, R. P. , Mota, M. J. , Sousa, S. , Gomes, A. M. , Delgadillo, I. , & Saraiva, J. A. (2019). Combined effect of pressure and temperature for yogurt production. Food Research International, 122(April), 222–229. 10.1016/j.foodres.2019.04.010 [DOI] [PubMed] [Google Scholar]
- Low, P. S. , & Somero, G. N. (1975). Activation volumes in enzymic catalysis: Their sources and modification by low molecular weight solutes. Proceedings of the National Academy of Sciences of the United States of America, 72(8), 3014–3018. 10.1073/pnas.72.8.3014 [DOI] [PMC free article] [PubMed] [Google Scholar]
- Macdonald, A. G . (1984). The effects of pressure on the molecular structure and physiological functions of cell membranes. (1984). Philosophical Transactions of the Royal Society of London. B, Biological Sciences, 304(1118), 47–68. 10.1098/rstb.1984.0008 [DOI] [PubMed] [Google Scholar]
- Marietou, A. , & Bartlett, D. H. (2014). Effects of high hydrostatic pressure on coastal bacterial community abundance and diversity. Applied and Environmental Microbiology, 80(19), 5992–6003. 10.1128/AEM.02109-14 [DOI] [PMC free article] [PubMed] [Google Scholar]
- Martin, D. D. , Bartlett, D. H. , & Roberts, M. F. (2002). Solute accumulation in the deep‐sea bacterium Photobacterium profundum . Extremophiles, 6(6), 507–514. 10.1007/s00792-002-0288-1 [DOI] [PubMed] [Google Scholar]
- Molina‐Höppner, A. , Sato, T. , Kato, C. , Gänzle, M. G. , & Vogel, R. F. (2003). Effects of pressure on cell morphology and cell division of lactic acid bacteria. Extremophiles, 7(6), 511–516. 10.1007/s00792-003-0349-0 [DOI] [PubMed] [Google Scholar]
- Morild, E. (1981). The theory of pressure effects on enzymes. Advances in Protein Chemistry, 34(C), 93–166. 10.1016/S0065-3233(08)60519-7 [DOI] [PubMed] [Google Scholar]
- Mota, M. J. , Lopes, R. P. , Delgadillo, I. , & Saraiva, J. A. (2013). Microorganisms under high pressure – Adaptation, growth and biotechnological potential. Biotechnology Advances, 31(8), 1426–1434. 10.1016/j.biotechadv.2013.06.007 [DOI] [PubMed] [Google Scholar]
- Mota, M. J. , Lopes, R. P. , Delgadillo, I. , & Saraiva, J. A. (2015). Probiotic yogurt production under high pressure and the possible use of pressure as an on/off switch to stop/start fermentation. Process Biochemistry, 50(6), 906–911. 10.1016/j.procbio.2015.03.016 [DOI] [Google Scholar]
- Mota, M. J. , Lopes, R. P. , Simões, M. M. Q. , Delgadillo, I. , & Saraiva, J. A. (2019). Effect of high pressure on Paracoccus denitrificans growth and polyhydroxyalkanoates production from glycerol. Applied Biochemistry and Biotechnology, 188(3), 810–823. 10.1007/s12010-018-02949-0 [DOI] [PubMed] [Google Scholar]
- Mota, M. J. , Lopes, R. P. , Koubaa, M. , Roohinejad, S. , Barba, F. J. , Delgadillo, I. , & Saraiva, J. A. (2017). Fermentation at non‐conventional conditions in food‐ and bio‐sciences by application of advanced processing technologies. Critical Reviews in Biotechnology, 38(1), 122–140. 10.1080/07388551.2017.1312272 [DOI] [PubMed] [Google Scholar]
- Mota, M. J. , Lopes, R. P. , Sousa, S. , Gomes, A. M. , Lorenzo, J. M. , Barba, F. J. , Delgadillo, I. , & Saraiva, J. A. (2018). Utilization of glycerol during consecutive cycles of Lactobacillus reuteri fermentation under pressure: The impact on cell growth and fermentation profile. Process Biochemistry, 75, 39–48. 10.1016/j.procbio.2018.08.034 [DOI] [Google Scholar]
- Nedwell, D. B. , & Rutter, M. (1994). Influence of temperature on growth rate and competition between two psychrotolerant Antarctic bacteria: Low temperature diminishes affinity for substrate uptake. Applied and Environmental Microbiology, 60(6), 1984–1992. 10.1128/aem.60.6.1984-1992.1994 [DOI] [PMC free article] [PubMed] [Google Scholar]
- Nichols, C. M. , Bowman, J. P. , & Guezennec, J. (2005). Effects of incubation temperature on growth and production of exopolysaccharides by an Antarctic sea ice bacterium grown in batch culture. Applied and Environmental Microbiology, 71(7), 3519–3523. 10.1128/AEM.71.7.3519-3523.2005 [DOI] [PMC free article] [PubMed] [Google Scholar]
- Pagaling, E. , Strathdee, F. , Spears, B. M. , Cates, M. E. , Allen, R. J. , & Free, A. (2014). Community history affects the predictability of microbial ecosystem development. ISME Journal, 8(1), 19–30. 10.1038/ismej.2013.150 [DOI] [PMC free article] [PubMed] [Google Scholar]
- Pavlovic, M. , Hörmann, S. , Vogel, R. F. , & Ehrmann, M. A. (2008). Characterisation of a piezotolerant mutant of Lactobacillus sanfranciscensis . Zeitschrift Fur Naturforschung ‐ Section B Journal of Chemical Sciences, 63(6), 791–797. 10.1515/znb-2008-0630 [DOI] [Google Scholar]
- Perez Calderon, L. J. , Gontikaki, E. , Potts, L. D. , Shaw, S. , Gallego, A. , Anderson, J. A. , & Witte, U. (2019). Pressure and temperature effects on deep‐sea hydrocarbon‐degrading microbial communities in subarctic sediments. MicrobiologyOpen, 8(6):e00768. 10.1002/mbo3.768 [DOI] [PMC free article] [PubMed] [Google Scholar]
- Pikuta, E. V. , & Hoover, R. B. (2014). The genus Trichococcus . In Holzapfel W. H., & Wood B. J. B. (Eds.), Lactic acid bacteria: Biodiversity and taxonomy (pp. 135–145). John Wiley & Sons, Ltd. 10.1002/9781118655252.ch12 [DOI] [Google Scholar]
- Potier, P. , Drevet, P. , Gounot, A. M. , & Hipkiss, A. R. (1990). Temperature‐dependent changes in proteolytic activities and protein composition in the psychotrophic bacterium Arthrobacter globiformis S155. Journal of General Microbiology, 136(2), 283–291. 10.1099/00221287-136-2-283 [DOI] [Google Scholar]
- Props, R. , Kerckhof, F. M. , Rubbens, P. , Vrieze, J. D. , Sanabria, E. H. , Waegeman, W. , Monsieurs, P. , Hammes, F. , & Boon, N. (2017). Absolute quantification of microbial taxon abundances. ISME Journal, 11(2), 584–587. 10.1038/ismej.2016.117 [DOI] [PMC free article] [PubMed] [Google Scholar]
- Rillig, M. C. , Rolff, J. , Tietjen, B. , Wehner, J. , & Andrade‐Linares, D. R. (2015). Community priming‐effects of sequential stressors on microbial assemblages. FEMS Microbiology Ecology, 91(5), 1–7. 10.1093/femsec/fiv040 [DOI] [PubMed] [Google Scholar]
- Rodríguez, J. , Kleerebezem, R. , Lema, J. M. , & van Loosdrecht, M. C. M. M. (2006). Modeling product formation in anaerobic mixed culture fermentations. Biotechnology and Bioengineering, 93(3), 592–606. 10.1002/bit.20765 [DOI] [PubMed] [Google Scholar]
- Rombouts, J. L. , Kranendonk, E. M. M. , Regueira, A. , Weissbrodt, D. G. , Kleerebezem, R. , & van Loosdrecht, M. C. M. (2020). Selecting for lactic acid producing and utilising bacteria in anaerobic enrichment cultures. Biotechnology and Bioengineering, 117(5), 1281–1293. 10.1002/bit.27301 [DOI] [PMC free article] [PubMed] [Google Scholar]
- Scheyhing, C. H. , Hörmann, S. , Ehrmann, M. A. , & Vogel, R. F. (2004). Barotolerance is inducible by preincubation under hydrostatic pressure cold‐, osmotic‐ and acid‐stress conditions in Lactobacillus sanfranciscensis DSM 20451T. Letters in Applied Microbiology, 39(3), 284–289. 10.1111/j.1472-765X.2004.01578.x [DOI] [PubMed] [Google Scholar]
- Schimel, J. , Balser, T. C. , & Wallenstein, M . (2007). Microbial stress‐response physiology and its implications for ecosystem function. Ecology, 88(6), 1386–1394. 10.1890/06-0219 [DOI] [PubMed] [Google Scholar]
- Schink, B. (1984). Fermentation of tartrate enantiomers by anaerobic bacteria, and description of two new species of strict anaerobes, Ruminococcus pasteurii and Ilyobacter tartaricus . Archives of Microbiology, 139(4), 409–414. 10.1007/BF00408388 [DOI] [Google Scholar]
- Scoma, A. , Garrido‐Amador, P. , Nielsen, S. D. , Røy, H. , & Kjeldsen, K. U. (2019). The polyextremophilic bacterium Clostridium paradoxum attains piezophilic traits by modulating its energy metabolism and cell membrane composition. Applied and Environmental Microbiology, 85(15), 10.1128/AEM.00802-19 [DOI] [PMC free article] [PubMed] [Google Scholar]
- Somero, G. N. (1990). Life at low volume change: Hydrostatic pressure as a selective factor in the aquatic environment. Integrative and Comparative Biology, 30(1), 123–135. 10.1093/icb/30.1.123 [DOI] [Google Scholar]
- Tamburini, C. , Boutrif, M. , Garel, M. , Colwell, R. R. , & Deming, J. W. (2013). Prokaryotic responses to hydrostatic pressure in the ocean – A review. Environmental Microbiology, 15(5), 1262–1274. 10.1111/1462-2920.12084 [DOI] [PubMed] [Google Scholar]
- Tamburini, C. , Goutx, M. , Guigue, C. , Garel, M. , Lefèvre, D. , Charrière, B. , Sempéré, R. , Pepa, S. , Peterson, M. L. , Wakeham, S. , & Lee, C. (2009). Effects of hydrostatic pressure on microbial alteration of sinking fecal pellets. Deep‐Sea Research Part II: Topical Studies in Oceanography, 56(18), 1533–1546. 10.1016/j.dsr2.2008.12.035 [DOI] [Google Scholar]
- Temudo, M. F. , Kleerebezem, R. , & van Loosdrecht, M. (2007). Influence of the pH on (open) mixed culture fermentation of glucose: A chemostat study. Biotechnology and Bioengineering, 98(1), 69–79. 10.1002/bit.21412 [DOI] [PubMed] [Google Scholar]
- Thauer, R. K. , Jungermann, K. , & Decker, K. (1977). Energy conservation in chemotrophic anaerobic bacteria. Bacteriological Reviews, 41(1), 100–180. 10.1128/br.41.1.100-180.1977 [DOI] [PMC free article] [PubMed] [Google Scholar]
- Tholosan, O. , Garcin, J. , & Bianchi, A. (1999). Effects of hydrostatic pressure on microbial activity through a 2000 m deep water column in the NW Mediterranean Sea. Marine Ecology Progress Series, 183, 49–57. [Google Scholar]
- van Bodegom, P. (2007). Microbial maintenance: A critical review on its quantification. Microbial Ecology, 53, 513–523. 10.1007/s00248-006-9049-5 [DOI] [PMC free article] [PubMed] [Google Scholar]
- van de Velde, S. , Lesven, L. , Burdorf, L. D. W. , Hidalgo‐Martinez, S. , Geelhoed, J. S. , Van Rijswijk, P. , Gao, Y. , & Meysman, F. J. R. (2016). The impact of electrogenic sulfur oxidation on the biogeochemistry of coastal sediments: A field study. Geochimica et Cosmochimica Acta, 194, 211–232. 10.1016/j.gca.2016.08.038 [DOI] [Google Scholar]
- van Gelder, A. H. , Sousa, D. Z. , Rijpstra, W. I. C. , Sinninghe Damsté, J. S. , Stams, A. J. M. , & Sánchez‐Andrea, I. (2014). Ercella succinigenes gen. nov., sp. nov., an anaerobic succinate‐producing bacterium. International Journal of Systematic and Evolutionary Microbiology, 64(7), 2449–2454. 10.1099/ijs.0.058966-0 [DOI] [PubMed] [Google Scholar]
- van Nevel, S. , Koetzsch, S. , Weilenmann, H. U. , Boon, N. , & Hammes, F. (2013). Routine bacterial analysis with automated flow cytometry. Journal of Microbiological Methods, 94(2), 73–76. 10.1016/j.mimet.2013.05.007 [DOI] [PubMed] [Google Scholar]
- Vanlint, D. , Mitchell, R. , Bailey, E. , Meersman, F. , McMillan, P. F. , Michiels, C. W. , & Aertsen, A. (2011). Rapid acquisition of gigapascal‐high‐pressure resistance by Escherichia coli . mBio, 2(1), 1–3. 10.1128/mBio.00130-10 [DOI] [PMC free article] [PubMed] [Google Scholar]
- Vilchez‐Vargas, R. , Geffers, R. , Suárez‐Diez, M. , Conte, I. , Waliczek, A. , Kaser, V. S. , Kralova, M. , Junca, H. , & Pieper, D. H. (2013). Analysis of the microbial gene landscape and transcriptome for aromatic pollutants and alkane degradation using a novel internally calibrated microarray system. Environmental Microbiology, 15(4), 1016–1039. 10.1111/j.1462-2920.2012.02752.x [DOI] [PubMed] [Google Scholar]
- Voolapalli, R. K. , & Stuckey, D. C. (1999). Relative importance of trophic group concentrations during anaerobic degradation of volatile fatty acids. Applied and Environmental Microbiology, 65(11), 5009–5016. 10.1128/aem.65.11.5009-5016.1999 [DOI] [PMC free article] [PubMed] [Google Scholar]
- Vossmeyer, A. , Deusner, C. , Kato, C. , Inagaki, F. , & Ferdelman, T. G. (2012). Substrate‐specific pressure‐dependence of microbial sulfate reduction in deep‐sea cold seep sediments of the Japan Trench. Frontiers in Microbiology, 3, 1–12. 10.3389/fmicb.2012.00253 [DOI] [PMC free article] [PubMed] [Google Scholar]
- Wang, G. , & Post, W. M. (2012). A theoretical reassessment of microbial maintenance and implications for microbial ecology modeling. FEMS Microbiology Ecology, 81(3), 610–617. 10.1111/j.1574-6941.2012.01389.x [DOI] [PubMed] [Google Scholar]
- Wang, J. , Li, J. , Dasgupta, S. , Zhang, L. , Golovko, M. Y. , Golovko, S. A. , & Fang, J. (2014). Alterations in membrane phospholipid fatty acids of gram‐positive piezotolerant bacterium Sporosarcina sp. DSK25 in response to growth pressure. Lipids, 49(4), 347–356. 10.1007/s11745-014-3878-7 [DOI] [PubMed] [Google Scholar]
- Wannicke, N. , Frindte, K. , Gust, G. , Liskow, I. , Wacker, A. , Meyer, A. , & Grossart, H. ‐P. (2015). Measuring bacterial activity and community composition at high hydrostatic pressure using a novel experimental approach: A pilot study. FEMS Microbiology Ecology, 91(5), 10.1093/femsec/fiv036 [DOI] [PubMed] [Google Scholar]
- Welch, T. J. , Farewell, A. , Neidhardt, F. C. , & Bartlett, D. H . (1993). Stress response of Escherichia coli to elevated hydrostatic pressure. Journal of Bacteriology, 175(22), 7170–7177. 10.1128/jb.175.22.7170-7177.1993 [DOI] [PMC free article] [PubMed] [Google Scholar]
- Wemekamp‐Kamphuis, H. H. , Karatzas, A. K. , Wouters, J. A. , & Abee, T. (2002). Enhanced levels of cold shock proteins in Listeria monocytogenes LO28 upon exposure to low temperature and high hydrostatic pressure. Applied and Environmental Microbiology, 68(2), 456–463. 10.1128/AEM.68.2.456 [DOI] [PMC free article] [PubMed] [Google Scholar]
- Winter, R. , & Jeworrek, C. (2009). Effect of pressure on membranes. Soft Matter, 5(17), 3157–3173. 10.1039/b901690b [DOI] [Google Scholar]
- Xu, Y. , Nogi, Y. , Kato, C. , Liang, Z. , Rüger, H.‐J. J. , De Kegel, D. , Glansdorff, N. , Nogi, Y. , Kato, C. , Liang, Z. , Rüger, H.‐J. J. , De Kegel, D. , & Glansdorff, N. (2003). Psychromonas profunda sp. nov., a psychropiezophilic bacterium from deep Atlantic sediments. International Journal of Systematic and Evolutionary Microbiology, 53(2), 527–532. 10.1099/ijs.0.02227-0 [DOI] [PubMed] [Google Scholar]
- Yin, W. , Wang, Y. , Liu, L. , & He, J. (2019). Biofilms: The microbial “protective clothing” in extreme environments. International Journal of Molecular Sciences, 20(14), 10.3390/ijms20143423 [DOI] [PMC free article] [PubMed] [Google Scholar]
Associated Data
This section collects any data citations, data availability statements, or supplementary materials included in this article.
Supplementary Materials
Supporting information.
Data Availability Statement
The raw fastq files used to create the OTU table, which served as a basis for the microbial community analysis, have been deposited in the National Center for Biotechnology Information (NCBI) database (Accession number PRJNA682158).