

Abstract
Objective:
Reduction-based cannabis use endpoints are needed to better evaluate treatments for cannabis use disorder (CUD). This exploratory, secondary analysis aimed to characterize cannabis frequency and quantity reduction patterns and corresponding changes in psychosocial functioning during treatment.
Method:
We analyzed 16 weeks (4 pre-randomization, 12 post-randomization) of data (n=302) from both arms of a randomized clinical trial assessing pharmacotherapy for CUD. Cannabis consumption pattern classes were extracted with latent profile modeling using self-reported (1) past-week days used (i.e., frequency) and (2) past-week average grams used per using day (i.e., quantity). Changes in mean Marijuana Problem Scale (MPS) and Hospital Anxiety and Depression Scale (HADS) scores were examined among classes. Urine cannabinoid levels were examined in relation to self-reported consumption as a validity check.
Results:
Two-, three-, four-, and five-class solutions each provided potentially useful conceptualizations of associations between frequency and quantity. Regardless of solution, reductions in MPS scores varied in magnitude across classes and closely tracked class-specific reductions in consumption (e.g., larger MPS reduction corresponded to larger frequency/quantity reductions). Changes in HADS scores were less pronounced and less consistent with consumption patterns. Urine cannabinoid levels closely matched class-specific self-reported consumption frequency.
Conclusions:
Findings illustrate that frequency and quantity can be used in tandem within mixture model frameworks to summarize heterogeneous cannabis use reduction patterns that may correspond to improved psychosocial functioning. Going forward, similar analytic strategies applied to alternative metrics of cannabis consumption may facilitate construction of useful reduction-based clinical endpoints.
Keywords: cannabis, clinical trial, measurement, endpoint, reduction
Introduction
There remains no consensus regarding which clinical trial endpoint is most appropriate for evaluating interventions for substance use disorders (SUD) (Carroll et al., 2014; Donovan et al., 2012; Fitzmaurice, Lipsitz, & Weiss, 2020; Kiluk et al., 2016; Kiluk, Fitzmaurice, Strain, & Weiss, 2019b). Abstinence continues to be the predominant endpoint because it is objectively verifiable via urine toxicology and is a strong predictor of psychosocial improvement. However, because abstinence is binary, it may dampen signals of potentially meaningful behavioral changes that occur during treatment and may therefore be partly responsible for the current lack of SUD behavioral and pharmacological therapies (Fitzmaurice, Lipsitz, & Weiss, 2017; Fitzmaurice et al., 2020; Kiluk, Fitzmaurice, Strain, & Weiss, 2019a; Kiluk et al., 2019b; Lee et al., 2019).
Clinical trials for cannabis use disorder (CUD) are no exception. To date, the majority of CUD clinical trials have used abstinence as the primary endpoint, and perhaps as a consequence, few behavioral or pharmacological CUD treatments have shown a positive and sustained response (Budney, Sofis, & Borodovsky, 2019; Gates, Sabioni, Copeland, Le Foll, & Gowing, 2016; Lee et al., 2019; Loflin et al., 2020; Sherman & McRae-Clark, 2016). In this context, the field has begun to turn its attention towards developing cannabis reduction-based (rather than abstinence-based) endpoints that may be more sensitive to signals of treatment efficacy (Levin et al., 2021; Loflin et al., 2020).
The alcohol literature has demonstrated that it is possible to derive useful reduction-based endpoints. For example, reductions in heavy drinking days (HDD) and discrete alcohol use risk levels predict improved treatment outcomes independent of abstinence, and the Food and Drug Administration (FDA) now accepts the proportion of participants with no HDD as a valid outcome measure indicative of treatment efficacy (D. Falk et al., 2010; D. E. Falk et al., 2019; Food and Drug Administration, 2015; Hasin et al., 2017; Witkiewitz, Hallgren, et al., 2017; Witkiewitz et al., 2020). The critical point to note is that a measure such as HDD is, fundamentally, an aggregate representation of a specific combination of consumption frequency and quantity metrics. Thus, it stands to reason that in order to derive clinically meaningful measures of reduced consumption, we first need to understand the metrics that will be used to define consumption, namely, the frequency and quantity of consumption, as well as how such metrics are related to psychosocial functioning outcomes. The National Institute on Drug Abuse (NIDA) Cannabis Policy Research Workgroup has recently emphasized this sentiment by noting that standardized measures of cannabis consumption should account for the multidimensionality of cannabis use not only in terms of frequency but also the quantities used within a specified interval of time (Cannabis Policy Research Workgroup, 2018).
One of the primary difficulties in characterizing frequencies and quantities of cannabis consumption is that these metrics can be defined, measured, and analyzed in various ways. For example, frequency might be defined as the number of days used per week or the number of times used per day. Consumption quantity is more complex as multiple factors can affect the number of milligrams of THC an individual consumes in a given sitting. For example, cannabis is prepared in different forms (e.g., plant material vs. concentrates) that exhibit a wide range of concentrations and ratios of multiple cannabinoids (e.g., %THC, %CBD, etc.). Furthermore, these different forms can be consumed using various methods of administration (e.g., smoking, vaping, eating) that engender different pharmacodynamic and pharmacokinetic effects (Borodovsky & Budney, 2018; Borodovsky, Sofis, Grucza, & Budney, 2021; Budney & Borodovsky, 2017; Cannabis Policy Research Workgroup, 2018; Freeman & Lorenzetti, 2020; Spindle, Bonn-Miller, & Vandrey, 2019; Spindle et al., 2018; Tomko et al., 2019; Vandrey et al., 2017). Given this diversity, identifying optimal frequency and quantity metrics for constructing reduction-based endpoints will require systematic evaluation of various combinations of candidate measurement and analytic approaches.
Regardless of how one operationally defines frequency and quantity, a useful first step is to examine the interrelationship between these two metrics. Specifically, if a particular combination of frequency and quantity metrics is to be evaluated as the potential basis for a reduction-based endpoint, it will be important to first understand the extent to which these measures change independently of one another and how their interrelationship corresponds to changes in psychosocial functioning. Some analyses have begun to investigate these dynamics by characterizing changes in consumption in clinical samples. For example, Hser and colleagues analyzed self-reported days of cannabis use in the past week (i.e., frequency of use) during treatment and classified participants as either “decreasers” (i.e., any negative slope) or “increasers” (i.e., any positive slope). Those in the decreaser group demonstrated greater improvement in anxiety, depression, and sleep relative to those in the increaser group (Hser et al., 2017). Note that the dataset used in Hser et al. 2017 is the same dataset used in the present study. Levin et al. analyzed self-report data from three CUD treatment trials and classified participants into three frequency groups: 5–7 days/week (heavy use), 2–4 days/week (moderate use), and 0–1 days/week (light use). Results suggested that the odds of transitioning into a lower frequency group increased over time, but the effects of treatment on the speed and magnitude of this transition were mixed (Levin et al., 2021). Sherman et al. also classified participants into three frequency-based risk groups: 6–7 days/week, 3–5 days/week, and 1–2 days/week, as well as into three quantity-based risk groups: ≤1 gram/week, >1 to ≤3 grams/week, and >3 grams/week. Results suggested that transitioning into a lower frequency and quantity risk group corresponded to improvements in depression, anxiety, and cannabis-related problems (Sherman et al., 2021). Note that the dataset used in Sherman et al. 2021 is also the same dataset used in the present study. Finally, Babbin and colleagues used cluster analyses to examine changes in the percent of days used (i.e., frequency of use) in a sample of adolescents receiving treatment for CUD. The study identified different cannabis use trajectory profiles such as “High Use Responders” and “Relapsers” (Babbin, Stanger, Scherer, & Budney, 2016).
Some of the limitations of these initial studies include: (1) examining frequency but not quantity, (2) using categorical rather than continuous/discrete measures, (3) assuming linear change over time, and (4) little or no examination of the correspondence between changes in consumption and changes in psychosocial functioning. By utilizing specific combinations of data and methods, we can start to address some of these limitations and potentially develop a richer characterization of the relation between changes in consumption and functioning.
The goal of this exploratory secondary analysis of CUD clinical trial data was to take a preliminary series of steps towards developing cannabis reduction-based endpoints by (1) illustrating one empirical approach to integrating self-reported cannabis use frequency and quantity that may help us better understand patterns of cannabis use reduction during treatment, and (2) determining whether patterns of cannabis use reduction correspond to similar patterns of improvement in psychosocial functioning during treatment. Note that these analyses are constrained by the specific strengths and weaknesses of the measurement choices made in the original randomized controlled trial. For example, quantities of cannabis plant material consumption were measured using an innovative weighing procedure. However, the potency of cannabis was not assessed, and a typical (i.e., time-invariant) quantity was assumed for each method of administration (e.g., bowl, joint) for each participant (details provided in Methods). Despite such limitations, we believe that the analytic approach described here provides an important illustration of a way in which valuable information can be extracted from such measures.
Method
Study design
This study analyzed data from the Achieving Cannabis Cessation – Evaluating N-acetylcysteine Treatment (ACCENT) trial conducted by the National Drug Abuse Treatment Clinical Trials Network (Clinicaltrials.gov: NCT01675661). ACCENT was a 12-week, randomized, placebo-controlled, multi-site trial of N-acetylcysteine (NAC) combined with abstinence-based contingency management and medication management CUD treatment. A complete description of the protocol and methods is provided elsewhere (Gray et al., 2017; McClure et al., 2014). In brief, 302 adults with CUD were randomly assigned to receive 1200 mg of NAC or placebo twice daily for 12 weeks. Twice weekly abstinence-based contingency management and weekly medication management were provided to all participants. The primary outcome was biologically confirmed cannabis abstinence, and secondary outcomes examined were cannabis use days per week and grams per using day. Results from the primary trial suggested no difference in cannabis abstinence between the treatment and control groups (Gray et al., 2017). All procedures were approved by the Institutional Review Board at each study site. Note that this is also the same dataset used in prior secondary analyses (Hser et al., 2017; Sherman et al., 2021).
Data collection, structure, and operational definitions
Data from the 28-day period prior to randomization (i.e., 4-week pre-randomization period) through the end of the 84-day (12-week) post-randomization treatment period were analyzed. The “pre-randomization” period refers to Week −4 (days −28 to −22), Week −3 (days −21 to −15), Week −2 (days −14 to −8), and Week −1 (days −7 to −1). The term “baseline” refers to Week −1. Day 0 refers to the day of randomization and is the first day of what we define here as the “post-randomization period”. For this 12-week post-randomization period, Week 1 refers to days 0 to 6, and Week 12 refers to days 77 to 83. Of note, in the original study, data on cannabis consumption frequency and quantity were collected for all weeks (−4 to 12). However, psychosocial outcomes data were collected only at weeks −1, 4, 8, and 12.
Assessments
Self-reported cannabis use.
Daily self-reported cannabis use (frequency) for all 16 weeks was assessed using the Timeline Follow-Back (TLFB) procedure (Sobell, Sobell, Leo, & Cancilla, 1988). Specifically, at the Day 0 visit, cannabis use during each day of the 4-week pre-randomization period was assessed. Once the participant was randomized, the TLFB was used weekly during the 12-week post-randomization phase to assess cannabis use on each day of the prior week (McClure et al., 2014).
The following procedures were used to measure quantity (i.e., grams) of cannabis use. At the Day 0 visit, participants reported the number of times they used a particular method of administration (e.g., joints, bowls) on each day of the 4-week pre-randomization period. Then, the participant weighed out a surrogate substance to estimate the number of grams they typically used for each of the methods of administration that they had used during the 4-week pre-randomization period. The number of grams of cannabis consumed per using day was calculated by multiplying the number of grams typically consumed when using each method of administration by the number of times the participant reported using each method on that day (Tomko et al., 2018). For example, if a participant typically uses 0.5 grams per bowl and 0.25 grams per joint, and the participant consumed two bowls and one joint yesterday, then the participant consumed a total of 1.25 grams yesterday. At each weekly TLFB assessment during the 12-week post-randomization period, the participant reported the number of times they used a particular method of administration on each day of the past week. The typical number of grams used for a particular method of administration (recorded at the Day 0 visit) was used to calculate the total grams consumed each week. If a participant reported using a new method of administration that had not been recorded at the Day 0 visit, the surrogate substance weighting procedure was repeated. This estimation procedure has shown incremental validity in predicting cannabis use outcomes in clinical trials (Tomko et al., 2018).
Psychosocial outcomes.
Measures of anxiety, depression, and cannabis-related problems were completed at four time points: baseline (Week −1), Week 4, Week 8, and Week 12. Anxious and depressive symptoms were assessed using the Hospital Anxiety and Depression Scale (HADS-A and HADS-D)(Zigmond & Snaith, 1983), and cannabis-related psychosocial problems (e.g., relationships, finances/employment, legal, physical and mental health) were assessed using the Marijuana Problems Scale (MPS)(Stephens, Roffman, & Curtin, 2000). Possible HADS scores ranged from 0–21, and possible MPS scores ranged from 0–19.
Urine cannabinoid testing (UCT).
Urine samples were collected at baseline (Week −1) and each week of the 12-week post-randomization phase, resulting in 13 urine samples per participant. Samples were analyzed using an enzyme immunoassay to test for levels of delta9-tetrahydrocannabinol metabolites (11-nor-9-carboxy-delta-9-THC) and creatinine (McClure et al., 2014; Tomko et al., 2018). The results provide a numerically continuous measure of each participant’s cannabis exposure during the study.
Analysis procedures
Analyses were performed in three parts: (1) Examine response profiles (i.e., latent classes) of repeated measures of cannabis consumption in multiple latent profile analysis solutions; (2) examine the relationship between time (i.e., study week) and psychosocial outcomes among each class; (3) as a validity check, examine the relationship between change over time in urine cannabinoid levels and change over time in self-reported frequency and quantity among classes. Because this study was exploratory and conducted without an explicit a priori theory, we present results for all latent class solutions examined. Analyses were performed using Stata 17, MPlus 8.6, and Python 3.8.8.
Analysis sample.
The analysis sample contained the n=302 individuals randomized in the study, including n=77 who did not complete the full 12-week post-randomization period. Approximately 72% of the sample were male, 42% were non-white, and the mean (SD) age was 30.3 (9.0) years.
Weekly cannabis consumption variables.
For each participant, within each seven-day period of the study, we calculated: (1) the total number of days of cannabis use (i.e., “frequency”), and (2) average number of grams of cannabis used per using day (i.e., “quantity”). We then mean-centered and standardized the frequency data using all of the frequency measurements taken during the full 16-week study period among all participants. The same transformation was applied to the quantity data. The data were re-shaped into wide format resulting in 32 unique data points (i.e., 32 variables) for each participant: 16 weeks of frequency data and 16 weeks of quantity data. These 32 standardized indicator variables were used to build the latent class measurement model.
Latent profile analysis to understand patterns of cannabis use over time.
We used Latent Profile Analysis (LPA) to identify classes of cannabis use response profiles. Our analysis was loosely based on prior studies which used Repeated Measure Latent Class Analysis (LCA) to identify alcohol use response profiles (Witkiewitz, Roos, et al., 2017) and K-means Clustering to model cannabis use trajectories among adolescents (Babbin et al., 2016). Like LCA, LPA models a nominally ordered mixture of latent classes (Lanza, Bray, & Collins, 2012; Masyn, 2013). However, LCA uses categorical indicator variables in the measurement model to produce class-specific probabilities of endorsing the indicator variables, whereas LPA uses continuous indicator variables in the measurement model to produce class-specific means, variances, and covariances of the indicator variables (Masyn, 2013).
Using the 32 indicator variables, the LPA model generated the following for each latent class for each of the 16 weeks: (1) mean z-score of the total number of days used in the past week, and (2) mean z-score of the mean number of grams used per using day in the past week. Because this was an exploratory analysis with a relatively small sample size and a large number of estimated parameters, we used a class-invariant diagonal variance-covariance matrix. We examined two-, three-, four- and five-class solutions using a robust Maximum Likelihood estimator. To mitigate the risk of local solutions, we specified 1000 random sets of parameter start values with 100 final stage optimizations. To compare model fit across different solutions, we calculated several Information Criteria (IC), Entropy, and conducted Lo-Mendell-Rubin (LMR) tests (Akaike, 1987; Lo, Mendell, & Rubin, 2001; Schwarz, 1978)(Table 1). For the purpose of visualization, we used posterior probabilities to assign participants to classes and plot class-specific mean frequency and quantity over time (Figure 1).
Table 1.
Model fit and classification diagnostics of exploratory latent profile analysis with class-invariant diagonal variance-covariance matrix.
| Number of classes tested | LL | BIC | SSABIC | AIC | CAIC | AWE | LMR LRT: p-value | Entropy |
|---|---|---|---|---|---|---|---|---|
| 1-Class | −10186.61 | 20738.68 | 20535.71 | 20501.22 | 20802.68 | 21296.15 | - | - |
| 2-Class | −8334.85 | 17223.62 | 16915.98 | 16863.70 | 17320.62 | 18068.53 | 0.174 | 0.923 |
| 3-Class | −7411.61 | 15565.58 | 15153.30 | 15083.23 | 15695.58 | 16697.94 | 0.419 | 0.949 |
| 4-Class | −6943.44 | 14817.67 | 14300.73 | 14212.87 | 14980.67 | 16237.47 | 0.439 | 0.961 |
| 5-Class | −6559.43 | 14238.10 | 13616.50 | 13510.86 | 14434.10 | 15945.35 | 0.757 | 0.946 |
Notes: LL=“Log Likelihood”, BIC=“Bayesian Information Criterion”, SSABIC=“Sample Size Adjusted Bayesian Information Criterion”, AIC=“Akaike’s Information Criterion” CAIC=“Consistent Akaike’s Information Criterion”, AWE=“Approximate Weight of Evidence Criterion”, LMR LRT=“ Lo-Mendell-Rubin likelihood ratio test”
Figure 1.
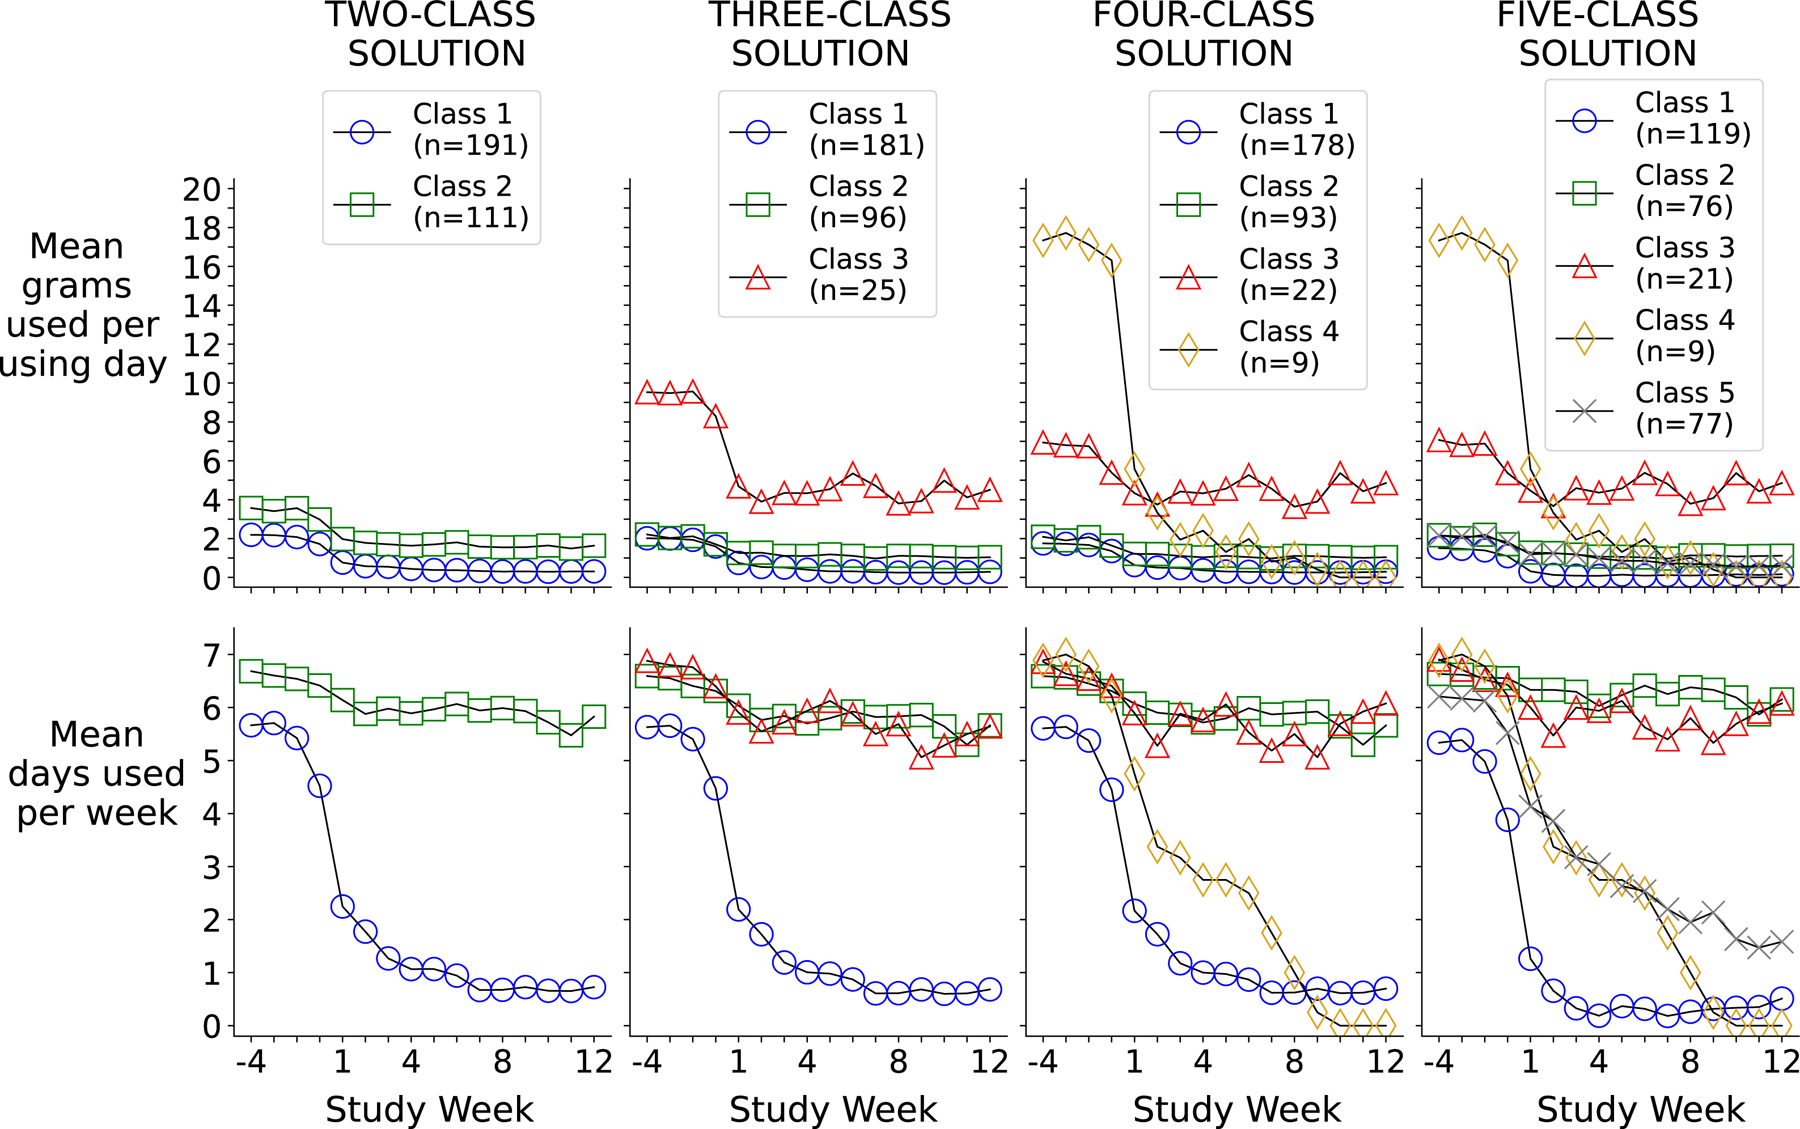
Different latent class solutions using self-reported cannabis frequency (days) and quantity (grams) during each study week
Examining change in functional outcomes within classes.
After examining the different latent class solutions, we used the manual stepwise BCH method (Bolck, Croon, & Hagenaars, 2004) to examine change in three outcomes among classes: anxiety, depression (each measured via HADS), and cannabis-related psychosocial problems (measured via MPS). The BCH method is an approach to distal outcomes analyses that uses classification error-based weighting and is recommended over traditional classify-analyze approaches (Asparouhov & Muthén, 2014; Bakk, Tekle, & Vermunt, 2013; Nylund-Gibson, Grimm, & Masyn, 2019). Using the BCH method, we tested linear regression models with standard error corrections to account for non-independence and non-normality of the data and Full Information Maximum Likelihood to account for missing observations (Muthen & Muthen, 2017). Within each latent class of each solution, mean outcome scores were examined at four time points: Week −1 (baseline), Week 4, Week 8, and Week 12. Dummy variables for Weeks 4, 8, and 12 were individually compared to Week −1 (reference week)(Table 2). Models were adjusted for treatment group, age, gender, and race. Wald tests were used to test pairwise differences in change over time in the outcome across classes (Supplemental Table 1). For purposes of visualization, we calculated adjusted predictions at the means for each time point (i.e., predicted mean of the outcome at a given week for an “average” person) within each class (Figure 2).
Table 2.
Relations between study week (independent variable) and mean anxiety, depression, and cannabis-related problem scores (dependent variables) across classes and class solutions
| HADS-A | HADS-D | MPS | |||||||||||||||||
|---|---|---|---|---|---|---|---|---|---|---|---|---|---|---|---|---|---|---|---|
| Week −1 vs. Week 4 | Week −1 vs. Week 8 | Week −1 vs. Week 12 | Week −1vs. Week 4 | Week −1 vs. Week 8 | Week −1 vs. Week 12 | Week −1vs. Week 4 | Week −1 vs. Week 8 | Week −1 vs. Week 12 | |||||||||||
| Solution | Coef | 95% CI | Coef | 95% CI | Coef | 95% CI | Coef | 95% CI | Coef | 95% CI | Coef | 95% CI | Coef | 95% CI | Coef | 95% CI | Coef | 95% CI | |
| Two-Class | Class 1 | −0.99 | (−1.53, −0.45) | −1.09 | (−1.70, −0.47) | −1.59 | (−2.22, −0.95) | −0.93 | (−1.39, −0.47) | −0.70 | (−1.27, −0.13) | −1.36 | (−1.98, −0.75) | −3.09 | (−3.67, −2.50) | −4.80 | (−5.43, −4.17) | −5.00 | (−5.66, −4.34) |
| Class 2 | −0.77 | (−1.46, −0.08) | 0.07 | (−0.75, 0.90) | −0.63 | (−1.42, 0.16) | −0.73 | (−1.29, −0.17) | −0.54 | (−1.25, 0.17) | −0.48 | (−1.27, 0.31) | −2.26 | (−3.02, −1.50) | −2.35 | (−3.11, −1.59) | −2.99 | (−3.80, −2.18) | |
| Three-Class | Class 1 | −1.03 | (−1.58, −0.48) | −1.15 | (−1.77, −0.53) | −1.64 | (−2.29, −0.99) | −0.87 | (−1.33, −0.41) | −0.65 | (−1.22, −0.08) | −1.35 | (−1.97, −0.73) | −3.07 | (−3.66, −2.48) | −4.83 | (−5.47, −4.18) | −5.02 | (−5.69, −4.34) |
| Class 2 | −0.64 | (−1.33, 0.05) | 0.11 | (−0.81, 1.03) | −0.43 | (−1.28, 0.41) | −0.48 | (−1.03, 0.07) | −0.29 | (−1.04, 0.47) | −0.34 | (−1.12, 0.45) | −2.21 | (−3.04, −1.38) | −2.39 | (−3.21, −1.56) | −2.91 | (−3.81, −2.01) | |
| Class 3 | −0.84 | (−2.71, 1.03) | 0.69 | (−0.80, 2.17) | −1.17 | (−3.16, 0.82) | −2.04 | (−3.60, −0.48) | −1.63 | (−3.26, 0.01) | −0.82 | (−2.95, 1.31) | −2.58 | (−4.20, −0.95) | −2.20 | (−3.92, −0.48) | −3.36 | (−5.01, −1.72) | |
| Four-Class | Class 1 | −1.01 | (−1.57, −0.46) | −1.11 | (−1.73, −0.48) | −1.61 | (−2.26, −0.96) | −0.84 | (−1.30, −0.37) | −0.61 | (−1.19, −0.03) | −1.31 | (−1.93, −0.68) | −3.07 | (−3.66, −2.47) | −4.80 | (−5.45, −4.15) | −4.98 | (−5.66, −4.29) |
| Class 2 | −0.67 | (−1.36, 0.03) | 0.09 | (−0.85, 1.02) | −0.54 | (−1.39, 0.30) | −0.50 | (−1.05, 0.05) | −0.31 | (−1.06, 0.45) | −0.41 | (−1.20, 0.38) | −2.25 | (−3.09, −1.42) | −2.44 | (−3.26, −1.61) | −3.02 | (−3.91, −2.13) | |
| Class 3 | −0.49 | (−2.24, 1.26) | 1.26 | (0.01, 2.50) | −0.24 | (−2.23, 1.75) | −1.51 | (−2.91, −0.10) | −0.76 | (−2.22, 0.70) | 0.45 | (−1.55, 2.45) | −2.04 | (−3.49, −0.58) | −1.36 | (−2.85, 0.14) | −2.08 | (−3.52, −0.63) | |
| Class 4 | 0.07 | (−2.94, 3.07) | −2.19 | (−4.73, 0.36) | −1.69 | (−5.38, 2.01) | −1.34 | (−3.49, 0.80) | −3.09 | (−5.24, −0.95) | −3.59 | (−5.04, −2.14) | −2.58 | (−5.78, 0.62) | −5.83 | (−7.85, −3.81) | −6.58 | (−8.97, −4.19) | |
| Five-Class | Class 1 | −0.92 | (−1.61, −0.23) | −0.75 | (−1.50, 0.01) | −1.55 | (−2.33, −0.76) | −0.82 | (−1.42, −0.22) | −0.58 | (−1.27, 0.11) | −1.13 | (−1.90, −0.35) | −3.50 | (−4.24, −2.75) | −5.44 | (−6.20, −4.68) | −5.37 | (−6.19, −4.56) |
| Class 2 | −0.90 | (−1.68, −0.12) | 0.38 | (−0.68, 1.45) | −0.43 | (−1.40, 0.53) | −0.43 | (−1.04, 0.18) | −0.06 | (−0.89, 0.78) | −0.23 | (−1.16, 0.69) | −2.17 | (−3.10, −1.25) | −2.41 | (−3.33, −1.48) | −2.93 | (−3.94, −1.91) | |
| Class 3 | −0.33 | (−2.18, 1.52) | 1.59 | (0.46, 2.72) | −0.44 | (−2.40, 1.53) | −1.37 | (−2.82, 0.08) | −0.54 | (−2.05, 0.96) | 0.41 | (−1.62, 2.43) | −1.96 | (−3.50, −0.43) | −1.26 | (−2.88, 0.36) | −2.32 | (−3.77, −0.88) | |
| Class 4 | 0.07 | (−2.94, 3.07) | −2.19 | (−4.73, 0.36) | −1.69 | (−5.38, 2.01) | −1.34 | (−3.49, 0.80) | −3.09 | (−5.24, −0.95) | −3.59 | (−5.04, −2.14) | −2.58 | (−5.78, 0.62) | −5.83 | (−7.85, −3.81) | −6.58 | (−8.97, −4.19) | |
| Class 5 | −0.87 | (−1.70, −0.04) | −1.69 | (−2.65, −0.72) | −1.39 | (−2.40, −0.38) | −0.93 | (−1.55, −0.31) | −0.79 | (−1.74, 0.16) | −1.50 | (−2.35, −0.65) | −2.21 | (−3.09, −1.32) | −2.99 | (−4.06, −1.91) | −3.71 | (−4.80, −2.61) | |
HADS-A = Anxiety subscale of Hospital Anxiety and Depression Scale; HADS-D = Depression subscale of Hospital Anxiety and Depression Scale; MPS = Marijuana Problem Scale
Models are linear regression with cluster-robust standard errors; Coefficients are unstandardized; Models are adjusted for treatment status, age, race, gender.
Figure 2.

Psychosocial outcome scores over time across classes and class solutions
*Week −1 = week prior to randomization; Models adjusted for Treatment Status, Age, Race, Gender; Estimates are adjusted predictions at means of covariates
Examining urine cannabinoids in relation to classes.
Finally, to assess the validity of self-reported consumption, we examined the extent to which class-specific urine cannabinoid levels matched class-specific patterns of self-reported frequency and quantity of use. For each participant’s week-specific urinalysis data, cannabinoid metabolite levels were divided by the corresponding creatinine level. This cannabinoid-creatinine ratio was then log-transformed. For purposes of visualization (Figure 3), we used posterior probabilities to assign participants to classes and then plotted the class-specific mean log cannabinoid-creatinine ratios over time. These plots were used to qualitatively evaluate the correspondence between the structure of class-specific urinalysis results and self-reported frequency and quantity patterns (Figure 3). Of the n=3,926 potential urinalysis results (302 participants × 13 samples per participant), n=724 (18.4%) were missing. To account for these missing data, we used Multiple Imputation procedures (50 imputations) to fill in missing urine results (continuous values) and then repeated procedures above to examine change in cannabinoid levels over time among classes (Figure 3).
Figure 3.

Self-reported days used vs. urine cannabinoid levels over time across different latent class solutions
Results
Different Latent Profile Solutions (Figure 1, Table 1)
Model fit indices for each of the solutions are provided in Table 1. Across all solutions, entropy was high, ranging from approximately 0.92 to 0.96, but IC and LMR tests gave conflicting results, with IC favoring more classes and LMR favoring fewer. The best log-likelihood values were replicated in all models, but the number of replications achieved tended to decrease as the number of classes increased. Figure 1 presents the patterns of cannabis use frequency and quantity of each class within the two-, three-, four-, and five-class solutions. Several dynamics can be observed by comparing classes within a solution and comparing across the different solutions. All classes, regardless of the solution, demonstrated some degree of pre-randomization reduction in both frequency and quantity. Additionally, across the different solutions, two broad themes emerged: (1) after randomization, some groups continued to reduce consumption while others stabilized; (2) within classes, a decline or stabilization of consumption frequency in a given window of time generally corresponded to a similar pattern of decline or stabilization in consumption quantity within that same window (albeit magnitudes of decline may differ). Of note, interpretation of Figure 1 should consider the large standard deviations in some classes (Supplemental Tables 2 and 3). Note that class sizes change for each new solution (e.g., class 1 size in 2-class solution vs. class 1 size in 3-class solution) because more classes are requested but the total sample size remains constant.
Psychosocial Outcomes Results (Figure 2 and Table 2).
Anxiety: HADS-A (Figure 2: top row, Table 2: left columns).
Across classes and solutions, we generally observed reductions in mean HADS-A scores ranging from approximately 0.5 to 1.5 and 95% confidence intervals suggesting that models assuming little to no change in scores relative to Week −1 were reasonably compatible with the data. For example, from Weeks −1 to 12, Class 1’s mean HADS-A score declined by 1.59 (95% CI: −2.22, −0.95), and Class 2’s declined by 0.63 (95% CI: −1.42, 0.16) in the two-class solution.
Depressed Mood: HADS-D (Figure 2: middle row, Table 2: middle columns).
Across classes and solutions, we generally observed reductions in mean HADS-D scores ranging from approximately 0.5 to 1.5 and 95% confidence intervals suggesting that models assuming little or no change in scores relative to Week −1 were reasonably compatible with the data. For example, from Weeks −1 to 12, Class 1’s mean HADS-D score declined by 1.36 points (95% CI: −1.98, −0.75) and Class 2’s declined by 0.48 points (95% CI: −1.27, 0.31) in the two-class solution.
Cannabis Problems: MPS (Figure 2: bottom row, Table 2: right columns).
Across classes and solutions, we generally observed reductions in mean MPS scores ranging from approximately 2 to 5 and 95% confidence intervals suggesting that models assuming declines in scores relative to Week −1 were reasonably compatible with the data. For example, from Weeks −1 to 12, Class 1’s mean MPS score declined by 5.00 (95% CI: −5.66, −4.34), and Class 2’s declined by 2.99 (95% CI: −3.80, −2.18) in the two-class solution. Additionally, note the strong qualitative correspondence between the class-specific pattern of change in MPS scores and the class-specific pattern of change in self-report days used (bottom row of Figure 2 compared to bottom row of Figure 1).
Urine cannabinoid tests (Figure 3).
Figure 3 displays non-imputed and imputed mean log creatinine-normalized urine cannabinoid levels over time in relation to mean self-reported days used over time among classes in each of the latent class solutions. The key results to note in Figure 3 are the qualitative similarities between class-specific patterns of change in self-reported total days used (top panel of Figure 3) and the class-specific patterns of change in cannabinoid levels (middle and bottom panels of Figure 3). These results illustrate that when examined in aggregate, self-reported days of cannabis use can reflect biological cannabinoid levels, and the integrity of this correspondence is maintained even when the self-report-based data are subjected to mixture model analysis. This observation provides some validation for using self-reported days of use as a proximal measure of cannabis consumption.
Discussion
The aims of this exploratory secondary analysis were to (1) provide an example of a methodological approach to using self-reported cannabis use frequency and quantity in tandem to understand patterns of cannabis use reduction during treatment and to (2) determine whether patterns of cannabis use reduction derived by this approach correspond to similar patterns of improvement in psychosocial functioning during treatment. The results demonstrated that within this treatment-seeking sample of individuals with CUD, combinations of self-reported days of use in the past week (frequency) and grams used per using day in the past week (quantity) could be used to characterize distinct and meaningful patterns of cannabis use reduction as evidenced by results showing that patterns of reduction tracked fairly well to reductions in functional impairment measured by the Marijuana Problem Scale. Overall, the concepts, methods, and results of this study offer an initial step towards mapping the landscape of cannabis reduction patterns and underscore the utility of considering interrelations among different measures of consumption. Several potential next steps for this line of research include the use of (1) alternative self-report and biologically-based measures of cannabis consumption (e.g., assessing %THC of products), (2) alternative cannabis-specific functional outcome measures (e.g., Cannabis Problems Questionnaire or Marijuana Consequences Questionnaire instead of the Marijuana Problem Scale)(Copeland, Gilmour, Gates, & Swift, 2005; Simons, Dvorak, Merrill, & Read, 2012) (3) alternative non-cannabis-related outcome measures (e.g., Beck Depression/Anxiety Inventories instead of the Hospital Anxiety and Depression Scale) (3) alternative model specifications (e.g., less constrained covariance structures for measurement models) and (4) alternative treatment protocols (e.g., data from clinical trials that did not employ Contingency Management). Such efforts would help determine the extent to which the results of this study reflect a consistently observable set of relations that are robust to study-specific measurement and modeling strategy choices.
The findings highlight the importance of examining how frequency and quantity relate to each other. In this particular dataset and analytic approach, we observed different frequency/quantity relationships between classes. For example, at baseline, some classes were using low quantities at high frequencies, whereas others were using high quantities at high frequencies. However, within each class, changes in frequency and quantity generally covaried: if frequency was stable, quantity was stable; if frequency declined, quantity declined (albeit the magnitudes of decline may have differed). Again, it will be important to determine whether such dynamics replicate in other datasets containing a different group of CUD treatment-seekers and more precise and comprehensive measures of consumption.
We observed potentially important discrepancies between changes in anxiety/depression (HADS) and changes in cannabis-specific psychosocial problem (MPS) scores. Compared to the relatively minimal changes in HADS scores, changes in MPS scores were notably larger and exhibited patterns of reduction and stability that were qualitatively more consistent with patterns of reduction and stability in self-reported frequency and quantity. For example, all classes showed evidence of some form of reduced consumption during the pre-randomization and/or early post-randomization period and subsequently either continued to reduce consumption (e.g., Class 1) or stabilized at a specific level of consumption for the rest of the study period (e.g., Class 2). Both of these class-specific patterns of consumption reduction and stability paralleled similar class-specific patterns of MPS score reduction and stability during the same measurement periods.
These observations highlight a central question to consider: Do the biopsychosocial functioning assessments that we use in treatment studies explicitly address whether or not a given consequence was caused directly by the participant’s substance use (Kiluk et al., 2019b)? In this study, the HADS (a measure of anxiety/depression) does not explicitly instruct participants to identify whether their symptoms stem directly from their cannabis use. Conversely, the MPS instrument explicitly links cannabis use to outcomes by asking participants: “Has marijuana use caused you…” and then lists a series of functional consequences from several domains (e.g., social, cognitive, legal, occupational, financial, physical). Importantly, the MPS does not measure cannabis consumption – implying that the observed correspondence between patterns of change in consumption and patterns of change in MPS scores is not explicitly due to redundant measurement of consumption. Thus, our results are consistent with the notion that overtly linking consequences to substance use in an assessment impacts the extent to which reductions in consumption will parallel reductions in the scores of that assessment.
Two additional concepts concerning psychosocial functioning assessment warrant discussion. First, cross-sectional analyses of the MPS suggest that problematic cannabis use may be best conceptualized as a continuous rather than categorical construct (Earleywine, Denson, & Altman, 2021). Our results generally support the longitudinal version of this concept. Had we dichotomized MPS scores into non-problematic vs. problematic users, we may have obscured what seems to be a relatively linear relationship between consumption reduction and MPS score reduction. However, a second key point is that an MPS score is a single value that summarizes information from multiple, distinct domains of functioning. There is evidence that cannabis reduction relates differently to domain-specific MPS subscores (Altman, Mian, Ueno, & Earleywine, 2020). For example, improvements in memory or energy levels (both assessed in the MPS) could occur soon after reductions in cannabis use. In contrast, legal or financial problems (also both assessed in the MPS) could take years to improve and may therefore not correlate with reduced consumption. Thus, future research may benefit from examining how specific items or sets of interrelated items in the MPS relate to longitudinal changes in consumption.
Several design limitations concerning the assessment of cannabis quantity are important to consider. First, the data were based on self-estimation, which likely introduced measurement error. For example, as is evident in Figure 1, some individuals reported potentially implausible numbers of grams consumed per using day. Additionally, quantities were calculated assuming that the number of grams consumed via a particular method of administration did not vary (i.e., only “typical” quantity was assessed and used in calculations). This also likely induced measurement error. However, to correct such error would require implementing the self-estimation weighing procedure on a more frequent basis which may be logistically infeasible – particularly with a large number of subjects. It is also worth noting that the lack of correspondence between self-estimated quantity and urine cannabinoid levels could be due to several factors. First, weight-based measures of quantity (such as the one used in this study) may not account for variability in potency (i.e., %THC). Consuming the same number of grams of plant material could result in a different number of milligrams of THC ingested depending on the potency. This discrepancy could translate into a lack of correspondence between weight-based quantity measures and urine cannabinoid levels and has also been highlighted as a key distinction to consider as part of efforts to develop standardized metrics of cannabis consumption (Freeman & Lorenzetti, 2020). Alternatively, individuals may simply be able to self-report their frequency of use with greater accuracy and consistency relative to their quantity of use. Finally, factors such as variability in the recency of use, consistency of use, and physiological excretion rates could also play a role in affecting the relationship between weight-based self-estimates of quantity and urine toxicology results. We emphasize that this study provides only one way of conceptualizing, measuring, and analyzing cannabis consumption quantity. Alternative conceptualizations and measurement strategies may result in greater correspondence between patterns cannabis use quantity and urinalysis results. Overall, there remains a need to identify and test more universally applicable indicators of consumption quantity (Loflin et al., 2020).
Two other notable study design limitations warrant mention. First, the analytical sample contained treatment-seeking individuals who received the medication N-acetylcysteine and contingency management treatment. Other types of interventions and treatment protocols could yield different cannabis use response profiles (Baker et al., 2018; Panlilio et al., 2020). Second, the treatment phase of the original study only lasted 12 weeks. Capturing clinically meaningful psychosocial functioning changes in the data may require longer treatment periods and observation windows.
There are also important analysis limitations to consider: (1) because of the study’s small sample size, we used a class-invariant diagonal covariance matrix which introduces a greater risk of over-extraction of classes and does not allow the Expectation-Maximization algorithm to fully utilize the observed covariance among indicator variables when extracting classes. As stated previously, to refine these methods, future studies with larger sample sizes should consider the use of less constrained variance-covariance matrices or various unsupervised machine-learning techniques (Panlilio et al., 2020); (2) in and of itself, the fact that a dataset will yield distinct classes is not sufficient evidence to claim that such groups actually exist in the broader population (Daniel J. Bauer, 2008; D. J. Bauer & Curran, 2003). As Figure 1 demonstrates, the subjectivity involved in extracting classes can lead to substantially different conclusions about the cannabis use response profiles that exist in this dataset, and as Table 1 demonstrates, the quantitative metrics used to evaluate measurement models may provide conflicting information. However, the goal of this study is not to claim that these subtypes of cannabis consumers exist in the larger population, but rather to explore, summarize, and provide potential insights into the different ways in which cannabis use frequency and quantity might plausibly relate to each other and change over time during treatment (Cudeck & Henly, 2003). Ultimately, our confidence in these results should be commensurate with their replicability.
A final future direction for cannabis use quantification research is to explore other calculations and values for deriving the indicator variables used in latent variable measurement models. For example, this study used the average number of grams used per using day (total number of grams consumed divided by the total number of days used). It is possible that using a different denominator (e.g., average number of grams used per week) could provide additional useful information. Alternatively, one might de-emphasize measures of central tendency and focus instead on utilizing measures of variance (e.g., standard deviations, ranges) or complexity (e.g., approximate entropy, Lempel-Ziv complexity)(Lempel & Ziv, 1976; Pincus, 1991).
In sum, this exploratory model demonstrated an approach for utilizing measures of days of cannabis use (frequency) and grams used per using day (quantity) to summarize cannabis reduction in ways that may correspond to different degrees of improvement in psychosocial functioning. Completing additional studies using different and larger samples, alternative measurement instruments, and varied model specifications will help build a comprehensive understanding of cannabis use patterns and enable clinically relevant operational definitions of cannabis reduction.
Supplementary Material
Public Health Significance:
This study examined different ways individuals might reduce the frequency and quantity of their cannabis use during treatment. Results suggest that specific patterns of cannabis reduction may be predictive of improved psychosocial functioning. The conceptual and analytic approach used in this study may help with the development of cannabis reduction-based endpoints for clinical trials.
Acknowledgements:
We would like to thank Mohammad Habib for his review of the manuscript.
This study was sponsored by the National Institutes of Health grants U10DA013727, K23DA045099, P30DA029926, T32DA037202, R01DA050032, F32AA027941. The data used in this study were collected as part of CTN Protocol ID: CTN-0053; ClinicalTrials.gov ID: NCT01675661. KMG has provided consultation to Pfizer. All other authors declare they have no known conflict of interest. Partial results of this study were presented at the 2021 Annual College on Problems of Drug Dependence Conference.
References
- Akaike H (1987). Factor analysis and AIC. Psychometrika, 52(3), 317–332. doi: 10.1007/bf02294359 [DOI] [Google Scholar]
- Altman BR, Mian MN, Ueno LF, & Earleywine M (2020). Examining and validating the factor structure of the cannabis-associated problems questionnaire. Journal of Substance Use, 26(3), 292–298. doi: 10.1080/14659891.2020.1821807 [DOI] [Google Scholar]
- Asparouhov T, & Muthén B (2014). Auxiliary variables in mixture modeling: Using the BCH method in Mplus to estimate a distal outcome model and an arbitrary secondary model. Mplus web notes, 21(2), 1–22. [Google Scholar]
- Babbin SF, Stanger C, Scherer EA, & Budney AJ (2016). Identifying treatment response subgroups for adolescent cannabis use. Addict Behav, 59, 72–79. doi: 10.1016/j.addbeh.2016.03.033 [DOI] [PMC free article] [PubMed] [Google Scholar]
- Baker NL, Gray KM, Sherman BJ, Morella K, Sahlem GL, Wagner AM, & McRae-Clark AL (2018). Biological correlates of self-reported new and continued abstinence in cannabis cessation treatment clinical trials. Drug Alcohol Depend, 187, 270–277. doi: 10.1016/j.drugalcdep.2018.03.017 [DOI] [PMC free article] [PubMed] [Google Scholar]
- Bakk Z, Tekle FB, & Vermunt JK (2013). Estimating the Association between Latent Class Membership and External Variables Using Bias-adjusted Three-step Approaches. Sociological methodology, 43(1), 272–311. doi: 10.1177/0081175012470644 [DOI] [Google Scholar]
- Bauer DJ (2008). Observations on the Use of Growth Mixture Models in Psychological Research. Multivariate Behav Res, 42(4), 757–786. doi: 10.1080/00273170701710338 [DOI] [Google Scholar]
- Bauer DJ, & Curran PJ (2003). Distributional assumptions of growth mixture models: implications for overextraction of latent trajectory classes. Psychol Methods, 8(3), 338–363. doi: 10.1037/1082-989X.8.3.338 [DOI] [PubMed] [Google Scholar]
- Bolck A, Croon M, & Hagenaars J (2004). Estimating Latent Structure Models with Categorical Variables: One-Step Versus Three-Step Estimators. Political analysis, 12(1), 3–27. [Google Scholar]
- Borodovsky JT, & Budney AJ (2018). Cannabis regulatory science: risk-benefit considerations for mental disorders. Int Rev Psychiatry, 30(3), 183–202. doi: 10.1080/09540261.2018.1454406 [DOI] [PMC free article] [PubMed] [Google Scholar]
- Borodovsky JT, Sofis MJ, Grucza RA, & Budney AJ (2021). The importance of psychology for shaping legal cannabis regulation. Experimental and clinical psychopharmacology, 29(1), 99–115. doi: 10.1037/pha0000362 [DOI] [PMC free article] [PubMed] [Google Scholar]
- Budney AJ, & Borodovsky JT (2017). The potential impact of cannabis legalization on the development of cannabis use disorders. Prev Med, 104, 31–36. doi: 10.1016/j.ypmed.2017.06.034 [DOI] [PMC free article] [PubMed] [Google Scholar]
- Budney AJ, Sofis MJ, & Borodovsky JT (2019). An update on cannabis use disorder with comment on the impact of policy related to therapeutic and recreational cannabis use. Eur Arch Psychiatry Clin Neurosci, 269(1), 73–86. doi: 10.1007/s00406-018-0976-1 [DOI] [PMC free article] [PubMed] [Google Scholar]
- Cannabis Policy Research Workgroup. (2018). National Advisory Council on Drug Abuse Cannabis Policy Research Workgroup Reporte.
- Carroll KM, Kiluk BD, Nich C, DeVito EE, Decker S, LaPaglia D, … Ball SA (2014). Toward empirical identification of a clinically meaningful indicator of treatment outcome: features of candidate indicators and evaluation of sensitivity to treatment effects and relationship to one year follow up cocaine use outcomes. Drug Alcohol Depend, 137, 3–19. doi: 10.1016/j.drugalcdep.2014.01.012 [DOI] [PMC free article] [PubMed] [Google Scholar]
- Copeland J, Gilmour S, Gates P, & Swift W (2005). The Cannabis Problems Questionnaire: factor structure, reliability, and validity. Drug Alcohol Depend, 80(3), 313–319. doi: 10.1016/j.drugalcdep.2005.04.009 [DOI] [PubMed] [Google Scholar]
- Cudeck R, & Henly SJ (2003). A realistic perspective on pattern representation in growth data: comment on Bauer and Curran (2003). Psychol Methods, 8(3), 378–383; discussion 384–393. doi: 10.1037/1082-989X.8.3.378 [DOI] [PubMed] [Google Scholar]
- Donovan DM, Bigelow GE, Brigham GS, Carroll KM, Cohen AJ, Gardin JG, … Wells EA (2012). Primary outcome indices in illicit drug dependence treatment research: systematic approach to selection and measurement of drug use end-points in clinical trials. Addiction, 107(4), 694–708. doi: 10.1111/j.1360-0443.2011.03473.x [DOI] [PMC free article] [PubMed] [Google Scholar]
- Earleywine M, Denson TF, & Altman BR (2021). Replicating the Dimensional Structure of Cannabis Problems: A Taxometric Analysis. Subst Use Misuse, 56(1), 81–86. doi: 10.1080/10826084.2020.1840589 [DOI] [PubMed] [Google Scholar]
- Falk D, Wang XQ, Liu L, Fertig J, Mattson M, Ryan M, … Litten RZ. (2010). Percentage of subjects with no heavy drinking days: evaluation as an efficacy endpoint for alcohol clinical trials. Alcohol Clin Exp Res, 34(12), 2022–2034. doi: 10.1111/j.1530-0277.2010.01290.x [DOI] [PubMed] [Google Scholar]
- Falk DE, O’Malley SS, Witkiewitz K, Anton RF, Litten RZ, Slater M, … Alcohol Clinical Trials Initiative, W. (2019). Evaluation of Drinking Risk Levels as Outcomes in Alcohol Pharmacotherapy Trials: A Secondary Analysis of 3 Randomized Clinical Trials. JAMA Psychiatry, 76(4), 374–381. doi: 10.1001/jamapsychiatry.2018.3079 [DOI] [PMC free article] [PubMed] [Google Scholar]
- Fitzmaurice GM, Lipsitz SR, & Weiss RD (2017). Statistical considerations in the choice of endpoint for drug use disorder trials. Drug Alcohol Depend, 181, 219–222. doi: 10.1016/j.drugalcdep.2017.09.031 [DOI] [PMC free article] [PubMed] [Google Scholar]
- Fitzmaurice GM, Lipsitz SR, & Weiss RD (2020). Within-treatment frequency of use versus abstinence as a predictor of longitudinal post-treatment follow-up assessments of drug use. Drug Alcohol Depend, 208, 107857. doi: 10.1016/j.drugalcdep.2020.107857 [DOI] [PMC free article] [PubMed] [Google Scholar]
- Food and Drug Administration. (2015). Alcoholism: Developing Drugs for Treatment Guidance for Industry. 10001 New Hampshire Ave., Silver Spring, MD: 20993. [Google Scholar]
- Freeman TP, & Lorenzetti V (2020). ‘Standard THC units’: a proposal to standardize dose across all cannabis products and methods of administration. Addiction, 115(7), 1207–1216. doi: 10.1111/add.14842 [DOI] [PubMed] [Google Scholar]
- Gates PJ, Sabioni P, Copeland J, Le Foll B, & Gowing L (2016). Psychosocial interventions for cannabis use disorder. Cochrane Database Syst Rev (5), CD005336. doi: 10.1002/14651858.CD005336.pub4 [DOI] [PMC free article] [PubMed] [Google Scholar]
- Gray KM, Sonne SC, McClure EA, Ghitza UE, Matthews AG, McRae-Clark AL, … Levin FR (2017). A randomized placebo-controlled trial of N-acetylcysteine for cannabis use disorder in adults. Drug Alcohol Depend, 177, 249–257. doi: 10.1016/j.drugalcdep.2017.04.020 [DOI] [PMC free article] [PubMed] [Google Scholar]
- Hasin DS, Wall M, Witkiewitz K, Kranzler HR, Falk D, Litten R, … Alcohol Clinical Trials Initiative, W. (2017). Change in non-abstinent WHO drinking risk levels and alcohol dependence: a 3 year follow-up study in the US general population. Lancet Psychiatry, 4(6), 469–476. doi: 10.1016/S2215-0366(17)30130-X [DOI] [PMC free article] [PubMed] [Google Scholar]
- Hser YI, Mooney LJ, Huang D, Zhu Y, Tomko RL, McClure E, … Gray KM (2017). Reductions in cannabis use are associated with improvements in anxiety, depression, and sleep quality, but not quality of life. J Subst Abuse Treat, 81, 53–58. doi: 10.1016/j.jsat.2017.07.012 [DOI] [PMC free article] [PubMed] [Google Scholar]
- Kiluk BD, Carroll KM, Duhig A, Falk DE, Kampman K, Lai S, … Strain EC (2016). Measures of outcome for stimulant trials: ACTTION recommendations and research agenda. Drug Alcohol Depend, 158, 1–7. doi: 10.1016/j.drugalcdep.2015.11.004 [DOI] [PMC free article] [PubMed] [Google Scholar]
- Kiluk BD, Fitzmaurice GM, Strain EC, & Weiss RD (2019a). Response to commentaries: The quest(ion) remains in the search for a meaningful reduction-based end-point. Addiction, 114(1), 21–23. doi: 10.1111/add.14491 [DOI] [PMC free article] [PubMed] [Google Scholar]
- Kiluk BD, Fitzmaurice GM, Strain EC, & Weiss RD (2019b). What defines a clinically meaningful outcome in the treatment of substance use disorders: reductions in direct consequences of drug use or improvement in overall functioning? Addiction, 114(1), 9–15. doi: 10.1111/add.14289 [DOI] [PMC free article] [PubMed] [Google Scholar]
- Lanza ST, Bray BC, & Collins LM (2012). An Introduction to Latent Class and Latent Transition Analysis. doi: 10.1002/9781118133880.hop202024 [DOI] [Google Scholar]
- Lee DC, Schlienz NJ, Peters EN, Dworkin RH, Turk DC, Strain EC, & Vandrey R (2019). Systematic review of outcome domains and measures used in psychosocial and pharmacological treatment trials for cannabis use disorder. Drug Alcohol Depend, 194, 500–517. doi: 10.1016/j.drugalcdep.2018.10.020 [DOI] [PMC free article] [PubMed] [Google Scholar]
- Lempel A, & Ziv J (1976). On the Complexity of Finite Sequences. IEEE Transactions on Information Theory, 22(1), 75–81. doi: 10.1109/tit.1976.1055501 [DOI] [Google Scholar]
- Levin FR, Mariani JJ, Choi CJ, Basaraba C, Brooks DJ, Brezing CA, & Pavlicova M (2021). Non-abstinent treatment outcomes for cannabis use disorder. Drug Alcohol Depend, 225, 108765. doi: 10.1016/j.drugalcdep.2021.108765 [DOI] [PMC free article] [PubMed] [Google Scholar]
- Lo Y, Mendell NR, & Rubin DB (2001). Testing the number of components in a normal mixture. Biometrika, 88(3), 767–778. doi: 10.1093/biomet/88.3.767 [DOI] [Google Scholar]
- Loflin MJE, Kiluk BD, Huestis MA, Aklin WM, Budney AJ, Carroll KM, … Strain EC (2020). The state of clinical outcome assessments for cannabis use disorder clinical trials: A review and research agenda. Drug Alcohol Depend, 212, 107993. doi: 10.1016/j.drugalcdep.2020.107993 [DOI] [PMC free article] [PubMed] [Google Scholar]
- Masyn KE (2013). Latent Class Analysis and Finite Mixture Modeling. In Little TD (Ed.), The Oxford Handbook of Quantitative Methods in Psychology: Vol. 2: Statistical Analysis (Vol. 2): Oxford University Press. [Google Scholar]
- McClure EA, Sonne SC, Winhusen T, Carroll KM, Ghitza UE, McRae-Clark AL, … Gray KM (2014). Achieving cannabis cessation -- evaluating N-acetylcysteine treatment (ACCENT): design and implementation of a multi-site, randomized controlled study in the National Institute on Drug Abuse Clinical Trials Network. Contemp Clin Trials, 39(2), 211–223. doi: 10.1016/j.cct.2014.08.011 [DOI] [PMC free article] [PubMed] [Google Scholar]
- Muthen LK, & Muthen BO (2017). Mplus User’s Guide (8 ed.). Los Angeles, CA. [Google Scholar]
- Nylund-Gibson K, Grimm RP, & Masyn KE (2019). Prediction from Latent Classes: A Demonstration of Different Approaches to Include Distal Outcomes in Mixture Models. Structural Equation Modeling: A Multidisciplinary Journal, 26(6), 967–985. doi: 10.1080/10705511.2019.1590146 [DOI] [Google Scholar]
- Panlilio LV, Stull SW, Bertz JW, Burgess-Hull AJ, Kowalczyk WJ, Phillips KA, … Preston KL (2020). Beyond abstinence and relapse: cluster analysis of drug-use patterns during treatment as an outcome measure for clinical trials. Psychopharmacology (Berl), 237(11), 3369–3381. doi: 10.1007/s00213-020-05618-5 [DOI] [PMC free article] [PubMed] [Google Scholar]
- Pincus SM (1991). Approximate entropy as a measure of system complexity. Proc Natl Acad Sci U S A, 88(6), 2297–2301. doi: 10.1073/pnas.88.6.2297 [DOI] [PMC free article] [PubMed] [Google Scholar]
- Schwarz G (1978). Estimating the Dimension of a Model. The Annals of Statistics, 6(2), 461–464. doi: 10.1214/aos/1176344136 [DOI] [Google Scholar]
- Sherman BJ, & McRae-Clark AL (2016). Treatment of Cannabis Use Disorder: Current Science and Future Outlook. Pharmacotherapy, 36(5), 511–535. doi: 10.1002/phar.1747 [DOI] [PMC free article] [PubMed] [Google Scholar]
- Sherman BJ, Sofis MJ, Borodovsky JT, Gray KM, McRae-Clark AL, & Budney AJ (2021). Evaluating cannabis use risk reduction as an alternative clinical outcome for cannabis use disorder. Psychol Addict Behav. doi: 10.1037/adb0000760 [DOI] [PMC free article] [PubMed] [Google Scholar]
- Simons JS, Dvorak RD, Merrill JE, & Read JP (2012). Dimensions and severity of marijuana consequences: development and validation of the Marijuana Consequences Questionnaire (MACQ). Addict Behav, 37(5), 613–621. doi: 10.1016/j.addbeh.2012.01.008 [DOI] [PMC free article] [PubMed] [Google Scholar]
- Sobell LC, Sobell MB, Leo GI, & Cancilla A (1988). Reliability of a timeline method: assessing normal drinkers’ reports of recent drinking and a comparative evaluation across several populations. Br J Addict, 83(4), 393–402. doi: 10.1111/j.1360-0443.1988.tb00485.x [DOI] [PubMed] [Google Scholar]
- Spindle TR, Bonn-Miller MO, & Vandrey R (2019). Changing landscape of cannabis: novel products, formulations, and methods of administration. Curr Opin Psychol, 30, 98–102. doi: 10.1016/j.copsyc.2019.04.002 [DOI] [PMC free article] [PubMed] [Google Scholar]
- Spindle TR, Cone EJ, Schlienz NJ, Mitchell JM, Bigelow GE, Flegel R, … Vandrey R (2018). Acute Effects of Smoked and Vaporized Cannabis in Healthy Adults Who Infrequently Use Cannabis: A Crossover Trial. JAMA Netw Open, 1(7), e184841. doi: 10.1001/jamanetworkopen.2018.4841 [DOI] [PMC free article] [PubMed] [Google Scholar]
- Stephens RS, Roffman RA, & Curtin L (2000). Comparison of extended versus brief treatments for marijuana use. Journal of Consulting and Clinical Psychology, 68(5), 898–908. doi: 10.1037/0022-006x.68.5.898 [DOI] [PubMed] [Google Scholar]
- Tomko RL, Baker NL, McClure EA, Sonne SC, McRae-Clark AL, Sherman BJ, & Gray KM (2018). Incremental validity of estimated cannabis grams as a predictor of problems and cannabinoid biomarkers: Evidence from a clinical trial. Drug Alcohol Depend, 182, 1–7. doi: 10.1016/j.drugalcdep.2017.09.035 [DOI] [PMC free article] [PubMed] [Google Scholar]
- Tomko RL, Gray KM, Huestis MA, Squeglia LM, Baker NL, & McClure EA (2019). Measuring Within-Individual Cannabis Reduction in Clinical Trials: A Review of the Methodological Challenges. Curr Addict Rep, 6(4), 429–436. doi: 10.1007/s40429-019-00290-y [DOI] [PMC free article] [PubMed] [Google Scholar]
- Vandrey R, Herrmann ES, Mitchell JM, Bigelow GE, Flegel R, LoDico C, & Cone EJ (2017). Pharmacokinetic Profile of Oral Cannabis in Humans: Blood and Oral Fluid Disposition and Relation to Pharmacodynamic Outcomes. J Anal Toxicol, 41(2), 83–99. doi: 10.1093/jat/bkx012 [DOI] [PMC free article] [PubMed] [Google Scholar]
- Witkiewitz K, Hallgren KA, Kranzler HR, Mann KF, Hasin DS, Falk DE, … Anton RF (2017). Clinical Validation of Reduced Alcohol Consumption After Treatment for Alcohol Dependence Using the World Health Organization Risk Drinking Levels. Alcohol Clin Exp Res, 41(1), 179–186. doi: 10.1111/acer.13272 [DOI] [PMC free article] [PubMed] [Google Scholar]
- Witkiewitz K, Heather N, Falk DE, Litten RZ, Hasin DS, Kranzler HR, … Anton RF (2020). World Health Organization risk drinking level reductions are associated with improved functioning and are sustained among patients with mild, moderate and severe alcohol dependence in clinical trials in the United States and United Kingdom. Addiction, 115(9), 1668–1680. doi: 10.1111/add.15011 [DOI] [PMC free article] [PubMed] [Google Scholar]
- Witkiewitz K, Roos CR, Pearson MR, Hallgren KA, Maisto SA, Kirouac M, … Heather N (2017). How Much Is Too Much? Patterns of Drinking During Alcohol Treatment and Associations With Post-Treatment Outcomes Across Three Alcohol Clinical Trials. J Stud Alcohol Drugs, 78(1), 59–69. doi: 10.15288/jsad.2017.78.59 [DOI] [PMC free article] [PubMed] [Google Scholar]
- Zigmond AS, & Snaith RP (1983). The hospital anxiety and depression scale. Acta Psychiatr Scand, 67(6), 361–370. doi: 10.1111/j.1600-0447.1983.tb09716.x [DOI] [PubMed] [Google Scholar]
Associated Data
This section collects any data citations, data availability statements, or supplementary materials included in this article.