

Abstract
Background
In school dental screening, a dental health professional visually inspects children’s oral cavities in a school setting and provides information for parents on their child's current oral health status and treatment needs. Screening at school aims to identify potential problems before symptomatic disease presentation, hence prompting preventive and therapeutic oral health care for the children. This review evaluates the effectiveness of school dental screening for improving oral health status. It is the second update of a review originally published in December 2017 and first updated in August 2019.
Objectives
To assess the effectiveness of school dental screening programmes on overall oral health status and use of dental services.
Search methods
An information specialist searched four bibliographic databases up to 15 October 2021 and used additional search methods to identify published, unpublished and ongoing studies.
Selection criteria
We included randomised controlled trials (RCTs; cluster‐ or individually randomised) that evaluated school dental screening compared with no intervention, or that compared two different types of screening.
Data collection and analysis
We used standard methodological procedures expected by Cochrane.
Main results
The previous version of this review included seven RCTs, and our updated search identified one additional trial. Therefore, this update included eight trials (six cluster‐RCTs) with 21,290 children aged 4 to 15 years. Four trials were conducted in the UK, two in India, one in the USA and one in Saudi Arabia. We rated two trials at low risk of bias, three at high risk of bias and three at unclear risk of bias.
No trials had long‐term follow‐up to ascertain the lasting effects of school dental screening. The trials assessed outcomes at 3 to 11 months of follow‐up.
No trials reported the proportion of children with treated or untreated oral diseases other than caries. Neither did they report on cost‐effectiveness or adverse events.
Four trials evaluated traditional screening versus no screening. We performed a meta‐analysis for the outcome 'dental attendance' and found an inconclusive result with high heterogeneity. The heterogeneity was partly due to study design (three cluster‐RCTs and one individually randomised trial). Due to this inconsistency, and unclear risk of bias, we downgraded the evidence to very low certainty, and we are unable to draw conclusions about this comparison.
Two cluster‐RCTs (both four‐arm trials) evaluated criteria‐based screening versus no screening, suggesting a possible small benefit (pooled risk ratio (RR) 1.07, 95% confidence interval (CI) 0.99 to 1.16; low‐certainty evidence). There was no evidence of a difference when comparing criteria‐based screening to traditional screening (RR 1.01, 95% CI 0.94 to 1.08; very low‐certainty evidence).
One trial compared a specific (personalised) referral letter to a non‐specific letter. Results favoured the specific referral letter for increasing attendance at general dentist services (RR 1.39, 95% CI 1.09 to 1.77; very low‐certainty evidence) and attendance at specialist orthodontist services (RR 1.90, 95% CI 1.18 to 3.06; very low‐certainty evidence).
One trial compared screening supplemented with motivation to screening alone. Dental attendance was more likely after screening supplemented with motivation (RR 3.08, 95% CI 2.57 to 3.71; very low‐certainty evidence).
One trial compared referral to a specific dental treatment facility with advice to attend a dentist. There was no evidence of a difference in dental attendance between these two referrals (RR 0.91, 95% CI 0.34 to 2.47; very low‐certainty evidence).
Only one trial reported the proportion of children with treated dental caries. This trial evaluated a post‐screening referral letter based on the common‐sense model of self‐regulation (a theoretical framework that explains how people understand and respond to threats to their health), with or without a dental information guide, compared to a standard referral letter. The findings were inconclusive. Due to high risk of bias, indirectness and imprecision, we assessed the evidence as very low certainty.
Authors' conclusions
The evidence is insufficient to draw conclusions about whether there is a role for school dental screening in improving dental attendance.
We are uncertain whether traditional screening is better than no screening (very low‐certainty evidence). Criteria‐based screening may improve dental attendance when compared to no screening (low‐certainty evidence). However, when compared to traditional screening, there is no evidence of a difference in dental attendance (very low‐certainty evidence).
For children requiring treatment, personalised or specific referral letters may improve dental attendance when compared to non‐specific referral letters (very low‐certainty evidence). Screening supplemented with motivation (oral health education and offer of free treatment) may improve dental attendance in comparison to screening alone (very low‐certainty evidence). We are uncertain whether a referral letter based on the 'common‐sense model of self‐regulation' is better than a standard referral letter (very low‐certainty evidence) or whether specific referral to a dental treatment facility is better than a generic advice letter to visit the dentist (very low‐certainty evidence).
The trials included in this review evaluated effects of school dental screening in the short term. None of them evaluated its effectiveness for improving oral health or addressed possible adverse effects or costs.
Keywords: Child; Humans; Dental Caries; Dental Caries/diagnosis; Dental Caries/prevention & control; Health Education, Dental; Oral Health; Parents; Randomized Controlled Trials as Topic; Schools
Plain language summary
School dental screening programmes for improving oral health of children
What was the aim of this review?
Oral health means the condition of the mouth, throat, teeth and gums. The aim of this Cochrane Review was to find out if school dental screening improves oral health of children; and if it does, which screening method works best. We found eight relevant studies to answer this question. This is the second update of a review that was published in December 2017 and first updated in August 2019.
Key message
There is not enough evidence to draw conclusions about whether traditional school dental screening can improve dental attendance (can lead to children visiting the dentist more often). Moreover, it is not clear if improvement in dental attendance leads to better oral health. We still need high‐quality studies that measure the impact of screening on oral health over longer periods of time.
What did this review study?
Oral diseases, especially tooth decay (called 'dental caries' by dentists), affect children worldwide. If untreated, oral health can deteriorate and negatively impact children's general well‐being. It also has a financial cost for families and society as a whole.
School dental screening involves a dental professional examining children's mouths and teeth at school and letting parents know about their child's oral condition and treatment needs. It aims to identify oral health concerns at an early stage and prompt parents to seek treatment where required. Whether this actually improves children's oral health is the question we wanted to answer in this review.
What were the main results of this review?
Our updated search identified one new study to be included since the last version of the review was published. In total, the review includes eight studies that presented results for 21,290 children. Four studies took place in the UK, two in India, one in the USA and one in Saudi Arabia. The children were 4 to 15 years old. Studies looked at the oral health and dental attendance of children who were screened in school compared to children who did not have screening. Some studies also compared different ways of screening and different forms of follow‐up (e.g. advice letter or referral).
We do not know whether traditional school dental screening improves dental attendance. Studies looking at screening based on specific criteria (e.g. targeted at children not registered with a dentist) suggested it may be slightly more effective than no screening for improving attendance at the dentist. There may be no difference between criteria‐based screening and universal screening for improving dental attendance, but we are very unsure about the results.
A personalised or specific referral letter to parents may improve dental attendance more than a non‐specific letter, but we are very unsure about the results.
Screening with added motivation (health education and offer of free treatment) may improve dental attendance compared to screening alone, but we are very unsure about the results.
One study comparing different referral letters (with more or less information about dental diseases) found that neither was better than the other for improving dental treatment in children.
A specific referral letter did not encourage more parents to take their children to the dentist when compared to a letter with generic advice to visit the dentist.
The eight studies followed up children for 3 to 11 months after they received screening. Therefore, we do not know the effects of screening over a longer period of time.
None of the studies checked whether there were any negative effects of screening programmes or how much they cost.
How up to date is the review?
We searched for published studies up to 15 October 2021.
Summary of findings
Summary of findings 1. Traditional screening versus no screening.
| Traditional screening versus no screening | ||||||
| Population: school children Setting: primary and secondary schools in UK and India Intervention: traditional screening Comparison: no screening | ||||||
| Outcomes | Anticipated absolute effects (95% CI) | Relative effect (95% CI) | Number of participants (studies) | Certainty of the evidence (GRADE) | Comment | |
| Without screening | With traditional screening | |||||
| Dental attendance Follow‐up: 3–4 months | Data not pooled
|
6281 (4 RCTs) | ⊕⊝⊝⊝ Very lowa,b | There was substantial heterogeneity, in part due to study design (3 cluster‐RCTs and 1 individually randomised trial). We are unable to draw conclusions about this comparison. | ||
| Proportion of children with treated/untreated caries | Not reported | |||||
| Proportion of children with other treated/untreated oral health need | Not reported | |||||
| Adverse events | Not reported | |||||
| CI: confidence interval; RCT: randomised controlled trial. | ||||||
| GRADE Working Group grades of evidence High certainty: we are very confident that the true effect lies close to that of the estimate of the effect. Moderate certainty: we are moderately confident in the effect estimate: the true effect is likely to be close to the estimate of the effect, but there is a possibility that it is substantially different. Low certainty: our confidence in the effect estimate is limited: the true effect may be substantially different from the estimate of the effect. Very low certainty: we have very little confidence in the effect estimate: the true effect is likely to be substantially different from the estimate of effect. | ||||||
aDowngraded two levels due to unclear risk of bias. bDowngraded two levels due to inconsistency.
Summary of findings 2. Criteria‐based screening versus no screening.
| Criteria‐based screening versus no screening | ||||||
| Population: school children Setting: primary and secondary schools in UK Intervention: criteria‐based screening Comparison: no screening | ||||||
| Outcomes | Anticipated absolute effects* (95% CI) | Relative effect (95% CI) | Number of participants (studies) | Certainty of the evidence (GRADE) | Comment | |
| No screening | With criteria ‐based screening | |||||
|
Dental attendance Follow‐up: 3–4 months |
331 per 1000 | 355 per 1000 (328 to 381) | RR 1.07 (0.99 to 1.16) | 4980 (2 RCTs) | ⊕⊕⊝⊝ Lowa | There may be a 7% relative increase in dental attendance in criteria‐based screening group compared to no screening group, with the 95% CI ranging from 1% decrease to 16% increase. |
| Proportion of children with treated/untreated caries | Not reported | |||||
| Proportion of children with other treated/untreated oral health need | Not reported | |||||
| Adverse events | Not reported | |||||
| *The risk in the intervention group (and its 95% confidence interval) is based on the assumed risk in the comparison group and the relative effect of the intervention (and its 95% CI). CI: confidence interval; RR: risk ratio; RCT: randomised controlled trial. | ||||||
| GRADE Working Group grades of evidence High certainty: we are very confident that the true effect lies close to that of the estimate of the effect. Moderate certainty: we are moderately confident in the effect estimate: the true effect is likely to be close to the estimate of the effect, but there is a possibility that it is substantially different. Low certainty: our confidence in the effect estimate is limited: the true effect may be substantially different from the estimate of the effect. Very low certainty: we have very little confidence in the effect estimate: the true effect is likely to be substantially different from the estimate of effect. | ||||||
aDowngraded two levels due to imprecision.
Summary of findings 3. Criteria‐based screening versus traditional screening.
| Criteria‐based screening versus traditional screening | ||||||
| Population: school children Setting: primary and secondary schools in UK Intervention: criteria‐based screening Comparison: traditional screening | ||||||
| Outcomes | Anticipated absolute effects* (95% CI) | Relative effect (95% CI) | Number of participants (studies) | Certainty of the evidence (GRADE) | Comment | |
| With traditional screening | With criteria‐based screening | |||||
|
Dental attendance Follow‐up: 3–4 months |
335 per 1000 | 338 per 1000 (315 to 362) | RR 1.01 (0.94 to 1.08) | 5316 (2 RCTs) | ⊕⊝⊝⊝ Very lowa,b | Criteria‐based screening may have little or no effect on dental attendance compared to traditional screening, with the 95% CI ranging from 6% decrease to 8% increase in attendance. |
| Proportion of children with treated/untreated caries | Not reported | |||||
| Proportion of children with other treated/untreated oral health need | Not reported | |||||
| Adverse events | Not reported | |||||
| *The risk in the intervention group (and its 95% confidence interval) is based on the assumed risk in the comparison group and the relative effect of the intervention (and its 95% CI). CI: confidence interval; RR: risk ratio; RCT: randomised controlled trial. | ||||||
| GRADE Working Group grades of evidence High certainty: we are very confident that the true effect lies close to that of the estimate of the effect. Moderate certainty: we are moderately confident in the effect estimate: the true effect is likely to be close to the estimate of the effect, but there is a possibility that it is substantially different. Low certainty: our confidence in the effect estimate is limited: the true effect may be substantially different from the estimate of the effect. Very low certainty: we have very little confidence in the effect estimate: the true effect is likely to be substantially different from the estimate of effect. | ||||||
aDowngraded two levels due to inconsistency. bDowngraded two levels due to imprecision.
Summary of findings 4. Criteria‐based screening with specific referral versus criteria‐based screening with non‐specific referral.
| Criteria‐based screening with specific referral versus criteria‐based screening with non‐specific referral | ||||||
| Population: school children Setting: secondary school in UK Intervention: criteria‐based screening with specific referral Comparison: criteria‐based screening with non‐specific referral | ||||||
| Outcomes | Anticipated absolute effects* (95% CI) | Relative effect (95% CI) | Number of participants (studies) | Certainty of the evidence (GRADE) | Comment | |
| With criteria‐based screening and non‐specific referral | With criteria‐based screening and specific referral | |||||
|
Dental attendance at general dentist Follow‐up: mean 8 months |
490 per 1000 | 687 per 1000 (534 to 867) |
RR 1.39 (1.09 to 1.77) | 201 (1 RCT) | ⊕⊝⊝⊝ Very lowa,b | There may be a 39% relative increase in attendance at general dentist in the specific referral group compared to non‐specific group, with the 95% CI ranging from 9% to 77% increase in attendance. |
| Dental attendance at orthodontist Follow‐up: mean 8 months | 194 per 1000 | 368 per 1000 (229 to 593) |
RR 1.90 (1.18 to 3.06) | 201 (1 RCT) | ⊕⊝⊝⊝ Very lowa,b | There may be a 90% relative increase in the attendance at orthodontist in the specific referral group compared to the non‐specific group, with the 95% CI ranging from 18% to 206% increase in attendance. |
| Proportion of children with treated/untreated caries | Not reported | |||||
| Proportion of children with other treated/untreated oral health need | Not reported | |||||
| Adverse events | Not reported | |||||
| *The risk in the intervention group (and its 95% confidence interval) is based on the assumed risk in the comparison group and the relative effect of the intervention (and its 95% CI). CI: confidence interval; RR: risk ratio; RCT: randomised controlled trial. | ||||||
| GRADE Working Group grades of evidence High certainty: we are very confident that the true effect lies close to that of the estimate of the effect. Moderate certainty: we are moderately confident in the effect estimate: the true effect is likely to be close to the estimate of the effect, but there is a possibility that it is substantially different. Low certainty: our confidence in the effect estimate is limited: the true effect may be substantially different from the estimate of the effect. Very low certainty: we have very little confidence in the effect estimate: the true effect is likely to be substantially different from the estimate of effect. | ||||||
aDowngraded one level due to unclear risk of bias. bDowngraded two levels due to imprecision.
Summary of findings 5. Traditional screening with motivation versus traditional screening alone.
| Traditional screening with motivation versus traditional screening alone | ||||||
| Population: school children Setting: primary and secondary schools in India Intervention: traditional screening with motivation Comparison: traditional screening | ||||||
| Outcomes | Anticipated absolute effects* (95% CI) | Relative effect (95% CI) | Number of participants (studies) | Certainty of the evidence (GRADE) | Comment | |
| With traditional screening | With traditional screening plus motivation | |||||
| Dental attendance Follow‐up: mean 3 months | 100 per 1000 | 308 per 1000 (257 to 371) | RR 3.08 (2.57 to 3.71) | 2486 (1 RCT) | ⊕⊝⊝⊝ Very lowa,b | There may be a 208% relative increase in the attendance of the motivation group compared to control group, with the 95% CI ranging from 157% to 271% increase in attendance. |
| Proportion of children with treated/untreated caries | Not reported | |||||
| Proportion of children with other treated/untreated oral health need | Not reported | |||||
| Adverse events | Not reported | |||||
| *The risk in the intervention group (and its 95% confidence interval) is based on the assumed risk in the comparison group and the relative effect of the intervention (and its 95% CI). CI: confidence interval; RR: risk ratio; RCT: randomised controlled trial. | ||||||
| GRADE Working Group grades of evidence High certainty: we are very confident that the true effect lies close to that of the estimate of the effect. Moderate certainty: we are moderately confident in the effect estimate: the true effect is likely to be close to the estimate of the effect, but there is a possibility that it is substantially different. Low certainty: our confidence in the effect estimate is limited: the true effect may be substantially different from the estimate of the effect. Very low certainty: we have very little confidence in the effect estimate: the true effect is likely to be substantially different from the estimate of effect. | ||||||
aDowngraded two levels due to high risk of bias. bDowngraded two levels due to imprecision.
Summary of findings 6. Common‐sense model referral letter versus standard referral letter.
| CSM referral letter versus standard referral letter | ||||||
| Population: school children Setting: primary schools in USA Intervention: CSM referral letter Comparison: standard referral letter | ||||||
| Outcomes | Anticipated absolute effects* (95% CI) | Relative effect (95% CI) | Number of participants (studies) Follow‐up | Certainty of the evidence (GRADE) | Comment | |
| With standard referral letter | With CSM referral letter | |||||
| Dental attendance | Not reported | |||||
| Proportion of children with treated/untreated caries Assessed with intraoral examination Follow‐up: mean 8 months | 382 per 1000 | 375 per 1000 (277 to 481) | OR 0.97 (0.62 to 1.51) | 388 (1 RCT) | ⊕⊝⊝⊝ Very lowa,b,c | There may be little or no effect in the odds of getting necessary dental care with a standard referral letter compared to one based on the CSM of self‐regulation; the 95% CI ranged from 38% decrease to 50% increase in dental care. |
| Proportion of children with other treated/untreated oral health need | Not reported | |||||
| Adverse events | Not reported | |||||
| *The risk in the intervention group (and its 95% confidence interval) is based on the assumed risk in the comparison group and the relative effect of the intervention (and its 95% CI). CI: confidence interval; CSM: common‐sense model; OR: odds ratio; RCT: randomised controlled trial. | ||||||
| GRADE Working Group grades of evidence High certainty: we are very confident that the true effect lies close to that of the estimate of the effect. Moderate certainty: we are moderately confident in the effect estimate: The true effect is likely to be close to the estimate of the effect, but there is a possibility that it is substantially different. Low certainty: our confidence in the effect estimate is limited: The true effect may be substantially different from the estimate of the effect. Very low certainty: we have very little confidence in the effect estimate: The true effect is likely to be substantially different from the estimate of effect. | ||||||
aDowngraded two levels due to high risk of bias. bDowngraded one level for indirectness. cDowngraded two levels for imprecision.
Summary of findings 7. Referral to specific treatment facility versus generic advice letter to see a dentist.
| Referral to specific dental treatment facility versus letter advising parents to take their child to a dentist | ||||||
| Population: school children Setting: primary school in Saudi Arabia Intervention: referral to specific treatment facility Comparison: advice letter to see a dentist | ||||||
| Outcomes | Anticipated absolute effects* (95% CI) | Relative effect (95% CI) | Number of participants (studies) | Certainty of the evidence (GRADE) | Comments | |
| Risk with advice letter to see a dentist | Risk with referral to specific treating facility | |||||
| Dental attendance (number of dental visits) Follow‐up: median 11 months | 43 per 1000 | 39 per 1000 (15 to 107) | RR 0.91 (0.34 to 2.47) | 362 (1 RCT) | ⊕⊝⊝⊝ Very lowa,b,c,d | There may be little or no effect in dental attendance in the specific referral group compared to the generic advice letter group, with the 95% CI ranging from a 66% decrease to a 147% increase. |
| Proportion of children with treated/untreated caries | Not reported | |||||
| Proportion of children with other treated/untreated oral health need | Not reported | |||||
| Adverse events | Not reported | |||||
| *The risk in the intervention group (and its 95% confidence interval) is based on the assumed risk in the comparison group and the relative effect of the intervention (and its 95% CI). CI: confidence interval; RR: risk ratio. | ||||||
| GRADE Working Group grades of evidence High certainty: we are very confident that the true effect lies close to that of the estimate of the effect. Moderate certainty: we are moderately confident in the effect estimate: the true effect is likely to be close to the estimate of the effect, but there is a possibility that it is substantially different. Low certainty: our confidence in the effect estimate is limited: the true effect may be substantially different from the estimate of the effect. Very low certainty: we have very little confidence in the effect estimate: the true effect is likely to be substantially different from the estimate of effect. | ||||||
aDowngraded two levels due to high risk of bias. bDowngraded one level due to indirectness in the measurement of the outcome. cDowngraded two levels due to imprecision. dDowngraded one level due to inconsistency.
Background
Description of the condition
This is an update of a review first published in December 2017 (Arora 2017a).
Oral health is essential to general health, well‐being and quality of life (WHO 2003). The World Health Organization (WHO) defines it as "a state of being free from mouth and facial pain, oral and throat cancer, oral infection and sores, periodontal (gum) disease, tooth decay, tooth loss, other diseases and disorders that limit an individual's capacity in biting, chewing, smiling, speaking, and psychosocial well being" (WHO 2003).
The importance of children's oral health cannot be overestimated (Manton 2018), as oral diseases, including dental caries, are progressive and cumulative. Availability of services does not always translate to use of services. One national health survey carried out in the USA found that less than half of people aged 21 years or under used dental care in 2009, and only 14.2% used preventive dental services (CDC 2014).
Unrecognised disease and postponed care exacerbate oral and dental problems, leading to pain, discomfort and sometimes irreversible damage. Poor oral health significantly affects children's nutritional intake and consequently their general health, growth and development. The psychosocial impacts can be considerable, and include interference with daily activities, sleeping pattern, quality of life and parental output (AAPD 2008). Poor oral health in children may impede learning, activity and interactions with peers at school (WHO 2003). Such problems are compounded among children from deprived communities (Tickle 1999a; Newacheck 2000; Edelstein 2002; Public Health England 2020). Some of the oral diseases that affect children worldwide are described below.
Dental caries continues to be a common chronic childhood disease. Dental caries prevalence in 5‐year‐old children, as measured by Public Health England with the National Dental Epidemiology Programme survey in 2018 to 2019, was 23.4%, with an average of 3.4 decayed, missing or filled teeth in those who have decay experience (Public Health England 2020). According to data from the Montana Department of Public Health and Human Services, in the 2015 to 2016 school year, 14.2% of children screened in the 3‐ to 5‐year age group had untreated decay (Montana 2016). A recent study in India found that prevalence of caries is higher in the primary dentition than in the permanent dentition in children aged 5 to 12 years (Prabakar 2020). Over 50% of children aged 5 to 9 years in the USA experience tooth decay in primary dentition, and this figure is above 90% in some low‐ and middle‐income countries (Bagramian 2009). These findings demonstrate that dental caries is a present‐day public health crisis (Petersen 2003).
Several gingival diseases also affect children and adolescents with varying rates and severity. The prevalence of gingivitis has been estimated at 73% among school children between 6 and 11 years of age in Iran (Ketabi 2006). Similarly, the prevalence of gingivitis reported in sample of adolescents from Greece was 72.8% (Chrysanthakopoulos 2016). A recent study in India that aimed to measure the association between caries and gingivitis in children aged five to six years reported an 18.3% prevalence of gingivitis (Mahatani 2020).
Developmental defects of enamel have a significant impact on oral health and aesthetics in both primary and permanent dentition. Most epidemiological studies show that the frequency of appearance of these defects is on the rise in almost all populations (Robles 2013). It is of high clinical significance when dentine or pulp involvement ensues due to significant enamel loss or high susceptibility to caries (Pitts 2015).
Dental and facial trauma of varying intensity affects children. One systematic review published in 2015 reported a prevalence of dental trauma in children and adolescents (under 18 years of age) of 17.5%, with variation among different geographic regions (Azami‐Aghdash 2015). Timely intervention may alleviate future complications in children with dental trauma.
A study conducted in Xian (China) found a high prevalence of malocclusion in children with primary dentition (66.3%; Zhou 2016). Identification of modifiable factors that can be addressed through preventive and interceptive orthodontics can save elaborate and expensive treatments later (Pruthi 2013).
Oral diseases impose considerable financial, social and personal burdens. In 2015, the global economic burden of dental diseases for a year amounted to USD 442 billion, including both direct treatment costs and indirect costs in terms of productivity losses owing to absenteeism at school and work (Listl 2015). Advanced disease may necessitate more complex and costly treatments such as root canal therapies, extractions or treatment under general anaesthesia (WHO 2003; Australian Institute of Health 2013). The World Dental Federation (FDI) calls for global action on oral diseases, highlighting the substantial burden on individuals and communities as a result of pain and suffering, impairment of function and reduced quality of life (FDI 2015).
Description of the intervention
School dental screening (or 'oral health/dental examination', 'dental assessment', 'dental certificates', 'dental check‐up') refers to a brief visual examination of the oral cavity of children carried out in a school setting (Tickle 1999b; AAPD 2008; Irish Guideline 2012; Janakiram 2016). Parents then receive information on their child's oral health status and treatment needs. Follow‐up methods can be categorised as:
conventional methods (i.e. sending a referral card, information letter or consent form (Hebbal 2005; Milsom 2006));
additional methods, such as phone call reminders and incentives (Reiss 1982), or intensive follow‐up by means of personalised letters (Zarod 1992).
The focus of a school dental screening programme is not merely to identify children with oral health problems, but also to act as a vehicle to bring these children into contact with oral health services (Donaldson 2001; Morgan 2013). It is imperative to follow up screened children to measure the effectiveness of screening in terms of increased uptake of services, for example, registration with a dentist and dental attendance (Zarod 1992; NHS 2000; Milsom 2006; Cunningham 2009; Alayadi 2021).
Hence, the objective of screening is twofold, namely:
to identify screen‐positive cases; and
to ensure these cases are followed‐up for appropriate management.
School dental screening is usually a part of school health services and its model, process and objectives vary depending on the individual healthcare delivery policies of each country (Jenner 1986; Milsom 1995; Tickle 1999b; Donaldson 2001; AAPD 2008; Irish Guideline 2012). Programmes can be broadly classified based on the following criteria.
-
Personnel involved
Dentist (Milsom 2006)
Dentally‐qualified health professionals such as dental hygienists (Locker 2004), or dental nurses (Morgan 2013)
Health professionals qualified in areas other than dentistry, such as doctors (Bader 2004; Rowan‐Legg 2013)
-
Methods used
Exclusively visual screening (Tantawi 2015)
Visual screening with tongue blade (Tantawi 2015)
Mouth mirror and probe (Tantawi 2015)
Criteria‐based screening (referral of children on the basis of pre‐established checklist of criteria) versus traditional screening (referral based on the screening dentist's opinion) (Milsom 1999; Kearney‐Mitchell 2006)
Targeted screening (for a specified or high‐risk population; Locker 2004; Chong 2011) versus universal screening (for all children in a population or subpopulation; Milsom 2006)
Compulsory screening at school entry (AAPD 2008; Irish Guideline 2012) versus optional screening (Hebbal 2005)
The effectiveness of school dental screening depends on adequate follow‐up and treatment. Treatment services may be:
provided within school premises (screening and treatment services operate as single or linked entity; Irish Guideline 2012); or
facilitated outside school premises (screening and treatment services function as distinct entities; Milsom 2006).
The literature suggests that children belonging to lower‐income groups and children without dental insurance are less likely to visit the dentist (California HealthCare Foundation 2008). Hence, school dental screening outcomes may depend on whether cost of treatment is:
charged to parents;
subsidised; or
free (Milsom 2006).
Figure 1 illustrates a schema of post‐screening referral and treatment processes.
1.
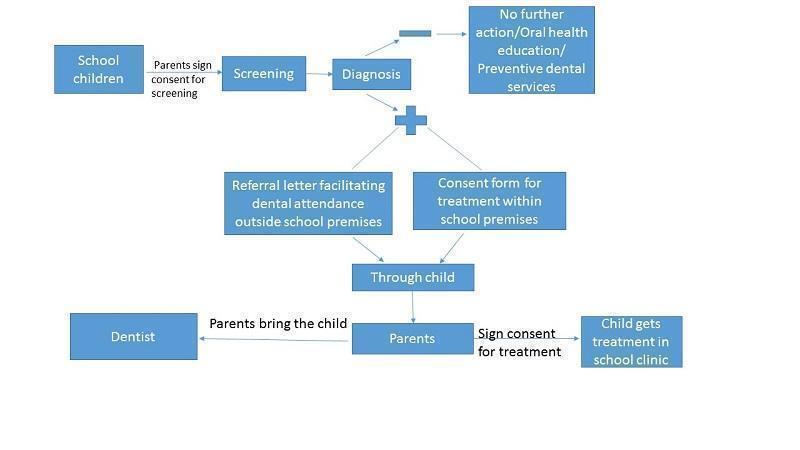
A schema of school dental screening process.
How the intervention might work
Regular oral health assessment is imperative for protecting, improving and promoting children's oral health. Early diagnosis of oral conditions is crucial for avoiding short‐term complications and long‐term effects of advanced disease. School dental screening aims to detect and intercept disease before the child would normally present for treatment, and make children and parents aware of the condition and its future complications.
A school dental check‐up programme in Australia demonstrated screening as a less costly and more effective intervention than the standard of care (Nguyen 2017). This reinforces the evidence that reductions in morbidity achieved through screening imply potential cost benefits, both in terms of reduced treatment costs and productivity losses (Listl 2015). Targeting individuals at higher risk may increase cost‐effectiveness (Manton 2018).
The school provides an ideal setting for oral health screening in children. The benefits of early diagnosis and intervention can be reaped for sustainable oral health all through these years and into adulthood. WHO endorses school dental screening as an efficient and effective way to reach over one billion children worldwide; and through them, families and communities (WHO 2003).
Why it is important to do this review
School dental screening is one of the most debated aspects of healthcare systems, public health practices and health policy discussions (Janakiram 2016). The literature presents contrasting and contradictory results.
Some studies suggest that screening is an effective public health measure (Zarod 1992; Donaldson 2001; Hebbal 2005). One 1994 trial reported that personalised referral letters stimulate greater dental attendance than non‐specific referral letters (Burden 1994). A more recent study suggested that vigorous follow‐up of children may lead to improved dental attendance rates, although the acceptability to parents and the cost‐effectiveness of putting significant resources into elaborate follow‐up procedures would need to be scientifically assured (Praveen 2014).
In contrast, large cluster‐randomised trials carried out in the UK did not demonstrate that school dental screening was effective at reducing untreated dental caries (Milsom 2006). Additional analyses of data from these trials suggested that screening also failed to produce worthwhile benefits for the screen‐positive population, as less than half of these children attended the dentist; and of those who did attend, less than a quarter received appropriate treatment. Similarly, a cluster‐randomised trial conducted in Scotland showed that school dental screening did not increase registration at the dentist in a group of 12‐ to 13‐year‐old children (Cunningham 2009). Some authors consider that school dental screening as a public health practice is motivated more by politics than by science, because, despite the strong emphasis of policy‐makers on the importance of this intervention, and despite the heavy expenditure in terms of financial and manpower resources, there is a lack of clear evidence to demonstrate that this process is effective in improving the oral health of the population (Tickle 1999b; Threlfall 2006; Rodgers 2007; Milsom 2008).
This is the second update of a review originally published in December 2017 and first updated in August 2019. It synthesises the evidence regarding the effectiveness of school dental screening programmes for improving oral health. Analysis of the existing literature may help to identify factors that influence the successful provision of school dental screening. We hope that our results can aid government policy‐makers, programme planners at various levels, and administrators in health and education sectors to tailor appropriate school dental health programmes, benefiting the community without unnecessarily burdening fiscal sectors. This review will also be relevant to general dental practitioners, paediatric dentists and oral health promotion teams; and will be of interest to parents, teachers and all those involved in working with children.
Objectives
To assess the effectiveness of school dental screening programmes on overall oral health status and use of dental services.
Methods
Criteria for considering studies for this review
Types of studies
We included randomised controlled trials (RCTs) where the unit of randomisation was a group of children (clustered by school or class, or both) or the individual child.
Types of participants
Eligible studies included children or adolescents (aged 3 to 19 years) attending a school in any country. Participants could have primary, permanent or mixed dentition.
Inclusion was independent of level of dental disease or dental caries at the start of the study, current dental treatment, dentist attendance levels and nationality. We included studies regardless of whether dentists, dental nurses or dental hygienists performed the visual inspection of the child's oral cavity. Given the focus of this review, we excluded studies that were not predominantly carried out in a school setting.
Types of interventions
School dental screening versus placebo or no screening
School dental screening A versus B (where A and B refer to different types of screening based on the classification presented above)
Exclusion criteria
Screening without a specified follow‐up plan or with follow‐up period shorter than three months
Oral health assessment programmes for children attending special schools
Dental examination performed by personnel other than those licensed or trained in the process as per state laws (e.g. school teachers, medical practitioners)
Types of outcome measures
We assessed all primary and secondary outcome measures based on duration as follows.
Short‐term effects (minimum follow‐up of three months up to two years; NICE guideline 2004)
Long‐term effects (follow‐up of more than two years; Irish Guideline 2012)
Primary outcomes
Dental attendance (registration and follow‐up dental appointments)
Proportion of children with treated and untreated caries
Proportion of children with other treated and untreated oral health needs (e.g. malocclusion, trauma)
Secondary outcomes
Caries, measured by any validated index (in primary and permanent teeth separately)
Gingivitis measured by any validated index
Developmental defects of enamel measured by any validated index
Malocclusion or orthodontic treatment needs, measured by any validated index
Trauma to teeth measured by any validated index
Cost‐effectiveness
Adverse events
Search methods for identification of studies
Cochrane Oral Health's Information Specialist conducted systematic searches for RCTs and controlled clinical trials (CCTs). Because CENTRAL is updated monthly with newly published RCTs indexed in Embase and other databases, we restricted our search of Embase to the past six years. We applied no other publication date restrictions, and no language restrictions, when searching the electronic databases.
Electronic searches
Cochrane Oral Health's Information Specialist searched the following electronic databases.
Cochrane Oral Health's Trials Register (searched 15 October 2021; Appendix 1).
Cochrane Central Register of Controlled Trials (CENTRAL) in the Cochrane Register of Studies (Issue 9, 2021, searched 15 October 2021; Appendix 2).
MEDLINE Ovid (1946 to 15 October 2021; Appendix 3).
Embase Ovid (15 September 2016 to 15 October 2021; Appendix 4).
Subject strategies were modelled on the search strategy designed for MEDLINE Ovid. Where appropriate, they were combined with subject strategy adaptations of the highly sensitive search strategies designed by Cochrane for identifying RCTs and CCTs, as described in the Cochrane Handbook for Systematic Reviews of Interventions (Lefebvre 2022).
Searching other resources
We searched the following trial registries.
US National Institutes of Health Ongoing Trials Register ClinicalTrials.gov (clinicaltrials.gov; searched 15 October 2021; Appendix 5)
World Health Organization International Clinical Trials Registry Platform (apps.who.int/trialsearch; searched 15 October 2021; Appendix 6)
We searched the reference lists of included studies and relevant systematic reviews for further studies.
We checked that none of the included studies in this review were retracted due to error or fraud.
We did not perform a separate search for adverse effects of interventions used, considering only the adverse effects described in included studies.
Data collection and analysis
Selection of studies
Two review authors (AA, SK) independently screened the titles and abstracts recovered by the electronic searches and eliminated obviously ineligible studies. The search was designed to be sensitive and include CCTs; these were filtered out early in the selection process if they were not randomised. We obtained the full‐text copies of all potentially eligible studies, and two review authors (EP, SKN) read through them to identify the studies that met all our inclusion criteria. These two review authors resolved any disagreements by discussion, consulting a third author (NMI), if necessary, to reach consensus. We recorded all studies that reached the full‐text assessment stage but did not meet our inclusion criteria in the Characteristics of excluded studies table, noting the reason for exclusion. We assessed articles in languages other than English by their abstracts, where possible, and translated the full text of articles we considered potentially eligible.
Data extraction and management
Two review authors (AA and SKN) independently extracted the data from each trial. They were not blinded to the authors of the included studies. We resolved any disagreement by discussion or by consulting a third review author (NMI). We extracted the data using a customised data extraction form, which we designed following the guidance in the Cochrane Handbook for Systematic Reviews of Interventions (Higgins 2011a). We entered the study details in the Characteristics of included studies table in Review Manager 5 (RevMan 5; Review Manager 2014).
We recorded the following details for each included trial.
Publication details such as year of publication, language
Country of origin
Details of participants, including demographic characteristics
Trial characteristics (sample size; method of randomisation; allocation concealment; blinding; method of assessing the outcomes; and dropouts, if any)
Type of intervention and comparison
Details of the outcomes reported
Duration of follow‐up
Location and costs of follow‐up appointments
Results of the intervention
Funding details
We contacted the authors of included studies when we needed clarification of details or any additional data, via email whenever possible.
Assessment of risk of bias in included studies
Two review authors (SKN and AA) independently assessed the risk of bias in the included trials in the following domains.
Random sequence generation (selection bias)
Allocation concealment (selection bias)
Blinding of participants and personnel (performance bias)
Blinding of outcome assessment (detection bias)
Incomplete outcome data (attrition bias)
Selective outcome reporting (reporting bias)
Risk of bias specific to cluster‐randomised trials
Other biases
For each of these domains, we judged whether each study was at 'high', 'low' or 'unclear', risk of bias, following the guidance in the Cochrane Handbook for Systematic Reviews of Interventions (Higgins 2011b). We contacted the trial authors if details were missing from the publications or were unclear. We resolved disagreements through consensus. We recorded our judgements and justifications in risk of bias tables for each included study and generated a risk of bias summary graph and figure. We used these judgements when grading the overall certainty of evidence for each comparison and outcome in the summary of findings tables. We summarised the risk of bias according to the recommendations in the Cochrane Handbook for Systematic Reviews of Interventions as follows (Higgins 2011b).
| Risk of bias | Interpretation | Within study | Across studies |
| Low risk of bias | Plausible bias unlikely to seriously alter the results | Low risk of bias for all key domains | Most information is from studies at low risk of bias. |
| Unclear risk of bias | Plausible bias that raises some doubt about the results | Unclear risk of bias for one or more key domains | Most information is from studies at low or unclear risk of bias. |
| High risk of bias | Plausible bias that seriously weakens confidence in the results | High risk of bias for one or more key domains | The proportion of information from studies at high risk of bias is sufficient to affect the interpretation of results. |
Measures of treatment effect
For dichotomous outcomes, such as dental attendance, we used the number of events per arm and calculated risk ratios (RRs) with 95% confidence intervals (CIs). For receipt of dental care, we calculated odds ratios (ORs); however, receipt of dental care is a surrogate measure as it does not directly equate to completion of treatment in the children thereafter.
For continuous outcomes, we intended to use means and standard deviations (SDs) presented in the studies to calculate mean differences (MDs) and CIs. We intended to use standardised mean difference (SMD) if studies used different scales to measure the same outcome. If data were expressed on shorter ordinal scales, we intended to explore the possibility of converting them to dichotomous outcomes. If data were expressed on long ordinal scales, we intended to analyse them as continuous data. If outcomes had been reported both at baseline and at follow‐up or at trial endpoints, we would have used end scores, as they are the most commonly reported. However, we did not find any such data.
Unit of analysis issues
We encountered two types of non‐standard study designs in this review.
Repeated observations on participants
Cluster‐randomised trials
In cases of repeated observations on participants for our primary outcomes, we followed the method described in section 9.3.4 of the Cochrane Handbook for Systematic Reviews of Interventions (Deeks 2011).
In cluster‐randomised trials, we handled the data following the method described in section 16.3 of the Cochrane Handbook for Systematic Reviews of Interventions (Higgins 2011c). In cluster‐randomised trials, the unit of analysis was the cluster.
In trials where adverse effects were described as counts, we intended to follow the method described in Section 9.2.5 of the Cochrane Handbook for Systematic Reviews of Interventions (Deeks 2011). However, we did not find any such data.
Dealing with missing data
We intended to use the methods in section 16.1.2 of the Cochrane Handbook for Systematic Reviews of Interventions to estimate missing standard deviations (Higgins 2011c). However, no trials included in our review had missing standard deviations. We contacted trial authors to try to obtain the missing intracluster correlation coefficient (ICC).
Assessment of heterogeneity
In meta‐analyses, we assessed the heterogeneity using a Chi² test, where a P value less than 0.1 indicates statistically significant heterogeneity. We quantified heterogeneity using the I² statistic as follows (Higgins 2003).
0% to 40% implies slight heterogeneity.
30% to 60% implies moderate heterogeneity.
50% to 90% implies substantial heterogeneity.
75% to 100% implies very substantial ('considerable') heterogeneity.
If we had found very substantial heterogeneity (I² > 75%) that could not be explained by the subgroup analyses, we would not have conducted the meta‐analysis. However, we did not encounter this situation.
Assessment of reporting biases
If we had included more than 10 studies in a meta‐analysis, we would have assessed the possible presence of reporting bias by testing for asymmetry in a funnel plot. If present, we planned to carry out a statistical analysis using the methods described in section 10.4.3.1 of the Cochrane Handbook for Systematic Reviews of Interventions (Sterne 2011).
Data synthesis
We analysed the data using RevMan 5 (Review Manager 2014). We meta‐analysed the data available from studies with similar comparisons and outcomes, using a random‐effects model. With this approach, the confidence intervals for the average intervention effect were wider than those obtained using a fixed‐effect approach, leading to a more conservative interpretation. For data synthesis of dichotomous data, we used RRs for attendance and ORs for receipt of dental care. For continuous data, we used end scores when available.
Subgroup analysis and investigation of heterogeneity
Had there been significant heterogeneity, we would have explored the reasons by performing the following subgroup analyses.
Age group (age 3 to 5 years, 6 to 12 years, 13 to 19 years; WHO 2013)
Targeted or universal screening
Participants offered post‐screening treatment within the school setting or referred for treatment outside the school setting
Treatment charges borne by parents: full charge; subsidised costs; no cost
However, we did not find enough trials to perform subgroup analysis.
Sensitivity analysis
Had there been sufficient included studies, we would have performed the following sensitivity analyses.
Including only studies at low risk of bias
Using the fixed‐effect model for meta‐analysis
Using different ICC estimates where these values were missing in studies
Summary of findings and assessment of the certainty of the evidence
We used the GRADE approach to interpret findings (Schünemann 2011). We used GRADE Profiler software (GRADEpro GDT), and imported data from RevMan 5 (Review Manager 2014), to create summary of findings tables for the main comparisons and outcomes (receipt of dental care/proportion of children treated for dental caries, dental attendance). We had not planned for prioritisation of the comparisons in our protocol (Arora 2017b). As we had nine comparisons in total, we undertook a prioritisation exercise. The lead review author requested that the other review authors score the comparisons independently (1 to 9, where 1 was most important and 9 was the least important). Based on the combined score, we prioritised seven comparisons for presentation as summary of findings tables. We presented two other comparisons in additional tables.
The summary of findings tables provide information concerning the overall certainty of the evidence from the trials, the magnitude of effect of the interventions examined and the sum of available data on the key outcomes. The GRADE approach considers 'certainty' to be a judgement of the extent to which we can be confident that the estimates of effect are correct (Schünemann 2011). We initially graded each body of evidence from RCTs as high certainty, then downgraded it by one, two or three levels depending on the following five considerations.
Limitations in the design of the studies
Indirectness (or applicability) of the evidence
Inconsistency of results
Imprecision of the results
Possibility of publication bias
A certainty level of 'high' means we are very confident that the true effect lies close to that of the estimate of the effect for an outcome. A judgement of 'moderate' certainty indicates that the true effect is likely to be close to the estimate of the effect, but acknowledges the possibility that it could be substantially different. 'Low' and 'very low' certainty evidence limit our confidence in the effect estimate (Balshem 2011).
Results
Description of studies
Results of the search
Our search strategies recovered 3749 records from the electronic databases, and we found another two records by cross‐referencing included trials and other systematic reviews. After deduplication, we had 2709 records, of which we eliminated 2679 through title and abstract screening. We obtained full‐text copies of the 30 remaining records. Two review authors (EP, SKN) independently assessed all of these papers to determine their eligibility, excluding 17 reports from completed studies and one report from an ongoing study. Eight studies (12 reports) met our inclusion criteria (Zarod 1992; Burden 1994; Hebbal 2005; Milsom 2006; Cunningham 2009; Praveen 2014; Nelson 2019; Alayadi 2021). One of these had been included in the previous version of this review as an ongoing study, and had since been published (Alayadi 2021). The Characteristics of included studies and Characteristics of excluded studies tables provide details of the studies we examined and the reasons for inclusion or exclusion. Figure 2 shows the flow of studies.
2.

Study flow diagram.
We contacted authors of six included trials but only received clarifications on Alayadi 2021 (see Characteristics of included studies).
Included studies
See Characteristics of included studies table.
Characteristics of the trial settings and investigators
We included eight trials (12 reports) in the review. All were in the English language. The trials were set in the UK (Zarod 1992; Burden 1994; Milsom 2006; Cunningham 2009), India (Hebbal 2005; Praveen 2014), the USA (Nelson 2019) and Saudi Arabia (Alayadi 2021).
All trials were conducted in a school setting. Six were cluster‐randomised trials (Hebbal 2005; Milsom 2006; Cunningham 2009; Praveen 2014; Nelson 2019; Alayadi 2021), and two were individually randomised trials (Zarod 1992; Burden 1994).
Of the eight trials, five provided grant information: two had received funding from the UK National Health Service (Milsom 2006; Cunningham 2009), one from the Royal College of Physicians and Surgeons of Glasgow, Scotland (Burden 1994), one from the National Institutes of Health (Nelson 2019) and one from the Saudi Cultural Bureau of London (Alayadi 2021).
Characteristics of the participants
All eight trials included both boys and girls.
The minimum age of participants was four years (Zarod 1992), and the maximum age was 15 years (Hebbal 2005). Two studies included both primary and secondary school children, so the age ranges were wide (6 to 15 years in Hebbal 2005; 6 to 13 years in Praveen 2014). Nelson 2019 recruited elementary school children aged 5 to 10 years, and Alayadi 2021 included primary school children aged 6 to 11 years. The age ranges were more restricted in Zarod 1992 (four to six years), Milsom 2006 (six to eight years), Burden 1994 (11 to 12 years) and Cunningham 2009 (12 to 13 years).
The minimum sample size was 201 children (Burden 1994); and the maximum sample size was 16,864 children in 168 clusters (Milsom 2006).
Characteristics of the interventions
The eight trials evaluated screening versus no screening or compared screening variables (e.g. different criteria for screening, different adjuncts to screening or different types of referral letter after screening).
1. Traditional screening versus no screening
In 'traditional screening', the inspecting dental professional provides a referral card if they consider that the child needs to attend a dentist.
Two four‐arm cluster‐RCTs (Milsom 2006; Cunningham 2009), and one two‐arm cluster‐RCT (Praveen 2014) compared traditional screening to no screening. Zarod 1992 randomised individual participants to one of two arms: traditional screening or screening without any referral. We consider the control group in this trial to be comparable to a no‐screening control, as the parents received no information on their children's oral health.
2. Criteria‐based screening versus no screening
In criteria‐based screening, the dental professional has pre‐established criteria for referring a child to a dentist. Two four‐arm cluster‐RCTs compared criterial based screening to no screening (Milsom 2006; Cunningham 2009).
3. Criteria‐based screening compared to traditional screening
Milsom 2006 and Cunningham 2009 compared referral based on pre‐established criteria with referral based on the opinion of the dental professional.
4. Criteria‐based screening with specific referral versus criteria‐based screening with non‐specific referral
One individually randomised trial compared different referral letters for increasing attendance at dental and orthodontic clinics (Burden 1994). The specific referral letter in the intervention group advised parents to seek advice about treatment to straighten their child's teeth, while the control group was given a referral letter with non‐specific advice to attend a dentist.
5. Traditional screening with motivation versus traditional screening alone
Hebbal 2005 compared the effects of screening supplemented with oral health motivation or education sessions versus screening and referral alone. The traditional screening with motivation also included an offer of free treatment.
6. Common‐sense model referral letter plus dental information guide versus standard referral letter
The common‐sense model (CSM) is a self‐regulatory framework that outlines how an individual's cognitive and emotional perception of their chronic illness guides their coping and action planning to self‐manage the disease (key constructs: identity, cause, consequence, timeline, control). The dental information guide (DIG) is a pictographic brochure providing facts and myths about dental caries, information on making dental appointments, Medicaid access, transportation, and a list of dentists in the area. The standard referral letter was based on guidelines for oral health screening in Ohio schools and was consistent with others used across the country.
Nelson 2019 evaluated the CSM referral letter plus dental information guide compared to the standard referral letter. The information provided to parents in the intervention group communicated the importance of primary teeth having no cavities to protect permanent teeth, and explained that caries is a chronic rather than an acute disease.
7. Common‐sense model referral letter versus standard referral letter
Nelson 2019 also evaluated the CSM referral letter alone (without dental information guide) compared to a standard referral letter.
8. Common‐sense model referral letter plus dental information guide versus common‐sense model referral letter alone
Nelson 2019 also evaluated the CSM referral letter plus dental information guide compared to the CSM referral letter alone.
9. Referral to specific treatment facility versus generic advice letter to see a dentist
Alayadi 2021 compared the effects of referral to a specific treatment facility (i.e. parents of screen‐positive children were referred to the dental college hospital) versus an advice letter to see a dentist (i.e. parents of screen‐positive children received a letter informing them of their child's dental status and advising them to take their child to the dentist).
Outcomes
We planned to analyse outcome measures based on the definition of follow‐up duration as short‐term (minimum follow‐up of three months to two years) and long‐term (follow‐up of more than two years). However, the follow‐up period of all included trials was shorter than two years, hence we reported only short‐term effects of school dental screening.
Seven trials used attendance at a dental clinic (general dental practitioner) as a primary outcome (Zarod 1992; Burden 1994; Hebbal 2005; Milsom 2006; Cunningham 2009; Praveen 2014; Alayadi 2021). Burden 1994 measured attendance at a general dental clinic as well as at a specialist orthodontist.
Nelson 2019 measured receipt of dental care as the primary outcome. We considered this a surrogate outcome, as 'receipt of care' does not necessarily equate to completion of required dental treatment. Nelson 2019 referred to secondary outcomes but did not provide results for these.
Milsom 2006 measured change in prevalence of dental caries per child as the primary outcome. Secondary outcomes were sepsis, plaque or calculus and trauma to the permanent incisor teeth. A secondary report further followed up the children who attended the dentist, and measured the treatment these children received.
Alayadi 2021 measured change in decayed primary and permanent teeth (overall dental status) as the primary outcome. Secondary outcomes were change in decayed primary teeth, change in decayed permanent teeth and change in proportion of children who visited the dentist (dental attendance).
Intracluster correlation coefficient and data adjustment to minimise clustering effect
Two studies reported the value of ICC for dental caries (Milsom 2006; Alayadi 2021). Both studies reported the same ICC (0.03), which we used to calculate the effect estimate for dental attendance for other cluster‐randomised trials in this review. We adjusted the data to minimise clustering effect (Adam 2005; see Table 8).
1. Data adjusted to minimise clustering effect.
| Data values for total number and events to be divided by effect estimate across all studies Effect estimate: 1 + (M − 1)ICC M = average cluster size ICC = 0.03 (borrowed from Milsom 2006) |
Group |
Total number of participants (original) |
Total number of participants (adjusted) |
Events ‒ original (children attending dental clinic) |
Events ‒ adjusted (children attending dental clinic) |
|
Cunningham 2009 1 + (15 − 1).03 = 1.42 |
Control arm | 819 | 577 | 129 | 91 |
| Traditional arm | 1175 | 827 | 165 | 116 | |
| Criteria‐based arm | 958 | 675 | 151 | 107 | |
|
Milsom 2006 1 + (42 − 1).03 = 2.23 |
Control arm | 4226 | 1895 | 1624 | 728 |
| Traditional arm | 4418 | 1981 | 1838 | 824 | |
| Criteria‐based arm | 4087 | 1833 | 1695 | 760 | |
|
Praveen 2014 1 + (8 − 1).03 = 1.21 |
Contol arm | 300 | 248 | 80 | 67 |
| Intervention arm | 300 | 248 | 54 | 45 | |
|
Alayadi 2021 1 + (69‐1).03 = 3.04 |
Control arm | 561 | 185 | 24 | 8 |
| Intervention arm | 537 | 177 | 22 | 7 |
ICC: intracluster correlation coefficient
Excluded studies
We excluded 17 studies (see Characteristics of excluded studies table). Six were not RCTs, and five were oral health promotion trials rather than screening trials.
One trial was in abstract form (Baglee 2000), and another did not explain if participants were divided randomly into intervention or control groups (Binder 1973).
Of the remaining four RCTs, one did not send a communication to parents after screening (Rodgers 2007); two did not investigate use of services or reduction of disease after screening (Locker 2004; Tantawi 2015); and one had a follow‐up period shorter than three months (Donaldson 2001).
Risk of bias in included studies
We documented the risk of bias of included studies based on the full‐text articles. Wherever there was a need for clarification, we tried to contact the study authors. Based on the available data, we assessed the risk of bias as low, high or unclear.
We assessed two trials at low overall risk of bias (Milsom 2006; Cunningham 2009); three at high overall risk (Hebbal 2005; Nelson 2019; Alayadi 2021); and three at unclear overall risk (Zarod 1992; Burden 1994; Praveen 2014).
See the risk of bias tables within the Characteristics of included studies table for further details. For a graphical summary, see Figure 3 and Figure 4.
3.

Risk of bias graph: review authors' judgements about each risk of bias item presented as percentages across all included studies.
4.

Risk of bias summary: review authors' judgements about each risk of bias item for each included study.
Allocation
Only four trials adequately reported the method of sequence generation (Milsom 2006; Cunningham 2009: Nelson 2019; Alayadi 2021); and five adequately reported concealment of allocation (Burden 1994; Milsom 2006; Cunningham 2009; Nelson 2019; Alayadi 2021). Four studies were at unclear risk of selection bias (Zarod 1992; Burden 1994; Hebbal 2005; Praveen 2014).
Blinding
Zarod 1992 and Praveen 2014 did not report blinding of participants and personnel; therefore, we considered them at unclear risk of performance and detection bias. Hebbal 2005 and Alayadi 2021 did not blind participants (high risk of performance bias). Alayadi 2021 measured dental attendance through self‐reported questionnaire (high risk of detection bias); whereas Hebbal 2005 used a computer program to assess the main outcome 'dental attendance' (low risk of detection bias). Four trials blinded participants and assessors (low risk of performance or detection bias; Burden 1994; Milsom 2006; Cunningham 2009; Nelson 2019).
Incomplete outcome data
In this review, not attending or not registering at a dental clinic is an outcome measure rather than attrition. Hence, we redefined attrition bias for this systematic review as 'parents not receiving call letters from school'. Based on this definition, all seven trials reporting dental attendance were at low risk of attrition bias.
Nelson 2019 reported receipt of dental care as the primary outcome. The total number of children randomised was 694, but the number analysed was 597. We categorised the risk of attrition bias as unclear.
Selective reporting
We judged two studies at unclear risk of selection bias: Nelson 2019 did not report the secondary outcomes of change in illness perception and change in behaviour intention of parents as pre‐stated in the trial registry (NCT02395120); and Alayadi 2021 stated that the follow‐up period was 12 months as per the protocol, but the reported mean follow‐up period was 11 months. The other six included trials were at low risk of reporting bias as they reported all outcomes listed in the methods section.
Other potential sources of bias
We identified no other potential sources of bias in seven trials (Zarod 1992; Burden 1994; Hebbal 2005; Milsom 2006; Cunningham 2009; Praveen 2014; Alayadi 2021). We considered Nelson 2019 to be at high risk of other bias, as the participants were initially allocated to five arms, but the trial authors decided to combine the participants who received the CSM letter with those who received a reduced CSM letter; and the participants who received the CSM letter plus dental information guide with the participants who received the reduced CSM letter plus dental information guide.
Effects of interventions
See: Table 1; Table 2; Table 3; Table 4; Table 5; Table 6; Table 7
Seven trials presented dental attendance as the main outcome of a school dental screening intervention (Burden 1994; Hebbal 2005; Milsom 2006; Cunningham 2009; Praveen 2014; Alayadi 2021) and one trial measured receipt of dental care (Nelson 2019). Two trials reported prevalence of dental caries (Milsom 2006; Alayadi 2021) and one measured trauma to the teeth (Milsom 2006).
No studies measured any of our other outcomes (proportion of children with other untreated oral health needs; gingivitis measured by any validated index; developmental defects of enamel measured by any validated index; malocclusion or orthodontic treatment needs measured by any validated index; cost‐effectiveness and adverse events), so we could not evaluate the effect of school dental screening programmes on these outcomes.
1. Traditional screening versus no screening
See Table 1.
Four studies (three in the UK and one in India) with 6281 participants evaluated the outcome of dental attendance under the comparison of traditional screening versus no screening (Zarod 1992; Milsom 2006; Cunningham 2009; Praveen 2014). Of these, Zarod 1992 was the only individually randomised trial. The pooled I² measure for heterogeneity was substantial, possibly because we used the ICC value provided by Milsom 2006 for Cunningham 2009 and Praveen 2014, neither of which provided their ICC values. Due to this inconsistency, and unclear risk of bias, we downgraded the evidence to very low certainty, and we are unable to draw conclusions about this comparison (Analysis 1.1; Figure 5).
1.1. Analysis.

Comparison 1: Traditional screening versus no screening, Outcome 1: Dental attendance
5.

Forest plot of comparison: 1 Traditional screening versus no screening, outcome: 1.1 Dental attendance
Milsom 2006 measured prevalence of dental caries as mean number of teeth with active caries in primary teeth (dt) and permanent teeth (DT). However, post‐intervention changes of dt and DT from baseline were not significant, and the authors presented the data as binary outcomes of reduction from baseline (yes/no). As a result, we did not have data to conduct a meta‐analysis. Likewise, Milsom 2006 reported the prevalence of trauma to the permanent incisor teeth as a dichotomous outcome (reduction from baseline (yes/no)), and we were unable to include this data in a meta‐analysis.
2. Criteria‐based screening versus no screening
See Table 2.
Two UK‐based trials evaluated criteria‐based screening versus no screening (Milsom 2006; Cunningham 2009). They suggested a possible small benefit for criteria‐based screening over no screening in terms of dental attendance (pooled RR 1.07, 95% CI 0.99 to 1.16; 4890 participants; low‐certainty evidence; Analysis 2.1).
2.1. Analysis.

Comparison 2: Criteria‐based screening versus no screening, Outcome 1: Dental attendance
For secondary outcomes, see comments on Milsom 2006 in '1. Traditional screening versus no screening' above.
3. Criteria‐based screening versus traditional screening
See Table 3.
Two UK‐based trials evaluated criteria‐based screening versus traditional screening (Milsom 2006; Cunningham 2009). Criteria‐based screening resulted in little or no difference in dental attendance compared to traditional screening (pooled RR 1.01, 95% CI 0.94 to 1.08; 5316 participants; very low‐certainty evidence; Analysis 3.1).
3.1. Analysis.

Comparison 3: Criteria‐based screening versus traditional screening, Outcome 1: Dental attendance
For secondary outcomes, see comments on Milsom 2006 in '1. Traditional screening versus no screening' above.
4. Criteria‐based screening with specific referral versus criteria‐based screening with non‐specific referral
See Table 4.
One trial carried out in the UK evaluated criteria‐based screening with specific referral versus criteria‐based screening with non‐specific referral (Burden 1994). Criteria‐based screening with a specific referral letter can increase attendance at general dental clinics compared to criteria‐based screening with a non‐specific referral letter (RR 1.39, 95% CI 1.09 to 1.77; 201 participants; very low‐certainty evidence; Analysis 4.1), and increase attendance at orthodontic clinics (RR 1.90, 95% CI 1.18 to 3.06; 201 participants; very low‐certainty evidence; Analysis 4.1).
4.1. Analysis.

Comparison 4: Criteria‐based screening with specific referral versus criteria‐based screening with non‐specific referral, Outcome 1: Dental attendance
5. Traditional screening with motivation versus traditional screening alone
See Table 5.
One trial carried out in India evaluated traditional screening with motivation versus traditional screening alone (Hebbal 2005). Traditional screening with motivation can increase dental attendance compared to traditional screening alone (RR 3.08, 95% CI 2.57 to 3.71; 2486 participants; very low‐certainty evidence; Analysis 5.1).
5.1. Analysis.

Comparison 5: Traditional screening with motivation versus traditional screening alone, Outcome 1: Dental attendance
6. Common‐sense model referral letter plus dental information guide versus standard referral letter
See Table 9.
2. Common‐sense model referral letter plus dental information guide versus standard referral letter.
| CSM referral letter plus DIG versus standard referral letter | ||||||
| Population: school children Setting: primary schools in USA Intervention: CSM referral letter plus DIG Comparison: standard referral letter | ||||||
| Outcomes | Anticipated absolute effects* (95% CI) | Relative effect (95% CI) | Number of participants (studies) Follow‐up | Certainty of the evidence (GRADE) | Comment | |
| With standard referral letter | With referral letter based on CSM plus DIG | |||||
| Dental attendance | Not reported | |||||
| Proportion of children with treated/untreated caries assessed with: intraoral examination Follow‐up: mean 8 months | 382 per 1000 | 438 per 1000 (336 to 544) | OR 1.26 (0.82 to 1.93) | 395 (1 RCT) | ⊕⊝⊝⊝ Very lowa,b,c | There may be little or no difference between the two letter types in terms of their effect on the proportion of children with treated or untreated caries. |
| Proportion of children with other treated/untreated oral health need | Not reported | |||||
| Adverse events | Not reported | |||||
| *The risk in the intervention group (and its 95% confidence interval) is based on the assumed risk in the comparison group and the relative effect of the intervention (and its 95% CI). CI: confidence interval; CSM: common‐sense model; DIG: dental information guide; OR: odds ratio; RCT: randomised controlled trial. | ||||||
| GRADE Working Group grades of evidence High certainty: we are very confident that the true effect lies close to that of the estimate of the effect. Moderate certainty: we are moderately confident in the effect estimate: The true effect is likely to be close to the estimate of the effect, but there is a possibility that it is substantially different. Low certainty: our confidence in the effect estimate is limited: The true effect may be substantially different from the estimate of the effect. Very low certainty: we have very little confidence in the effect estimate: The true effect is likely to be substantially different from the estimate of effect. | ||||||
aDowngraded two levels due to high risk of bias. bDowngraded one level for indirectness. cDowngraded two levels for imprecision.
One trial carried out in the USA evaluated the CSM referral letter plus dental information guide versus standard referral letter (Nelson 2019). The CSM referral letter plus dental information guide had little to no effect on the proportion of children with treated or untreated caries compared to a standard referral letter (OR 1.26, 95% CI 0.82 to 1.93; 395 participants; very low‐certainty evidence; Analysis 6.1).
6.1. Analysis.

Comparison 6: Common‐sense model (CSM) referral letter plus dental information guide (DIG) versus standard referral letter, Outcome 1: Receipt of dental care
7. Common‐sense model referral letter versus standard referral letter
See Table 6.
Nelson 2019 evaluated the CSM model referral letter versus standard referral letter. The CSM referral letter had little or no effect on the proportion of children with treated or untreated caries compared to standard referral letter (OR 0.97, 95% CI 0.62 to 1.51; 388 participants; very low‐certainty evidence; Analysis 7.1).
7.1. Analysis.

Comparison 7: Common‐sense model (CSM) referral letter versus standard referral letter, Outcome 1: Receipt of dental care
8. Common‐sense model referral letter plus dental information guide versus common‐sense model referral letter alone
See Table 10.
3. Common‐sense model referral letter plus dental information guide versus common‐sense model referral letter alone.
| CSM referral letter plus DIG versus CSM referral letter alone | ||||||
| Population: school children Setting: primary schools in USA Intervention: CSM referral letter plus DIG Comparison: CSM referral letter | ||||||
| Outcomes | Anticipated absolute effects* (95% CI) | Relative effect (95% CI) | Number of participants (studies) Follow‐up | Certainty of the evidence (GRADE) | Comment | |
| With referral letter based on CSM | With CSM referral letter plus DIG | |||||
| Dental attendance | Not reported | |||||
| Proportion of children with treated/untreated caries assessed with intraoral examination Follow‐up: mean 8 months | 376 per 1000 | 439 per 1000 (339 to 545) | OR 1.30 (0.85 to 1.99) | 411 (1 RCT) | ⊕⊝⊝⊝ Very lowa,b,c | There may be little or no difference between the two letter types in terms of their effect on the proportion of children with treated or untreated caries. |
| Proportion of children with other treated/untreated oral health need | Not reported | |||||
| Adverse events | Not reported | |||||
| *The risk in the intervention group (and its 95% confidence interval) is based on the assumed risk in the comparison group and the relative effect of the intervention (and its 95% CI). CI: confidence interval; CSM: common‐sense model; DIG: dental information guide; OR: odds ratio. | ||||||
| GRADE Working Group grades of evidence High certainty: we are very confident that the true effect lies close to that of the estimate of the effect. Moderate certainty: we are moderately confident in the effect estimate: The true effect is likely to be close to the estimate of the effect, but there is a possibility that it is substantially different. Low certainty: our confidence in the effect estimate is limited: The true effect may be substantially different from the estimate of the effect. Very low certainty: we have very little confidence in the effect estimate: The true effect is likely to be substantially different from the estimate of effect. | ||||||
1 Downgraded by two levels due to high risk of bias. 2 Downgraded by one level for indirectness. 3 Downgraded by two levels for imprecision.
Nelson 2019 evaluated the CSM referral letter plus dental information guide versus the CSM referral letter alone. The evidence suggests that the CSM referral letter plus dental information guide had little or no effect on the proportion of children with treated or untreated caries compared to the CSM referral letter alone (OR 1.30, 95% CI 0.85 to 1.99; 411 participants; very low‐certainty evidence; Analysis 8.1).
8.1. Analysis.

Comparison 8: Common‐sense model (CSM) referral letter plus dental information guide (DIG) versus common‐sense model referral letter, Outcome 1: Receipt of dental care
9. Referral to specific dental treatment facility versus generic advice letter to see a dentist
See Table 7.
One trial carried out in Saudi Arabia evaluated this comparison (Alayadi 2021). The evidence suggests that there was no difference in dental attendance between those who were referred to a specific dental treatment facility and those who received a generic advice letter (RR 0.91, 95% CI 0.34 to 2.47; very low‐certainty evidence; Analysis 9.1). Moreover, the evidence suggests that, compared to the generic advice letter, referral to a specific facility made little or no difference to number of caries in primary teeth (MD −0.20, 95% CI −0.72 to 0.32; 362 participants; very low‐certainty evidence; Analysis 9.2) or permanent teeth (MD 0.30, 95% CI −0.03 to 0.63; 362 participants; very low‐certainty evidence; Analysis 9.3).
9.1. Analysis.

Comparison 9: Referral to specific treatment facility versus advice letter to see a dentist, Outcome 1: Dental attendance
9.2. Analysis.

Comparison 9: Referral to specific treatment facility versus advice letter to see a dentist, Outcome 2: Caries in primary dentition
9.3. Analysis.

Comparison 9: Referral to specific treatment facility versus advice letter to see a dentist, Outcome 3: Caries in permanent dentition
Discussion
Summary of main results
The main objective of this review was to assess the effectiveness of school dental screening programmes on overall oral health status and use of dental services. We included eight RCTs in our review. We assessed two trials at low risk of bias, three trials at high risk of bias, and three trials at unclear risk of bias.
The outcomes reported in the included trials were dental attendance, proportion of children with untreated/treated dental caries, and caries and trauma measured by validated indices. None of the included trials reported the proportion of children with other untreated oral health needs, gingivitis, developmental defects of enamel, malocclusion or orthodontic needs, cost‐effectiveness or adverse events.
Seven included trials reported attendance or registration at the dentist as their main outcome (Zarod 1992; Burden 1994; Hebbal 2005; Milsom 2006; Cunningham 2009; Praveen 2014; Alayadi 2021). The methods of screening interventions varied across the trials, and only four trials could be combined in meta‐analysis on the basis of common comparison of traditional screening versus no screening with dental attendance as an outcome. We combined data from these studies for the outcome 'dental attendance' and found an inconclusive result with high heterogeneity. The heterogeneity was, in part, due to study design (three cluster‐randomised trials and one individually randomised trial). Due to the inconsistency, and unclear risk of bias, we downgraded the evidence to very low certainty and were unable to draw conclusions about this comparison (see Table 1).
Two trials compared criteria‐based screening to no screening (Milsom 2006; Cunningham 2009). They found a 7% relative increase in the dental attendance in the criteria‐based screening group compared to no screening, with 95% CI ranging from 1% decrease to 16% increase (low‐certainty evidence; see Table 2).
The same two trials compared criteria‐based screening to traditional screening (Milsom 2006; Cunningham 2009), finding that neither was superior to the other (very low‐certainty evidence; see Table 3).
Milsom 2006 followed up children from two arms of the trial (traditional screening and criteria‐based screening) in a prospective cohort study to describe attendance data on the basis of socioeconomic quintile. The authors also presented data on the number of children who went on to receive appropriate treatment of those who attended the dentist. This study found higher rates of referral among children from deprived quintiles compared to those from affluent quintiles in both screening arms. Moreover, children from affluent quintiles were more likely to attend the dentist when referred compared to children in the most deprived quintiles. The authors highlighted that less than a quarter of children who attend the dentist receive appropriate treatment.
Two trials used screening interventions of different designs (Burden 1994; Hebbal 2005). Burden 1994 evaluated criteria‐based screening with specific referral compared to criteria‐based screening with non‐specific referral for the outcome of attendance at dental and orthodontic clinics. It reported a 39% relative increase in attendance at dental clinics in the specific referral group compared to the non‐specific group, with a 95% CI ranging from 9% to 77% increase in attendance (very low‐certainty evidence; see Table 4). They found a 90% relative increase in attendance at orthodontic clinics in the specific referral group compared to the non‐specific group, with a 95% CI ranging from 18% to 206% increase in attendance (very low‐certainty evidence; see Table 4). This trial shows that specific information through a referral letter prompts more parents to take their child to visit the dentist compared to a non‐specific referral.
One cluster‐randomised trial of 4500 school children supplemented traditional screening with motivation (oral health education, offer of free treatment and motivation to parents through school authorities) and compared it with traditional screening alone (Hebbal 2005). There was a 208% relative increase in dental attendance among the motivation group compared to the control group, with 95% CI ranging from 157% to 271% increase in attendance (very low‐certainty evidence; see Table 5). We can assume that the improved response rate in the group given oral health motivation along with screening is attributable to the motivation activities rather than to the screening process itself.
One multi‐centre trial reported proportion of children with treated or untreated caries (receipt of dental care) as the main outcome based on changes in International Caries Detection and Assessment System (ICDAS) scores during follow‐up (Nelson 2019). The trial compared different referral approaches: referral letter based on the CSM, referral letter based on the CSM plus a dental information guide, and the standard referral letter at three sites. The results show that there was no reliable evidence of one approach being superior, though the available evidence is very low certainty due to imprecision, indirectness and high risk of bias for all three comparisons (Table 6; Table 9; Table 10).
One cluster‐randomised trial compared the effectiveness of referral to a specific treatment facility versus a generic advice letter to see a dentist (Alayadi 2021). It evaluated dental attendance, dental caries in primary teeth measured using the dt index and dental caries in permanent teeth measured using the DT index. Neither group showed superiority in terms of the proportion of children visiting a dentist. However, both groups reported a 4% increase in dental visits compared to baseline. It is not specified whether the 4% increase in dental visits related solely to children visiting the dentist who had not done so before. The study authors did not take this into consideration when calculating the results. Therefore, we analysed the data on incidence of dentist visits only. The available evidence in this trial was very low certainty due to high risk of bias, inconsistency, indirectness and imprecision (Table 7).
As none of the studies reported cost‐effectiveness, we could not assess the cost‐benefit aspect of school dental screening. It is an important area of concern for governments and administration at various levels, as the process requires considerable investment in terms of finances and manpower, with co‐ordination of activities from healthcare and education sectors.
Overall completeness and applicability of evidence
We systematically searched for trials according to the methodology specified in our protocol. We included all RCTs that met the inclusion criteria for our review. The methods of screening and strength of referral varied considerably within and across the trials. Translators helped us with studies written in languages we do not know.
We proposed to measure short‐term and long‐term effects of screening on the primary outcomes of proportion of children with untreated dental caries, proportion of children with untreated other oral diseases and dental attendance. However, we did not find any trials with long‐term follow‐up. Seven included trials measured dental attendance and one reported the proportion of children with untreated or treated dental caries in terms of receipt of dental care. No trial reported the proportion of children with other treated or untreated oral health needs.
Amongst the secondary outcomes proposed in our review, only two trials measured prevalence of dental caries and one trial measured the prevalence of trauma to incisor teeth. One of these trials evaluated dental caries in primary teeth measured using the dt index and dental caries in permanent teeth measured using the DT index. No included trials evaluated prevalence of gingivitis, developmental defects of enamel, malocclusion or orthodontic needs, cost of screening or adverse effects.
We included in the meta‐analysis all trials with comparable methodology of screening and referral, and conducted separate analyses for arms of trials with atypical screening and referral procedures. We did not exclude any trial due to missing data. This review does not include trial arms where parents received letters or leaflets but their child did not have an oral examination, as this constitutes an oral health promotion activity rather than screening.
This review provides limited evidence on improvements in oral health or dental attendance following school dental screening. However, our findings highlight the need for further high‐quality RCTs with primary outcomes of proportion of children with active or untreated caries and other diseases, and long‐term follow‐up (more than two years) to derive definitive conclusions and recommendations.
Quality of the evidence
We assessed the body of evidence for a single commonly reported outcome (dental attendance) using the GRADE approach (GRADEpro GDT), which incorporates study limitations (risk of bias), indirectness of evidence, inconsistency of results, imprecision of the estimates, and risk of publication bias.
Four RCTs with 6281 participants compared traditional screening to no screening. We downgraded the certainty of the evidence to very low because of inconsistency, imprecision and risk of bias (Table 1). The results do not allow us to draw a robust conclusion regarding improvement in dental attendance.
When analysing the pooled data of two trials comparing criteria‐based screening to no screening, we downgraded the certainty of evidence by two levels to low because one trial demonstrated inconsistency and the ICC for this trial was borrowed from another (Table 2).
We assessed the certainty of evidence as very low for the comparison of criteria‐based screening versus traditional screening (Table 3). We downgraded the level of evidence by two levels because of inconsistency in both trials and two level due to imprecision.
For the comparison of specific and non‐specific referral letters, we downgraded the certainty of the evidence to very low: two levels owing to unclear risk of selection bias and two levels due to imprecision (Table 4).
Similarly, we downgraded the certainty of evidence for the comparison of traditional screening supplemented with motivation versus traditional screening alone (described by a single study) to very low owing to high risk of bias and imprecision (Table 5).
We downgraded the certainty of evidence by three levels to very low for the comparisons between the CSM referral letter, with or without a dental information guide, versus a standard referral letter, owing to high risk of bias, indirectness and imprecision (Table 6; Table 9; Table 10).
For the trial that compared groups referred to a specific dental treatment facility with groups who received a generic letter advising a visit to the dentist, we downgraded the certainty of evidence to very low because of high risk of bias, inconsistency, indirectness and imprecision (Table 7).
Potential biases in the review process
We have taken steps to minimise bias at every stage of the review. We searched the above‐mentioned databases, conference proceedings and trial registries to include all relevant reports. We tried to contact trial authors by email for missing data. If the reports were very old, we tried to get the contact details of the authors through peer contacts, Google search, Facebook search and websites of universities or hospitals where they were previously affiliated. Nevertheless, there may be unpublished data that we were unable to trace with the described methods. We made every effort to follow the methodology stated in the protocol.
Agreements and disagreements with other studies or reviews
We found two systematic reviews that described the effectiveness of screening on improving oral health in children, based on reports from five trials each (Joury 2017; Sanjeevan 2019). These reviews found 2369 records and 875 records, respectively, based on searches to 2016, whereas we found 2709 records through our database searches to 2021. Both Joury 2017 and Sanjeevan 2019 included five similar trials (Donaldson 2001; Hebbal 2005; Milsom 2006; Cunningham 2009; Praveen 2014). Our review includes four of the same trials (Hebbal 2005; Milsom 2006; Cunningham 2009; Praveen 2014), but we also included Zarod 1992, Burden 1994 and the recently published trials Nelson 2019 and Alayadi 2021. We excluded Donaldson 2001 as the follow‐up period was shorter than three months.
The results of our meta‐analysis are consistent with Joury 2017, which found no evidence of improvement in dental attendance or reduction in dental caries or other diseases between 'screening' and 'no screening' groups. Sanjeevan 2019 concluded that school‐based dental screening marginally increases dental attendance (by 16%) compared to no screening (RR 1.16, 95% CI 1.11 to 1.21). They assessed the quality of the evidence as low. Sanjeevan 2019 performed subgroup analysis for Indian and Caucasian populations to investigate heterogeneity, and found more favourable results in the Indian population (RR 2.60, 95% CI 2.21 to 3.05) compared to the Caucasian population (RR 1.09, 95% CI 1.05 to 1.14). We did not conduct subgroup analyses on this criterion, and our results comparing effects of screening to those of no screening are inconsistent with Sanjeevan 2019.
Authors' conclusions
Implications for practice.
The evidence is insufficient to draw conclusions about whether school dental screening can improve dental attendance.
We are uncertain whether traditional screening is better than no screening (very low‐certainty evidence). Criteria‐based screening may improve dental attendance when compared to no screening (low‐certainty evidence). However, when compared to traditional screening, there is no evidence of a difference in dental attendance (very low‐certainty evidence).
For children requiring treatment, personalised or specific referral letters may improve dental attendance when compared to non‐specific letters (very low‐certainty evidence). Screening supplemented with motivation (oral health education and offer of free treatment) may improve dental attendance in comparison to screening alone (very low‐certainty evidence). We are uncertain whether a referral letter based on the 'common‐sense model of self‐regulation' is better than a standard referral letter (very low‐certainty evidence) or whether specific referral to a dental treatment facility is better than a generic advice letter to visit the dentist (very low‐certainty evidence).
The trials included in this review evaluated effects of school dental screening in the short term. None evaluated the effectiveness of this intervention for improving oral health or addressed possible adverse effects or costs.
Implications for research.
All of the trials except one measured only dental attendance as the primary outcome. Although dental attendance after screening is a desirable outcome, it does not guarantee further follow‐up to completion of treatment and is not a measure of improved oral health.
The studies in this review followed up participants for an average of three to four months. No studies reported long‐term effects of screening. Future research addressing long‐term effects of screening with a cost‐benefit analysis would help to establish whether screening activities are more effective than standard care.
We encountered different terminology for various screening and referral procedures (e.g. 'criteria‐based' screening, screening with 'specific' referral letters). We cannot comment on the universal application of these terms, which makes it difficult to draw comparisons. Hence, we recommend standardising the definitions related to school dental screening programmes to provide a solid base for future research.
Future clinical trials should follow the CONSORT group guidelines to improve conduct and reporting (Consort 2010a; Consort 2010b).
Population
There is a need for clinical trials in middle‐ and low‐income countries to provide local evidence for policy‐making in these nations. Studies should stratify school children based on their economic background to evaluate the influence of socioeconomic status on dental attendance.
Intervention
In future, high‐quality trials related to school dental screening should include incremental dental care (periodic care aimed at diagnosing and treating increments of dental disease as early as possible) so that dental needs do not accumulate over time. Trials with incentives would motivate parents to seek dental treatment for their children.
Comparison
Future trials should include various forms of screening and motivational factors (e.g. oral health education, parental education, reinforcement by school authorities and personalised or specific referral letters).
Outcome
Future trials should assess the proportion of children with dental caries and other diseases, measured over a longer duration, to observe treatments provided and completed in children attending the dentist. This will present a better picture of effectiveness of screening rather than a snapshot of attendance measured over three to four months of follow‐up. We also recommend that trials include cost‐effectiveness as an outcome.
Time stamp
Date of recommendation: 22 July 2022
What's new
| Date | Event | Description |
|---|---|---|
| 17 December 2021 | New citation required but conclusions have not changed | One study added to the review |
| 15 October 2021 | New search has been performed | Updated search run |
History
Protocol first published: Issue 3, 2017 Review first published: Issue 12, 2017
| Date | Event | Description |
|---|---|---|
| 6 March 2019 | New citation required but conclusions have not changed | We identified one new study suitable for inclusion, which did not change our conclusion that we are unable to judge whether or not screening is worthwhile on the basis of the available evidence. |
| 4 March 2019 | New search has been performed | We updated our search to 4 March 2019, included one new study and one new ongoing study, and edited the review accordingly. |
Notes
This review is an update of one previously published in 2017 and 2019 (Arora 2017a; Arora 2019).
Acknowledgements
For our updates in 2019 and 2021, the authors thank Cochrane Oral Health, specifically: Ms Laura MacDonald, Managing Editor; Ms Anne Littlewood, Information Specialist; editors May Wong and Anne‐Marie Glenny; peer reviewer Prabhat Kumar Chaudhari; and copy editor Julia Turner.
For the first review, published in 2017, the authors thank Ms Laura MacDonald, Managing Editor; Ms Anne Littlewood, Information Specialist; Ms Janet Lear, Administrator; and Ms Jo Weldon, Research Co‐ordinator, all from Cochrane Oral Health. We acknowledge input from Cochrane Oral Health editors Anne‐Marie Glenny, Paul Brocklehurst and May Wong. We thank our external referees Lucy Burbridge and Ayesha Masood, and copy editor Jason Elliot‐Smith.
We are grateful to Ms Shazana Binti Mohd Selva, Chief Librarian, Manipal University College Malaysia; Professor Dr Abdul Rashid Haji Ismail, Dean, Faculty of Dentistry, Manipal University College Malaysia; and Professor Adinegara Lutfi Abas, Pro‐Vice Chancellor, Research, Quality and Compliance, Manipal University College Malaysia for their kind support all through the review preparation. We acknowledge all the suggestions and help from Professor Prathap Tharyan, Mr Richard Kirubakaran and Mr Jabez Paul from CMC Vellore, Cochrane South Asia Centre, during the review preparation. We express our gratitude to Ms Anette Blumle, Cochrane Deutschland, for the translation help. We sincerely thank authors Easter Joury, King's College London Dental Institute; Suchitra Nelson, Case Western Reserve University, Ohio; and Haya Alayadi, King Saud University, Saudi Arabia, who responded to our queries.
Appendices
Appendix 1. Cochrane Oral Health’s Trials Register search strategy
Cochrane Oral Health's Trials Register is available via the Cochrane Register of Studies. For information on how the register is compiled, see https://oralhealth.cochrane.org/trials.
#1 MESH DESCRIPTOR Mass Screening AND INREGISTER #2 MESH DESCRIPTOR Stomatognathic diseases EXPLODE ALL AND INREGISTER #3 #1 and #2 #4 ((dental or oral or mouth* or dentist) near5 (screen* or exam* or assess* or certify* or check* or inspect*)) AND INREGISTER #5 ((caries or carious or (decay near (tooth or teeth)) or (trauma near (tooth or teeth)) or malocclusion or “gum health” or gingivitis or “oral hygiene” near5 (screen* or exam* or assess or certify* or check* or inspect*) AND INREGISTER #6 MESH DESCRIPTOR Dental health surveys AND INREGISTER #7 #3 or #4 or #5 or #6 #8 MESH DESCRIPTOR Schools EXPLODE ALL AND INREGISTER #9 school*:ti AND INREGISTER #10 school*:ab AND INREGISTER #11 #8 or #9 or #10 #12 #7 and #11
Appendix 2. Cochrane Central Register of Controlled Clinical Trials (CENTRAL) search strategy
#1 MESH DESCRIPTOR Mass Screening AND TARGET:CENTRAL #2 MESH DESCRIPTOR Stomatognathic diseases EXPLODE ALL AND TARGET:CENTRAL #3 #1 and #2 #4 ((dental or oral or mouth* or dentist) near5 (screen* or exam* or assess* or certify* or check* or inspect*)) AND TARGET:CENTRAL #5 ((caries or carious or (decay near (tooth or teeth)) or (trauma near (tooth or teeth)) or malocclusion or “gum health” or gingivitis or “oral hygiene” near5 (screen* or exam* or assess or certify* or check* or inspect*) AND TARGET:CENTRAL #6 MESH DESCRIPTOR Dental health surveys AND TARGET:CENTRAL #7 #3 or #4 or #5 or #6 #8 MESH DESCRIPTOR Schools EXPLODE ALL AND TARGET:CENTRAL #9 school*:ti AND TARGET:CENTRAL #10 school*:ab AND TARGET:CENTRAL #11 #8 or #9 or #10 #12 #7 and #11
Appendix 3. MEDLINE Ovid search strategy
1. Mass screening/ 2. exp Stomatognathic diseases/ 3. 1 and 2 4. ((dental or oral or mouth or dentist$) adj5 (screen$ or exam$ or assess$ or certif$ or check$ or inspect$)).ti,ab. 5. ((caries or carious or (decay adj (tooth or teeth)) or (trauma$ adj (tooth or teeth)) or malocclusion or "gum health" or gingivitis or "oral hygiene") adj5 (screen$ or exam$ or assess$ or certif$ or check$ or inspect$)).ti,ab. 6. Dental health surveys/ 7. 3 or 4 or 5 or 6 8. exp School/ 9. school$.ti,ab. 10. 8 or 9 11. 7 and 10
The above subject search was linked with the highly sensitive search strategy designed by Cochrane for identifying randomised controlled trials and controlled clinical trials in MEDLINE (as described in Lefebvre 2022, box 3c).
1. randomized controlled trial.pt. 2. controlled clinical trial.pt. 3. randomized.ab. 4. placebo.ab. 5. drug therapy.fs. 6. randomly.ab. 7. trial.ab. 8. groups.ab. 9. or/1‐8 10. exp animals/ not humans.sh. 11. 9 not 10
Appendix 4. Embase Ovid search strategy
1. Mass screening/ 2. exp Mouth disease/ 3. 1 and 2 4. ((dental or oral or mouth or dentist$) adj5 (screen$ or exam$ or assess$ or certif$ or check$ or inspect$)).ti,ab. 5. ((caries or carious or (decay adj (tooth or teeth)) or (trauma$ adj (tooth or teeth)) or malocclusion or "gum health" or gingivitis or "oral hygiene") adj5 (screen$ or exam$ or assess$ or certif$ or check$ or inspect$)).ti,ab. 6. or/3‐5 7. exp School/ 8. school$.ti,ab. 9. 7 or 8 10. 6 and 9
The above subject search was linked with the highly sensitive search strategy designed by Cochrane for identifying randomised controlled trials and controlled clinical trials in Embase (as described in Lefebvre 2022, box 3e).
Randomized controlled trial/
Controlled clinical study/
random$.ti,ab.
randomization/
intermethod comparison/
placebo.ti,ab.
(compare or compared or comparison).ti.
((evaluated or evaluate or evaluating or assessed or assess) and (compare or compared or comparing or comparison)).ab.
(open adj label).ti,ab.
((double or single or doubly or singly) adj (blind or blinded or blindly)).ti,ab.
double blind procedure/
parallel group$1.ti,ab.
(crossover or cross over).ti,ab.
((assign$ or match or matched or allocation) adj5 (alternate or group$1 or intervention$1 or patient$1 or subject$1 or participant$1)).ti,ab.
(assigned or allocated).ti,ab.
(controlled adj7 (study or design or trial)).ti,ab.
(volunteer or volunteers).ti,ab.
human experiment/
trial.ti.
or/1‐19
random$ adj sampl$ adj7 ("cross section$" or questionnaire$1 or survey$ or database$1)).ti,ab. not (comparative study/ or controlled study/ or randomi?ed controlled.ti,ab. or randomly assigned.ti,ab.)
Cross‐sectional study/ not (randomized controlled trial/ or controlled clinical study/ or controlled study/ or randomi?ed controlled.ti,ab. or control group$1.ti,ab.)
(((case adj control$) and random$) not randomi?ed controlled).ti,ab.
(Systematic review not (trial or study)).ti.
(nonrandom$ not random$).ti,ab.
"Random field$".ti,ab.
(random cluster adj3 sampl$).ti,ab.
(review.ab. and review.pt.) not trial.ti.
"we searched".ab. and (review.ti. or review.pt.)
"update review".ab.
(databases adj4 searched).ab.
(rat or rats or mouse or mice or swine or porcine or murine or sheep or lambs or pigs or piglets or rabbit or rabbits or cat or cats or dog or dogs or cattle or bovine or monkey or monkeys or trout or marmoset$1).ti. and animal experiment/
Animal experiment/ not (human experiment/ or human/)
or/21‐33
20 not 34
Appendix 5. US National Institutes of Health Ongoing Trials Register (ClinicalTrials.gov) search strategy
school AND dental AND screen
Appendix 6. World Health Organization International Clinical Trials Registry Platform search strategy
school* AND dental AND screen*
Data and analyses
Comparison 1. Traditional screening versus no screening.
| Outcome or subgroup title | No. of studies | No. of participants | Statistical method | Effect size |
|---|---|---|---|---|
| 1.1 Dental attendance | 4 | Risk Ratio (IV, Random, 95% CI) | Totals not selected | |
| 1.1.1 Cluster‐RCT with ICC 0.03 | 3 | Risk Ratio (IV, Random, 95% CI) | Totals not selected | |
| 1.1.2 Individually randomised trial | 1 | Risk Ratio (IV, Random, 95% CI) | Totals not selected |
Comparison 2. Criteria‐based screening versus no screening.
| Outcome or subgroup title | No. of studies | No. of participants | Statistical method | Effect size |
|---|---|---|---|---|
| 2.1 Dental attendance | 2 | 4980 | Risk Ratio (IV, Random, 95% CI) | 1.07 [0.99, 1.16] |
Comparison 3. Criteria‐based screening versus traditional screening.
| Outcome or subgroup title | No. of studies | No. of participants | Statistical method | Effect size |
|---|---|---|---|---|
| 3.1 Dental attendance | 2 | 5316 | Risk Ratio (IV, Random, 95% CI) | 1.01 [0.94, 1.08] |
Comparison 4. Criteria‐based screening with specific referral versus criteria‐based screening with non‐specific referral.
| Outcome or subgroup title | No. of studies | No. of participants | Statistical method | Effect size |
|---|---|---|---|---|
| 4.1 Dental attendance | 1 | 402 | Risk Ratio (IV, Random, 95% CI) | 1.52 [1.15, 2.00] |
| 4.1.1 Attending general dentist | 1 | 201 | Risk Ratio (IV, Random, 95% CI) | 1.39 [1.09, 1.77] |
| 4.1.2 Attending orthodontist | 1 | 201 | Risk Ratio (IV, Random, 95% CI) | 1.90 [1.18, 3.06] |
Comparison 5. Traditional screening with motivation versus traditional screening alone.
| Outcome or subgroup title | No. of studies | No. of participants | Statistical method | Effect size |
|---|---|---|---|---|
| 5.1 Dental attendance | 1 | 2486 | Risk Ratio (IV, Random, 95% CI) | 3.08 [2.57, 3.71] |
Comparison 6. Common‐sense model (CSM) referral letter plus dental information guide (DIG) versus standard referral letter.
| Outcome or subgroup title | No. of studies | No. of participants | Statistical method | Effect size |
|---|---|---|---|---|
| 6.1 Receipt of dental care | 1 | 395 | Odds Ratio (IV, Random, 95% CI) | 1.26 [0.82, 1.93] |
Comparison 7. Common‐sense model (CSM) referral letter versus standard referral letter.
| Outcome or subgroup title | No. of studies | No. of participants | Statistical method | Effect size |
|---|---|---|---|---|
| 7.1 Receipt of dental care | 1 | 388 | Odds Ratio (IV, Random, 95% CI) | 0.97 [0.62, 1.51] |
Comparison 8. Common‐sense model (CSM) referral letter plus dental information guide (DIG) versus common‐sense model referral letter.
| Outcome or subgroup title | No. of studies | No. of participants | Statistical method | Effect size |
|---|---|---|---|---|
| 8.1 Receipt of dental care | 1 | 411 | Odds Ratio (IV, Random, 95% CI) | 1.30 [0.85, 1.99] |
Comparison 9. Referral to specific treatment facility versus advice letter to see a dentist.
| Outcome or subgroup title | No. of studies | No. of participants | Statistical method | Effect size |
|---|---|---|---|---|
| 9.1 Dental attendance | 1 | 362 | Risk Ratio (M‐H, Random, 95% CI) | 0.91 [0.34, 2.47] |
| 9.2 Caries in primary dentition | 1 | 362 | Mean Difference (IV, Random, 95% CI) | ‐0.20 [‐0.72, 0.32] |
| 9.3 Caries in permanent dentition | 1 | 362 | Mean Difference (IV, Random, 95% CI) | 0.30 [‐0.03, 0.63] |
Characteristics of studies
Characteristics of included studies [ordered by study ID]
Alayadi 2021.
| Study characteristics | ||
| Methods | Assessor‐blinded cluster‐RCT Period of study: not reported |
|
| Participants |
Participants: 1098 Inclusion criteria
Exclusion criteria
|
|
| Interventions |
Comparison: different post‐screening referral mechanisms Intervention: baseline screening followed by referral letter to visit specific dental facility (8 schools, n = 537) Control: baseline screening followed by letter informing parents of their child's dental needs and advising them to see a dentist (8 schools, n = 561) |
|
| Outcomes |
Duration of follow‐up: median 11 months Outcomes reported and used in quantitative synthesis of review: Primary: change in prevalence of dental caries (number of decayed primary and permanent teeth) Secondary: change in number of decayed primary teeth, change in number of decayed permanent teeth, change in proportion of children who visited dentist |
|
| Notes |
Language: English Funded by: Saudi Cultural Bureau, London Costs of follow‐up: not reported Conducted in: Riyadh, Saudi Arabia Unit of randomisation: cluster Author contact information: King's College London, London, UK and King Saud University Dental College, Riyadh, Saudi Arabia Principal investigator: haya.alayadi@kcl.ac.uk Contact provided in related publication: eduardo.bernabe@kcl.ac.uk |
|
| Risk of bias | ||
| Bias | Authors' judgement | Support for judgement |
| Random sequence generation (selection bias) | Low risk | Quote: "Schools were assigned to the intervention or control arm using simple randomisation within each stratum." Comment: though the individual school children are recruited to the trial after the clusters are randomised, the knowledge of 'specific dental facility referral' or 'advice to visit a dentist' would not have affected the types of participant recruitment. |
| Allocation concealment (selection bias) | Low risk | Quote: "A third party (statistician) generated the allocation sequence using computer generated random numbers. Only the trial manager (lead person of the fieldwork team) knew the schools' allocation." |
| Blinding of participants and personnel (performance bias) All outcomes | High risk | Quote: "Dentists were blinded by separating the examination from the referral process. The trial manager filled in and handed referral letters to screened‐positive children in both arms. Children and parents were not blinded." Comment: treatment provided at the specific treatment facility was free of cost. This may increase the possibility of children visiting such a treatment facility. On the contrary, parents who receive an advice letter to visit a dentist may decide not to take their child because treatment may have a charge. |
| Blinding of outcome assessment (detection bias) All outcomes | Low risk | Quote from personal communication: "Dentists were blinded from questionnaire and referral letters as well as group they were examining." Comment: this may not have influenced the outcome assessment, which is objective. |
| Incomplete outcome data (attrition bias) All outcomes | Low risk | Loss of follow‐up of 47 children from intervention arm and 43 children from control arm is noted in the trial. However, these numbers would not have affected the overall results as the intention‐to‐treat analysis included 1098 children with caries data (537 in intervention arm and 561 in control arm). Quote from personal communication: "Since the consent was acquired for the two years upfront, the main reason for loss of follow up was moving from school. At follow‐up, 126 participants had left schools and were tracked back yet 78 participants could not be tracked. an additional 12 students were excluded for not having complete data (more than 70% of data in questionnaire was missing). It's worth noting that schools were the ones responsible to contact students' parents (sending reminders) that left us without direct contact to students nor there parents if they left schools." |
| Selective reporting (reporting bias) | Unclear risk | All the outcomes mentioned in the trial protocol were published in the report. However, time points for measurement mentioned in the protocol were baseline and 12 months after referral, whereas in the study, the median follow‐up was 11 months. We are not sure why the follow‐up was shortened. Quote from personal communication: "The range of follow‐up was 10‐12 months (one academic year), the average follow‐up time was 11 that is the reason of reporting 11 months." |
| Other bias | Low risk | No other source of bias. |
Burden 1994.
| Study characteristics | ||
| Methods | RCT Period of study: not given |
|
| Participants |
Participants: 201 Children aged 11–12 years attending state‐maintained secondary school Inclusion criteria
Exclusion criteria
|
|
| Interventions |
Comparison: 'personalised' referral letter versus 'non‐specific' referral letter to parents after screening programme based on IOTN Intervention: screening followed by 'specific letter' advising the parent to seek treatment to straighten their child’s teeth (n = 103) Control: screening followed by 'non‐specific letter' advising parents to seek dental advice for their child (n = 98) |
|
| Outcomes |
Outcomes used in this review: number of children attending dentist Outcomes reported but not used in quantitative synthesis in this review: number of children accessing orthodontic specialist services Method of outcome measure: questionnaire to parents and confirmed from dental records Duration of follow‐up: 8 months |
|
| Notes |
Language: English Funded by: "This study was supported in part by the T. C. White Fund. Royal College of Physicians and Surgeons of Glasgow" Costs of follow‐up: not reported Conducted in: Manchester, UK Unit of randomisation: individual, within pairs matched for sex, ethnic background, dental disease and scores on index of orthodontic treatment needs Author contact information: not reported in the publication; tried contacting authors through university address but email‐IDs not procured |
|
| Risk of bias | ||
| Bias | Authors' judgement | Support for judgement |
| Random sequence generation (selection bias) | Unclear risk | Quote: "Each child within a matched pair was allocated at random by a toss of a coin to either test or control group. The few children who could not be paired were evenly allocated at random to either the test or control group." |
| Allocation concealment (selection bias) | Low risk | Quote: "Once the children had been allocated, sealed letters of referral addressed to the parent or guardian were delivered to the school." |
| Blinding of participants and personnel (performance bias) All outcomes | Low risk | Participants: sealed referral letters were sent home. Personnel: although it is unclear whether authors were blinded to type of letter sent home, test and control groups were matched for sex, socioeconomic status, dental disease and aesthetic impairment, which is unlikely to introduce bias. |
| Blinding of outcome assessment (detection bias) All outcomes | Low risk | The only outcome reported was attendance, which is an objective outcome. |
| Incomplete outcome data (attrition bias) All outcomes | Low risk | No loss to follow‐up; all participants accounted for in analysis. |
| Selective reporting (reporting bias) | Low risk | Nature of outcome measure unlikely to introduce bias. |
| Other bias | Low risk | No other source of bias. |
Cunningham 2009.
| Study characteristics | ||
| Methods | 4‐arm, assessor‐blinded, cluster‐RCT | |
| Participants | First‐year students in aged 12–13 years, attending all 65 state secondary schools in Lothian and Fife (12,765 potential participants). The study excluded children registered with GDS and CDS from analysis, including only unregistered children (n = 3923). Inclusion criteria
Exclusion criteria
|
|
| Interventions |
Comparison: 'personalised' referral letter' versus 'traditional' referral letter after screening Interventions:
Control: no examination and no letter (Group 4; n = 819) |
|
| Outcomes |
Outcomes used in quantitative synthesis: changes in registration status of unregistered children (dental attendance) Outcomes reported but not used in quantitative synthesis: a further analysis was included to investigate differences in children who had never been listed as registered with an NHS GDP and those who had been registered at one time (> 9 months previously). Duration of follow‐up: 3 months |
|
| Notes |
Language: English Funded by: grant OOB/3/19/F29 from the Primary Care Research Fund of the Chief Scientist Office, Scottish Executive Costs of follow‐up: not reported Conducted in: Scotland, UK Data from Groups 1, 3 and 4 contribute to the data in this review; Group 2 (which did not receive oral inspection) does not fall under definition of 'school dental screening' as per protocol. This study included only unregistered children, who were further classified into 'never registered' or 'registration lapsed' in the study report. Unit of randomisation: cluster Author contact information: chris.cunningham@nhslothian.scot.nhs.uk Contacted author for information on ICC but did not receive a reply. We mailed the author a query on clarification on the data as there was mismatch in data written in the table and study flow chart. However, we did not receive reply and used data presented in the study table. |
|
| Risk of bias | ||
| Bias | Authors' judgement | Support for judgement |
| Random sequence generation (selection bias) | Low risk | Quote: "The schools were randomly allocated using a computer‐ generated sequence to one of four groups by the study statistician blinded to the interventions that each would receive which was not revealed until completion of analysis." |
| Allocation concealment (selection bias) | Low risk | Quote: "The schools were randomly allocated using a computer‐generated sequence to one of four groups by the study statistician blinded to the interventions that each would receive which was not revealed until completion of analysis." |
| Blinding of participants and personnel (performance bias) All outcomes | Low risk | Although this was an unblinded study, the cluster design and the nature of the intervention made performance bias unlikely. |
| Blinding of outcome assessment (detection bias) All outcomes | Low risk | Allocation was concealed. Outcome was available from electronic records. |
| Incomplete outcome data (attrition bias) All outcomes | Low risk | No loss to follow‐up; all participants accounted for in the analysis. |
| Selective reporting (reporting bias) | Low risk | All outcomes stated in the methods were reported. |
| Other bias | Low risk | No other source of bias detected. |
Hebbal 2005.
| Study characteristics | ||
| Methods | Cluster‐RCT | |
| Participants |
Inclusion criteria
Exclusion criteria
|
|
| Interventions |
Comparison: screening programme with motivation versus screening alone Intervention: screening and referral card supplemented with oral health education for children and motivation for parents from school authorities (7 clusters, n = 2100) Control: screening and referral cards (7 clusters, n = 2400) |
|
| Outcomes |
Primary outcome: response rate (dental attendance) Duration of follow‐up: 3 months |
|
| Notes |
Language: English Funded by: not mentioned Costs of follow‐up: not reported Conducted in: Davangere, India Unit of randomisation: cluster Author contact information: drmamatahebbal@yahoo.co.in We tried contacting authors for information on results, ICC values and risk of bias assessment queries, but received no reply. |
|
| Risk of bias | ||
| Bias | Authors' judgement | Support for judgement |
| Random sequence generation (selection bias) | Unclear risk | Quote: "These twenty schools were then subjected to a two‐stage simple random sampling technique for selection of the schools. In the first stage, fourteen schools were selected out of twenty by lottery method, and in the second stage these schools were assigned randomly either to the study or control group (seven schools in each group)." Comment: no mention of how schools were allocated to study or control group. |
| Allocation concealment (selection bias) | Unclear risk | No details given. |
| Blinding of participants and personnel (performance bias) All outcomes | High risk | Quote: "The response rate was calculated during the three‐month period from the date of initiation of the school screening program. During this period, the students who visited the dental college from the control group were examined, and dental findings were recorded. In order to obtain data regarding the number of children requiring treatment in the control group, a separate screening program was conducted after the waiting period of three months." Comment: children from study group had additional interventions like free treatment and also special attention from school authorities apart from standard intervention planned. |
| Blinding of outcome assessment (detection bias) All outcomes | Low risk | Primary outcome is dental attendance. Quote: "...investigated by using a computer program validated to be approximately 95% accurate" Comment: low risk of detection bias. |
| Incomplete outcome data (attrition bias) All outcomes | Low risk | No loss to follow‐up; all participants accounted for in analysis. |
| Selective reporting (reporting bias) | Low risk | All outcomes stated in the methods were reported. |
| Other bias | Low risk | No other source of bias. |
Milsom 2006.
| Study characteristics | ||
| Methods | Cluster‐RCT (4 arm) | |
| Participants |
Participants: 16,864 Inclusion criteria
Exclusion criteria:
|
|
| Interventions |
Comparison: 3 screening models versus no screening Interventions:
Control: no intervention during study period (n = 4226) |
|
| Outcomes |
Duration of follow‐up: 4 months after baseline Outcomes reported and used in quantitative synthesis for the review: dental attendance Outcomes reported and not used in quantitative synthesis for the review: Primary: prevalence (DT > 0) and mean number of teeth with active caries (DT); prevalence (dt > 0) and mean number of teeth with active caries (dt) Secondary: prevalence of oral sepsis, gross plaque or calculus and dental trauma to incisor teeth |
|
| Notes |
Language: English Funded by: project grant from the NHS Executive North West R&D Directorate Costs of follow‐up: not reported Conducted in: UK Unit of randomisation: cluster Data from Group 1, 2 and 4 contribute to the data in this review. Group 3 ('dental information leaflet') did not receive oral inspection so did not fall under our definition of 'school dental screening' as per protocol. Author contact information: martin.tickle@manchester.ac.uk. |
|
| Risk of bias | ||
| Bias | Authors' judgement | Support for judgement |
| Random sequence generation (selection bias) | Low risk | Quote: "The schools within each stratum were randomly allocated to four intervention arms by reference to a random number table." |
| Allocation concealment (selection bias) | Low risk | Quote: "The study statistician carried out the stratified randomisation and concealed the randomisation codes from the field workers and co‐investigators until analysis was complete." |
| Blinding of participants and personnel (performance bias) All outcomes | Low risk | Participants: no blinding of schools or participants due to nature of intervention, but the review authors considered that cluster‐randomisation at the school level accounted for this Personnel: quote: "The leaflet was distributed to the children by school staff." |
| Blinding of outcome assessment (detection bias) All outcomes | Low risk | Quote: "Outcome epidemiological examinations were undertaken in the schools, after a four‐month period, by trained and calibrated dental examiners who were blinded to the study arm to which each school had been allocated." |
| Incomplete outcome data (attrition bias) All outcomes | Low risk | Quote: "These analyses were performed on all children included in the randomisation (N=16,864)." |
| Selective reporting (reporting bias) | Low risk | Although we did not find trial registration in a trial registry, all outcomes stated in the methods were reported. |
| Other bias | Low risk | No other source of bias. |
Nelson 2019.
| Study characteristics | ||
| Methods |
Affiliation: Department of Community Dentistry, School of Dental Medicine, Case Western Reserve University, Cleveland, OH, USA Study design: multi‐site, double‐blind RCT with 5 parallel arms Setting: elementary schools Trial registration: NCT02395120 Grant: National Institutes of Health/National Institute of Dental and Craniofacial Research (grant U01 DE024167‐01). |
|
| Participants |
Participants: caregivers of kindergarten to 4th grade children who required restorative treatment. Children were from 14 elementary schools in 6 school districts: 2 in urban Ohio (8 schools) and 4 in rural Washington State (6 schools). The original intention was to have only 1 from Ohio, but a second was added the next year due to low recruitment (this area, Bedford, was not a low‐income district as the others were). Inclusion criteria
Exclusion criteria
|
|
| Interventions |
Comparison: CSM‐based versus standard referral letter after screening Interventions:
Control: standard referral letter (n = 186) Outreach workers followed up referral letters at 48 hours by calling caregivers to ensure they had received the letter. Trial authors combined groups 1 and 3 (n = 202), and groups 2 and 4 (n = 209). |
|
| Outcomes |
Duration of follow‐up: 1 school‐year (7 months) Primary outcome: receipt of dental care ("restoration or extraction of at least one tooth previously identified with an active ICDAS ≥ 2 at baseline") Secondary outcomes (results not reported): change in illness perception; change in behavioural intentions. |
|
| Notes |
Language: English Funded by: National Institutes of Health/National Institute of Dental and Craniofacial Research Costs of follow‐up: not assessed Conducted in: 2015–2017 Unit of randomisation: cluster (stratified random) Author contact information: sxn15@case.edu |
|
| Risk of bias | ||
| Bias | Authors' judgement | Support for judgement |
| Random sequence generation (selection bias) | Low risk | Quote: "Specifically, we used multiple Latin squares to obtain close to the targeted allocation ratios marginally for each grade, school, and site while also using, through the permuted blocks, a random order of interventions within each stratum (grade within school within site)." |
| Allocation concealment (selection bias) | Low risk | Quote: "All referral letters were generated by the data manager according to study arm and either enclosed in packages to be delivered at school or sent by mail to caregiver." |
| Blinding of participants and personnel (performance bias) All outcomes | Low risk | Quote: "All other study staff members, examiners, and participants were blinded. To maintain the blinding, all referral letters were generated by the data manager according to study arm and either enclosed in packages to be delivered at school or sent by mail to caregiver." |
| Blinding of outcome assessment (detection bias) All outcomes | Low risk | Quote: "At follow‐up, the examiners did not have access to the results of the baseline examinations to avoid detection bias." |
| Incomplete outcome data (attrition bias) All outcomes | Unclear risk | 694 children randomised (611 caregivers), but 597 analysed. Dropout rate approximately equal in all 3 groups. |
| Selective reporting (reporting bias) | Unclear risk | The secondary aim as per the published protocol is not addressed in this report. We are not sure if this will be published as a different report. |
| Other bias | High risk | The participants were initially allocated to 5 groups, but the study authors combined 'CSM letter' and 'reduced CSM letter' into a single 'CSM letter' group; and combined 'CSM letter + DIG' and 'reduced CSM letter + DIG' into a single 'CSM letter + DIG' group. They state this was "in accordance with our primary aims", but it is not clear if this was a post hoc decision. |
Praveen 2014.
| Study characteristics | ||
| Methods | RCT | |
| Participants |
Inclusion criteria
Exclusion criteria
|
|
| Interventions |
Comparison: screening versus no screening Intervention: screening followed by referral card sent to parents (n = 300) Control: no screening and no referral card (n = 300) |
|
| Outcomes |
Duration of follow‐up: 3 months Primary outcome: dental attendance rate |
|
| Notes |
Language: English Funded by: not mentioned Costs of follow‐up: not reported Conducted in: Vikarabad, India Unit of randomisation: cluster Author contact information: gaddephd6@gmail.com We contacted author for information on sampling procedure and ICC values but did not receive a reply. |
|
| Risk of bias | ||
| Bias | Authors' judgement | Support for judgement |
| Random sequence generation (selection bias) | Unclear risk | Quote: "These 37 schools were then subjected to a two stage sampling technique for the selection of schools. In the first phase, 16 schools were selected by lottery method and in the second stage these schools were assigned randomly to either study or control group." Comment: no explanation of randomisation method. |
| Allocation concealment (selection bias) | Unclear risk | Not reported. |
| Blinding of participants and personnel (performance bias) All outcomes | Unclear risk | Not reported. |
| Blinding of outcome assessment (detection bias) All outcomes | Unclear risk | Not reported. |
| Incomplete outcome data (attrition bias) All outcomes | Low risk | No loss to follow‐up; all participants accounted for in analysis. |
| Selective reporting (reporting bias) | Low risk | All outcomes stated in the methods were reported. |
| Other bias | Low risk | No other source of bias. |
Zarod 1992.
| Study characteristics | ||
| Methods | Study design: RCT | |
| Participants |
Participants: 528 Inclusion criteria
Exclusion criteria
Age at baseline: 4 –6 years Number of participants randomised: test group: n = 270; control group: n = 258 Number of participants evaluated: test group: n = 262; control group: = 243 |
|
| Interventions |
Comparison: screening followed by referral letter versus without follow‐up letter. The study also compared effectiveness of dental screening in areas of contrasting socioeconomic status. Intervention: baseline screening followed by referral letter to parents via child (n = 270) A second letter was mailed to child's home address if return slip was not returned within a week of first letter. If response to either was not received within 21 days, telephone contact was made wherever possible. Control: baseline screening without further communication (n = 258) |
|
| Outcomes |
Duration of follow‐up: 4 months after baseline screening Primary outcome: dental attendance in both groups |
|
| Notes |
Language: English Funded by: not mentioned Costs of follow‐up: not reported Conducted in: UK Unit of randomisation: individual Author contact information: m.a.lennon@sheffield.ac.uk We received no reply to queries for risk of bias assessment |
|
| Risk of bias | ||
| Bias | Authors' judgement | Support for judgement |
| Random sequence generation (selection bias) | Unclear risk | No information. |
| Allocation concealment (selection bias) | Unclear risk | No information. |
| Blinding of participants and personnel (performance bias) All outcomes | Unclear risk | No information. |
| Blinding of outcome assessment (detection bias) All outcomes | Unclear risk | No information. |
| Incomplete outcome data (attrition bias) All outcomes | Low risk | Trial authors noted loss of follow‐up of 8 children from test group and 15 children from control group. However, these numbers would not have affected the overall results (based on our intention‐to‐treat analysis). |
| Selective reporting (reporting bias) | Low risk | All outcomes stated in the methods were reported. |
| Other bias | Low risk | No other source of bias. |
CDS: community dental service; CSM: common‐sense model; DIG: dental information guide; dt: primary dentition; DT: permanent dentition; GDS: general dental service; ICC: intracluster correlation coefficient; ICDAS: International Caries Detection and Assessment System; IOTN: Index of Treatment Need; NHS: UK National Health Service; RCT: randomised controlled trial.
Characteristics of excluded studies [ordered by study ID]
| Study | Reason for exclusion |
|---|---|
| Adam 2005 | Not an RCT but rather a descriptive survey |
| Al Johara 2010 | Not a RCT but rather a cross‐sectional questionnaire study. |
| Baglee 2000 | Full text unavailable. We were unable to contact university or authors. |
| Binder 1973 | Text did not explain if participants were divided randomly into intervention and control groups. |
| Cruz 2012 | Not a school oral health screening programme. Parents received postcards without oral examination. |
| Donaldson 2001 | Follow‐up < 3 months |
| Glenny 2013 | No groups received an oral examination. |
| Haleem 2011 | Intervention is oral health education and not dental screening. |
| Harrison 2003 | Not an RCT |
| Holst 1975 | Not an RCT |
| Locker 2004 | No follow‐up for dental attendance or reduction of disease |
| Mbawalla 2013 | Intervention was oral health education and not dental screening. |
| Morrant 1995 | Not an RCT |
| Nelson 2012 | Not an RCT but rather a cohort study |
| Petersen 2004 | Intervention was oral health promotion and not dental screening. |
| Rodgers 2007 | No communication sent to parents |
| Tantawi 2015 | No follow‐up on use of services or reduction of disease |
RCT: randomised controlled trial
Differences between protocol and review
We would have assessed reporting bias as planned if we had included more than 10 studies in a meta‐analysis.
In the case of dropouts, we intended to use the data as reported by the paper and deal with it in the risk of bias assessment. However, in the outcome 'dental attendance', dropout was considered as a part of the outcome (not attending the dentist) and hence we redefined the term 'dropout' in this review.
We planned subgroup analysis on the basis of age group, targeted or universal screening, post‐screening treatment set‐up and treatment charges. However, we performed subgroup analyses on the basis of cluster versus individual randomisation because of substantial heterogeneity.
We did not expect to analyse more than seven comparisons and had not planned in our protocol which comparisons we would present in summary of findings tables (Arora 2017b). Therefore, we did a prioritisation exercise and selected the most important seven comparisons out of the nine.
Contributions of authors
AA: drafting the protocol, screening trials, selecting trials, data extraction, assessment of risk of bias and entering data into RevMan 5, selection of trials, drafting the final review and updating the review.
SKN: selecting the trials, data analysis, assessment of risk of bias, drafting the final review and updating the review.
SK: undertaking searches, screening articles, drafting the final review and updating the review.
NMI: drafting the final review, updating the review and acting as arbiter.
PE: drafting the protocol, selection of trials, drafting and updating the review.
Sources of support
Internal sources
-
Melaka Manipal Medical College, Manipal University, Melaka Campus, Malaysia
Library support and providing training in Cochrane Systematic Reviews
-
Cochrane South Asia Centre, CMC, Vellore, India
Methodological and statistical support was provided in this Cochrane systematic review.
-
Division of Dentistry, School of Medical Sciences, Faculty of Biology, Medicine and Health, The University of Manchester, UK
Support to Cochrane Oral Health
-
Manchester Academic Health Sciences Centre (MAHSC) and the NIHR Manchester Biomedical Research Centre, UK
Support to Cochrane Oral Health
External sources
-
National Institute for Health Research (NIHR), UK
This review was supported by the NIHR, via Cochrane Infrastructure funding to Cochrane Oral Health. The views and opinions expressed herein are those of the review authors and do not necessarily reflect those of the Systematic Reviews Programme, the NIHR, the NHS or the Department of Health.
-
Cochrane Oral Health Global Alliance, Other
The production of Cochrane Oral Health reviews has been supported financially by our Global Alliance since 2011 (oralhealth.cochrane.org/partnerships-alliances). Contributors over recent years have been the American Association of Public Health Dentistry, USA; the British Association for the Study of Community Dentistry, UK; the British Society of Paediatric Dentistry, UK; the Canadian Dental Hygienists Association, Canada; the Centre for Dental Education and Research at All India Institute of Medical Sciences, India; the National Center for Dental Hygiene Research & Practice, USA; New York University College of Dentistry, USA; and Swiss Society of Endodontology, Switzerland.
Declarations of interest
AA: none SKN: none SK: none NMI: none PE: none
New search for studies and content updated (no change to conclusions)
References
References to studies included in this review
Alayadi 2021 {published data only}
- Alayadi 2021 [pers comm]. Query regarding school dental screening. E-mail to Ankita Arora on 21 December 2021.
- Alayadi H, Bernabe E, Sabbah W. Effectiveness of school dental screening to reduce untreated caries: a cluster-randomized controlled trial. Caries Research 2021;55(6):577-84. [DOI] [PubMed] [Google Scholar]
- NCT03345680. Examining the impact of school-based dental screening [Official title: Examining the impact of school-based dental screening program on dental visits and dental caries among primary school children in Riyadh city, Saudi Arabia: a randomized controlled trial]. clinicaltrials.gov/ct2/show/NCT03345680 (first received 17 November 2017).
Burden 1994 {published data only}
- Burden DJ, Mitropoulos CM. Effectiveness of a personalised referral letter following orthodontic screening. Community Dentistry and Oral Epidemiology 1994;22(5 Pt 1):323-6. [PMID: ] [DOI] [PubMed] [Google Scholar]
Cunningham 2009 {published data only}
- Cunningham CJ, Elton R, Topping GV. A randomised control trial of the effectiveness of personalised letters sent subsequent to school dental inspections in increasing registration in unregistered children. BMC Oral Health 2009;9(1):8. [DOI] [PMC free article] [PubMed] [Google Scholar]
Hebbal 2005 {published data only}
- Hebbal M, Nagarajappa R. Does school-based dental screening for children increase follow-up treatment at dental school clinics? Journal of Dental Education 2005;69(3):382-6. [PMID: ] [PubMed] [Google Scholar]
Milsom 2006 {published data only}
- Milsom K, Blinkhorn A, Worthington H, Threlfall A, Buchanan K, Kearney-Mitchell P, et al. The effectiveness of school dental screening: a cluster-randomized control trial. Journal of Dental Research 2006;85(10):924-8. [PMID: ] [DOI] [PubMed] [Google Scholar]
- Milsom KM, Threlfall AG, Blinkhorn AS, Kearney-Mitchell PI, Buchanan KM, Tickle M. The effectiveness of school dental screening: dental attendance and treatment of those screened positive. British Dental Journal 2006;200(12):687-90; discussion 673. [PMID: 16799446 ] [DOI] [PubMed] [Google Scholar]
Nelson 2019 {published data only}
- NCT02395120. Family Access to Dentist Study (FADS). clinicaltrials.gov/ct2/show/NCT02395120 (first received 20 March 2015).
- Nelson S, Milgrom P, Albert JM, Selvaraj D, Cunha-Cruz J, Curtan S, et al. Randomized trial based on the common-sense model of self-regulation to increase child dental visits. JDR Clinical & Translational Research 2019;4(4):323-32. [DOI: 10.1177/2380084419830662] [DOI] [PMC free article] [PubMed] [Google Scholar]
Praveen 2014 {published data only}
- Gadde P, Mohammad A, Reddy P, Monica M, Rao K, Muhammad B. Effectiveness of school dental screening on stimulating dental attendance rates in Vikarabad town: a randomized controlled trial. Journal of Indian Association of Public Health Dentistry 2014;12(2):70-3. [Google Scholar]
Zarod 1992 {published data only}
- Zarod BK, Lennon MA. The effect of school dental screening on dental attendance. The results of a randomised controlled trial. Community Dental Health 1992;9(4):361-8. [PMID: ] [PubMed] [Google Scholar]
References to studies excluded from this review
Adam 2005 {published data only}
- Adam C, Eid A, Riordan PJ, Wolikow M, Cohen F. Caries experience in the primary dentition among French 6-year-olds between 1991 and 2000. Community Dentistry and Oral Epidemiology 2005;33(5):333-40. [DOI] [PubMed] [Google Scholar]
Al Johara 2010 {published data only}
- Al Johara A, Al-Hussyeen. Factors affecting utilization of dental health services and satisfaction among adolescent females in Riyadh City. Saudi Dental Journal 2010;22(1):19-25. [DOI] [PMC free article] [PubMed] [Google Scholar]
Baglee 2000 {published data only}
- Baglee C, Prendergast MJ. Does school dental screening promote the uptake of dental care? In: Conference proceedings of American Association for Dental Research. Vol. 79. American Association for Dental Research, 1619 Duke St, Alexandria, VA 22314 USA, 2000:1199.
Binder 1973 {published data only}
- Binder K. The effectiveness of dental examination in school dentistry. Osterreichische Zeitschrift fur Stomatologie 1973;70(7):270. [PubMed] [Google Scholar]
Cruz 2012 {published data only}
- Cruz AD, Mueller G, Milgrom P, Coldwell SE. A community-based randomised trial of postcard mailings to increase dental utilization among low-income children. Journal of Dentistry for Children 2012;79(3):154-8. [PMC free article] [PubMed] [Google Scholar]
Donaldson 2001 {published data only}
- Donaldson M, Kinirons M. Effectiveness of the school dental screening programme in stimulating dental attendance for children in need of treatment in Northern Ireland. Community Dentistry and Oral Epidemiology 2001;29(2):143-9. [PMID: ] [DOI] [PubMed] [Google Scholar]
Glenny 2013 {published data only}
- Glenny A-M, Worthington HV, Milsom KM, Rooney E, Tickle M. Strategies for maximizing consent rates for child dental health surveys: a randomised controlled trial. BMC Medical Research Methodology 2013;13(1):108. [DOI] [PMC free article] [PubMed] [Google Scholar]
Haleem 2011 {published data only}
- Haleem A. School-based strategies for oral health education and examination of adolescents [abstract]. 1st IADSR International Conference; 2011 Apr 22-24; Lahore, Pakistan.
Harrison 2003 {published data only}
- Harrison RL, Li J, Wyman T. The Community Dental Facilitator Project: reducing barriers to dental care. Journal of Public Health Dentistry 2003;63(2):126-8. [DOI] [PubMed] [Google Scholar]
Holst 1975 {published data only}
- Holst D. Dental caries in schoolchildren in some Danish communities with and without school dental service. Community Dentistry and Oral Epidemiology 1975;3(5):237-43. [DOI] [PubMed] [Google Scholar]
Locker 2004 {published data only}
- Locker D, Frosina C, Murray H, Wiebe D, Wiebe P. Identifying children with dental care needs: evaluation of a targeted school-based dental screening program. Journal of Public Health Dentistry 2004;64(2):63-70. [PMID: ] [DOI] [PubMed] [Google Scholar]
Mbawalla 2013 {published data only}
- Mbawalla H, Masalu JR, Masatu M, Nordrehaug A. Changes in adolescents' oral health status following oral health promotion activities in Tanzania. Acta Odontologica Scandinavica 2013;71(2):333-42. [DOI] [PubMed] [Google Scholar]
Morrant 1995 {published data only}
- Morrant AM, Holloway PJ, Taylor GO. A novel school dental screening programme. Community Dental Health 1995;12(3):128-32. [PubMed] [Google Scholar]
Nelson 2012 {published data only}
- Nelson S, Mandelaris J, Ferretti G, Heima M, Spiekerman C, Milgrom P. School screening and parental reminders in increasing dental care for children in need: a retrospective cohort study. Journal of Public Health Dentistry 2012;72(1):45-52. [DOI] [PMC free article] [PubMed] [Google Scholar]
Petersen 2004 {published data only}
- Petersen PE, Peng B, Tai B, Bian Z, Fan M. Effect of a school-based oral health education programme in Wuhan City, Peoples Republic of China. International Dental Journal 2004;54(1):33-41. [DOI] [PubMed] [Google Scholar]
Rodgers 2007 {published data only}
- Rodgers J. School dental screening does not increase dental attendance rates or reduce disease levels. Evidence-based Dentistry 2007;8(1):5-6. [PMID: 17380170 ] [DOI] [PubMed] [Google Scholar]
Tantawi 2015 {published data only}
- El Tantawi MM, AbdelAziz WE. Assessment of the accuracy of two dental screening methods used in a school setting. Oral Health & Preventive Dentistry 2015;13(6):501-8. [PMID: ] [DOI] [PubMed] [Google Scholar]
Additional references
AAPD 2008
- American Academy on Pediatric Dentistry Council on Clinical Affairs. Policy on mandatory school-entrance oral health examinations. Pediatric Dentistry 2008;30(7 Suppl):26. [PMID: ] [PubMed] [Google Scholar]
Australian Institute of Health 2013
- Chrisopoulos S, Harford JE. Oral health and dental care in Australia: key facts and figures 2012. Cat. no. DEN 224. www.aihw.gov.au/ (accessed 20 August 2016).
Azami‐Aghdash 2015
- Azami-Aghdash S, Ebadifard Azar F, Pournaghi Azar F, Rezapour A, Moradi-Joo M, Moosavi A, et al. Prevalence, etiology, and types of dental trauma in children and adolescents: systematic review and meta-analysis. Medical Journal of the Islamic Republic of Iran 2015;29(4):234. [PMC free article] [PubMed] [Google Scholar]
Bader 2004
- Bader JD, Rozier RG, Lohr KN, Frame PS. Physicians' roles in preventing dental caries in preschool children: a summary of the evidence for the U.S. Preventive Services Task Force. American Journal of Preventive Medicine 2004;26(4):315-25. [PMID: 15110059] [DOI] [PubMed] [Google Scholar]
Bagramian 2009
- Bagramian RA, Garcia-Godoy F, Volpe AR. The global increase in dental caries. A pending public health crisis. American Journal of Dentistry 2009;22(1):3-8. [PMID: ] [PubMed] [Google Scholar]
Balshem 2011
- Balshem H, Helfand M, Schünemann HJ, Oxman AD, Kunz R, Brozek J, et al. GRADE guidelines: 3. Rating the quality of evidence. Journal of Clinical Epidemiology 2011;64(4):401-6. [PMID: ] [DOI] [PubMed] [Google Scholar]
California HealthCare Foundation 2008
- Pourat N. Snapshot. Haves and have-nots: a look at children's use of dental care in California. California Health Interview Survey 2008:1-19.
CDC 2014
- Griffin SO, Barker LK, Wei L, Li C-H, Albuquerque MS, Gooch BF. Use of dental care and effective preventive services in preventing tooth decay among U.S. children and adolescents — Medical Expenditure Panel Survey, United States, 2003–2009 and National Health and Nutrition Examination Survey, United States, 2005–2010. Morbidity and Mortality Weekly Report 2014;63(2):54-60. [PubMed]
Chong 2011
- Chong GT, Evans RW, Dennison PJ. Screening for caries in targeted schools in the Blue Mountains and Hawkesbury districts, New South Wales, Australia: an evaluation of the School Assessment Program. Journal of Investigative and Clinical Dentistry 2011;2(4):259-67. [PMID: ] [DOI] [PubMed] [Google Scholar]
Chrysanthakopoulos 2016
- Chrysanthakopoulos NA. Prevalence of gingivitis and associated factors in 13-16-year-old adolescents in Greece. European Journal of General Dentistry 2016;5(2):58-64. [Google Scholar]
Consort 2010a
- Juszczak E, Altman DG, Hopewell S, Schulz K. Reporting of multi-arm parallel-group randomized trials: extension of the CONSORT 2010 statement. JAMA 2019;321(16):1610–20. [DOI] [PubMed] [Google Scholar]
Consort 2010b
- Campbell MK, Piaggio G, Elbourne DR, Altman DG . Consort 2010 statement: extension to cluster randomised trials. BMJ 2012;345:e5661. [PMID: ] [DOI] [PubMed] [Google Scholar]
Deeks 2011
- Deeks JJ, Higgins JP, Altman DG, editor(s). Chapter 9: Analysing data and undertaking meta-analyses. In: Higgins JP, Green S, editor(s). Cochrane Handbook for Systematic Reviews of Interventions Version 5.1.0 (updated March 2011). The Cochrane Collaboration, 2011. Available from training.cochrane.org/handbook/archive/v5.1/.
Edelstein 2002
- Edelstein BL. Disparities in oral health and access to care: findings of national surveys. Ambulatory Pediatrics 2002;2(2 Suppl):141-7. [DOI] [PubMed] [Google Scholar]
FDI 2015
- FDI World Dental Federation. The challenge of oral disease – a call for global action. www.fdiworlddental.org/sites/default/files/media/documents/complete_oh_atlas.pdf (accessed in August 2016).
GRADEpro GDT [Computer program]
- GRADEpro GDT. Hamilton (ON): GRADE Working Group, McMaster University, 3.6.
Higgins 2003
- Higgins JP, Thompson SG, Deeks JJ, Altman DG. Measuring inconsistency in meta-analyses. BMJ 2003;327(7414):557-60. [DOI] [PMC free article] [PubMed] [Google Scholar]
Higgins 2011a
- Higgins JP, Deeks JJ, editor(s). Chapter 7: Selecting studies and collecting data. In: Higgins JP, Green S, editor(s), Cochrane Handbook for Systematic Reviews of Interventions Version 5.1.0 (updated March 2011). The Cochrane Collaboration, 2011. Available from training.cochrane.org/handbook/archive/v5.1/.
Higgins 2011b
- Higgins JP, Altman DG, Sterne JA, editor(s). Chapter 8: Assessing risk of bias in included studies. In: Higgins JP, Green S, editor(s). Cochrane Handbook for Systematic Reviews of Interventions Version 5.1.0 (updated March 2011). The Cochrane Collaboration, 2011. Available from training.cochrane.org/handbook/archive/v5.1/.
Higgins 2011c
- Higgins JP, Deeks JJ, Altman DG, editor(s). Chapter 16: Special topics in statistics. In: Higgins JP, Green S, editor(s), Cochrane Handbook for Systematic Reviews of Interventions Version 5.1.0 (updated March 2011). The Cochrane Collaboration, 2011. Available from training.cochrane.org/handbook/archive/v5.1/.
Irish Guideline 2012
- Irish Oral Health Services Guideline Initiative. Oral health assessment: best practice guidance for providing an oral health assessment programme for school-aged children in Ireland. www.ucc.ie/en/media/research/ohsrc/OralHealthAssessmentFull.pdf (accessed 1 September 2016).
Janakiram 2016
- Janakiram C, Taha F. Ethics of dental health screening. Indian Journal of Medical Ethics 2016;1(3):171-6. [PMID: ] [DOI] [PubMed] [Google Scholar]
Jenner 1986
- Jenner AM, Lennon MA. An evaluation of the school dental inspection. Community Dental Health 1986;3(3):221-6. [PubMed] [Google Scholar]
Joury 2017
- Joury E, Bernabe E, Sabbah W, Nakhleh K, Gurusamy K. Systematic review and meta-analysis of randomised controlled trials on the effectiveness of school-based dental screening versus no screening on improving oral health in children. Journal of Dentistry 2017;58:1-10. [PMID: ] [DOI] [PubMed] [Google Scholar]
Kearney‐Mitchell 2006
- Kearney-Mitchell PI, Milsom KM, Blinkhorn AS, Tickle M. The development of a consensus among primary care dentists of referral criteria for school dental screening. British Dental Journal 2006;200(9):509-12; discussion 501. [PMID: 16703094 ] [DOI] [PubMed] [Google Scholar]
Ketabi 2006
- Ketabi M, Tazhibi M, Mohebrasool S. The prevalence and risk factors of gingivitis among the children referred to Isfahan Islamic Azad University (Khorasgan Branch) Dental School, in Iran. Dental Research Journal 2006;3(1):1-4. [Google Scholar]
Lefebvre 2022
- Lefebvre C, Glanville J, Briscoe S, Featherstone R, Littlewood A, Marshall C, et al. Technical Supplement to Chapter 4: Searching for and selecting studies. In: Higgins JP, Thomas J, Chandler J, Cumpston MS, Li T, Page MJ, Welch VA, editor(s). Cochrane Handbook for Systematic Reviews of Interventions Version 6.3 (updated February 2022). Cochrane, 2022. Available from training.cochrane.org/handbook.
Listl 2015
- Listl S, Galloway J, Mossey PA, Marcenes W. Global economic impact of dental diseases. Journal of Dental Research 2015;94(10):1355-61. [PMID: ] [DOI] [PubMed] [Google Scholar]
Mahatani 2020
- Mahtani AA, Jeevanandan G, Jain RK. Prevalence of gingivitis in 5-6 year old children with early childhood caries - a retrospective study. European Journal of Molecular & Clinical Medicine 2020;7(1):1313-21. [Google Scholar]
Manton 2018
- Manton DJ. Child dental caries – a global problem of inequality. EClinicalMedicine 2018;1:3-4. [DOI] [PMC free article] [PubMed] [Google Scholar]
Milsom 1995
- Milsom K. School dental screening – what value? British Dental Journal 1995;178(9):322. [PMID: ] [DOI] [PubMed] [Google Scholar]
Milsom 1999
- Milsom K, Tickle M, Jenner A, Moulding G. The identification of agreed criteria for referral following the dental inspection of children in the school setting. British Dental Journal 1999;186(1):37-40. [PMID: ] [DOI] [PubMed] [Google Scholar]
Milsom 2008
- Milsom KM, Tickle M, Blinkhorn AS. Is school dental screening a political or a scientific intervention? Journal of Dental Research 2008;87(10):896-9. [PMID: ] [DOI] [PubMed] [Google Scholar]
Montana 2016
- Montana DPHHS Oral Health Program, Oral Health Survey. The Oral Health of Montana’s Head Start Children. U.S. Department of Health & Human Services. Healthy People 2020: Oral Health Objectives 2016:1-4.
Morgan 2013
- Morgan M, Bennett H, Chief Dental Officer. Dental health screening – an overview of the literature. Studies 2013;5:7.
NCT02395120
- Nelson S. Family Access to Dentist Study (FADS). clinicaltrials.gov/ct2/show/NCT02395120 (first received 20 March 2015).
Newacheck 2000
- Newacheck PW, Hughes DC, Hung YY, Wong S, Stoddard JJ. The unmet health needs of America's children. Pediatrics 2000;105(4 Pt 2):989-97. [PMID: ] [PubMed] [Google Scholar]
Nguyen 2017
- Nguyen TM, Hsueh YS, Morgan MV, Marino RJ, Koshy S. Economic evaluation of a pilot school-based dental checkup program. JDR Clinical & Translational Research 2017;2(3):214-22. [DOI] [PubMed] [Google Scholar]
NHS 2000
- Taylor G. Modernising NHS dentistry – implementing the NHS plan. Community Dental Health 2000;17(4):207-9. [PubMed]
NICE guideline 2004
- National Institute for Health and Clinical Excellence. Dental recall: recall interval between routine dental examinations. Available at: www.nice.org.uk/guidance/CG19 (accessed 22 November 2016).
Petersen 2003
- Petersen PE. The World Oral Health Report 2003: continuous improvement of oral health in the 21st century – the approach of the WHO Global Oral Health Programme. Community Dentistry and Oral Epidemiology 2003;31(Suppl 1):3-23. [PMID: 15015736] [DOI] [PubMed] [Google Scholar]
Pitts 2015
- Pitts N, Chadwick B, Anderson T. Children's Dental Health Survey 2013, Technical report. Health & Social Care Information Centre; www.hscic.gov.uk 19 March 2015.
Prabakar 2020
- Prabakar J, Arumugham IM, Sri Sakthi D, Kumar RP, Leelavathi L. Prevalence and comparison of dental caries experience among 5 to 12 year old school children of Chandigarh using dft/ DMFT and SiC Index: a cross-sectional study. Journal of Family Medicine and Primary Care 2020;9(2):819-25. [PMID: ] [DOI] [PMC free article] [PubMed] [Google Scholar]
Pruthi 2013
- Pruthi N, Sogi GM, Fotedar S. Malocclusion and deleterious oral habits in a north Indian adolescent population: a correlational study. European Journal of General Dentistry 2013;2(3):257. [Google Scholar]
Public Health England 2020
- Public Health England. Oral health survey of 5-year-old children 2019. Results of the National Dental Epidemiology Programme biennial survey which took place in the academic year 2018 to 2019. www.gov.uk/government/statistics/oral-health-survey-of-5-year-old-children-2019 (accessed 22 July 2022).
Reiss 1982
- Reiss ML, Bailey JS. Visiting the dentist: a behavioral community analysis of participation in a dental health screening and referral program. Journal of Applied Behavior Analysis 1982;15(3):353-62. [DOI] [PMC free article] [PubMed] [Google Scholar]
Review Manager 2014 [Computer program]
- Review Manager 5 (RevMan5). Version 5.3. Copenhagen: Nordic Cochrane Centre, The Cochrane Collaboration, 2014.
Robles 2013
- Robles MJ, Ruiz M, Bravo PM, Gonzalez E, Pealver MA. Prevalence of enamel defects in primary and permanent teeth in a group of schoolchildren from Granada (Spain). Medicina Oral Patologia Oral y Cirugia Bucal 2013;18(2):e187–93. [PMID: ] [DOI] [PMC free article] [PubMed] [Google Scholar]
Rowan‐Legg 2013
- Rowan-Legg A, Community Paediatrics Committee. Oral health care for children – a call for action. Paediatrics & Child Health 2013;18(1):37. [PMID: 24381493] [DOI] [PMC free article] [PubMed] [Google Scholar]
Sanjeevan 2019
- Sanjeevan V, Janakiram C, Joseph J. Effectiveness of school-based dental screening in increasing dental care utilization: a systematic review and meta-analysis. Indian Journal of Dental Research 2019;30(1):117-24. [PMID: ] [DOI] [PubMed] [Google Scholar]
Schünemann 2011
- Schünemann HJ, Oxman AD, Vist GE, Higgins JP, Deeks JJ, Glasziou P, et al. Chapter 12: Interpreting results and drawing conclusions. In: Higgins JP, Green S, editor(s), Cochrane Handbook for Systematic Reviews of Interventions Version 5.1.0 (updated March 2011). The Cochrane Collaboration, 2011. Available from training.cochrane.org/handbook/archive/v5.1/.
Sterne 2011
- Sterne JA, Egger M, Moher D, editor(s). Chapter 10: Addressing reporting biases. In: Higgins JP, Green S, editor(s). Cochrane Handbook for Systematic Reviews of Interventions. Version 5.1.0 (updated March 2011). The Cochrane Collaboration, 2011. Available from training.cochrane.org/handbook/archive/v5.1/.
Threlfall 2006
- Threlfall AG, Milsom K, Catleugh M, Kearney-Mitchell P, Blinkhorn A, Tickle M. A survey of school dental screening practise in community dental services of England and Wales in 2003. Community Dental Health 2006;23(4):236-8. [PMID: ] [PubMed] [Google Scholar]
Tickle 1999a
- Tickle M, Williams M, Jenner T, Blinkhorn A. The effects of socioeconomic status and dental attendance on dental caries' experience, and treatment patterns in 5-year-old children. British Dental Journal 1999;186(3):135-7. [PMID: ] [DOI] [PubMed] [Google Scholar]
Tickle 1999b
- Tickle M, Milsom K. Oral screening: time for a change of terminology and methodology. Journal of Medical Screening 1999;6(3):163-4. [PMID: ] [DOI] [PubMed] [Google Scholar]
WHO 2003
- World Health Organization. Oral health promotion: an essential element of a health-promoting school. Available from apps.who.int/iris/handle/10665/70207 2003.
WHO 2013
- World Health Organization. Oral health surveys basic methods – 5th edition. Available at www.icd.org/content/publications/WHO-Oral-Health-Surveys-Basic-Methods-5th-Edition-2013.pdf 2013.
Zhou 2016
- Zhou Z, Liu F, Shen S, Shang L, Shang L, Wang X. Prevalence of and factors affecting malocclusion in primary dentition among children in Xian, China. BMC Oral Health 2016;16(1):91. [DOI] [PMC free article] [PubMed] [Google Scholar]
References to other published versions of this review
Arora 2017a
- Arora A, Khattri S, Ismail NM, Kumbargere Nagraj S, Prashanti E. School dental screening programmes for oral health. Cochrane Database of Systematic Reviews 2017, Issue 12. Art. No: CD012595. [DOI: 10.1002/14651858.CD012595.pub2] [DOI] [PMC free article] [PubMed] [Google Scholar]
Arora 2017b
- Arora A, Khattri S, Ismail NM, Sumanth KN, Prashanti E. School dental screening programmes for oral health. Cochrane Database of Systematic Reviews 2017, Issue 3. Art. No: CD012595. [DOI: 10.1002/14651858.CD012595] [DOI] [PMC free article] [PubMed] [Google Scholar]
Arora 2019
- Arora A, Khattri S, Ismail NM, Kumbargere Nagraj S, Eachempati P. School dental screening programmes for oral health. Cochrane Database of Systematic Reviews 2019, Issue 8. Art. No: CD012595. [DOI: 10.1002/14651858.CD012595.pub3] [DOI] [PMC free article] [PubMed] [Google Scholar]