

Abstract
The liver is the major target organ of continued alcohol consumption at risk and resulting alcoholic liver disease (ALD) is the most common liver disease worldwide. The underlying molecular mechanisms are still poorly understood despite decades of scientific effort limiting our abilities to identify those individuals who are at risk to develop the disease, to develop appropriate screening strategies and, in addition, to develop targeted therapeutic approaches. ALD is predestined for the newly evolving translational medicine, as conventional clinical and health care structures seem to be constrained to fully appreciate this disease. This concept paper aims at summarizing the 15 years translational experience at the Center of Alcohol Research in Heidelberg, namely based on the long-term prospective and detailed characterization of heavy drinkers with mortality data. In addition, novel experimental findings will be presented. A special focus will be the long-known hepatic iron accumulation, the somewhat overlooked role of the hematopoietic system and novel insights into iron sensing and the role of hepcidin. Our preliminary work indicates that enhanced red blood cell (RBC) turnover is critical for survival in ALD patients. RBC turnover is not primarily due to vitamin deficiency but rather to ethanol toxicity directly targeted to erythrocytes but also to the bone marrow stem cell compartment. These novel insights also help to explain long-known aspects of ALD such as mean corpuscular volume of erythrocytes (MCV) and elevated aspartate transaminase (GOT/AST) levels. This work also aims at identifying future projects, naming unresolved observations, and presenting novel hypothetical concepts still requiring future validation.
Key words: alcoholic liver disease, iron overload, hemolysis, erythrophagocytosis, hepcidin, cd163, red blood cell
Introduction
Alcoholic liver disease (ALD) is the most frequent cause of severe liver disease in Europe. Based on the WHO database, more than 40% of the liver deaths are attributed to alcohol.[1] The number of performed liver transplantations for patients with ALD-related cirrhosis has increased over the past two decades, both in Europe and in the USA.[2, 3] Despite the high burden of ALD, it is regrettable that most patients with ALD are diagnosed at the decompensation stage. Moreover, a large proportion of patients with newly diagnosed cirrhosis had recent consultations in primary care or emergency units,[4] without any intervention. As shown in Figure 1, ALD includes a wide spectrum of lesions ranging from steatosis to steatohepatitis, progressive liver fibrosis, cirrhosis and its complications.[1] Although steatosis is almost constant in heavy drinkers, it is estimated that only 10%–20% will eventually develop cirrhosis.[5] Since the presence of advanced fibrosis or cirrhosis in compensated patients is the main predictor of long-term survival,[6] it is of clinical importance to diagnose those patients with advanced fibrosis before decompensated stage, in order to promote abstinence and improve survival. Figure 1 also demonstrates another key feature of ALD, the hepatic iron accumulation over years, which is an independent factor for disease progression and long-term survival.
Figure 1.

Alcoholic liver disease progresses from steatosis to cirrhosis. All stages show distinct signs of iron overload. HCC: hepatocellular carcinoma.
Pathogenesis of ALD
Although many individuals consuming more than 60 g of alcohol per day (e.g. ½ a bottle of wine or more than 1 liter of beer) develop steatosis, only a minority of the patients with steatosis progress to alcoholic steatohepatitis (ASH) and 10%–20% eventually develop cirrhosis.[5] Genetic and non-genetic factors modify both the individual susceptibility and the clinical course of ALD.[7] The mechanisms of ALD are not completely understood. Most studies have been performed in rodents with chronic alcohol intake (e.g. Tsukamoto-French model or Lieber-DeCarli diet). However, these models basically induce moderate liver disease and severe fibrosis or liver damage do not develop. Few studies have been performed so far in livers from patients with ALD. These translational studies are needed to develop novel targeted therapies for these patients.[7]
Hepatic alcohol metabolism
The liver is the major alcohol-metabolizing organ in humans. Ethanol is metabolized in hepatocytes that represent approx 70% of the total liver mass. Hepatocytes oxidize ethanol to acetate mainly by three pathways[8] (Figure 2). Generally, hepatocytes express the highest levels of the major ethanol-oxidizing enzymes: (1) alcohol dehydrogenase (ADH) which is located in the cytosol. (2) cytochrome P450 2E1 (CYP2E1), which resides in the smooth endoplasmic reticulum (ER) of hepatocytes and is strongly induced in drinkers. (3) hepatic peroxisomal catalase (CAT), which decomposes hydrogen peroxide (H2O2) representing a relatively minor pathway of ethanol metabolism. However, it presents a larger ethanol-oxidizing function in the brain.[9]
Figure 2.
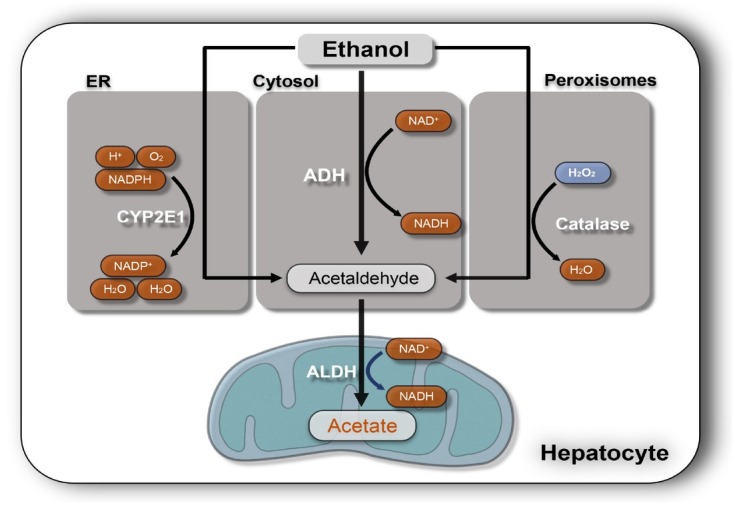
Major three ethanol-oxidizing pathways in the liver. ADH is the major enzyme for breaking down ethanol to AA and reduced NAD+ (NADH) in hepatocytes. AA is the major toxic product of ethanol oxidization. Cytochrome P450 2E1 (CYP2E1) is another major inducible oxidoreductase expressed in the ER that oxidizes ethanol to AA and converts reduced NADPH to its oxidized form (NADP+) also causing ROS formation. Peroxisomal catalase is a minor ethanol metabolism pathway in the liver that normally degrades hydrogen peroxide (H2O2) to water but can also oxidize ethanol to AA. ER: endoplasmic reticulum; ALDH: aldehyde dehydrogenase; NADPH: nicotinamide adenine dinucleotide phosphate; ADH: alcohol dehydrogenase; AA: acetaldehyde; ROS: Reactive oxygen species.
Oxidative stress in ALD
Oxidative stress triggered by alcohol is another major contributor to the pathogenesis of the ALD.[10,11] Oxidative stress is defined as an imbalance in pro-oxidant/antioxidant reactive species (pro-oxidant side occupies the leading status) that lead to damage of cellular macromolecules. Reactive oxygen species (ROS) typically refer to superoxide, hydrogen peroxide, and the hydroxyl radical (Table 1). ROS have been implicated in promoting inflammation, apoptosis, necrosis, and carcinogenic DNA damage in ALD.[12, 13, 14] Alcohol-mediated ROS formation is triggered by various pathways including cytochrome P450 2E1 (CYP2E1), alcohol-induced inflammation, in vivo[10] several enzymatic and non-enzymatic mechanisms (Figure 3).[15] CYP2E1 is an effective ROS generator and potential mechanisms of ROS generation have been intensively discussed.[16] Chronic alcohol consumption leads to structural and functional abnormalities in hepatic mitochondria, which have been also implicated in ROS overproduction. Excessive levels of reducing equivalents (e.g. NADH), produced by alcohol and ADH or CYP2E1 may enter the mitochondrial respiratory chain facilitating superoxide anion formation.[11] Superoxide-removing superoxide dismutase (SOD) is affected by alcohol exposure.[17] ROS-producing enzymes include also NADPH oxidases (NOXs) in Kupffer cells and neutrophils that can further promote the secretion of inflammatory cytokines, for instance, interleukin-1β (IL-1β)[18,19] and recent studies have highlighted the role of e.g. NOX4 in ALD.[20] Thus, inhibition of NOX4 ameliorated liver injury in rodent ALD models.[21, 22, 23] Notably, conditions such as hypoxia typically seen during ethanol-metabolism[24] can induce NOX4-mediated H2O2 generation in hepatocytes.[25] Finally, Gram negative bacteria-driven lipopolysaccharide (LPS) plays a key role in ROS generation in ALD patients.[26] LPS binds to Toll-like receptor 4 (TLR4) expressed on a wide variety of cells in the liver triggering hepatic inflammation and liver damage. Notably, Park et al.[27] demonstrated that NOX4 interacts with the TLR4 resulting in ROS generation in monocytes under LPS participation.
Table 1.
ROS/RNS and antioxidative defense systems
| ROS/RNS | Antioxidative defense systems |
|
|---|---|---|
| Enzymatic defenses | Non-enzymatic defenses | |
| Superoxide anion (O2·-) | SODs (against O2·-) | Vitamin E/C/A |
| Hydrogen peroxide (H2O2) | GSH (against H2O2) | Ubiquinone |
| Hydroxyl radical (·OH) | Glutathione peroxidases (GPx 1-8) | Uric acid |
| Peroxyl radical (ROO·) | Catalase (CAT) | Bilirubin, etc. |
| Nitrix oxide (NO) | Peroxiredoxins | |
| Nitrogen dioxide (·NO2) | Heme oxygenases (HO) | |
| Peroxynitrite (ONOO) | Thioredoxin (Trx) system | |
| Ferritin | ||
| Ceruloplasmin | ||
SOD: superoxide dismutase; GSH: glutathione; ROS: Reactive oxygen species; RNS: reactive nitrogen species.
Figure 3.
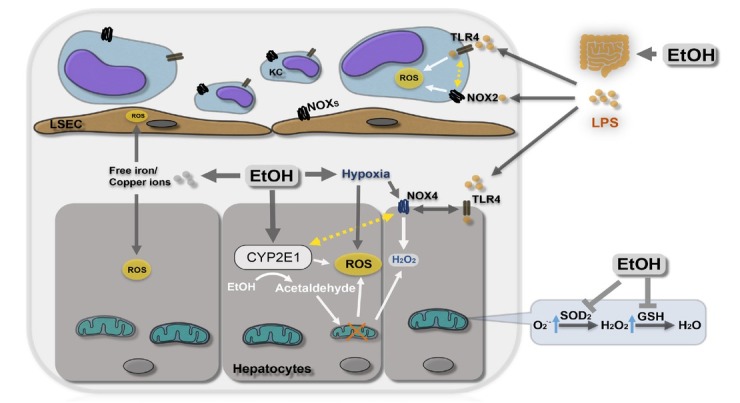
Ethanol metabolism and ROS formation. Enzymatic and non-enzymatic factors including inflammation, hypoxia, free iron are all able to enhance oxidative stress in ALD. EtOH: ethanol; ROS: Reactive oxygen species; O2.-: superoxide anion; H2O2: hydrogen peroxide; CYP2E1: cytochrome P450 2E1; NOX: nicotinamide adenine dinucleotide phosphate oxidase; SOD: superoxide dismutase; LPS: lipopolysaccharide; TLR4: Toll-like receptor 4; KC: Kupffer cell; LSEC: liver sinusoidal endothelial cells; GSH: reduced glutathione.
ALD pathogenesis according to disease stages
There are four main pathogenic factors that drive the development of alcoholic fatty liver: (1) Increased generation of NADH caused by alcohol oxidation, favoring fatty acid and triglyceride synthesis and inhibiting mitochondrial β-oxidation of fatty acids.[28] (2) Enhanced hepatic influx of free fatty acids from adipose tissue and of chylomicrons from the intestinal mucosa.[28] (3) Ethanol-mediated inhibition of adenosine monophosphate activated kinase (AMPK) activity[29] resulting in increased lipogenesis and decreased lipolysis by inhibiting peroxisome proliferating-activated receptor α (PPARa)[30] and stimulating sterol regulatory element binding protein 1c (SREBP1c).[31] (4) Damage to mitochondria and microtubules by acetaldehyde, resulting in a reduction of NADH oxidation and the accumulation on VLDL, respectively.[28]
Regarding the development of inflammation (ASH), alcoholic fatty livers can develop parenchymal inflammation (mainly by polymorphonuclear cells) and hepatocellular damage, a prerequisite for progressing to fibrosis and cirrhosis. In cases of severe alcoholic hepatitis (AH), it is associated with a poor prognosis.[32] Various factors may contribute to the development of ASH and AH including direct lipo-toxicity or acetaldehyde-induced toxicity.
(1) Acetaldehyde binds to proteins[33] and to DNA[34] resulting in functional alterations and protein adducts, which activate the immune system by forming autoantigens. It also induces mitochondria damage and impairs glutathione function, leading to oxidative stress and apoptosis.[35]
(2) ROS generation as mentioned above and the resulting lipid peroxidation with DNA adduct formation.[36] Main sources of ROS include CYP2E1-dependent MEOS, mitochondrial electron transport system of the respiratory chain, NADH-dependent cytochrome reductase and xanthine oxidase.[37,38] Moreover, chronic alcohol intake markedly up-regulates CYP2E1, which metabolizes ethanol to acetaldehyde and parallels the generation of ROS and hydroxyl-ethyl radicals.[39]
(3) Pro-inflammatory cytokines. Alcohol metabolites and ROS stimulate signaling pathways such as NF-κB, STAT-JAK, and JNK in hepatic resident cells, leading to the local synthesis of inflammatory mediators such as TNFα and CXC chemokines (e.g. IL-8), as well as osteopontin.[40] Alcohol abuse also results in changes in the colonic microbiota and increased intestinal permeability, leading to elevated serum levels of lipopolysaccharides[41] that induce inflammatory actions in Kupffer cells via CD14/ TLR4.[42] The resulting inflammatory milieu in the alcoholic liver leads to polymorphonuclear(PMN) infiltration, ROS formation and hepatocellular damage.
(4) Impaired ubiquitin-proteasome pathway leading to hepatocellular injury and hepatic inclusions of aggregated cytokeratins (i.e. Mallory-Denk Bodies).[43]
Fibrosis progression in ALD
Fibrosis progression in ALD is primarily observed in patients with ASH.[44] In ALD, the fibrotic tissue is typically located in pericentral and perisinusoidal areas. In advanced stages, collagen bands are evident and bridging fibrosis develops. This condition precedes the development of regeneration nodules and liver cirrhosis. The cellular and molecular mechanisms of fibrosis in ALD are not completely understood.[45] Alcohol metabolites such as acetaldehyde can directly activate hepatic stellate cells, the main collagen-producing cells in the injured liver. hepatic stellate cells can also be activated paracrinally by damaged hepatocytes, activated Kupffer cells and infiltrating PMN cells. These cells release fibrogenic mediators such as growth factors (TGFβ1, PDGF), cytokines (leptin, angiotensin II, IL-8 and TNFα), soluble mediators (nitric oxide) and ROS. Importantly, ROS stimulate pro-fibrogenic intracellular signaling pathways in hepatic stellate cells including ERK, PI3k/AKT and JNK.[46] They also up-regulate TIMP-1 and decrease the actions of metalloproteinases, thereby promoting collagen accumulation. Cells other than hepatic stellate cells can also synthesize collagen in ALD. They include portal fibroblasts and bone-marrow derived cells. Whether other novel mechanisms such as epithelia-to-mesenchymal transition of hepatocytes also play a role in liver fibrosis is under investigation.[47]
Unexplained laboratory observations in patients with ALD
Drinkers show typical laboratory findings.[48] Some of them are textbook knowledge, some of them are less known although characteristic for ALD. For instance, glutamyltransferase (GGT) is frequently elevated (induced) in drinkers but the exact role of this bile-duct expressed enzyme and why it is upregulated is not known. In addition, it can be described as almost mandatory that aspartate transaminase (glutamic-oxaloacetic transaminase[GOT] /aspartate aminotransferase [AST] ) is higher as alanine transaminase (glutamic-pyruvic transaminase [GPT] / alanine aminotransferase [ALT] ) in patients with ALD (so called De Ritis Ratio GOT/GPT). Although it is generally assumed that both enzymes are liver derived, the reason for the elevated De Ritis Ratio is not really known and it is not plausible that mitochondrial GOT should be more leak in the presence of a toxin such as ethanol. An elevated mean corpuscular volume of erythrocytes (MCV) is also a quite frequent laboratory finding in patients with ALD and even part of formerly published diagnostic scores.[48] Surprisingly, an assumed deficiency of folic acid or vitamin B12 is normally not confirmed in these patients. As we and others have shown repeatedly, a significant fraction of patients with ALD has elevated ferritin levels, in 15% even higher than 1000 ng/mL.[48] Less obvious are the notoriously if only slightly reduced levels of hemoglobin (Hb). One major complicating factor with regard to the laboratory is that all these markers depend on the disease stage. For instance, transaminase levels will continuously decrease and even normalize once cirrhosis has developed. Of note, at this stage, GOT will be typically higher as GPT independent of the etiology. Another typical finding in ALD, namely during icteric episodes of ASH, AH or in cirrhotics, is elevated bilirubin. This is mostly conjugated bilirubin, not indirect, unconjugated bilirubin and indicates that bilirubin conjugation is normally not impaired in patients with ALD. In fact, icterus in ALD typically resembles the laboratory profile of mechanic cholestasis despite the absence of congested bile ducts e.g. in the ultrasound analysis. This observation still requires further confirmative studies but could be indeed explained by mechanic factors such as ballooning leading to compression of bile canaliculi and small bile ducts causing an impaired bile flow.
Hepatic iron overload in ALD
Hepatic iron accumulation and chronic alcohol consumption have been associated for a long time (Figures 1 and 4).[49] In ALD patients, iron has been identified as independent risk factor both for survival and hepatocellular carcinoma (HCC) development[50] comparable to patients with hereditary iron overload.[51] These observations have driven for a long time the interest in molecular iron homeostasis, since iron is not only highly toxic but also essential for life (Figure 5A). The carcinogenic potential of tissue iron accumulation is highly attributed to Fenton-like reactions which occur in the presence of ferrous iron and H2O2, yielding to highly reactive hydroxyl radicals (Figure 5B).[52] Several enzymes are able to generate H2O2 predominantly during the inflammation typically observed in ALD, however CYP2E1 and its induction by ethanol is regarded as key player in alcohol-mediated ROS production (Table 1).[53] Thus, chronic alcohol consumption results in an up to 20 fold increased CYP2E1 expression.[35] Furthermore, ethanol-induced oxidative stress is also the result of an impaired antioxidant defense mechanisms as well as impaired synthesis of mitochondria-encoded constituents of the respiratory chain particularly cytochrome b and the production of ROS by leakage from complex I and III of the respiratory chain.[37] In addition, activated phagocytes also contribute to ROS.[37] In addition, excessive iron accumulates in lysosomes that originates from auto-phagocytosed ferritin and hemosiderin. It often leads to fragile membranes via lipid peroxidation and subsequent lysosomal dysfunction with the loss of free iron into the cytoplasm.[54] The iron-associated toxicity is due to mutagenic effects of free radicals resulting in DNA damage and structural alteration of lipids and proteins. An example is the cleavage of lipid hydroperoxides, resulting in aldehydes, such as malondialdehyde (MDA) and 4-hydroxynonenal (4-HNE), which can react with the amino group of lysine and histidine residues[55] and DNA bases[56] forming extremely mutagenic adducts. Indeed, these adducts can specifically target the p53 tumor suppressor gene conferring apoptotic resistance to the cells.[57] Therefore, 4-HNE has been used as an indicator of radical-mediated cellular damaged and oxidized hepatocytes and it correlates well with hepatic iron levels.[58] Recent in vitro studies indicate that mitophagy, the selective clearance of damaged mitochondria by autophagy in the liver, may also play a role in mediating hepatocyte apoptosis.[59] Acute and chronic ethanol treatment in various animal models results in enhanced mitophagy which is associated with mitochondrial translocation of cytosolic Parkin (an E3 ubiquitin ligase maintaining mitochondrial homeostasis) caused by oxidative mitochondrial DNA damage. Parkin also co-localizes with accumulated 8-oxo-2'-deoxyguanosine, a marker of oxidative mitochondrial DNA damage in ethanol exposed hepatocytes which may be a stimulus for DNA repair and the prevention of carcinogenesis.[60] For these reasons and because mitochondria are the main target organelles for alcohol toxicity, modulation of Parkin translocation may be a new therapeutic option in patients with ALD. Taken together, the actual role of iron (particular non-protein Fe complexes) and how alcohol favors iron accumulation are still under intensive investigation, but clinical data clearly show that iron overload and oxidative stress in ALD is tightly linked with the progression to hepatocellular damage, liver-related death and carcinogenesis.
Figure 4.
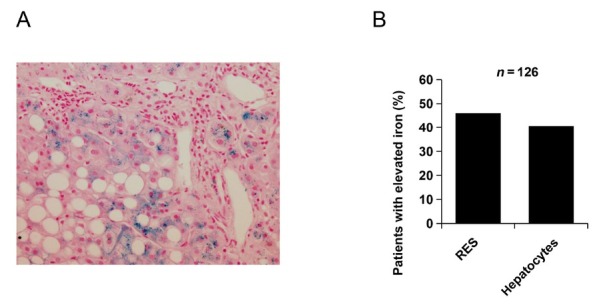
Hepatic iron accumulation in ALD. (A) Staining with Hematoxylin Eosin and iron marker Prussian blue indicating iron accumulation in hepatocytes and macrophages in a typical patient with ALD. (B) Statistical analysis in the Heidelberg ALD cohort indicates that almost 50% have pathological iron overload both in hepatocytes and macrophages (RES). ALD: alcoholic liver disease; RES: reticluoendothelial system.
Figure 5.
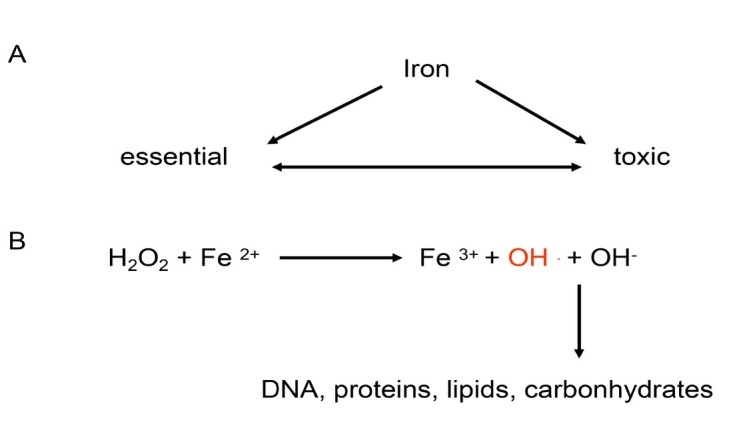
Schematic overview of iron toxicity. (A) Iron plays a bivalent role in cell physiology. It is both vital for many cell functions but also (B) highly toxic and carcinogenic through the generation of hydroxyl radicals (Fenton chemistry).
Iron homeostasis and recycling: important role of liver and blood
In the last decades, an enormous progress has been made to better comprehend the molecular mechanisms of iron regulation and homeostasis at the systemic and the cellular level.[61-62] In humans, most of the body’s iron (4 g) is found in the oxygen-carrying Hb of erythrocytes (Figure 6). The remaining iron is stored in hepatocytes (1 g) and in reticuloendothelial macrophages in the form of ferritin. Thus, the liver represents an important reservoir of excess iron while macrophages phagocytose the senescent red blood cells (RBCs) (erythrophagocytosis) ultimately recycling the iron from Hb to transferrin for novel synthesis pathways.[63] Dietary uptake (1–2 mg/d) of iron is carried out by duodenal enterocytes and its efficient control is critical for the homeostasis, since iron is passively lost from regular sloughing of the mucosa and skin or during bleeding (Figure 6).[61] About 90% of iron, however, is recycled from senescent erythrocytes that typically have a mean survival of 120 d.[63] In other words, and considering that an average individual has 5 L total blood (4 g iron) approx 40 mL blood are recycled every day which equals ca. 30 mg iron. Likewise, 30 mg of iron are required daily for erythropoiesis in the bone marrow, which is mainly covered from sequestered RBCs via the reticuloendothelial system. These cells metabolize heme via HO1 and release iron into the serum, where it is distributed to tissues via serum transferrin (Figure 6B). Often overlooked, the liver plays also an important role in heme and iron recycling. While erythrocytes are first sequestered in the spleen, liver macrophages are also able to take up erythrocytes. The liver is also the major location for bilirubin glucuronidation and excretion through the bile duct. Mechanic obstruction of canaliculi, small bile ducts or direct hepatocyte damage through e.g. alcoholic liver injury/ballooning will also cause accumulation of bile content including bilirubin and bile acids.
Figure 6.
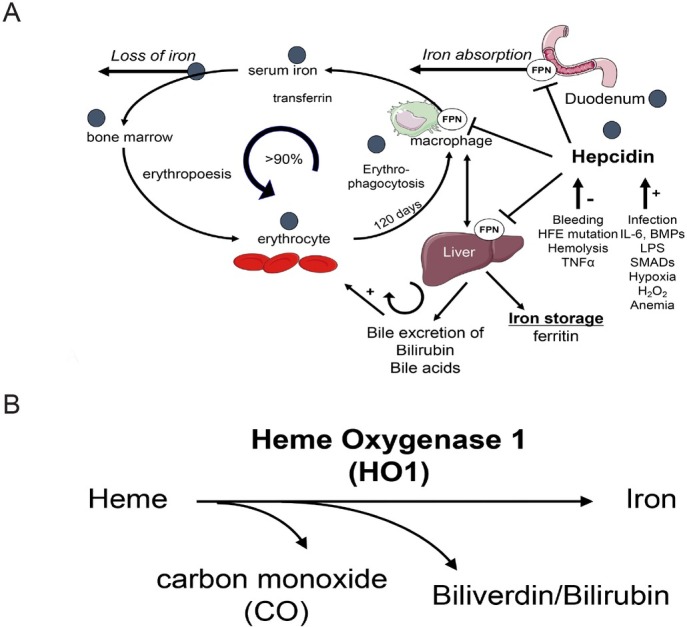
(A) Iron homeostasis and utilization in the body. Dietary iron is absorbed in the duodenum and binds to transferrin. Iron is then delivered to the bone marrow for erythropoiesis the major utilization pathway. Senescent RBCs are phagocytosed by macrophages (erythrophagocytosis) and ca. 90% of iron is recycled for heme synthesis. Excess iron is stored in ferritin in the liver. Regulation of iron metabolism by hepcidin and factors which influence hepcidin expression is also shown. Black circles indicate potential sites of alcohol interference. (B) Heme degradation by HO1. Notably, the heme binding respiratory chain-blocker CO is produced and toxic iron is release. In addition, bilirubin is ultimately conjugated in the liver and excreted through the biliary system. Bilirubin and bile acids can both cause eryptosis and hemolysis at higher concentrations. FPN: ferroportin; HFE: hemochromatosis protein; BMP: bone morphogenetic protein; LPS: lipopolysaccharide; RBC: red blood cell.
Erythrocytes are either directly phagocytosed by macrophages or released toxic heme is bound to either haptoglobin (Hp) or hemopexin (Hpx) and internalized through the receptors CD163 or CD91.[64,65] During erythrophagocytosis, heme oxygenase (HO) catalyzes the enzymatic degradation of heme and produces equimolar amounts of carbon monoxide (CO), biliverdin and iron.[66, 67, 68, 69] In a coupled reaction, biliverdin is converted into bilirubin (BR) via biliverdin reductase (Figure 6B).[70] Of the two genetically distinct HO isoforms, HO-2 is constitutively expressed and mainly found in brain and testis,[71] whereas the inducible HO isozyme HO1 is expressed at low levels in most cells and tissues.[68] HO1 is markedly up-regulated by its substrate heme and a variety of oxidative stress stimuli[72,73] and HO1 induction has been considered a general adaptive response to protect against the toxicity of oxidative stress.[74, 75, 76, 77] HO1 deficient mice develop a chronic inflammatory disorder and are highly vulnerable to an experimental sepsis induced by the classical proinflammatory mediator endotoxin.[78] Second, these animals exhibit a marked hemosiderosis of solid organs such as the liver and kidney.[79] Finally, Figure 6A also highlights assumed and potential sides of impaired iron regulation by alcohol.[52]
Systemic iron control by hepcidin
Systemically, iron is mainly controlled by the hormone hepcidin (Figures 6 and 8). This 25 amino-acid peptide is primarily expressed in hepatocytes although low expression levels have been also reported in macrophages[80,81] representing about 10% of total serum hepcidin.[18] By binding to the unique iron exporter, ferroportin, hepcidin efficiently inhibits duodenal iron absorption, iron recycling from macrophages and iron mobilization from hepatic stores. Hepcidin blocks the iron efflux into the plasma by binding ferroportin and consequently inducing the phosphorylation, internalization and lysosomal degradation of the complex by the proteasome.[82] Deletion of hepcidin in mice or hepcidin deficiency in humans results in severe hepatic iron overload, increased serum iron levels and loss of iron in macrophage stores, caused by hyperabsorption of iron.[83] In contrast, transgenic overexpression of hepcidin causes decreased serum iron leading to anemia by blocking the iron absorption in enterocytes and the release of iron from the hepatic stores.[84, 85] The conventional, present understanding of major regulatory pathways of hepcidin is summarized in Figure 7.
Figure 8.
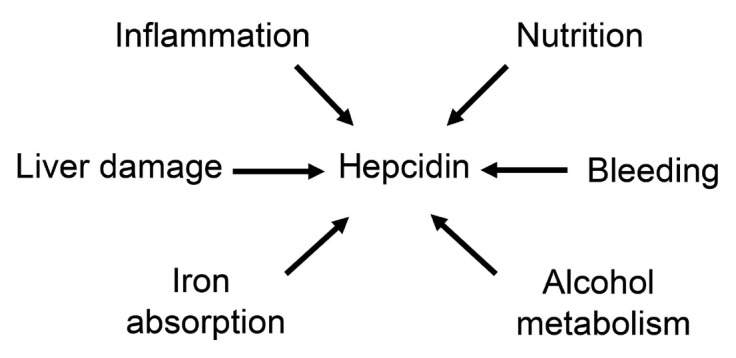
Important factors affecting hepcidin in patients with ALD. ALD: alcoholic liver disease.
Figure 7.
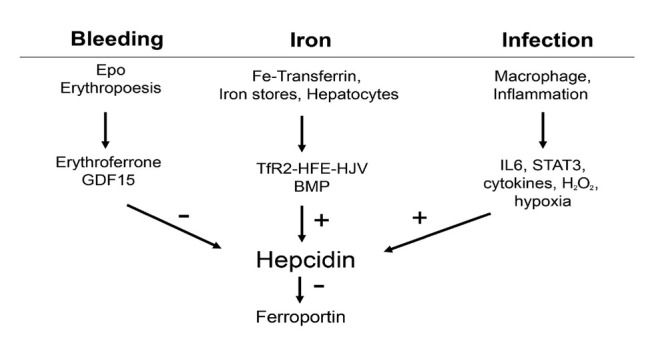
Present concepts of signaling pathways on hepcidin: erythropoiesis, iron, infection. These conventional concepts are not able e.g. why hepcidin is strongly suppressed in patients with severe hemolytic disease and why hepcidin is stimulated by iron in vivo but suppressed in vitro. BMP: bone morphogenetic protein; IL6: interleukin 6; STAT3: signal transducer and activator of transcription 3.
Transcriptional regulation of hepcidin
The levels of circulating hepcidin are mostly controlled at the transcriptional level. Hepcidin promoter activity can be induced by iron signals, including serum iron concentrations and liver stores, or by inflammatory signals and suppressed during increased erythropoietic activity. In general, the transcriptional control of hepcidin by iron occurs via the bone morphogenic protein-SMAD (BMP/SMAD) pathway. High circulating concentrations of transferrin-bound iron (Tf-Fe) are the extracellular signal for transcriptional induction of hepcidin.[86] Tf-Fe modulates the interaction between the transferrin receptors (TFR) 1 and 2 and hemochromatosis protein (HFE) by inhibiting the binding of HFE to TFR1. Consequently, HFE stabilizes activin receptor-like kinase 3 (ALK3), which activates BMP/SMAD signaling cascade.[87] Increased Tf-Fe concentrations can also promote the association between HFE and TFR2 that can further form a membrane complex with the BMP the co-receptor HJV, promoting hepcidin transcription via BMP/SMAD pathway.[88] Besides the iron, inflammatory signals as TGF-β, activin B and BMPs are also inductors of BMP/SMAD signaling while matripase-2 and furin act as suppressors by cleavage of the cell surface hemojuvelin (HJV) protein.[89, 90, 91, 92, 93]
Increased erythropoiesis, caused by exposure to high altitude, anemia or other physiological conditions, is so far described as the major inhibitory stimuli of hepcidin synthesis. Increased erythropoietin (EPO) release by the kidney is the major feature of erythropoiesis, being the proposed critical factor for erythropoiesis-mediated downregulation of hepcidin.[94] Despite many efforts over the last decade, there are still many open questions on how EPO suppresses hepcidin. Years ago, several studies have associated the suppression of hepcidin with two erythroid regulators (GDF15 and TWSG1), which are normally increased during erythropoiesis. However, the direct link between these proteins and hepcidin regulation is still missing.[86] A more recent study has identified another erythroid regulator as part of the hepcidin-EPO axis, called erythroferrone (ERFE).[95, 96]
The induction of hepcidin during inflammation or infection constitutes an important evolutionary conserved mechanism known as “anemia of chronic disease”. This mechanism describes a host defense response against invading extracellular pathogens, in which IL-6 plays a key role as a major upstream regulator via STAT3 pathway leading to hepcidin induction.[97] Recently, H2O2 has been suggested as additional important inflammatory cofactor and second messenger capable of upregulating hepcidin by activation of the STAT3 signaling cascade.[98] In particular, hepcidin can be strongly induced by exposing hepatoma cells to sustained H2O2 concentrations similar to that released by inflammatory cells.[98] Subsequent studies have confirmed the role of STAT3 in the H2O2-mediated hepcidin induction.[99,100] Other studies reported contrary findings and demonstrated a suppression of hepcidin in alcohol-fed mice by ROS.[101] However, no mechanistic details were provided and we had earlier shown that the concentration of peroxide is crucial for hepcidin transcription.[98] While low levels induce hepcidin, toxic levels drastically block hepcidin most likely through unspecific inhibition of the transcription machinery.
In the context of ALD, H2O2 has been shown to have a complex, concentration-dependent and bivalent action on hepcidin. Since ethanol metabolism strongly affects hepatic oxygen homeostasis, liver hypoxia is thought to have an important impact on hepcidin regulation in vivo and in vitro.[102]
Cellular regulation of iron
Erythroid cells as well as all other cell types depend on the delivery of iron via the iron carrier serum transferrin (Tf), a glycoprotein with two affinity sites for ferric iron. Diferric Tf binds with high affinity to cell surface transferrin receptor 1 (TfR1) and with lower affinity to transferrin receptor 2 (TfR2).[103] Despite their homology, TfR2 does not significantly contribute to iron import and it is regarded as a sensor of Tf saturation. Genetic deletion of TfR1 in mice demonstrates its endocytotic role and ability to import iron into several cell types.[104] In non-erythroid cells, iron is safely stored in ferritin complexes or can be incorporated into Hb of erythrocytes, being later reused for various synthesis pathways.[105] Ferric iron stored in ferritin complexes (non-toxic form) must be subsequently released for biological use via lysosomal degradation of ferritin.[106] This mechanism of autophagy dominates during iron deficiency and is mediated by the nuclear receptor coactivator 4 (NCOA4).[107] It has been described that NCOA4 interacts with ferritin heavy chain targeting ferritin for degradation. In iron overloaded cells, NCOA4 expression decreases leading to suppression of ferritin autophagy.[108] A recent study described the retention of iron within ferritin in NCOA4 KO mice, which led to iron-deficiency anemia, highlighting the important role ferritin autophagy mechanism on cellular and systemic iron homeostasis.[109]
At the cellular level, central regulators of iron homeostasis are controlled post-transcriptionally by iron responsive proteins (IRP1 and IRP2) which are able to bind to the iron responsive elements (IREs) of the RNA encoding for various iron-related proteins. While binding to the IRE located in the 5’ untranslated region of the mRNA results in a translational inhibition, the bind of IRPs to the 3’ untranslated region stabilizes and protects the transcripts from degradation. In particular, IRPs can cause upregulation of TfR1 or suppress the translation of mRNA encoding other proteins involved in iron metabolism, such as ferritins or ferroportin.[110] During cellular iron deficiency, IRPs are in the active form (apo-IRP) and this results in TfR1 induction stimulating the acquisition of iron from plasma Tf. In contrast, to counteract iron overload, IRPs become inactive (holo-IRP) for IRE binding leading to degradation of TfR1 mRNA and translation of ferritin mRNA.[111]
The interactions IRE-IRP allow an autonomous independent control of iron homeostasis for individual cells, however, this network can be also overwritten by additional mechanisms. Namely, TfR1 expression is also regulated at the transcriptional and translational levels.[112,113] Interestingly, IRP1 is regulated in a complex manner by various ROS linking iron homeostasis to oxygen metabolism.[114, 115, 116]
Regulation of hepcidin by hypoxia
The hypoxic response is mainly controlled by hypoxia inducible factors (HIFs), which comprise an oxygen-dependent α subunit (HIFα) and the constitutively expressed β subunit (HIFβ). Under adequate oxygen levels prolyl hydroxylase domain-enzymes (PHDs) allow the binding of HIFα to Von Hippel-Lindau protein (VHL) leading to proteasomal degradation of HIFα. In contrast, decreased oxygen levels cause stabilization of HIFα by inhibition of PHDs and consequent block of VHL action.[117]
Since the last two decades, the role of hypoxia and HIFs on hepcidin regulation has been extensively investigated and the first reports in this field have shown the in vitro and in vivo inhibition of hepcidin at the mRNA level under hypoxic conditions.[118,119] In order to elucidate the molecular mechanisms involved in hypoxia-mediated hepcidin regulation, several authors have used HIF and VHL KO mice models to dissect the role of HIFs in controlling the hepcidin promoter activity. A genetic study with iron deficient and VHL KO mice in conjugation with transcriptional assays have suggested that HIF1 stabilization downregulates hepcidin, however, HIF1 alone was insufficient to explain hepcidin suppression under hypoxia. The same study suggested the direct suppression of hepcidin via a putative hypoxia response element located in the hepcidin promoter[120] but no further evidence could be provided until now. Moreover, subsequent reports suggested that HIF does not directly suppress the transcription of hepcidin.[121,122] Most recently, in vivo studies have shown that HIF-mediated suppression of hepcidin occurs indirectly through EPO-induced erythropoiesis, highlighting the contribution of HIF2 on hepcidin regulation.[123,124] Up to now, human studies have been published investigating the circulating hepcidin levels during the exposure to hypobaric hypoxia in conditions simulating high altitude.[125,126] The role of a new factor, the platelet derived growth factor BB (PDGF-BB), was recently described in humans and mice. The circulating concentration of PDGF-BB highly correlates with hepcidin but not with other parameters. In addition, PDGF-BB could suppress hepcidin mRNA in hepatoma cells and primary hepatocytes.[127]
While these reports clarified the regulation of hepcidin by systemic hypoxia, in which renal EPO release induces erythropoiesis depleting the serum iron, the in vivo response to specific liver hypoxia is still lacking. The control of hepcidin by hepatospecific hypoxia has been extensively described in vitro, resulting in multiple contradictory findings. [24] In general, it has been suggested that hypoxia induces the expression of hepcidin suppressors. Silvestri and colleagues identified HIF1α as down regulator of hepcidin transcription, through induction of furin.[128] Another study has identified increased expression of matriptase-2 in conditions of severe hypoxia. The authors emphasized the role of HIF1α and HIF2α for the hypoxia-mediated suppression of hepcidin, while subsequent experiments performed in primary mouse hepatocytes discarded HIF2α as hepcidin regulator.[124,129] At the same time, an in vivo study reported the ethanol-mediated hepcidin suppression by stabilization of HIF in the liver. The direct role of HIF on hepcidin regulation was again suggested after experiments performed in VHL KO mice.[130] Contrary to these findings, the upregulation of hepcidin under hypoxia was also reported in vitro in hepatoma cell lines.[122,131] Moreover, downregulation of hepcidin could be obtained by co-culturing hepatoma cells with macrophages, however, the co-culture ratio used in this study did not reflect physiological conditions.[131] In summary, conflicting and partly confusing data have been represented so far with regard to hepcidin regulation by hypoxia. We believe that these contradictions are mainly due to limitations in the interpretation of in vivo models of hypoxia due to many adaptive responses at various regulatory levels and to methodological limitations.[24]
Hepcidin dysregulation in patients with ALD
Various conditions may affect hepcidin in patients with ALD depending on the disease stage (Figure 8). As shown in a confirming experiment (Figure 9A) from our center, acute exposure to ethanol (24 h) rapidly suppresses hepcidin in mice[132] which is in contrast to human data (see below). It has been shown that ethanol downregulates hepcidin promotor activity and the DNA binding activity of CCAAT/ enhancer-binding protein alpha (C/EBP alpha) but not C/ EBP beta in mice[101] leading to downregulation of hepcidin gene transcription thereby increasing duodenal iron transport. Recently it has been shown that alcohol exerted different effects on TGF-β-mediated SMAD2 activation and BMP-mediated SMAD1 and SMAD5 activation.[133] Other data suggest the simultaneous inhibition of BMP-mediated SMAD activation and stimulation of TGF-β-mediated SMAD activation by alcohol in the involvement of hepcidin suppression by alcohol in vivo.
Figure 9.
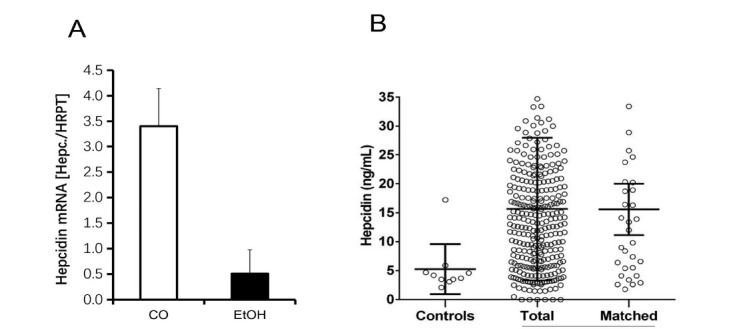
In vivo hepcidin mRNA expression. (A) Liver hepcidin expression in untreated (white) and 10% ethanol, gavage-fed male 129/Sv mice for 24 h as determined by real-time PCR. 7 mice were employed in each group for every experiment. (B) Serum hepcidin in healthy controls and ALD patients (total and age and gender matched) from the Heidelberg ALD cohort (ongoing study). ALD: alcoholic liver disease; EtOH: ethanol.
As shown in Figure 9B, our ongoing large trial of prospectively enrolled heavy drinkers does not confirm the data on acute ethanol exposure in rodents. In fact, we observe a clear upregulation of serum hepcidin levels in heavy drinkers as compared to healthy non-drinking controls. This is also the case, if drinkers and non-drinkers were matched for age. More information on these ALD cohorts is also provided in Table 4. Of note, elevated cytokines cannot solely explain upregulation of hepcidin. In conclusion, the observed short-term inhibition of hepcidin mRNA levels by acute and high alcohol exposure cannot be recapitulated at the serum level in heavy drinking humans. We assume and this will be discussed in more detail below that hemolysis contributes to hepcidin upregulation in drinkers.
Table 4.
Spearman correlations of serum hepcidin and MCV with different serum parameters in a large cohort of ALD patients
| Parameter | Hepcidin (ng/mL) | MCV (fL) |
|---|---|---|
| Ferritin (ng/mL) | 0.398*** | 0.344*** |
| Iron macrophages (score 0-4) | 0.413*** | 0.223* |
| Iron hepatocytes (score 0-4) | 0.361*** | 0.046 |
| Erythrocytes (/pL) | 0.206*** | -0.636*** |
| Hematocrit (%) | 0.199** | -0.287*** |
| ALT (U/L) | 0.192** | -0.001 |
| Hemoglobin (g/dL) | 0.192** | -0.315*** |
| MCV (fL) | -0.164** | 1.000 |
| LDH (U/L) | 0.175* | 0.249*** |
| Bilirubin total (mg/dL) | 0.150* | 0.276*** |
| Fibrosis stage (cut-off adapted) | -0.133* | 0.385*** |
| Kleiner score (0-4) | -0.002* | 0.342** |
| Transferrin saturation (%) | 0.143 | 0.205** |
| Liver stiffness (kPa) | -0.101 | 0.380*** |
| Alcohol consumption (g/day) | -0.082 | -0.106 |
| GGT (U/L) | 0.076 | 0.363*** |
| GDF15 (U/L) | 0.112 | 0.323*** |
| Serum iron (μg/dL) | 0.073 | -0.022 |
| AST (U/L) | 0.054 | 0.243*** |
| Quick (%) | 0.046 | -0.279*** |
| M65 (U/L) | 0.044 | 0.416*** |
| Platelets (/nL) | -0.040 | -0.176** |
| Haptoglobin (mg/dL) | 0.035 | 0.121 |
| CRP (mg/L) | 0.014 | 0.070 |
| CAP (dB/m) | -0.006 | 0.076 |
| Leukocytes (/nL) | -0.003 | -0.082 |
| Transferrin (g/L) | -0.003 | -0.381*** |
| M30 (U/L) | -0.002 | 0.399*** |
*P < 0.05, **P < 0.01, ***P < 0.001.
MCV: mean corpuscular volume of erythrocytes; ALD: alcoholic liver disease; ALT: alanine aminotransferase; MCV: mean corpuscular volume of erythrocytes; GGT: glutamyltransferase; AST: aspartate aminotransferase; CAP: controlled attenuation parameter; LDH: lactate dehydrogenase; CRP: C reactive protein; GDF15: growth differentiation factor 15.
Preliminary lessons from the ongoing prospective survival cohort of heavy drinkers in heidelberg: Hemoglobin as an important prognostic marker
Mortality data are essential to identify important confounders of disease progression. So far, no prospective long-term data on survival are available for patients with ALD. In 2007, the Heidelberg Center for Alcohol Research started to prospectively enroll heavy drinkers. Most patients are presenting for alcohol detoxification allowing to also collect data after approx one week of alcohol withdrawal. The study is still ongoing and covers now almost 15 years. In an interim analysis, information of survival status was obtained in 602 of 943 screened patients that had presented from 2007–2017 with a mean daily consumption of alcohol of 178 g. Mean observation time was 3.7 years and mean duration of heavy drinking was 14.0 years. During the observation time, 99 patients had passed away. The cause of death could be clarified in 39%. In 38%, death was liver related. As shown in Table 2 and of most interest within the context of this concept paper, Hb was among the three major factors that were associated with long-term mortality next to liver stiffness and alkaline phosphatase (AP). Notably, low Hb levels are associated with increased long-term mortality.
Table 2.
Univariate and multivariate Cox-regression for overall survival in 602 ALD patients (mean observation time 3.3 years)
| Items | Univariate | Multivariate (stepwise) | ||||||
|---|---|---|---|---|---|---|---|---|
| P-value | HR | 95% CI Lower | Upper | P-value | HR | 95% CI Lower | Upper | |
| Liver stiffness | <0.001 | 1.026 | 1.02 | 1.033 | 0.001 | 1.013 | 1.005 | 1.021 |
| AP | <0.001 | 1.006 | 1.004 | 1.007 | <0.001 | 1.003 | 1.002 | 1.005 |
| Bilirubin total | <0.001 | 1.119 | 1.085 | 1.153 | ||||
| Hemoglobin | <0.001 | 0.757 | 0.701 | 0.818 | 0.001 | 0.858 | 0.785 | 0.938 |
| Age | <0.001 | 1.043 | 1.025 | 1.061 | 0.002 | 1.028 | 1.010 | 1.046 |
| INR | <0.001 | 1.775 | 1.362 | 2.314 | ||||
| Platelets | <0.001 | 0.995 | 0.993 | 0.998 | 0.047 | 0.998 | 0.995 | 1.000 |
| GGT | <0.001 | 1.000 | 1.000 | 1.001 | ||||
| AST | 0.024 | 1.002 | 1.000 | 1.003 | ||||
| Urea | 0.040 | 1.009 | 1.000 | 1.017 | ||||
| CAP | 0.335 | 1.002 | 0.998 | 1.007 | ||||
| Sex (0: female, 1: male) | 0.337 | 1.233 | 0.804 | 1.888 | ||||
| ALT | 0.777 | 1.000 | 0.997 | 1.002 | ||||
| Lipase | 0.789 | 1.000 | 0.996 | 1.003 | ||||
| Leukocytes | 0.996 | 1.000 | 0.955 | 1.047 | ||||
| BMI | 0.999 | 1.000 | 0.958 | 1.044 | ||||
| Creatinine | 0.999 | 1.001 | 0.472 | 2.122 | ||||
AP: alkaline phosphatase; INR: international normalized ratio; GGT: glutamyltransferase; AST: aspartate aminotransferase; CAP: controlled attenuation parameter; ALT: alanine aminotransferase; BMI: body mass index; HR: hazard ratio; ALD: alcoholic liver disease.
Parameters are marked in bold if they are signficantly associated with mortality in multivariate analysis.
To get more insights into potential causes of the anemia, we had a closer look at our database with more than 1000 ALD patients and we finally divided them into four groups according to the two major iron compartments, Hb and serum ferritin. We are aware that especially ferritin can be also elevated by other causes and does not necessarily reflect intracellular iron content. However, even ferritin elevation during acute inflammation indicates filled iron storage due to hepcidin-mediated blockage of iron export by ferroportin. In total, four groups were obtained when dividing the ALD patients according to low and high Hb and ferritin (Table 3). Using this strategy, the four groups had an identical size of approx 250 patients. Mean levels of Hb and ferritin differed markedly between the groups and were either ca. 200 or 1200 ng/mL for ferritin and 15 or 12.2 mg/dL for Hb. Moreover, no differences were observed between the low and high Hb groups with regard to ferritin levels and the selection sequence did not affect the outcome. In other words, same data were obtained whether patients were first sorted according to Hb and then ferritin or vice versa. As shown in Table 3, group 3 (high ferritin, low Hb) had the worst outcome and this group is characterized by an impaired liver function (higher liver stiffness, more fibrosis, reduced liver function, elevated bilirubin). Group 3 also showed more liver apoptosis (elevated levels of M30 and M65). The marked elevation of the erythrophagocytosis marker CD163 both in groups 1 and 3 (high ferritin levels) clearly indicates that enhanced erythrocyte turnover is responsible for the ferritin elevation. In contrast to group 1 (normal Hb, elevated ferritin), prognostically unfavorable group 3 (low Hb, high ferritin) has a significantly higher reticulocyte count, MCV and LDH. Thus, these typical laboratory findings are highly suggestive for enhanced hemolysis or eryptosis. We also tested whether B12 or folic acid deficiency could account for the elevated MCV in group 3 but did not find any significant differences (not shown). Based on the CD163 levels, the erythrocyte turnover seems to be similar in groups 1 and 3 so that an enhanced turnover could also not account for e.g. “a relative B12 or folic acid deficiency”.
Table 3.
Groups in ALD patients according to hemoglobin (<14 g/dL or >14 g/dL) and ferritin (<400 ng/mL or >400 ng/mL)
| Parameter | Group 1 |
Group 2 |
Group 3 |
Group 4 |
|---|---|---|---|---|
| Hb+ Fer+ | Hb+ Fer– | Hb– Fer+ | Hb– Fer– | |
| Hemoglobin (g/dL) | 15.40 ± 0.99 | 15.31 ± 1.14 | 12.04 ± 1.64 | 12.16 ± 1.75 |
| Ferritin (ng/mL) | 1061.2 ± 646.6 | 195.0 ± 101.0 | 1213.9 ± 724.2 | 157.8 ± 109.8 |
| LIC (mg/g dry weight) | 1.36 ± 0.66 | 0.96 ± 0.80 | 1.71 ± 1.83 | 0.73 ± 0.53 |
| Transferrin (g/L) | 2.33 ± 0.55 | 3.54 ± 14.29 | 1.76 ± 0.63 | 2.44 ± 0.60 |
| Transferrin saturation (%) | 51.2 ± 24.1 | 34.8 ± 18.1 | 55.4 ± 28.7 | 32.9 ± 22.2 |
| Hepcidin (ng/mL) | 21.40 ± 13.36 | 12.40 ± 10.49 | 17.49 ± 13.86 | 9.63 ± 8.25 |
| Fibrosis stage | 1.40 ± 1.37 | 1.11 ± 1.32 | 2.29 ± 1.62 | 1.76 ± 1.79 |
| Liver stiffness (kPa) | 14.99 ± 18.06 | 9.28 ± 12.12 | 31.2 ± 28.51 | 22.27 ± 26.26 |
| AST (U/L) | 140.7 ± 135.4 | 55.7 ± 50.1 | 141.8 ± 122.1 | 70.5 ± 67.8 |
| ALT (U/L) | 104.7 ± 115.7 | 46.6 ± 44.0 | 74.7 ± 59.7 | 46.0 ± 73.9 |
| M30 (U/L) | 725.0 ± 883.5 | 264.8 ± 245.5 | 899.2 ± 1033.4 | 543.9 ± 1134.2 |
| M65 (U/L) | 1262.2 ± 1409.4 | 480.0 ± 484.9 | 1628.1 ± 1661.3 | 1096.4 ± 3509.6 |
| Bilirubin total (mg/dL) | 1.17 ± 1.73 | 0.60 ± 0.46 | 3.66 ± 5.96 | 1.65 ± 3.51 |
| Quick (%) | 102.0 ± 17.9 | 108.0 ± 16.4 | 87.4 ± 27.7 | 92.4 ± 24.9 |
| MCV (fL) | 94.2 ± 10.4 | 90.6 ± 7.5 | 98.5 ± 11.0 | 92.0 ± 8.2 |
| LDH (U/L) | 244.1 ± 75.7 | 207.0 ± 63.0 | 299.5 ± 195.1 | 219.4 ± 75.2 |
| CD163 (ng/mL) | 1643.8 ± 712.0 | 1095.2 ± 772.2 | 2231.6 ± 1246.9 | 1782.4 ± 1301.2 |
| CD91 (μg/mL) | 7.03 ± 2.82 | 5.34 ± 4.33 | 5.61 ± 4.52 | 4.55 ± 3.82 |
| ERFE (ng/mL) | 0.59 ± 0.55 | 0.27 ± 0.36 | 1.3 ± 3.57 | 0.33 ± 0.35 |
| B2MG (μg/mL) | 9.39 ± 3.72 | 8.34 ± 3.31 | 12.40 ± 7.10 | 8.54 ± 2.97 |
| Hemopexin (mg/mL) | 0.45 ± 0.27 | 0.52 ± 0.41 | 0.37 ± 0.33 | 0.33 ± 0.26 |
| Haptoglobin (mg/dL) | 1.50 ± 0.79 | 1.62 ± 0.72 | 1.38 ± 1.09 | 1.31 ± 0.76 |
| BMP6 (ng/mL) | 0.25 ± 0.73 | 0.18 ± 0.33 | 0.28 ± 0.75 | 0.08 ± 0.03 |
| CRP (mg/L) | 5.41 ± 17.44 | 2.80 ± 5.14 | 17.12 ± 29.30 | 8.40 ± 15.02 |
| IL-1b (pg/mL) | 137.59 ± 297.51 | 29.94 ± 29.8 | 31.75 ± 44.33 | 20.95 ± 1.33 |
| IL-6 (pg/mL) | 140.54 ± 293.99 | 25.11 ± 21.35 | 59.72 ± 119.62 | 23.18 ± 14.94 |
ALD: alcoholic liver disease; IL: interleukin; LIC: liver iron concentration; AST: aspartate transaminase; ALT: alanine transaminase; MCV: mean corpuscular volume; LDH: lactate dehydrogenase; ERFE: erythroferrone; BMP6: bone morphogenetic protein 6; CRP: C reactive protein; Hb: hemoglobin; Fer: ferritin.
The major difference between group 1 and 3 is the ability of group 1 patients to reuse iron for novel Hb synthesis.
Group 3 also has higher EPO levels further indicating anemia is not due to the insufficient production of this important hormone but, in contrast, trying to compensate for the low Hb levels. We next performed a correlation analysis with the systemic iron master-switch hepcidin as hepcidin was both elevated in groups 1 and 3 with high ferritin levels. Table 4 shows a Spearman Rho correlation for hepcidin which is primarily positively correlated with markers of iron storage such as Hb, ferritin but also histological iron deposition both for macrophages and hepatocytes. The only clear negative correlations are found for fibrosis stage and MCV. MCV, as mentioned above a laboratory hallmark of ALD patients, is the typical finding of B12 deficient hemolytic anemia. We next performed a correlation analysis for MCV (Table 4). The high positive association with ferritin and LDH but negative correlation with Hb is highly suggestive for hemolysis. In conclusion, enhanced erythrocytes turnover and hemolysis seem to be a key feature for at least half of all ALD patients (groups 1 and 3). For unknown reasons, part of these patients (group 3) is not able to mobilize iron for novel erythropoiesis. The phenomenon of hemolysis in patients has been also termed masked hemolysis by us since no overt findings of hemolysis such as haptoglobin suppression are found. The clear evidence of masked hemolysis could also at least contribute to hepcidin suppression. In addition, hepcidin is elevated in group 3, but not as high as group 1 despite similar ferritin elevations and even more pronounced iron overload. Hepcidin is seemingly paradoxically and profoundly suppressed in hemolytic diseases such as thalassemia[134] or chronic liver diseases[52] in the presence of iron excess e.g. released from an increased red blood cell turnover.[52,135] Finally, it is mechanistically interesting that transferrin is significantly suppressed in group 3. Low levels of transferrin have been described as prognostically unfavorable in ALD patients. In summary, lessons from our ongoing prospective survival study indicate that anemia is an important factor of mortality and this anemia is associated with enhanced erythrocyte turnover due to elevated hemolysis (masked hemolysis) and/or eryptosis.
What factors contribute to hemolysis during ethanol-metabolism?
If we consider Hb as the major iron storage compartment in humans (80%) (Figure 6A), all forms of enhanced erythrocyte turnover whether eryptosis, masked or direct hemolysis become highly relevant for iron release and hepatic overload (Table 5 and 6). This is further underlined by the fact that the liver macrophages are an essential part of erythrophagocytosis next to the spleen and bilirubin as major heme degradation product is exported primarily through the liver.[64,65,136] It is known for a long time that alcohol consumption can result in structural and metabolic abnormalities of the erythrocyte membrane leading to hemolytic anemia varying from very mild to severe.[137] Reasons for hemolytic disorders are altered erythrocyte cytoskeleton proteins, an increase of lipid fluidity by oxidative stress[138] and reduced phosphate levels (hypophosphatemia).[139] In drinkers, an abnormal structure of erythrocyte surface can cause dysfunctional and heteromorphic echinocytes, such as stomatocytes or spur cells.[137] Under the microscope, the stomatocytes are observed as mouth-like or stoma-like shape, with a shortened lifespan. In former studies more than 25% of alcoholics were found to have an increased number of peripheral stomatocytes.[139] Spur cells are considered the most severe form of hemolysis related to alcohol consumption and they are characterized by spikelike protrusions on the cell surface. These spur cells with an irreversible rigid membrane will be prematurely removed by spleen macrophages.[140,141] Spur-cell associated hemolysis is observed in ca. 3% of chronic heavy drinkers ultimately leading to progressive fatal anemia.[139]
Table 5.
Mechanisms for RBC recycling either by erythrophagocytosis or after direct hemolysis.
| Mechanisms | Examples |
|---|---|
| 1. Direct hemolysis and elimination by RES* | |
| Hypo-osmosis | |
| Membrane-destabilization by detergents | Bile acids, drugs |
| Direct toxicity | Bilirubin |
| Mechanic shear stress | |
| Heme-recycling through haptoglobin or hemopexin | CD163 or CD91 mediated heme uptake |
| 2. Induction of RBC suicidal death (eryptosis) | |
| Phenylhydrazine | |
| Continuous exposure to H2O2 | glucose oxidase |
| Bilirubin | |
| 3. Erythrophagocytosis of intact RBCs | |
| Oxidative modification of RBCs | Treatment with copper sulfate Continuous exposure to H2O2 e.g. through glucose oxidase |
*It is partly not yet known whether some pathways are overlapping. RBC: red blood cell; RES: reticuloendothelial system.
Table 6.
The effects of ethanol and its metabolites on erythropoiesis and RBCs
| Molecules | Targets | Effects | Ref. |
|---|---|---|---|
| Ethanol | Intestine | Folate deficiency | Medici et al. 2013[225] |
| Ethanol | Erythroid precursors | Vacuolization and cell death | Roselle et al. 1986[226] Yeung et al. 1988[184] |
| Ethanol | Erythroblasts | Iron deposit and ring sideroblasts, sideroblastic anemia | Pierce et al. 1976[223] Lindenbaum et al. 1980[221] |
| Ethanol | Erythrocytes | Elevated MCV, macrocytic anemia | Seppä et al. 1991[227] Maruyama et al. 2001[228] |
| Acetaldehyde | Hemoglobin | Forming adducts with hemogl obin A | Stevens et al. 1981[206] |
| Acetaldehyde | DNA | Blocking DNA translesion | Yu et al. 2010[229] |
| ROS | Erythrocytes | Disorder of erythrocyte cytoskeleton, stomatocytes and spur-cells | Morse et al. 1990[230] Fukuda et al. 1991[231] Koch et al. 2004[232] |
| ROS | Erythroblasts | Disturbing the enucleation | Zhao et al. 2016[233] |
| Fatty acid ethyl ester | Erythrocytes | Incorporating into the membrane and causing hemolysis | Tyulina et al. 2002[205] |
RBC: red blood cell; MCV: mean corpuscular volume of erythrocytes; ROS: Reactive oxygen species.
As shown in Table 5, RBCs can be directly hemolyzed e.g. by hypoosmotic or mechanic shear stress conditions.[65] Free heme or Hb released from the hemolyzed RBCs is recognized by hemopexin or haptoglobin in the serum, forming heme-hemopexin complex or hemoglobin-haptoglobin complex. The complexes are then recognized by CD91 or CD163 on the membrane of macrophages and catabolized by HO1 in macrophages.[142]
The finding that ca. 50% of all drinkers show signs of enhanced erythrophagocytosis or hemolysis leads to the direct question what molecular mechanisms are involved in ethanol-mediated hemolysis (see also Table 3). Generally, humans have sophisticated, efficient and partly redundant mechanisms to sequester and eliminate senescent or fragile RBCs, and to remove release heme as heme is highly toxic to all cells including the vascular endothelial bed. Senescent erythrocytes are normally recognized by Fc-receptor.[65,143] Under alcoholic circumstance, some injured erythrocytes may also start an apoptosis-like suicidal cell death, called eryptosis. It remains an open question whether formerly discovered spur-cells are related to what is now called eryptosis. This mechanism enables the elimination of defective cells without destroying the cell membrane integrity and release of cytosolic material to the exterior and can thus be compared to apoptosis in epithelioid cells. The phospholipid membrane of eryptotic cells is characterized by the translocation of phosphatidylserine (PS) from the inner leaflet to the exterior regulated by flippases.[144] Eryptotic erythrocytes may further display alterations in their membrane elasticity and are recognized by PS receptors on macrophages including direct receptors such as Tim-1, Tim-4, Stabilin-2 and CD300 and indirect receptors such as TAM receptors and αvβ3/β5 integrins.[65] These erythrocytes are then phagocytosed and degraded by macrophages and finally cleared from the circulation.
An efficient way to mark erythrocytes for erythrophagocytosis is oxidative modification of the membrane (Table 5). In the laboratory, copper sulfate is regularly used in a Fenton-like manner. Figure 10A shows erythrophagocytosis of human erythrocytes by differentiated THP-1 macrophages with and without copper sulfate treatment. The efficient erythrophagocytosis can be further documented by mRNA expression of the major heme degradation enzyme HO1 (Figure 10B). Of note, hepcidin is increased at low RBC numbers (till 0.05% hematocrit) but suppressed at higher concentrations (bivalent response of hepcidin towards iron and heme).
Figure 10.

Experimental erythrophagocytosis and hepcidin expression in THP-1 macrophages. (A) Erythrophagocytosis of human erythrocytes (oxidized by copper sulfate) by PMA-differentiated THP-1 cells. (B) HO1 continuously increases with increasing numbers of oxidized RBCs (shown as % hematocrit = htc). No HO1 induction is seen with non-oxidized control RBCs. (C) In contrast, hepcidin mRNA shows a so-called “bivalent response” to increasing concentrations of oxidized RBCs (heme). Low levels of heme increase hepcidin while higher levels cause hepcidin suppression. ERFE cannot explain these in vitro observations. RBC: red blood cell; Htc: hematocrit; ERFE: erythroferrone; HO1: hemeoxygenase 1.
Besides marking the RBCs through oxidative modification, they can be also directly lysed either through hypoosmotic conditions, by detergents, other toxins or even mechanic stress as is seen in patients with artificial heart valves (Table 5). The leaked heme can be detected either directly in the supernatant (Figure 11) or by other assays such as the ultra-sensitive luminol-enhanced chemiluminescence.[145,146] Since ethanol and acetaldehyde also possess lipophilic properties that could destabilize the lipid membrane, direct effects can also not be ruled out (Figure 11). We have reassessed the ability of ethanol or its major metabolite acetaldehyde to induce erythrophagocytosis/hemolysis. As shown in Figure 11, both compounds are able to induce hemolysis but at very high concentrations. Acetaldehyde has been shown to react with the amino termini of Hb to form stable cyclic imidazolidinone derivatives.[147] It has been recently shown that either the detergent or direct toxic effects of bile acids and conjugated bilirubin are able to induce eryptosis or erythrophagocytosis.[148,149] Confirmative preliminary experiments from our own lab show (Figure 12A-C) that both bile acids and bilirubin can induce a phenotype of eryptosis (Figure 12A) eventually triggering erythrophagocytosis in differentiated THP-1 cells. We have also established an ex vivo assay to test the resistance of erythrocytes towards the hemolytic agent phenyl hydrazine. Figure 13 shows the hemolysis measured by direct photometric heme determination in the supernatant. After 60 and 90 min, blood from ALD patients clearly showed more hemolysis as healthy control persons. The test is attractive since it measures the overall fragility of RBCs towards a standard stress situation but does not detect the specific cause of hemolysis (membrane rupture, reduced antioxidative defense etc.). Taken together, various conditions in ALD patients may induce eryptosis, erythrophagocytosis or direct hemolysis finally resulting in enhanced heme turnover in these patients.
Figure 11.

Direct exposure of human RBCs with EtOH and AA for 24 h. Note, that hemolysis or modification only occurs at quite high levels of ethanol and acetaldehyde. CO: normal control (no addition of ethanol); EtOH: ethanol; AA: acetaldehyde.
Figure 12.
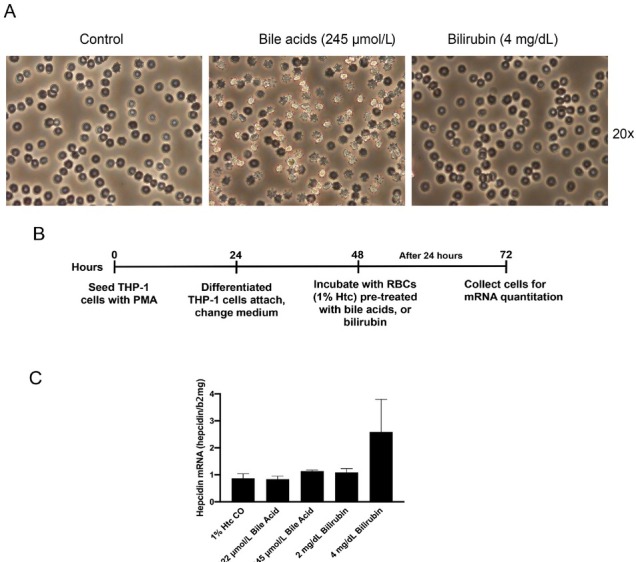
Eryptosis and in vitro erythrophagocytosis in the presence of calf bile acids and bilirubin. (A) Induction of an eryptosis phenotype by bile acids or for three hours. (B) Experimental set up to assess erythrophagocytosis. THP-1 cells were differentiated over 24 hours by PMA to attaching macrophages and exposed to 1% Htc bile acid or bilirubin treated RBCs for another 24 h. Cells were then collected for mRNA quantitation by RT-PCR. (C) HO1 mRNA induction (erythrophagocytosis) in the presence of identical concentrations of bile acid- and bilirubin-treated RBCs. The experiment underlines that cholestasis can initiate a vicious cycle of hemolysis and heme-degradation-mediated hemolysis. This vicious cycle is deteriorating in endstage ALD and may also contribute to AH. Htc: hematocrit; RBC: red blood cell; ALD: alcoholic liver disease; HO1: hemeoxygenase 1; AH: alcoholic hepatitis; Htc: hematocrit.
Figure 13.
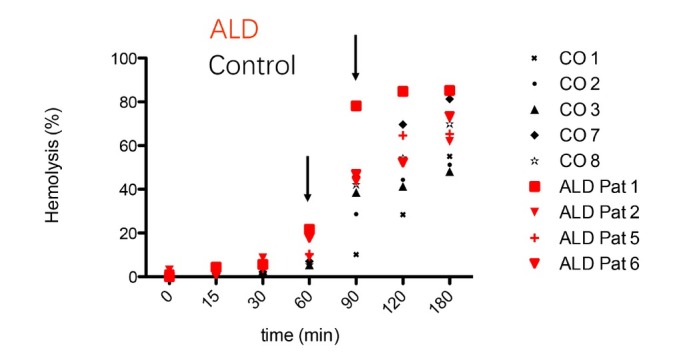
RBCs in ALD patients are more fragile than RBCs in normal controls. RBCs from both groups were treated with the hemolytic agent phenylhydrazine for various time points and hemolysis was measured by absorption spectroscopy in the supernatant. After 60 min, the hemolysis rate of ALD patients was significantly higher than in healthy controls. It indicates that RBCs seem to be generally more fragile and prone to turn over in drinkers. ALD: alcoholic liver disease; RBC: red blood cell; CO: control patients (healthy volunteers without alcohol consumption).
Present challenges in understanding iron sensing by hepcidin: Implications for ALD
Although various upstream regulators of hepcidin have been discovered (such as C/EBPα, BMP6, SMAD 1/5/8, SMAD4, SMAD6, SMAD7, TMPRSS6, IL-6, CREBH, CHOP and TLR4), the overall regulation, namely the exact sensing of iron by hepcidin, is still far from being understood. Two major experimental and clinical observations are especially difficult to understand. Although hepcidin suppression has been recognized as major mechanisms of chronic iron accumulation in most hereditary iron overload diseases such as hemochromatosis,[150] hepcidin is seemingly paradoxically and profoundly suppressed in hemolytic diseases such as thalassemia[134] or chronic liver diseases[52] in the presence of iron excess e.g. released from an increased red blood cell turnover.[52,135] Another major unresolved observation is that hepcidin responds differently to iron overload in vitro and in vivo.[151,152] In contrast to the profound induction of hepcidin by iron under in vivo conditions, hepcidin expression is typically inhibited in the presence of iron in cell culture models.[152] The complexity of iron sensing by hepcidin could neither be resolved by further mechanistic insights from intercellular communication between hepatocytes and endothelial cells or macrophages[18,92,153] or additional mechanistic insights of known or novel molecules such as TfR1, ERFE or GDF15.[95,154,155] An alternative explanation for the paradox response of hepatocellular hepcidin to direct iron exposure could be the fact that the actual location of “iron sensing” occurs in a different type of cells e.g., in the endothelial bed which is then indirectly communicated to hepatocytes by intercellular signaling though the BMP6/SMAD pathway.
We believe that despite the complexity, iron sensing should be recapturable in vitro. First, we need to fully understand all conditions that modulate hepcidin at the single cell level not only including protein factors such as transcription factors but also non-protein factors such as hypoxia, reactive oxygen species or iron itself. We then should better understand the crosstalk between neighboring cells that are relevant for iron sensing. Third, the crosstalk should be regarded within the context of the whole organisms. This will finally also include anatomic specificities e.g. of the liver and spleen but also the liver pathology itself with the development of cirrhosis and all its e.g. hemodynamic consequences that should be highly relevant for iron sensing. For instance, it is not discussed in the literature what are the consequences once portal hypertension has developed and humoral factors will not have direct access anymore to the liver. Moreover, although quite evident, the loss of function of necrotic or apoptotic cells is rarely considered. For instance, the loss of hepatocytes during ethanol-mediated liver damage will ultimately cause a loss of total hepcidin secretion which can further lead to enhanced iron uptake.
In addition, some confusions arise from seemingly contradictory reports in the literature that are simply due to errors or artificial conditions. Thus, and as mentioned above, hypoxia and iron are interrelated in a complex manner at various organization levels. It matters whether an animal is exposed to hypoxia and shows all the adaptive responses or whether a single cell is studied which is by far better adaptable to hypoxia. This may explain why earlier studies postulated a hypoxia-mediated hepcidin suppression and even hypoxia-responsive elements within the hepcidin promotor (which could not be confirmed later), while detailed in vitro studies with different hypoxia systems demonstrated in fact a stimulatory effect of hypoxia on hepcidin.[25] Moreover, oxidative stress was postulated to block hepcidin using artificial bolus experiments e.g. of H2O2 while later studies with physiology-mimicking conditions clearly demonstrated that H2O2 is a potent up regulator of hepcidin through the STAT3 pathway.[98] Likewise, iron accumulation in ALD has been generally attributed to a direct hepcidin blocking effects of alcohol but this could only be demonstrated in short term animal models. As shown in Figure 9, however, a large prospective study of heavy drinkers showed highly elevated hepcidin levels in drinkers. As shown in Table 3, this is not due to drastic inflammation or cytokine storm. We rather believe that the major topic of this concept paper, hemolysis, contributes to hepcidin expression in ALD.
Novel insights into the crosstalk of macrophages, endothelial cells and hepatocytes
We and other have recently studied in more detail the crosstalk of various cells such as macrophages or endothelial cells with hepatocytes. As mentioned above, BMP6 has been identified as one of the most potent upstream inducers of hepcidin.[156,157] BMP6 knockout mice exhibited hepcidin deficiency and severe tissue iron overload,[156,158] although BMP2 and BMP4 can also bind to HJV.[159] Recently, a study demonstrated that liver sinusoidal endothelial cells (LSECs) are the predominant source of basal BMP6 secretion and participate in iron-regulated hepcidin expression.[92] Although the role of both LSECs and endothelial cells (EC) in systemic iron regulation has been only marginally studied, a few studies on the blood-brain barrier and retina suggest that they may be involved in iron sensing and transport.[160,161] Moreover, ECs are highly sensitive to iron changes[162,164] and, finally, they secrete the autocrine protein BMP-binding endothelial cell precursor-derived regulator (BMPER), able to antagonize BMPs activity and regulate hepcidin.[165] Finally, a recent study provided the first insights into molecular iron sensing by ECs. Accordingly, Nrf2 is activated by iron-induced, mitochondria-derived pro-oxidants and drives BMP6 expression in liver sinusoid endothelial cells.[166]
In a more detailed in vitro study, we could recently show that iron directly blocks hepatocellular hepcidin signaling through the SMAD pathway independent of STAT3.[167] All iron III forms including ferric ammonium citrate (FAC) efficiently blocked hepcidin mRNA expression at non-toxic dosages in Huh7 cells or primary hepatocytes in a time and dose-dependent manner which could be efficiently blunted by iron chelators (Figure 14A). FAC also inhibited BMP6, hypoxia, IL-1β, IL-6-mediated and LPS-mediated hepatic hepcidin induction in a co-culture model with macrophages. Moreover, FAC reduced SMAD6 mRNA and p-SMAD1/5/8 protein expression at basal or upon stimulation by BMP6 or under hypoxia. However, FAC had no significant effect on p-STAT3 protein expression at basal or upon stimulation by various stimuli. In another detailed still unpublished study, we focused on the crosstalk between ECs and HCs.[168] HCs (Huh7 cells) were direct co-cultured with ECs (HUVECs and SK hep). EC-conditioned media (CM) were also employed to culture Huh7 cells and primary mouse hepatocytes. Both direct co-culture with ECs or EC-CM significantly increased HC-hepcidin. The upstream SMAD pathway of hepcidin, including pSMAD1/5/8, SMAD1 or Id1, were induced by EC-CM. Efficient blockage of this EC-mediated hepcidin upregulation by an ALK2/3 inhibitor or BMP6 siRNA identified BMP6 as a major hepcidin regulator in this co-culture system, which highly fits the hepcidin regulation by iron in vivo. In addition, EC-derived BMP6 and hepcidin responded highly sensitive to levels of ferric iron but also heme as low as 500 nmol/L. We have been also able in preliminary experiments to demonstrate a bivalent response of an EC-HC co-culture system in response to heme (Figure 14B). At low levels, both direct HC-mediated hepcidin response but also BMP6 secretion from ECs are upregulated. At higher levels, HC-derived hepcidin is partly blocked. At higher levels (<10 μmol/L hemin), iron toxicity is observed in ECs and no further upregulation of hepcidin can be observed. We therefore propose that even in the absence of other systemic regulators such as ERFE, the bivalent response of EC-HCs to iron can explain the behavior during mild and severe hemolysis. Figure 15 shows the response of hepcidin in mice treated either mildly or more severely with the hemolytic agent phenylhydrazine (PHZ). As seen in Figure 15, mild hemolysis causes hepcidin upregulation while, in contrast, the severe form causes profound inhibition of hepcidin. Figure 16 shows corresponding levels for hemoglobin, GOT, GPT, LDH, transferrin and hepcidin for the severe hemolysis models. As already shown for macrophages (Figure 10B) and cultured hepatoma cells (Figure 4), hepcidin is induced at low levels of heme exposure but suppressed at high levels. Also note that transferrin is strongly upregulated during hemolysis. Several studies by Tom Ganz’ team have demonstrated that repressed hepcidin actually causes continued and fatal hepatic iron overload in hemolytic diseases such as thalassemia.[96,169]
Figure 14.
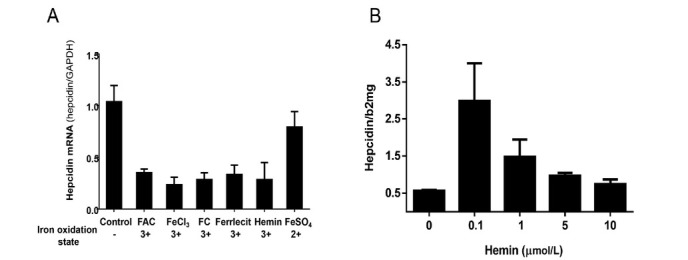
The in vitro bivalent response of hepatocytes hepcidin to iron levels. A. Hepcidin expression in Huh7 cells was inhibited by all ferric iron forms (FAC 50 μmol/L, FeCl3 50 μmol/L, FC 50 μmol/L, Ferrlecit 50 μmol/L and Hemin 50 μmol/L). B. Hepcidin expression in Huh7 cells co-cultured with BMP6-secreting endothelial cells (HUVEC)-derived conditioned medium was upregulated by low hemin (0.1 μmol/L) but inhibited by higher hemin concentrations; FAC: ferric ammonium citrate.
Figure 15.
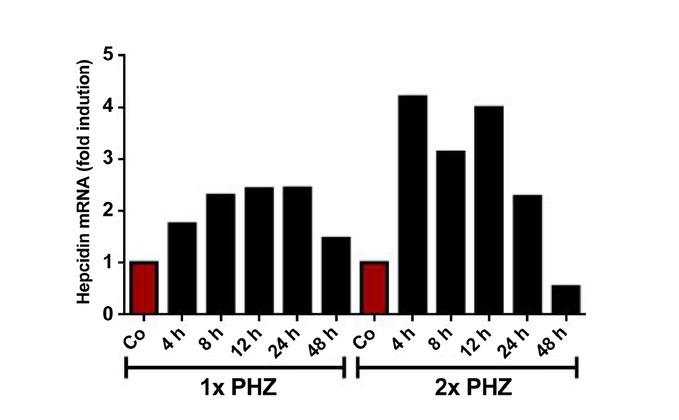
Hepcidin expression in mice liver with mild or severe hemolysis. One or two injections the hemolytic agent PHZ (60 mg/kg body weight) during two consecutive days (the last injection is t = 0) were applied to mice as models of mild or severe hemolysis. Hepcidin transcription levels were measured at 4, 8, 12, 24, 48 h after the injection. In the mild hemolysis model, hepcidin was upregulated after 4 h and recovered at 48 h. In contrast, in the severe hemolysis model, hepcidin was inhibited at 48 h as is seen in patients with severe hemolysis; PHZ: phenylhydrazine.
Figure 16.
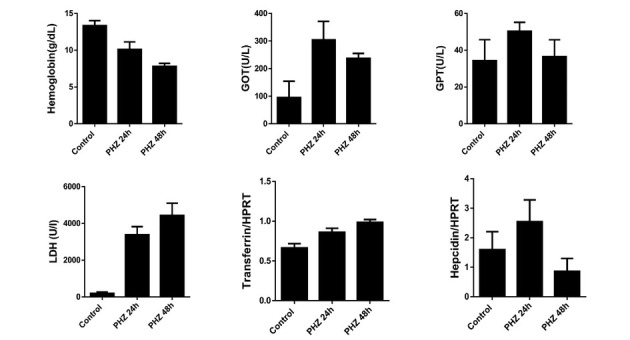
Blood parameters in mild and severe hemolysis in mice. Two PHZ injections (with 60 mg/kg body weight) in two consecutive days (the last injection is t = 0) were applied to mice. Blood samples were collected at 24 and 48 h after the injection. Hemolytic mice developed anemia, elevation of GOT, GPT and LDH. Transferrin also increased while hepcidin showed a bivalent response. GOT: glutamic-oxaloacetic transaminase; GPT: glutamic-pyruvic transaminase; LDH: lactate dehydrogenase; PHZ: phenylhydrazine.
Some other preliminary studies seem to be highly relevant within this context. Figure 17 shows the response of HO1 expression in macrophages (THP-1 cells) in the presence of increasing hemin concentrations. Starting from 0.5% hematocrit or hemin, no further HO1 expression is observed. Moreover, first signs of autophagy (and pre-toxicity) are observed at concentrations of 15 μmol/L. This indicates that the heme degradation is somehow self-limiting potentially because the release of carbon monoxide (CO) and iron from heme degradation (see also Figure 6B) are highly toxic. It is still too early to speculate whether CO itself plays an important role in this auto-limitation (regulatory loop). In another preliminary set of experiments, we could show that both hemopexin (Hpx) and haptoglobin (Hp) lower the HO1 expression in response to equal amount of hemin (Figure 18), which was coherent with recent data from other labs.[170] This suggests that both Hp and Hpx are mechanisms to safely internalize toxic heme into macrophages. The data also suggest that these save pathways prevent rapid heme degradation with subsequent release of toxic CO and iron. So far, it can only be speculated whether CO plays a critical feedback role e.g. by inhibiting the respiratory chain.
Figure 17.
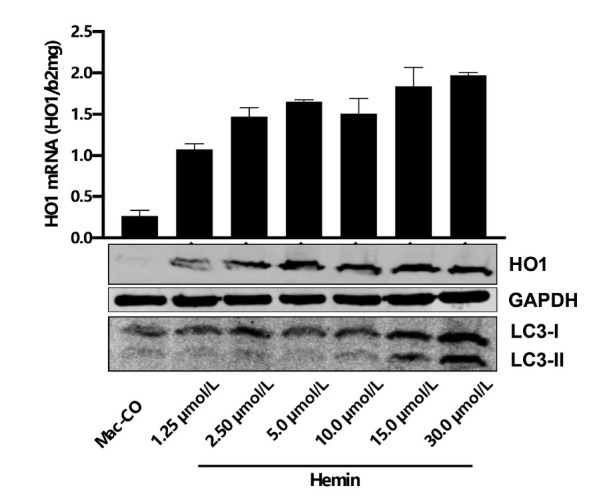
Hemin-induced HO1 expression and LC3B expression in a dose dependent manner in THP-1 macrophages. Note that HO1 remains stably expressed despite increasing hemin levels while first signs of autophagy are observed at higher hemin levels (beginning toxicity). It remains to be elucidated whether HO1 expression is limited at higher hemin levels to prevent toxic iron release and whether carbon monoxide is involved in this regulation; HO1: hemeoxygenase 1.
Figure 18.
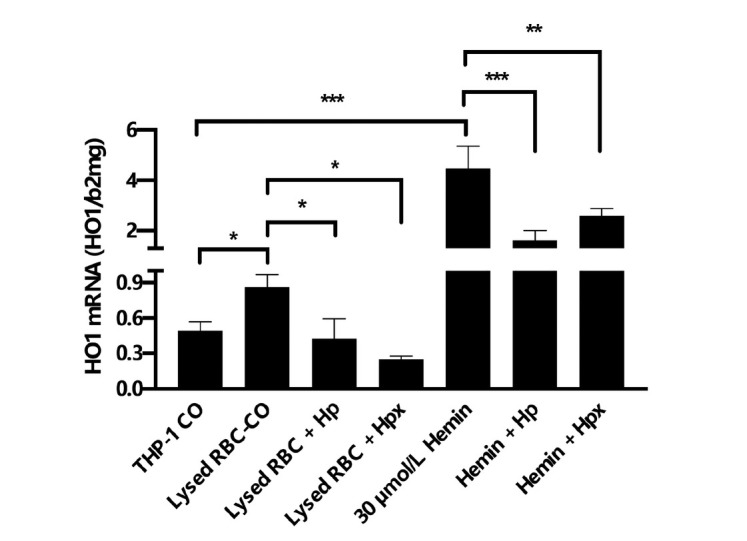
Presence of Hp or Hpx lowers HO1 expression in THP1 cells. Exposure of THP-1 macrophages to lysed RBCs or 30 μmol/L hemin causes induction of HO1 mRNA expression. HO1 mRNA is significantly suppressed in the presence of heme scavenging Hp and Hpx. *P < 0.05, **P < 0.01, ***P < 0.001. Hp: haptoglobin; Hpx: hemopexin; RBC: red blood cell; HO1: hemeoxygenase 1.
Alcohol-related damage of bone marrow and erythropoiesis
In human embryos, the early production of erythroid lineage cells occurs in the yolk sac.[171] The mesodermal cells migrate into the yolk sac to form blood islands containing red blood cells and endothelial cells.[172,173] Then primitive erythroblasts (PE) expressing embryonic globin emerge in yolk sac blood islands, along with platelet progenitor cells and macrophages.[174, 175, 176] Later, erythro-myeloid progenitor (EMP) emerges from yolk sac and migrates to the fetal liver, producing definite erythroblasts.[173,177] Then, hematopoietic stem cells (HSC) emerge and migrate to the fetal liver and eventually to the adult bone marrow producing definite erythroblasts.[178,179] Adult HSCs in the bone marrow give rise to either a common myeloid progenitor (CMP) or common lymphoid progenitor (CLP). The CMP then differentiates into either a granulocyte monocyte progenitor (GMP) or megakaryocyte erythroid progenitor (MEP). The committed MEPs further differentiate into erythroid precursor cells with distinct morphologies, gradually reducing in cell and nuclear size, and finally to form enucleated reticulocytes.[180]
Alcohol abuse appears to be toxic on bone marrow, interfering with erythropoiesis, granulopoiesis and thrombopoiesis.[181] It directly damages erythroid precursors with vacuolization,[182, 183, 184] thereby contributing to macrocytic anemic of chronic alcoholics combined with nutritional deficiency especially folate.[185,186] Nucleated bone marrow cells metabolize ethanol[187] and the metabolites can also exert negative effects on erythropoiesis by disrupting and/or impairing the structural integrity, signaling regulation, metabolism, survival, proliferation, as well as differentiation of hematopoietic tissue.[188, 189, 190]
Alcohol directly impairs hematopoietic progenitor cells
Alcohol causes damage to hematopoietic cells both directly and indirectly.[139,183,191] The direct toxic targets of excessive alcohol include bone marrow, blood cell precursors, mature erythrocytes, white blood cells, and platelets (Figure 19).[139] The most commonly observed effects of alcohol on bone marrow are large vacuoles in early RBC precursor cells which usually emerge in the pronormoblasts within 7 days after heavy alcohol intake and disappear within 1–2 weeks after abstinence.[182,192] Morphological examinations also reveal that bone marrow from alcoholics exhibits a significant vacuolization in erythroid and megakaryocytic lineages.[184,193] Culturing normal marrow cells in nutrient medium with alcohol can induce cytoplasmic vacuolization as well, and the proportion of cells developing vacuoles appears to correlate with the concentration of alcohol.[184] Accumulation of vacuole can also indicate cell stress in hematopoietic precursor cells. Vacuolization reflects an adaptive response for cell survival,[194] which has the potential to lead to different forms of cell death subsequently.[194,195] In addition, alcohol induces oxidative stress, disrupts protein production in the ER, and inhibits ubiquitin-proteasome activity in cells.[196, 197, 198] These negative effects of alcohol on cell functions may potentially contribute to the formation of vacuoles.
Figure 19.
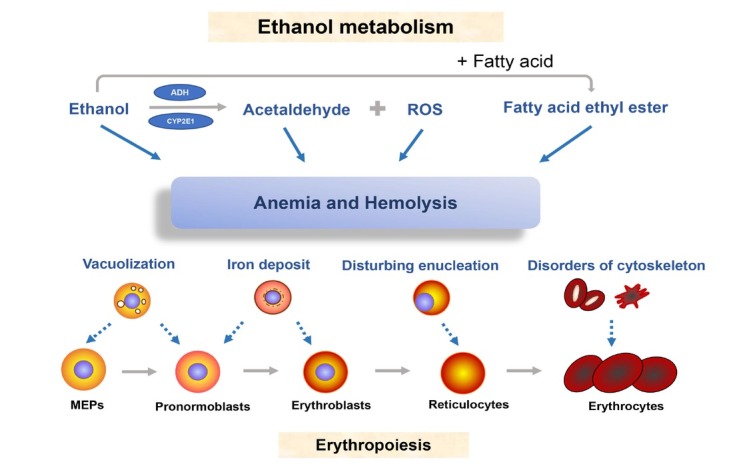
Ethanol metabolism and bone marrow toxicity. Ethanol and its metabolites acetaldehyde, ROS and fatty acid ethyl ester interfere with erythropoiesis and cause damage to precursor cells such as erythroblasts. This leads to vacuolization of MEPs and pronormoblasts, iron deposit in erythroblasts and malfunctional enucleation of reticulocytes. ROS: reactive oxygen species; MEP: megakaryocyte erythroid progenitor; ADH: alcohol dehydrogenase.
Metabolites of ethanol exert negative effects on bone marrow
Besides the direct influence of alcohol on bone marrow, the cellular metabolites such as acetaldehyde and reactive oxygen species (ROS) can also cause toxicity. Acetaldehyde covalently binds to proteins and nucleic acids[190,199,200] while ROS causes damage to lipids, proteins and nucleic acids.[201, 202, 203] Acetaldehyde adducts have been found both in blood and bone marrow of patients with ethanol-induced erythrocyte abnormalities[190] While ethanol facilitates both acidic and oxidative hemolysis, acetaldehyde only caused destabilization in the case of oxidative hemolysis.[204] In RBCs, catalase is considered as the only enzyme which can metabolize ethanol to acetaldehyde.[204] Fatty acid ethyl esters incorporated into membranes erythrocytes have been also shown to cause increased hemolysis.[205]
In addition, acetaldehyde is a genotoxic compound that reacts with DNA to primarily form dysfunctional adducts which ultimately and efficiently block DNA synthesis.[206] ROS are also produced during ethanol metabolism. Normally, ROS decreases in erythroblasts in later stages when the cells are preparing for enucleation. However, in alcoholics, ROS accumulation of terminal erythropoiesis will interfere the initiation of enucleation.[207] In summary, alcohol consumption causes impairment of structure, signaling, metabolism, proliferation and differentiation of hematopoietic cells. HSCs and the upstream multipotent progenitors are more resistant to the negative effects exerted by ethanol and acetaldehyde in comparison to the myeloid and the downstream progenitor cells[208] which is thought to be related to aldehyde dehydrogenase (ALDH) activity.[209, 210, 211] Whether the Zieve syndrome, a rare but severe form of hemolysis during heavy alcohol consumption, is caused by bone alcohol-mediated marrow damage remains an open question.[212]
Macrocytic anemia and sideroblastic anemia in heavy drinkers
Excessive alcohol consumption is one of the most common causes of macrocytosis and non-megaloblastic macrocytic anemia[213] and alcoholic detoxification can improve the elevated MCV.[214] On the other side, it is also commonly observed that MCV remains elevated for months despite abstaining from alcohol.
Neutrophil hyper-segmentation is a useful sign of folate depletion in patients,[215,216] whereas serum folate concentrations are not reliable. The Michigan Alcoholism Screening and γ-glutamyl transferase levels are highly sensitive tests for detecting alcoholics with macrocytosis, who may also exhibit other typical symptoms such as gynecomastia, caput medusae, and jaundice.[217] Significant folate depletion in alcoholism has been described as important reason for macrocytosis.[218,219] The normal production and maturation of erythroid precursor cells require folic acid and other B vitamins.[139] Although ethanol itself has been considered as the main reason of folate deficiency in alcoholics,[216] there are conflicting results we and others have not seen a stringent association between an elevated MCV deficiency of folic acid and vitamin B12 (see also text to Table 3).
Sideroblastic anemia is characterized by the emergence of ring sideroblast in bone marrow.[220,221] In some patients with alcoholism, iron cannot be properly incorporated in hemoglobin. These pathological erythroblasts which have particular iron accumulation in perinuclear mitochondria are called ringed sideroblast[222] and cannot further develop into functional erythrocytes. Acquired sideroblastic anemia is a common complication in heavy drinkers.[223] Furthermore, alcoholic sideroblastic anemia is often associated with myelodysplastic syndrome.[224] It has been shown that ring sideroblast usually disappear within one week of abstinence.[139]
In first preliminary experiments with a mouse alcoholic mouse model from our laboratory in cooperation with Marina Scheller-Wendorff from Heidelberg, both short and long-term ethanol exposure led to a reduced number of erythrocytes (Ter 119+ population) in the bone marrow whereas increased cell numbers were observed in the spleen. Increased weight for spleen was observed in chronic mice possibly due to hemolysis and to compensate for reduced hematopoietic activity. Analysis of terminal erythroid differentiation revealed that ethanol increased both number and production rate of proerythroblast. In contrast, the number of late erythroblasts was drastically decreased. These preliminary data suggest that ethanol exposure may cause ineffective erythropoiesis due to a differentiation arrest of late erythroblasts. Further studies are needed to better understand the molecular mechanisms of ethanol-mediated damage of bone marrow stem cell function.
Summary iron sensing and mechanisms of ethanol-mediated iron overload
Summary 1: Normal iron sensing and hepcidin expression
Based on the literature and our preliminary data, we propose a slightly different scenario for iron sensing and hepcidin expression (Figure 20). Accordingly, and as shown in Figure 6A, about 0.8% of all RBCs are recycled every day under normal, physiological conditions. The release of heme and subsequent heme degradation causes a permanent iron flow and basal ferritin expression. Under these low iron/heme concentrations, endothelial cell-derived BMP6 will enhance hepatocyte hepcidin expression through the SMAD/BMP pathway. Under normal conditions, total serum hepcidin will be derived at 90% from hepatocytes and 10% from macrophages. Especially hepatocyte-derived hepcidin shows a bivalent response (Figure 20 and Figure 14B). At low iron levels, hepcidin linearly depends on iron levels while it is suppressed at high iron levels. Bleeding will reduce the total amount of RBCs and consequently reduce the daily RBC recycling. This will naturally reduce the iron/heme-driven basal levels of hepcidin. Excess hemolysis will suppress hepcidin despite elevated BMP6 levels and cause further iron uptake such as seen in thalassemic patients. In addition, hepcidin will be further suppressed by either bone marrow secreted ERFE, by loss of hepatocytes during apoptosis or necrosis (liver damage) or during development of cirrhosis since most portal blood will bypass the liver and the function bowel-liver axis does not exist anymore. The right side of Figure 21 depicts the inflammation pathway through STAT3 that eventually causes iron accumulation in ferroportin-containing cells such as macrophages and hepatocytes limiting the availability of serum iron. It will consequently lead to microcytic anemia since iron will also become limiting for erythropoiesis. In contrast to present concepts, the continuous upregulation of hepcidin through RBC-recycling is critical for the understanding of iron sensing. The novel concept is able to harmonize the seeming discrepancies between in vitro and in vivo responses to iron. It still, however, needs to be resolved at the molecular level why hepatocytes show the bivalent response to increasing iron levels.
Figure 20.
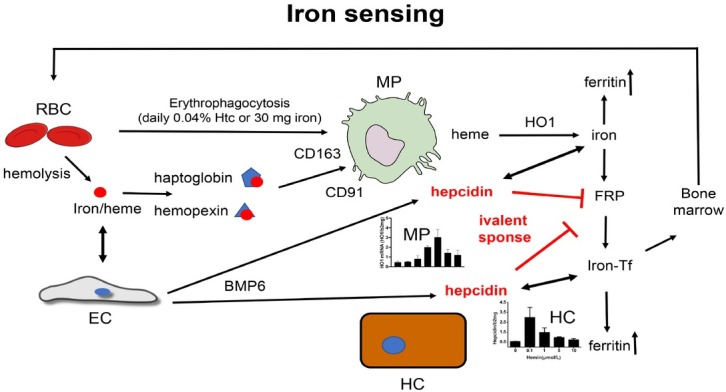
Proposed novel concept of iron sensing and the regulatory role of hepcidin-secreting HC, MC and BMP6-secreting endothelial cells. Basal daily RBCs turnover and hemolysis stimulate hepcidin and determine basal serum hepcidin levels mainly through iron/heme-induced BMP6 secretion from endothelial cells. The bivalent response of hepcidin secreting both by MC and HC determines hepcidin levels with suppression of hepcidin at higher iron/heme levels and induction of hepcidin at low iron levels. Hepcidin blocks iron export through ferroportin in both an autocrine, iron-buffering manner but also, second, in a systemic function. Under pathologic conditions (e.g. severe hemolysis) single cell and systemic control are in conflict. While suppression of hepcidin prevents e.g. toxic iron accumulation in macrophages or hepatocytes it ultimately causes systemic iron overload. RBC: red blood cell; EC: endothelial cell; BMP: bone morphogenic protein; HC: hepatocytes; MP: macrophages; FRP: ferroportin; HO1: hemeoxygenase 1; Iron-Tf: iron-loaded transferrin; Htc: hematocrit.
Figure 21.
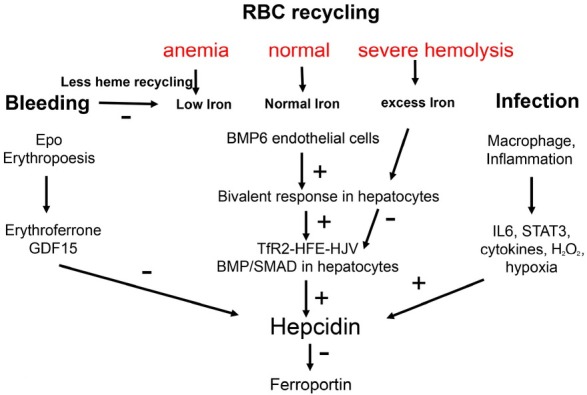
Proposed novel hepcidin signaling and iron sensing integrating the important role of continuous hemolysis and the bivalent response of hepcidin. For comparison, see also the conventional concept of hepcidin signaling in Figure 7. In normal conditions, iron released from RBC recycling is sensed by endothelial cells and the signal is transduced to hepatocytes by BMP6, which further control TfR2-HFE-HJV complex to upregulate hepcidin. During blood loss, hemolysis-driven hepcidin is suppressed because hemolysis-driven hepcidin expression will be decreased. This effect is further supported by GDF15 and ERFE. However, under conditions of severe hemolysis, the excess iron has an additional inhibitory effect on hepatocyte hepcidin, next to anemia-mediated effects, ultimately causing further iron accumulation. RBC: red blood cell; BMP: bone morphogenic protein; IL6: interleukin 6; STAT3: signal transducer and activator of transcription 3; ERFE: erythroferrone.
Summary 2: Single cells versus multicellular hepcidin responses to iron
Another important aspect of our novel concept is the autocrine versus systemic function of hepcidin. So far, the major role of hepcidin is seen in an efficient blockage of the iron exporter ferroportin that is only expressed in hepatocytes, macrophages and duodenal enterocytes. Although it has been already described that macrophage-secreted hepcidin can directly block macrophage-ferroportin and thus prevent iron export, the clear meaning of this mechanism is still missing. It has been also not widely conceived why hepatocytes also have ferroportin and most studies focus on duodenal and macrophage hepcidin. The above mentioned clinical observation that hepcidin is profoundly suppressed during severe hemolysis is also poorly understood and cannot be fully explained by e.g. data on ERFE. One explanation for these observations is the fact that hepcidin may have at least two functions: First, it controls the iron flow and export of hepatocytes and macrophages in an autocrine manner and, therefore, can be considered a single cell control. An increase of iron or heme will buffer the iron within these cells and lead to transient storage in ferritin which passively follows the control by ferroportin. Second, hepcidin has a systemic role, especially the hepatocyte-derived hepcidin that represents ca. 90% of total serum hepcidin. This hepcidin will also block ferroportin far from its origin of secretion such as the duodenum and macrophages. The bivalent response of hepcidin towards iron could represent a decision-making conflict between the single cell and the systemic responsibilities. For instance, if hepcidin is drastically suppressed under conditions of excess iron, ferroportin is upregulated and will allow the release of iron from e.g. hepatocytes or macrophages. Under these conditions of acute danger, the management tolerates the fact that further iron is absorbed via duodenum. In conclusion, iron sensing and control should not be seen as an absolute iron level-driven process but as a collective self-organization depending on various demands whether of single cells or systemic origin.
Summary 3: Molecular mechanism of iron overload during ethanol consumption
Based on our preliminary clinical studies and recent in vitro studies on the crosstalk between hepcidin-secreting and other neighboring cells, enhanced RBC turnover seems to be a key mechanism responsible for the iron accumulation in ALD patients. According to our long-term prospective study on heavy drinkers, about 50% develop hepatic iron overload. In ca. 15%, ferritin levels higher than 1000 ng/ mL are observed that rapidly normalize within 1–4 weeks after abstaining from alcohol. In our histological studies, iron is found both in macrophages and hepatocytes with huge variations among individual patients. The longterm mortality data clearly show that blood count (RBC number, Hb content or hematocrit) are among the first three top prognostic factors for long-term survival. A closer look at iron related parameters in this cohort of over 1000 patients indicates that indeed ca. 50% show an enhanced erythrophagocytosis as evidenced by increased CD163 levels (Table 3). Studies about the potential causes of the enhanced RBC turnover are still too complex to interpret. Although major ethanol-metabolites such as acetaldehyde and ethanol are able to cause hemolysis, quite high concentrations are necessary that may only transiently be reached e.g. in the portal vein. However, many other causes of hemolysis are present in alcoholics and may be related to ROS or at later stages of ALD to toxic effects of accumulating bile acids, bilirubin, hypalbuminemia and hypoosmolality. The various mechanisms of enhanced oxidative stress in ALD may further contribute to heme -turnover since oxidative marking of RBCs is known to initiate their sequestration. Notably, all these factors will worsen during disease progression. First, cholestasis will develop in cirrhotic causing accumulation of bile acids and bilirubin, causing hypoosmotic stress due to water retention. In addition, the protective effect of albumin will be weakened during the continuously developing hypalbuminemia.
We have also noted that this hemolysis seems to account for the typical laboratory finding in ALD with GOT levels prevailing over GPT levels since RBCs also contain significant amounts of GOT (see Figure 22A and B). It remains still to be elucidated how an excessive hemolysis also causes liver damage. However, the liver is essential for hemolytic pathways. For instance, the important heme degradation end product bilirubin needs to be conjugated by the liver and excreted through the bile. The fact that bilirubin or bile acids can further enhance hemolysis could represent a novel vicious cycle of hemolysis within ALD patients most likely contributing to the rare but severe and still poorly understood alcoholic hepatitis. It should be also noted that, in ALD, liver maintains its ability to conjugate bilirubin and typical laboratory findings in icteric ALD patients indicate a so-called mechanic cholestasis. It should be also mentioned that the term hemolysis is used in a very broad sense and also subsumes all forms of suicidal death such as eryptosis or regular forms of RBC sequestration through erythrophagocytosis. Direct hemolysis is certainly the most severe form of immediate RBC rupture. We have also learned from our large ALD cohort (Table 3) that ca. 25% are able to safely handle enhanced RBC turnover by promoting RBC re-synthesis ultimately storing iron in the largest and safest compartment, the RBC. Why only a smaller proportion of ALD patients are able to allow for RBC re-synthesis remains to be resolved since both levels of erythropoietin and ERFE are upregulated in these patients (Table 3). There are first indications that bone marrow toxicity, most likely at the stem cell compartment, contributes to this impaired RBC synthesis. It could also explain why MCV is elevated in ALD and considered a hallmark of chronic alcohol consumption for many decades. In this context, it is also quite elucidating that MCV levels remain elevated for many months despite complete alcohol withdrawal. Vitamin analysis by us and others also indicated that the seemingly first explanation, deficiency of either vitamin B12 or/and folic acid, are not the cause of MCV elevation in the majority of ALD patients. These observations also suggest that alcohol itself, so it may be the trigger for stem cell impairment, is not directly involved. One potential hypothesis could be the concept that iron accumulation itself could cause stem cell compartment toxicity as iron overloaded erythroid precursor cells have been observed in drinkers for a long time.
Figure 22.
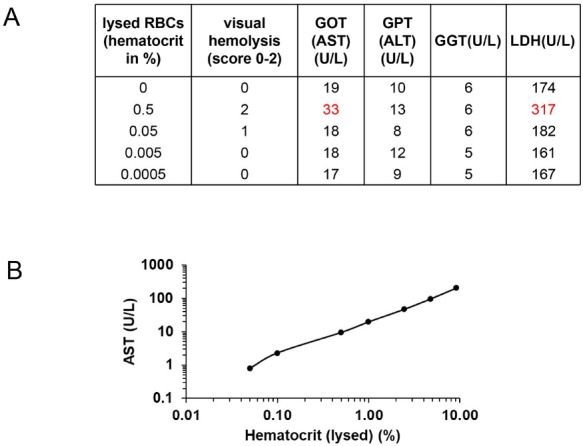
Evidence that elevated GOT levels in ALD are, at least in part, due to enhanced RBC turnover. (A) Measurement of GOT, GPT, GGT and LDH in diluted lysed RBCs and serum. Note that at 0.5% hematocrit, RBC-associated GOT elevation can be observed (and LDH). (B) GOT measured in hemolyzed RBCs (in distilled water 1:10) according to hematocrit. Consequently, ethanol-mediated RBC-turnover will be most likely responsible for GOT elevation in ALD. In addition, the heme degradation product bilirubin needs to be conjugated and excreted by the liver. During jaundice in endstage ALD, accumulation of bilirubin and bile acids will further cause hemolysis (eryptosis) initiating a vicious cycle of hemolysis and bilirubin elevation (see also Figure 6A). So far, RBC-GOT cannot be discriminated from liver-GOT. ALD: alcoholic liver disease; GOT: glutamic-oxaloacetic transaminase; RBC: red blood cell; GPT: glutamic-pyruvic transaminase; GGT: glutamyltransferase; AST: aspartate aminotransferase; ALT: alanine aminotransferase; LDH: lactate dehydrogenase.
Implications for future treatment strategies of ALD-associated iron overload
At present, no validated treatment options are readily available for ethanol-mediated iron overload. The idea of iron depletion by phlebotomy has been controversially discussed in patients with HCV that equally develop iron overload and phlebotomy is highly propagated e.g. in countries such as Japan. With regard to ALD, there has been one trial (Tirrox) initiated in France in 2012 (REF: ClinicalTrials.gov NCT01342705 Title: “Phlebotomy in risk of hepatocellular carcinoma in patients with compensated alcoholic cirrhosis”). This study, however, was stopped because of delayed patient recruitment. Based on the novel insights and concepts outlined within this concept paper, the following targeted molecular therapeutic approaches can be proposed:
Molecular strategies to enhance hepcidin signaling or supplement hepcidin (e.g. mini-hepcidins) could help to prevent further iron uptake in patients with ALD.
Targeted approaches to stabilize RBCs and lower RBC turnover should be very powerful strategies in preventing ALD-mediated iron overload. The documented efficacy of the antioxidant N-acetylcysteine (NAC) at least in one study points to one potential treatment option. As the mechanisms of RBC turnover are quite complex, various strategies should be explored that include supplementation with protective heme carriers (hemopexin, haptoglobin), iron chelators, or supplementation with RBC stabilizing vitamins such as folic acid or B12.
It will be essential to better understand the bone marrow stem cell compartment and the mechanisms of toxicity during alcohol consumption. A better understanding of the underlying mechanisms could lead to stem cell refreshing therapies in order to produce more and more stable RBCs.
In addition, we need to better understand why a significant fraction of ALD patients with enhanced RBC turnover are able to re-use the released iron for erythropoiesis while ca. 25% are not able to do so. Novel insights could also lead to novel targeted therapies to re-use and store iron safely in newly synthesized hemoglobin.
Future studies for a better understanding of alcohol-related iron overload
As is discussed in this concept paper, disturbed iron homeostasis seems to be a major part of ethanol pathology in drinkers. As has been outlined above, clinical and experimental evidence suggests that an increased RBC turnover is critical for survival of chronic drinkers, in cirrhotics but also complications such as alcoholic hepatitis. The following future directions are listed that may help to better understand iron management and RBC turnover in ALD patients in order to improve diagnosis, risk assessment and therapy for these patients.
RBC turnover
Study RBS damage through ethanol-related mechanisms including suicidal death (eryptosis) and erythrophagocytosis.
Study the role of heme-protective clearing pathways such as haptoglobin and hemopexin through CD163 and CD91.
Study the genetics of antioxidative defense of RBCs.
Study the role of hemolysis for liver damage.
Study the mechanisms of macrophage-mediated heme degradation and bilirubin transition to hepatocytes and bile excretion.
Study the role of nuclear receptors such as FXR in heme-degradation and ALD.
Differentiate between RBC-GOT and liver-GOT.
Mechanisms of iron sensing
Role of HFE in heme-mediated iron sensing.
Role of endothelium in hepcidin/iron sensing.
Complex interplay between oxidative stress, hypoxia and iron metabolism including ALD-induced oxidases such as NOX4.
ALD therapy
How can we interpret present beneficial concepts in the light of enhanced RBC-turnover such as the effects of N-acetyl cysteine or steroids.
If hemolysis is important for ALD progression, how can it be blocked?
If there is a vicious hemolytic cycle in patients with ALD, how can it be interrupted? Could albumin dialysis improve severe ALD?
How can the bone marrow stem cell compartment be stimulated to store iron more safely in RBCs?
Develop tests to specifically measure GOT and GPT in RBCs and compare it with liver transaminases.
Better define the role of AP and GGT in alcohol-toxicity which could be also linked to heme-toxicity.
Study role of cholestasis on ALD progression.
Better explain a rare form of alcohol-related hemolysis, the Zieve Syndrome.
Funding Statement
This study was funded by a grant of the DFG to SM (RA 2677/1-2). CC and SJW were supported by a fellowship from the China Scholarship Council (CSC).
Footnotes
Conflict of Interest
None declared.
References
- 1.Ofliver E. EASL Clinical Practice Guidelines: Management of alcohol-related liver disease. J Hepatol. 2018;69:154–81. doi: 10.1016/j.jhep.2018.03.018. [DOI] [PubMed] [Google Scholar]
- 2.Wong RJ, Aguilar M, Cheung R, Perumpail RB, Harrison SA, Younossi ZM. Nonalcoholic steatohepatitis is the second leading etiology of liver disease among adults awaiting liver transplantation in the United States. Gastroenterology. 2015;148:547–55. doi: 10.1053/j.gastro.2014.11.039. et al. [DOI] [PubMed] [Google Scholar]
- 3.Burra P, Senzolo M, Adam R, Delvart V, Karam V, Germani G. Liver transplantation for alcoholic liver disease in Europe: a study from the ELTR (European Liver Transplant Registry) Am J Transplant. 2010;10:138–48. doi: 10.1111/j.1600-6143.2009.02869.x. et al. [DOI] [PubMed] [Google Scholar]
- 4.Hazeldine S, Hydes T, Sheron N. Alcoholic liver disease - the extent of the problem and what you can do about it. Clin Med (Lond) 2015;15:179–85. doi: 10.7861/clinmedicine.15-2-179. [DOI] [PMC free article] [PubMed] [Google Scholar]
- 5.Teli MR, Day CP, Burt AD, Bennett MK, James OF. Determinants of progression to cirrhosis or fibrosis in pure alcoholic fatty liver. Lancet. 1995;346:987–90. doi: 10.1016/s0140-6736(95)91685-7. [DOI] [PubMed] [Google Scholar]
- 6.Lackner C, Spindelboeck W, Haybaeck J, Douschan P, Rainer F, Terracciano L. Histological parameters and alcohol abstinence determine long-term prognosis in patients with alcoholic liver disease. J Hepatol. 2017;66:610–8. doi: 10.1016/j.jhep.2016.11.011. et al. [DOI] [PubMed] [Google Scholar]
- 7.Gao B, Bataller R. Alcoholic liver disease: pathogenesis and new therapeutic targets. Gastroenterology. 2011;141:1572–85. doi: 10.1053/j.gastro.2011.09.002. [DOI] [PMC free article] [PubMed] [Google Scholar]
- 8.Osna NA, Donohue TM Jr, Kharbanda KK. Alcoholic Liver Disease: Pathogenesis and Current Management. Alcohol Res. 2017;38:147–161. [PMC free article] [PubMed] [Google Scholar]
- 9.Hamby-Mason R, Chen JJ, Schenker S, Perez A, Henderson GI. Catalase mediates acetaldehyde formation from ethanol in fetal and neonatal rat brain. Alcohol Clin Exp Res. 1997;21:1063–72. [PubMed] [Google Scholar]
- 10.Seitz HK, Bataller R, Cortez-Pinto H, Gao B, Gual A, Lackner C. Alcoholic liver disease. Nat Rev Dis Primers. 2018;4:16. doi: 10.1038/s41572-018-0014-7. et al. [DOI] [PubMed] [Google Scholar]
- 11.Tan HK, Yates E, Lilly K, Dhanda AD. Oxidative stress in alcohol-related liver disease. World J Hepatol. 2020;2:332–49. doi: 10.4254/wjh.v12.i7.332. [DOI] [PMC free article] [PubMed] [Google Scholar]
- 12.Mueller S, Peccerella T, Qin H, Glassen K, Waldherr R, Flechtenmacher C. Carcinogenic Etheno DNA Adducts in Alcoholic Liver Disease: Correlation with Cytochrome P-4502E1 and Fibrosis. Alcohol Clin Exp Res. 2018;42:252–59. doi: 10.1111/acer.13546. et al. [DOI] [PubMed] [Google Scholar]
- 13.Linhart K, Bartsch H, Seitz HK. The role of reactive oxygen species (ROS) and cytochrome P-450 2E1 in the generation of carcinogenic etheno-DNA adducts. Redox Biol. 2014;3:56–62. doi: 10.1016/j.redox.2014.08.009. [DOI] [PMC free article] [PubMed] [Google Scholar]
- 14.Sies H, Berndt C, Jones DP. Oxidative Stress. Annu Rev Biochem. 2017;86:715–48. doi: 10.1146/annurev-biochem-061516-045037. [DOI] [PubMed] [Google Scholar]
- 15.Leung TM, Nieto N. CYP2E1 and oxidant stress in alcoholic and nonalcoholic fatty liver disease. J Hepatol. 2013;58:395–8. doi: 10.1016/j.jhep.2012.08.018. [DOI] [PubMed] [Google Scholar]
- 16.Lu Y, Cederbaum AI. CYP2E1 and oxidative liver injury by alcohol. Free Radic Biol Med. 2008;44:723–38. doi: 10.1016/j.freeradbiomed.2007.11.004. [DOI] [PMC free article] [PubMed] [Google Scholar]
- 17.Ledig M, M'Paria JR, Mandel P. Superoxide dismutase activity in rat brain during acute and chronic alcohol intoxication. Neurochem Res. 1981;6:385–90. doi: 10.1007/BF00963853. [DOI] [PubMed] [Google Scholar]
- 18.Silva I, Peccerella T, Mueller S, Rausch V. IL-1 beta-mediated macrophage-hepatocyte crosstalk upregulates hepcidin under physiological low oxygen levels. Redox Biol. 2019;24:101209. doi: 10.1016/j.redox.2019.101209. [DOI] [PMC free article] [PubMed] [Google Scholar]
- 19.Dong J, Sulik KK, Chen SY. The role of NOX enzymes in ethanol-induced oxidative stress and apoptosis in mouse embryos. Toxicol Lett. 2010;193:94–100. doi: 10.1016/j.toxlet.2009.12.012. [DOI] [PMC free article] [PubMed] [Google Scholar]
- 20.Sasaki Y, Dehnad A, Fish S, Sato A, Jiang J, Tian J. NOX4 Regulates CCR2 and CCL2 mRNA Stability in Alcoholic Liver Disease. Sci Rep. 2017;7:46144. doi: 10.1038/srep46144. et al. [DOI] [PMC free article] [PubMed] [Google Scholar]
- 21.Jiang JX, Chen X, Serizawa N, Szyndralewiez C, Page P, Schroder K. Liver fibrosis and hepatocyte apoptosis are attenuated by GKT137831, a novel NOX4/NOX1 inhibitor in vivo. Free Radic Biol Med. 2012;53:289–96. doi: 10.1016/j.freeradbiomed.2012.05.007. et al. [DOI] [PMC free article] [PubMed] [Google Scholar]
- 22.Sun Q, Zhang W, Zhong W, Sun X, Zhou Z. Pharmacological inhibition of NOX4 ameliorates alcohol-induced liver injury in mice through improving oxidative stress and mitochondrial function. Biochim Biophys Acta Gen Subj. 2017;1861:2912–21. doi: 10.1016/j.bbagen.2016.09.009. [DOI] [PMC free article] [PubMed] [Google Scholar]
- 23.Li C, Li L, Yang CF, Zhong YJ, Wu D, Shi L. Hepatoprotective effects of Methyl ferulic acid on alcohol-induced liver oxidative injury in mice by inhibiting the NOX4/ROS-MAPK pathway. Biochem Biophys Res Commun. 2017;493:277–85. doi: 10.1016/j.bbrc.2017.09.030. et al. [DOI] [PubMed] [Google Scholar]
- 24.Silva I, Rausch V, Seitz HK, Mueller S. Does Hypoxia Cause Carcinogenic Iron Accumulation in Alcoholic Liver Disease (ALD)? Cancers (Basel) 2017;9:145. doi: 10.3390/cancers9110145. [DOI] [PMC free article] [PubMed] [Google Scholar]
- 25.Silva I, Rausch V, Peccerella T, Millonig G, Seitz HK, Mueller S. Hypoxia enhances H2O2-mediated upregulation of hepcidin: Evidence for NOX4-mediated iron regulation. Redox Biol. 2018;16:1–10. doi: 10.1016/j.redox.2018.02.005. [DOI] [PMC free article] [PubMed] [Google Scholar]
- 26.Lucey MR, Mathurin P, Morgan TR. Alcoholic hepatitis. N Engl J Med. 2009;360:2758–69. doi: 10.1056/NEJMra0805786. [DOI] [PubMed] [Google Scholar]
- 27.Park HS, Jung HY, Park EY, Kim J, Lee WJ, Bae YS. Cutting edge: direct interaction of TLR4 with NAD(P)H oxidase 4 isozyme is essential for lipopolysaccharide-induced production of reactive oxygen species and activation of NF-kappa B. J Immunol. 2004;173:3589–93. doi: 10.4049/jimmunol.173.6.3589. [DOI] [PubMed] [Google Scholar]
- 28.Baraona E, Lieber CS. Galanter M. The Consequences of Alcoholism. New York: Plenum Press; 1998. Alcohol and lipids; pp. 97–134. –. [Google Scholar]
- 29.You M, Considine RV, Leone TC, Kelly DP, Crabb DW. Role of adiponectin in the protective action of dietary saturated fat against alcoholic fatty liver in mice. Hepatology. 2005;42:568–77. doi: 10.1002/hep.20821. [DOI] [PMC free article] [PubMed] [Google Scholar]
- 30.Nakajima T, Kamijo Y, Tanaka N, Sugiyama E, Tanaka E, Kiyosawa K. Peroxisome proliferator-activated receptor alpha protects against alcohol-induced liver damage. Hepatology. 2004;40:972–80. doi: 10.1002/hep.20399. et al. [DOI] [PubMed] [Google Scholar]
- 31.Ji C, Chan C, Kaplowitz N. Predominant role of sterol response element binding proteins (SREBP) lipogenic pathways in hepatic steatosis in the murine intragastric ethanol feeding model. J Hepatol. 2006;45:717–24. doi: 10.1016/j.jhep.2006.05.009. [DOI] [PubMed] [Google Scholar]
- 32.Chedid A, Mendenhall CL, Gartside P, French SW, Chen T, Rabin L. Prognostic factors in alcoholic liver disease. VA Cooperative Study Group. Am J Gastroenterol. 1991;86:210–6. [PubMed] [Google Scholar]
- 33.Niemela O, Juvonen T, Parkkila S. Immunohistochemical demonstration of acetaldehyde-modified epitopes in human liver after alcohol consumption. J Clin Invest. 1991;87:1367–74. doi: 10.1172/JCI115141. [DOI] [PMC free article] [PubMed] [Google Scholar]
- 34.Theruvathu JA, Jaruga P, Nath RG, Dizdaroglu M, Brooks PJ. Polyamines stimulate the formation of mutagenic 1,N2-propanodeoxyguanosine adducts from acetaldehyde. Nucleic Acids Res. 2005;33:3513–20. doi: 10.1093/nar/gki661. [DOI] [PMC free article] [PubMed] [Google Scholar]
- 35.Seitz HK, Stickel F. Risk factors and mechanisms of hepatocarcinogenesis with special emphasis on alcohol and oxidative stress. Biol Chem. 2006;387:349–60. doi: 10.1515/BC.2006.047. [DOI] [PubMed] [Google Scholar]
- 36.Wang Y, Millonig G, Nair J, Patsenker E, Stickel F, Mueller S. Ethanol–induced cytochrome P4502E1 causes carcinogenic etheno-DNA lesions in alcoholic liver disease. Hepatology. 2009;50:453–61. doi: 10.1002/hep.22978. et al. [DOI] [PubMed] [Google Scholar]
- 37.Albano E. Alcohol, oxidative stress and free radical damage. Proc Nutr Soc. 2006;65:278–90. doi: 10.1079/pns2006496. [DOI] [PubMed] [Google Scholar]
- 38.Lieber CS. Cytochrome P-4502E1: its physiological and pathological role. Physiol Rev. 1997;77:517–44. doi: 10.1152/physrev.1997.77.2.517. [DOI] [PubMed] [Google Scholar]
- 39.Dupont I, Lucas D, Clot P, Menez C, Albano E. Cytochrome P4502E1 inducibility and hydroxyethyl radical formation among alcoholics. J Hepatol. 1998;28:564–71. doi: 10.1016/s0168-8278(98)80279-1. [DOI] [PubMed] [Google Scholar]
- 40.Seth D, Gorrell MD, Cordoba S, McCaughan GW, Haber PS. Intrahepatic gene expression in human alcoholic hepatitis. J Hepatol. 2006;45:306–20. doi: 10.1016/j.jhep.2006.04.013. [DOI] [PubMed] [Google Scholar]
- 41.Urbaschek R, McCuskey RS, Rudi V, Becker KP, Stickel F, Urbaschek B. Endotoxin, endotoxin-neutralizing-capacity, sCD14, sICAM-1, and cytokines in patients with various degrees of alcoholic liver disease. Alcohol Clin Exp Res. 2001;25:261–8. [PubMed] [Google Scholar]
- 42.Thurman RG. II. Alcoholic liver injury involves activation of Kupffer cells by endotoxin. Am J Physiol. 1998;275:G605–11. doi: 10.1152/ajpgi.1998.275.4.G605. [DOI] [PubMed] [Google Scholar]
- 43.Bardag-Gorce F, Yuan QX, Li J, French BA, Fang C, Ingelman-Sundberg M, French SW. The effect of ethanol-induced cytochrome p4502E1 on the inhibition of proteasome activity by alcohol. Biochem Biophys Res Commun. 2000;279:23–9. doi: 10.1006/bbrc.2000.3889. [DOI] [PubMed] [Google Scholar]
- 44.Bataller R, Brenner DA. Liver fibrosis. J Clin Invest. 2005;115:209–218. doi: 10.1172/JCI24282. [DOI] [PMC free article] [PubMed] [Google Scholar]
- 45.Cubero FJ, Urtasun R, Nieto N. Alcohol and liver fibrosis. Semin Liver Dis. 2009;29:211–21. doi: 10.1055/s-0029-1214376. [DOI] [PubMed] [Google Scholar]
- 46.Moreno M, Bataller R. Cytokines and renin-angiotensin system signaling in hepatic fibrosis. Clin Liver Dis. 2008;12:825–52. doi: 10.1016/j.cld.2008.07.013. [DOI] [PubMed] [Google Scholar]
- 47.Firrincieli D, Boissan M, Chignard N. Epithelial-mesenchymal transition in the liver. Gastroenterol Clin Biol. 2010;34:523–8. doi: 10.1016/j.gcb.2010.04.017. [DOI] [PubMed] [Google Scholar]
- 48.Mueller S, Seitz HK, Rausch V. Non-invasive diagnosis of alcoholic liver disease. World J Gastroenterol. 2014;20:14626–41. doi: 10.3748/wjg.v20.i40.14626. [DOI] [PMC free article] [PubMed] [Google Scholar]
- 49.Powell LW. The role of alcoholism in hepatic iron storage disease. Ann NY Acad Sci. 1975;252:124–34. doi: 10.1111/j.1749-6632.1975.tb19149.x. [DOI] [PubMed] [Google Scholar]
- 50.Ganne-Carrie N, Christidis C, Chastang C, Ziol M, Chapel F, Imbert-Bismut F. Liver iron is predictive of death in alcoholic cirrhosis: a multivariate study of 229 consecutive patients with alcoholic and/ or hepatitis C virus cirrhosis: a prospective follow up study. Gut. 2000;46:277–82. doi: 10.1136/gut.46.2.277. et al. [DOI] [PMC free article] [PubMed] [Google Scholar]
- 51.Adams PC, Agnew S. Alcoholism in hereditary hemochromatosis revisited: prevalence and clinical consequences among homozygous siblings. Hepatology. 1996;23:724–7. doi: 10.1002/hep.510230411. [DOI] [PubMed] [Google Scholar]
- 52.Mueller S, Rausch V. The role of iron in alcohol-mediated hepatocarcinogenesis. Adv Exp Med Biol. 2015;815:89–112. doi: 10.1007/978-3-319-09614-8_6. [DOI] [PubMed] [Google Scholar]
- 53.Seitz HK, Stickel F. Molecular mechanisms of alcohol-mediated carcinogenesis. Nat Rev Cancer. 2007;7:599–612. doi: 10.1038/nrc2191. [DOI] [PubMed] [Google Scholar]
- 54.Tirnitz-Parker JE, Glanfield A, Olynyk JK, Ramm GA. Iron and hepatic carcinogenesis. Crit Rev Oncog. 2013;18:391–407. doi: 10.1615/critrevoncog.2013007759. [DOI] [PubMed] [Google Scholar]
- 55.Uchida K, Szweda LI, Chae HZ, Stadtman ER. Immunochemical detection of 4-hydroxynonenal protein adducts in oxidized hepatocytes. Proc Natl Acad Sci US A. 1993;90:8742–46. doi: 10.1073/pnas.90.18.8742. [DOI] [PMC free article] [PubMed] [Google Scholar]
- 56.Bartsch H, Nair J. Oxidative stress and lipid peroxidation-derived DNA-lesions in inflammation driven carcinogenesis. Cancer Detect Prev. 2004;28:385–91. doi: 10.1016/j.cdp.2004.07.004. [DOI] [PubMed] [Google Scholar]
- 57.Hu W, Feng Z, Eveleigh J, Iyer G, Pan J, Amin S. The major lipid peroxidation product, trans-4-hydroxy-2-nonenal, preferentially forms DNA adducts at codon 249 of human p53 gene, a unique mutational hotspot in hepatocellular carcinoma. Carcinogenesis. 2002;23:1781–9. doi: 10.1093/carcin/23.11.1781. et al. [DOI] [PubMed] [Google Scholar]
- 58.Kohgo Y, Ohtake T, Ikuta K, Suzuki Y, Hosoki Y, Saito H. Iron accumulation in alcoholic liver diseases. Alcohol Clin Exp Res. 2005;29:189S–193. doi: 10.1097/01.alc.0000189274.00479.62. [DOI] [PubMed] [Google Scholar]
- 59.Eid N, Ito Y, Otsuki Y. Triggering of Parkin Mitochondrial Translocation in Mitophagy: Implications for Liver Diseases. Front Pharmacol. 2016;7:100. doi: 10.3389/fphar.2016.00100. [DOI] [PMC free article] [PubMed] [Google Scholar]
- 60.Rothfuss O, Fischer H, Hasegawa T, Maisel M, Leitner P, Miesel F, Sharma M. Parkin protects mitochondrial genome integrity and supports mitochondrial DNA repair. Hum Mol Genet. 2009;18:3832–50. doi: 10.1093/hmg/ddp327. et al. [DOI] [PubMed] [Google Scholar]
- 61.Ganz T. Systemic iron homeostasis. Physiol Rev. 2013;93:1721–41. doi: 10.1152/physrev.00008.2013. [DOI] [PubMed] [Google Scholar]
- 62.Wang J, Pantopoulos K. Regulation of cellular iron metabolism. Biochem J. 2011;434:365–81. doi: 10.1042/BJ20101825. [DOI] [PMC free article] [PubMed] [Google Scholar]
- 63.Andrews NC. Disorders of iron metabolism. N Engl J Med. 1999;341:1986–95. doi: 10.1056/NEJM199912233412607. [DOI] [PubMed] [Google Scholar]
- 64.Winn NC, Volk KM, Hasty AH. Regulation of tissue iron homeostasis: the macrophage "ferrostat". JCI Insight. 2020;5:e132964. doi: 10.1172/jci.insight.132964. [DOI] [PMC free article] [PubMed] [Google Scholar]
- 65.Klei TR, Meinderts SM, van den Berg TK, van Bruggen R. From the Cradle to the Grave: The Role of Macrophages in Erythropoiesis and Erythrophagocytosis. Front Immunol. 2017;8:73. doi: 10.3389/fimmu.2017.00073. [DOI] [PMC free article] [PubMed] [Google Scholar]
- 66.Tenhunen R, Marver HS, Schmid R. The enzymatic conversion of heme to bilirubin by microsomal heme oxygenase. Proc Natl Acad Sci U S A. 1968;61:748–55. doi: 10.1073/pnas.61.2.748. [DOI] [PMC free article] [PubMed] [Google Scholar]
- 67.Maines MD. The heme oxygenase system: a regulator of second messenger gases. Annu Rev Pharmacol Toxicol. 1997;37:517–54. doi: 10.1146/annurev.pharmtox.37.1.517. [DOI] [PubMed] [Google Scholar]
- 68.Ryter SW, Alam J, Choi AM. Heme oxygenase-1/carbon monoxide: from basic science to therapeutic applications. Physiol Rev. 2006;86:583–650. doi: 10.1152/physrev.00011.2005. [DOI] [PubMed] [Google Scholar]
- 69.Immenschuh S, Baumgart-Vogt E, Mueller S. Heme oxygenase-1 and iron in liver inflammation: a complex alliance. Curr Drug Targets. 2010;11:1541–50. doi: 10.2174/1389450111009011541. [DOI] [PubMed] [Google Scholar]
- 70.Kapitulnik J, Maines MD. Pleiotropic functions of biliverdin reductase: cellular signaling and generation of cytoprotective and cytotoxic bilirubin. Trends Pharmacol Sci. 2009;30:129–37. doi: 10.1016/j.tips.2008.12.003. [DOI] [PubMed] [Google Scholar]
- 71.Trakshel GM, Kutty RK, Maines MD. Purification and characterization of the major constitutive form of testicular heme oxygenase. The noninducible isoform. J Biol Chem. 1986;261:11131–7. [PubMed] [Google Scholar]
- 72.Choi AMK, Alam J. Heme oxygenase-1: Function, regulation, and implication of a novel stress-inducible protein in oxidant-induced lung injury. Am J Respir Cell Mol Biol. 1996;15:9–19. doi: 10.1165/ajrcmb.15.1.8679227. [DOI] [PubMed] [Google Scholar]
- 73.Immenschuh S, Ramadori G. Gene regulation of heme oxygenase-1 as a therapeutic target. Biochem. Pharmacol. 2000;60:1121–8. doi: 10.1016/s0006-2952(00)00443-3. [DOI] [PubMed] [Google Scholar]
- 74.Keyse SM, Applegate LA, Tromvoukis Y, Tyrrell RM. Oxidant stress leads to transcriptional activation of the human heme oxygenase gene in cultured skin fibroblasts. Mol Cell Biol. 1990;10:4967–9. doi: 10.1128/mcb.10.9.4967. [DOI] [PMC free article] [PubMed] [Google Scholar]
- 75.Vile GF, Basu-Modak S, Waltner C, Tyrrell RM. Heme oxygenase 1 mediates an adaptive response to oxidative stress in human skin fibroblasts. Proc Natl Acad Sci US A. 1994;91:2607–10. doi: 10.1073/pnas.91.7.2607. [DOI] [PMC free article] [PubMed] [Google Scholar]
- 76.Otterbein LE, Choi AM. Heme oxygenase: colors of defense against cellular stress. Am J Physiol Lung Cell Mol Physiol. 2000;279:L1029–37. doi: 10.1152/ajplung.2000.279.6.L1029. [DOI] [PubMed] [Google Scholar]
- 77.Gozzelino R, Jeney V, Soares MP. Mechanisms of cell protection by heme oxygenase-1. Annu Rev Pharmacol Toxicol. 2010;50:323–54. doi: 10.1146/annurev.pharmtox.010909.105600. [DOI] [PubMed] [Google Scholar]
- 78.Poss KD, Tonegawa S. Reduced stress defense in heme oxygenase 1-deficient cells. Proc Natl Acad Sci US A. 1997;94:10925–30. doi: 10.1073/pnas.94.20.10925. [DOI] [PMC free article] [PubMed] [Google Scholar]
- 79.Poss KD, Tonegawa S. Heme oxygenase is required for mammalian iron reutilization. Proc Natl Acad Sci US A. 1997;94:10919–24. doi: 10.1073/pnas.94.20.10919. [DOI] [PMC free article] [PubMed] [Google Scholar]
- 80.Park CH, Valore EV, Waring AJ, Ganz T. Hepcidin, a urinary antimicrobial peptide synthesized in the liver. J Biol Chem. 2001;276:7806–10. doi: 10.1074/jbc.M008922200. [DOI] [PubMed] [Google Scholar]
- 81.Sow FB, Florence WC, Satoskar AR, Schlesinger LS, Zwilling BS, Lafuse WP. Expression and localization of hepcidin in macrophages: a role in host defense against tuberculosis. J Leukoc Biol. 2007;82:934–45. doi: 10.1189/jlb.0407216. [DOI] [PubMed] [Google Scholar]
- 82.Nemeth E, Tuttle MS, Powelson J, Vaughn MB, Donovan A, Ward DM. Hepcidin regulates cellular iron efflux by binding to ferroportin and inducing its internalization. Science. 2004;306:2090–3. doi: 10.1126/science.1104742. et al. [DOI] [PubMed] [Google Scholar]
- 83.Lesbordes-Brion JC, Viatte L, Bennoun M, Lou DQ, Ramey G, Houbron C. Targeted disruption of the hepcidin 1 gene results in severe hemochromatosis. Blood. 2006;108:1402–5. doi: 10.1182/blood-2006-02-003376. et al. [DOI] [PubMed] [Google Scholar]
- 84.Nicolas G, Bennoun M, Porteu A, Mativet S, Beaumont C, Grandchamp B. Severe iron deficiency anemia in transgenic mice expressing liver hepcidin. Proc Natl Acad Sci U S A. 2002;99:4596–601. doi: 10.1073/pnas.072632499. et al. [DOI] [PMC free article] [PubMed] [Google Scholar]
- 85.Fung E, Nemeth E. Manipulation of the hepcidin pathway for therapeutic purposes. Haematologica. 2013;98:1667–76. doi: 10.3324/haematol.2013.084624. [DOI] [PMC free article] [PubMed] [Google Scholar]
- 86.Sangkhae V, Nemeth E. Regulation of the Iron Homeostatic Hormone Hepcidin. Adv Nutr. 2017;8:126–36. doi: 10.3945/an.116.013961. [DOI] [PMC free article] [PubMed] [Google Scholar]
- 87.Wu XG, Wang Y, Wu Q, Cheng WH, Liu W, Zhao Y. HFE interacts with the BMP type I receptor ALK3 to regulate hepcidin expression. Blood. 2014;124:1335–43. doi: 10.1182/blood-2014-01-552281. et al. [DOI] [PMC free article] [PubMed] [Google Scholar]
- 88.D'Alessio F, Hentze MW, Muckenthaler MU. The hemochromatosis proteins HFE, TfR2, and HJV form a membrane-associated protein complex for hepcidin regulation. J Hepatol. 2012;57:1052–60. doi: 10.1016/j.jhep.2012.06.015. [DOI] [PubMed] [Google Scholar]
- 89.Chen S, Feng T, Vujic Spasic M, Altamura S, Breitkopf-Heinlein K, Altenoder J. Transforming Growth Factor beta1 (TGF-beta1) Activates Hepcidin mRNA Expression in Hepatocytes. J Biol Chem. 2016;291:13160–74. doi: 10.1074/jbc.M115.691543. et al. [DOI] [PMC free article] [PubMed] [Google Scholar]
- 90.Shanmugam NK, Chen K, Cherayil BJ. Commensal Bacteria-induced Interleukin 1beta (IL-1beta) Secreted by Macrophages Up-regulates Hepcidin Expression in Hepatocytes by Activating the Bone Morphogenetic Protein Signaling Pathway. J Biol Chem. 2015;290:30637–47. doi: 10.1074/jbc.M115.689190. [DOI] [PMC free article] [PubMed] [Google Scholar]
- 91.Canali S, Core AB, Zumbrennen-Bullough KB, Merkulova M, Wang CY, Schneyer AL. Activin B Induces Noncanonical SMAD1/5/8 Signaling via BMP Type I Receptors in Hepatocytes: Evidence for a Role in Hepcidin Induction by Inflammation in Male Mice. Endocrinology. 2016;157:1146–62. doi: 10.1210/en.2015-1747. et al. [DOI] [PMC free article] [PubMed] [Google Scholar]
- 92.Canali S, Zumbrennen-Bullough KB, Core AB, Wang CY, Nairz M, Bouley R. Endothelial cells produce bone morphogenetic protein 6 required for iron homeostasis in mice. Blood. 2017;129:405–14. doi: 10.1182/blood-2016-06-721571. et al. [DOI] [PMC free article] [PubMed] [Google Scholar]
- 93.Zhang AS, Anderson SA, Wang J, Yang F, DeMaster K, Ahmed R. Suppression of hepatic hepcidin expression in response to acute iron deprivation is associated with an increase of matriptase-2 protein. Blood. 2011;117:1687–99. doi: 10.1182/blood-2010-06-287292. et al. [DOI] [PMC free article] [PubMed] [Google Scholar]
- 94.Pasricha SR, McHugh K, Drakesmith H. Regulation of Hepcidin by Erythropoiesis: The Story So Far. Annu Rev Nutr. 2016;36:417–34. doi: 10.1146/annurev-nutr-071715-050731. [DOI] [PubMed] [Google Scholar]
- 95.Kautz L, Jung G, Du X, Gabayan V, Chapman J, Nasoff M. Erythroferrone contributes to hepcidin suppression and iron overload in a mouse model of beta-thalassemia. Blood. 2015;126:2031–7. doi: 10.1182/blood-2015-07-658419. et al. [DOI] [PMC free article] [PubMed] [Google Scholar]
- 96.Kautz L, Jung G, Valore EV, Rivella S, Nemeth E, Ganz T. Identification of erythroferrone as an erythroid regulator of iron metabolism. Nat Genet. 2014;46:678–84. doi: 10.1038/ng.2996. [DOI] [PMC free article] [PubMed] [Google Scholar]
- 97.Michels K, Nemeth E, Ganz T, Mehrad B. Hepcidin and Host Defense against Infectious Diseases. PLoS Pathog. 2015;11:e1004998. doi: 10.1371/journal.ppat.1004998. [DOI] [PMC free article] [PubMed] [Google Scholar]
- 98.Millonig G, Ganzleben I, Peccerella T, Casanovas G, Brodziak-Jarosz L, Breitkopf-Heinlein K. Sustained submicromolar H2O2 levels induce hepcidin via signal transducer and activator of transcription 3 (STAT3) J Biol Chem. 2012;287:37472–82. doi: 10.1074/jbc.M112.358911. et al. [DOI] [PMC free article] [PubMed] [Google Scholar]
- 99.Sobotta MC, Liou W, Stocker S, Talwar D, Oehler M, Ruppert T. Peroxiredoxin-2 and STAT3 form a redox relay for H2O2 signaling. Nat Chem Biol. 2015;11:64–70. doi: 10.1038/nchembio.1695. et al. [DOI] [PubMed] [Google Scholar]
- 100.Matte A, De Falco L, Federti E, Cozzi A, Iolascon A, Levi S. Peroxiredoxin-2: A Novel Regulator of Iron Homeostasis in Ineffective Erythropoiesis. Antioxid Redox Signal. 2018;28:1–14. doi: 10.1089/ars.2017.7051. et al. [DOI] [PubMed] [Google Scholar]
- 101.Harrison-Findik DD, Schafer D, Klein E, Timchenko NA, Kulaksiz H, Clemens D. Alcohol metabolism-mediated oxidative stress down-regulates hepcidin transcription and leads to increased duodenal iron transporter expression. J Biol Chem. 2006;281:22974–82. doi: 10.1074/jbc.M602098200. et al. [DOI] [PubMed] [Google Scholar]
- 102.Rybinska I, Cairo G. Mutual Cross Talk Between Iron Homeostasis and Erythropoiesis. Vitam Horm. 2017;105:143–60. doi: 10.1016/bs.vh.2017.01.001. [DOI] [PubMed] [Google Scholar]
- 103.Ponka P, Beaumont C, Richardson DR. Function and regulation of transferrin and ferritin. Semin Hematol. 1998;35:35–54. [PubMed] [Google Scholar]
- 104.Muckenthaler MU, Rivella S, Hentze MW, Galy B. A Red Carpet for Iron Metabolism. Cell. 2017;168:344–61. doi: 10.1016/j.cell.2016.12.034. [DOI] [PMC free article] [PubMed] [Google Scholar]
- 105.Richardson DR, Lane DJ, Becker EM, Huang ML, Whitnall M, Suryo Rahmanto Y. Mitochondrial iron trafficking and the integration of iron metabolism between the mitochondrion and cytosol. Proc Natl Acad Sci U S A. 2010;107:10775–82. doi: 10.1073/pnas.0912925107. et al. [DOI] [PMC free article] [PubMed] [Google Scholar]
- 106.Bogdan AR, Miyazawa M, Hashimoto K, Tsuji Y. Regulators of Iron Homeostasis: New Players in Metabolism, Cell Death, and Disease. Trends Biochem Sci. 2016;41:274–86. doi: 10.1016/j.tibs.2015.11.012. [DOI] [PMC free article] [PubMed] [Google Scholar]
- 107.Mancias JD, Wang X, Gygi SP, Harper JW, Kimmelman AC. Quantitative proteomics identifies NCOA4 as the cargo receptor mediating ferritinophagy. Nature. 2014;509:105–9. doi: 10.1038/nature13148. [DOI] [PMC free article] [PubMed] [Google Scholar]
- 108.Dowdle WE, Nyfeler B, Nagel J, Elling RA, Liu S, Triantafellow E. Selective VPS34 inhibitor blocks autophagy and uncovers a role for NCOA4 in ferritin degradation and iron homeostasis in vivo. Nat Cell Biol. 2014;16:1069–79. doi: 10.1038/ncb3053. et al. [DOI] [PubMed] [Google Scholar]
- 109.Bellelli R, Federico G, Matte A, Colecchia D, Iolascon A, Chiariello M. NCOA4 Deficiency Impairs Systemic Iron Homeostasis. Cell Rep. 2016;14:411–21. doi: 10.1016/j.celrep.2015.12.065. et al. [DOI] [PubMed] [Google Scholar]
- 110.Wallander ML, Leibold EA, Eisenstein RS. Molecular control of vertebrate iron homeostasis by iron regulatory proteins. Biochim Biophys Acta. 2006;1763:668–89. doi: 10.1016/j.bbamcr.2006.05.004. [DOI] [PMC free article] [PubMed] [Google Scholar]
- 111.Henderson BR, Kuhn LC. Differential modulation of the RNA-binding proteins IRP-1 and IRP-2 in response to iron. IRP-2 inactivation requires translation of another protein. J Biol Chem. 1995;270:20509–15. doi: 10.1074/jbc.270.35.20509. [DOI] [PubMed] [Google Scholar]
- 112.Lok CN, Ponka P. Identification of an erythroid active element in the transferrin receptor gene. J Biol Chem. 2000;275:24185–90. doi: 10.1074/jbc.M000944200. [DOI] [PubMed] [Google Scholar]
- 113.Andriopoulos B, Hegedusch S, Mangin J, Riedel HD, Hebling U, Wang J. Sustained Hydrogen Peroxide Induces Iron Uptake by Transferrin Receptor-1 Independent of the Iron Regulatory Protein/Iron-responsive Element Network. J Biol Chem. 2007;282:20301–8. doi: 10.1074/jbc.M702463200. et al. [DOI] [PubMed] [Google Scholar]
- 114.Mueller S, Pantopoulos K, Hubner CA, Stremmel W, Hentze MW. IRP1 activation by extracellular oxidative stress in the perfused rat liver. J Biol Chem. 2001;276:23192–6. doi: 10.1074/jbc.M100654200. [DOI] [PubMed] [Google Scholar]
- 115.Mutze S, Hebling U, Stremmel W, Wang J, Arnhold J, Pantopoulos K. Myeloperoxidase-derived hypochlorous acid antagonizes the oxidative stress-mediated activation of iron regulatory protein 1. J Biol Chem. 2003;278:40542–9. doi: 10.1074/jbc.M307159200. et al. [DOI] [PubMed] [Google Scholar]
- 116.Mueller S. Iron regulatory protein 1 as a sensor of reactive oxygen species. Biofactors. 2005;24:171–81. doi: 10.1002/biof.5520240121. [DOI] [PubMed] [Google Scholar]
- 117.Bruick RK, McKnight SL. A conserved family of prolyl-4-hydroxylases that modify HIF. Science. 2001;294:1337–40. doi: 10.1126/science.1066373. [DOI] [PubMed] [Google Scholar]
- 118.Leung PS, Srai SK, Mascarenhas M, Churchill LJ, Debnam ES. Increased duodenal iron uptake and transfer in a rat model of chronic hypoxia is accompanied by reduced hepcidin expression. Gut. 2005;54:1391–5. doi: 10.1136/gut.2004.062083. [DOI] [PMC free article] [PubMed] [Google Scholar]
- 119.Nicolas G, Chauvet C, Viatte L, Danan JL, Bigard X, Devaux I. The gene encoding the iron regulatory peptide hepcidin is regulated by anemia, hypoxia, and inflammation. J Clin Invest. 2002;110:1037–44. doi: 10.1172/JCI15686. et al. [DOI] [PMC free article] [PubMed] [Google Scholar]
- 120.Peyssonnaux C, Zinkernagel AS, Schuepbach RA, Rankin E, Vaulont S, Haase VH. Regulation of iron homeostasis by the hypoxia-inducible transcription factors (HIFs) J Clin Invest. 2007;117:1926–32. doi: 10.1172/JCI31370. et al. [DOI] [PMC free article] [PubMed] [Google Scholar]
- 121.Braliou GG, Verga Falzacappa MV, Chachami G, Casanovas G, Muckenthaler MU, Simos G. 2-Oxoglutarate-dependent oxygenases control hepcidin gene expression. J Hepatol. 2008;48:801–10. doi: 10.1016/j.jhep.2007.12.021. [DOI] [PubMed] [Google Scholar]
- 122.Volke M, Gale DP, Maegdefrau U, Schley G, Klanke B, Bosserhoff AK. Evidence for a lack of a direct transcriptional suppression of the iron regulatory peptide hepcidin by hypoxia-inducible factors. PLoS One. 2009;4:e7875. doi: 10.1371/journal.pone.0007875. et al. [DOI] [PMC free article] [PubMed] [Google Scholar]
- 123.Liu Q, Davidoff O, Niss K, Haase VH. Hypoxia-inducible factor regulates hepcidin via erythropoietin-induced erythropoiesis. J Clin Invest. 2012;122:4635–44. doi: 10.1172/JCI63924. [DOI] [PMC free article] [PubMed] [Google Scholar]
- 124.Mastrogiannaki M, Matak P, Mathieu JR, Delga S, Mayeux P, Vaulont S. Hepatic hypoxia-inducible factor-2 down-regulates hepcidin expression in mice through an erythropoietin-mediated increase in erythropoiesis. Haematologica. 2012;97:827–34. doi: 10.3324/haematol.2011.056119. et al. [DOI] [PMC free article] [PubMed] [Google Scholar]
- 125.Goetze O, Schmitt J, Spliethoff K, Theurl I, Weiss G, Swinkels DW. Adaptation of iron transport and metabolism to acute high-altitude hypoxia in mountaineers. Hepatology. 2013;58:2153–62. doi: 10.1002/hep.26581. et al. [DOI] [PubMed] [Google Scholar]
- 126.Talbot NP, Lakhal S, Smith TG, Privat C, Nickol AH, Rivera-Ch M. Regulation of hepcidin expression at high altitude. Blood. 2012;119:857. doi: 10.1182/blood-2011-03-341776. et al. –. [DOI] [PubMed] [Google Scholar]
- 127.Sonnweber T, Nachbaur D, Schroll A, Nairz M, Seifert M, Demetz E. Hypoxia induced downregulation of hepcidin is mediated by platelet derived growth factor BB. Gut. 2014;63:1951–9. doi: 10.1136/gutjnl-2013-305317. et al. [DOI] [PubMed] [Google Scholar]
- 128.Silvestri L, Pagani A, Camaschella C. Furin-mediated release of soluble hemojuvelin: a new link between hypoxia and iron homeostasis. Blood. 2008;111:924–31. doi: 10.1182/blood-2007-07-100677. [DOI] [PubMed] [Google Scholar]
- 129.Lakhal S, Schodel J, Townsend AR, Pugh CW, Ratcliffe PJ, Mole DR. Regulation of type II transmembrane serine proteinase TMPRSS6 by hypoxia-inducible factors: new link between hypoxia signaling and iron homeostasis. J Biol Chem. 2011;286:4090–7. doi: 10.1074/jbc.M110.173096. [DOI] [PMC free article] [PubMed] [Google Scholar]
- 130.Anderson ER, Taylor M, Xue X, Martin A, Moons DS, Omary MB. The hypoxia-inducible factor-C/EBPalpha axis controls ethanol-mediated hepcidin repression. Mol Cell Biol. 2012;32:4068–77. doi: 10.1128/MCB.00723-12. et al. [DOI] [PMC free article] [PubMed] [Google Scholar]
- 131.Chaston TB, Matak P, Pourvali K, Srai SK, McKie AT, Sharp PA. Hypoxia inhibits hepcidin expression in HuH7 hepatoma cells via decreased SMAD4 signaling. Am J Physiol Cell Physiol. 2011;300:C888–95. doi: 10.1152/ajpcell.00121.2010. [DOI] [PMC free article] [PubMed] [Google Scholar]
- 132.Harrison-Findik DD, Klein E, Crist C, Evans J, Timchenko N, Gollan J. Iron-mediated regulation of liver hepcidin expression in rats and mice is abolished by alcohol. Hepatology. 2007;46:1979–85. doi: 10.1002/hep.21895. [DOI] [PubMed] [Google Scholar]
- 133.Gerjevic LN, Liu N, Lu S, Harrison-Findik DD. Alcohol Activates TGF-Beta but Inhibits BMP Receptor-Mediated Smad Signaling and Smad4 Binding to Hepcidin Promoter in the Liver. Int J Hepatol. 2012;2012:459278. doi: 10.1155/2012/459278. [DOI] [PMC free article] [PubMed] [Google Scholar]
- 134.Liu J, Liu W, Liu Y, Miao Y, Guo Y, Song H. New thiazolidinones reduce iron overload in mouse models of hereditary hemochromatosis and β-thalassemia. Haematologica. 2019;104:1768–81. doi: 10.3324/haematol.2018.209874. et al. [DOI] [PMC free article] [PubMed] [Google Scholar]
- 135.Wahidiyat PA, Iskandar SD, Sekarsari D. Evaluation of Iron Overload Between Age Groups Using Magnetic Resonance Imaging and Its Correlation with Iron Profile in Transfusion-dependent Thalassemia. Acta Med Indones. 2018;50:230–6. [PubMed] [Google Scholar]
- 136.de Back DZ, Kostova EB, van Kraaij M, van den Berg TK, van Bruggen R. Of macrophages and red blood cells; a complex love story. Front Physiol. 2014;5:9. doi: 10.3389/fphys.2014.00009. [DOI] [PMC free article] [PubMed] [Google Scholar]
- 137.Morse EE. Mechanisms of hemolysis in liver disease. Ann Clin Lab Sci. 1990;20:169–74. [PubMed] [Google Scholar]
- 138.Gwoździński L, Krawczyk P, Dworniak D, Kowalczyk E, Błaszczyk J. Alterations in the erythrocyte plasma membranes in patients with alcohol-induced liver cirrhosis - preliminary results. Arch Med Sci. 2011;7:87–91. doi: 10.5114/aoms.2011.20609. [DOI] [PMC free article] [PubMed] [Google Scholar]
- 139.Ballard HS. The hematological complications of alcoholism. Alcohol Health Res World. 1997;21:42–52. [PMC free article] [PubMed] [Google Scholar]
- 140.Fukuda T, Baba Y, Tanaka M, Ishibashi H, Hirata Y, Okamura T. [Severe alcoholic cirrhosis associated with spur cell anemia and DIC] Fukuoka Igaku Zasshi. 1991;82:398–402. et al. [PubMed] [Google Scholar]
- 141.Privitera G, Spadaro L, Marchisello S, Fede G, Purrello F. Abnormalities of Lipoprotein Levels in Liver Cirrhosis: Clinical Relevance. Dig Dis Sci. 2018;63:16–26. doi: 10.1007/s10620-017-4862-x. [DOI] [PubMed] [Google Scholar]
- 142.Nielsen MJ, Møller HJ, Moestrup SK. Hemoglobin and heme scavenger receptors. Antioxid Redox Signal. 2010;12:261–73. doi: 10.1089/ars.2009.2792. [DOI] [PubMed] [Google Scholar]
- 143.Gattegno L, Saffar L, Vaysse J. Inhibition by monoclonal anticomplement receptor type 1 on interactions between senescent human red blood cells and monocytic-macrophagic cells. J Leukoc Biol. 1989;45:422–8. doi: 10.1002/jlb.45.5.422. [DOI] [PubMed] [Google Scholar]
- 144.Wesseling MC, Wagner-Britz L, Nguyen DB, Asanidze S, Mutua J, Mohamed N. Novel Insights in the Regulation of Phosphatidylserine Exposure in Human Red Blood Cells. Cell Physiol Biochem. 2016;39:1941–54. doi: 10.1159/000447891. et al. [DOI] [PubMed] [Google Scholar]
- 145.Mueller S, Arnhold J. Albrecht S, Zimmermann T, Brandl H. Chemiluminescence at the turn of the millenium - an indispensable tool in modern chemistry, biochemistry and medicine. Dresden: Schweda; 2001. Light emission by luminol and its application; pp. 23–8. –. [Google Scholar]
- 146.Mütze S, Arnhold J, Stremmel W, Mueller S. Pandalai SG. Sensitive detection of hydrogen peroxide in biological systems: A non-enzymic approach. Recent Research Developments in Analytical Biochemistry. Volume 2: Transworld Research Network. 2002. pp. 165–84. –.
- 147.San George RC, Hoberman HD. Reaction of acetaldehyde with hemoglobin. J Biol Chem. 1986;261:6811–21. [PubMed] [Google Scholar]
- 148.Lang E, Gatidis S, Freise NF, Bock H, Kubitz R, Lauermann C. Conjugated bilirubin triggers anemia by inducing erythrocyte death. Hepatology. 2015;61:275–84. doi: 10.1002/hep.27338. et al. [DOI] [PMC free article] [PubMed] [Google Scholar]
- 149.Lang E, Pozdeev VI, Gatidis S, Qadri SM, Haussinger D, Kubitz R. Bile Acid-Induced Suicidal Erythrocyte Death. Cell Physiol Biochem. 2016;38:1500–9. doi: 10.1159/000443091. et al. [DOI] [PubMed] [Google Scholar]
- 150.Kawabata H. The mechanisms of systemic iron homeostasis and etiology, diagnosis, and treatment of hereditary hemochromatosis. Int J Hematol. 2018;107:31–43. doi: 10.1007/s12185-017-2365-3. [DOI] [PubMed] [Google Scholar]
- 151.Ramos E, Kautz L, Rodriguez R, Hansen M, Gabayan V, Ginzburg Y. Evidence for distinct pathways of hepcidin regulation by acute and chronic iron loading in mice. Hepatology. 2011;53:1333–41. doi: 10.1002/hep.24178. et al. [DOI] [PMC free article] [PubMed] [Google Scholar]
- 152.Nemeth E, Valore EV, Territo M, Schiller G, Lichtenstein A, Ganz T. Hepcidin, a putative mediator of anemia of inflammation, is a type II acute-phase protein. Blood. 2003;101:2461–3. doi: 10.1182/blood-2002-10-3235. [DOI] [PubMed] [Google Scholar]
- 153.Takayama G, Taniguchi A, Okano T. Identification of differentially expressed genes in hepatocyte/endothelial cell co-culture system. Tissue Eng. 2007;13:159–66. doi: 10.1089/ten.2006.0143. [DOI] [PubMed] [Google Scholar]
- 154.Li H, Choesang T, Bao W, Chen H, Feola M, Garcia-Santos D. Decreasing TfR1 expression reverses anemia and hepcidin suppression in beta-thalassemic mice. Blood. 2017;129:1514–26. doi: 10.1182/blood-2016-09-742387. et al. [DOI] [PMC free article] [PubMed] [Google Scholar]
- 155.Tanno T, Bhanu NV, Oneal PA, Goh SH, Staker P, Lee YT. High levels of GDF15 in thalassemia suppress expression of the iron regulatory protein hepcidin. Nat Med. 2007;13:1096–101. doi: 10.1038/nm1629. et al. [DOI] [PubMed] [Google Scholar]
- 156.Andriopoulos B. Corradini E, Xia Y, Faasse SA, Chen S, Grgurevic L. BMP6 is a key endogenous regulator of hepcidin expression and iron metabolism. Nat Genet. 2009;41:482–7. doi: 10.1038/ng.335. Jr. et al. [DOI] [PMC free article] [PubMed] [Google Scholar]
- 157.Arndt S, Maegdefrau U, Dorn C, Schardt K, Hellerbrand C, Bosserhoff AK. Iron-induced expression of bone morphogenic protein 6 in intestinal cells is the main regulator of hepatic hepcidin expression in vivo. Gastroenterology. 2010;138:372–82. doi: 10.1053/j.gastro.2009.09.048. [DOI] [PubMed] [Google Scholar]
- 158.Meynard D, Kautz L, Darnaud V, Canonne-Hergaux F, Coppin H, Roth MP. Lack of the bone morphogenetic protein BMP6 induces massive iron overload. Nat Genet. 2009;41:478–81. doi: 10.1038/ng.320. [DOI] [PubMed] [Google Scholar]
- 159.Xia Y, Babitt JL, Sidis Y, Chung RT, Lin HY. Hemojuvelin regulates hepcidin expression via a selective subset of BMP ligands and receptors independently of neogenin. Blood. 2008;111:5195–204. doi: 10.1182/blood-2007-09-111567. [DOI] [PMC free article] [PubMed] [Google Scholar]
- 160.Chiou B, Neal EH, Bowman AB, Lippmann ES, Simpson IA, Connor JR. Endothelial cells are critical regulators of iron transport in a model of the human blood-brain barrier. J Cereb Blood Flow Metab. 2019;39:2117–31. doi: 10.1177/0271678X18783372. [DOI] [PMC free article] [PubMed] [Google Scholar]
- 161.Baumann BH, Shu W, Song Y, Simpson EM, Lakhal-Littleton S, Dunaief JL. Ferroportin-mediated iron export from vascular endothelial cells in retina and brain. Exp Eye Res. 2019;187:107728. doi: 10.1016/j.exer.2019.107728. [DOI] [PMC free article] [PubMed] [Google Scholar]
- 162.Kamanna VS, Ganji SH, Shelkovnikov S, Norris K, Vaziri ND. Iron sucrose promotes endothelial injury and dysfunction and monocyte adhesion/infiltration. Am J Nephrol. 2012;35:114–9. doi: 10.1159/000334939. [DOI] [PMC free article] [PubMed] [Google Scholar]
- 163.Erdei J, Tóth A, Balogh E, Nyakundi BB, Bányai E, Ryffel B. Induction of NLRP3 Inflammasome Activation by Heme in Human Endothelial Cells. Oxid Med Cell Longev. 2018;2018:4310816. doi: 10.1155/2018/4310816. et al. [DOI] [PMC free article] [PubMed] [Google Scholar]
- 164.Noguchi T, Ikeda M, Murakami M, Masuzawa M, Imamura T, Hashimoto O. Regulatory expression of bone morphogenetic protein 6 by 2,2'-dipyridyl. Biochim Biophys Acta Gen Subj. 2020;1864:129610. doi: 10.1016/j.bbagen.2020.129610. et al. [DOI] [PubMed] [Google Scholar]
- 165.Patel N, Masaratana P, Diaz-Castro J, Latunde-Dada GO, Qureshi A, Lockyer P. BMPER protein is a negative regulator of hepcidin and is up-regulated in hypotransferrinemic mice. J Biol Chem. 2012;287:4099. doi: 10.1074/jbc.M111.310789. et al. –. [DOI] [PMC free article] [PubMed] [Google Scholar]
- 166.Lim PJ, Duarte TL, Arezes J, Garcia-Santos D, Hamdi A, Pasricha SR. Nrf2 controls iron homeostasis in haemochromatosis and thalassaemia via Bmp6 and hepcidin. Nat Metab. 2019;1:519–31. doi: 10.1038/s42255-019-0063-6. et al. [DOI] [PMC free article] [PubMed] [Google Scholar]
- 167.Yu L, Wang S, Chen C, Rausch V, Mueller S. Direct modulation of hepatocyte hepcidin signaling by iron. World J Hepatol. 2021;13:1378–93. doi: 10.4254/wjh.v13.i10.1378. [DOI] [PMC free article] [PubMed] [Google Scholar]
- 168.Wang S, Chen C, Yu L, Mueller J, Rausch V, Mueller S. Bone morphogenetic protein 6-mediated crosstalk between endothelial cells and hepatocytes recapitulates the iron-sensing pathway in vitro. J Biol Chem. 2021;297:101378. doi: 10.1016/j.jbc.2021.101378. [DOI] [PMC free article] [PubMed] [Google Scholar]
- 169.Kautz L, Jung G, Du X, Gabayan V, Chapman J, Nasoff M. Erythroferrone contributes to hepcidin suppression and iron overload in a mouse model of β-thalassemia. Blood. 2015;126:2031–7. doi: 10.1182/blood-2015-07-658419. et al. [DOI] [PMC free article] [PubMed] [Google Scholar]
- 170.Chintagari NR, Nguyen J, Belcher JD, Vercellotti GM, Alayash AI. Haptoglobin attenuates hemoglobin-induced heme oxygenase-1 in renal proximal tubule cells and kidneys of a mouse model of sickle cell disease. Blood Cells Mol Dis. 2015;54:302–6. doi: 10.1016/j.bcmd.2014.12.001. [DOI] [PMC free article] [PubMed] [Google Scholar]
- 171.Belaoussoff M, Farrington SM, Baron MH. Hematopoietic induction and respecification of A-P identity by visceral endoderm signaling in the mouse embryo. Development (Cambridge, England) 1998;125:5009–18. doi: 10.1242/dev.125.24.5009. [DOI] [PubMed] [Google Scholar]
- 172.Berry M, Grosveld F, Dillon N. A single point mutation is the cause of the Greek form of hereditary persistence of fetal haemoglobin. Nature. 1992;358:499–502. doi: 10.1038/358499a0. [DOI] [PubMed] [Google Scholar]
- 173.Palis J. Primitive and definitive erythropoiesis in mammals. Front Physiol. 2014;5:3. doi: 10.3389/fphys.2014.00003. [DOI] [PMC free article] [PubMed] [Google Scholar]
- 174.Potts KS, Sargeant TJ, Markham JF, Shi W, Biben C, Josefsson EC. A lineage of diploid platelet-forming cells precedes polyploid megakaryocyte formation in the mouse embryo. Blood. 2014;124:2725–9. doi: 10.1182/blood-2014-02-559468. et al. [DOI] [PubMed] [Google Scholar]
- 175.Kingsley PD, Malik J, Fantauzzo KA, Palis J. Yolk sac-derived primitive erythroblasts enucleate during mammalian embryogenesis. Blood. 2004;104:19–25. doi: 10.1182/blood-2003-12-4162. [DOI] [PubMed] [Google Scholar]
- 176.Van Handel B, Prashad SL, Hassanzadeh-Kiabi N, Huang A, Magnusson M, Atanassova B. The first trimester human placenta is a site for terminal maturation of primitive erythroid cells. Blood. 2010;116:3321. doi: 10.1182/blood-2010-04-279489. et al. –. [DOI] [PMC free article] [PubMed] [Google Scholar]
- 177.Böiers C, Carrelha J, Lutteropp M, Luc S, Green JCA, Azzoni E. Lymphomyeloid contribution of an immune-restricted progenitor emerging prior to definitive hematopoietic stem cells. Cell stem cell. 2013;13:535–48. doi: 10.1016/j.stem.2013.08.012. et al. [DOI] [PubMed] [Google Scholar]
- 178.Yoder MC. Inducing definitive hematopoiesis in a dish. Nat Biotechnol. 2014;32:539–41. doi: 10.1038/nbt.2929. [DOI] [PubMed] [Google Scholar]
- 179.Kiel MJ, He S, Ashkenazi R, Gentry SN, Teta M, Kushner JA. Haematopoietic stem cells do not asymmetrically segregate chromosomes or retain BrdU. Nature. 2007;449:238–42. doi: 10.1038/nature06115. et al. [DOI] [PMC free article] [PubMed] [Google Scholar]
- 180.Clarke BJ, Housman D. Characterization of an erythroid precursor cell of high proliferative capacity in normal human peripheral blood. Proc Natl Acad Sci U S A. 1977;74:1105–9. doi: 10.1073/pnas.74.3.1105. [DOI] [PMC free article] [PubMed] [Google Scholar]
- 181.Hourihane DO, Weir DG. Suppression of erythropoiesis by alcohol. Br Med J. 1970;1:86–9. doi: 10.1136/bmj.1.5688.86. [DOI] [PMC free article] [PubMed] [Google Scholar]
- 182.Ballard HS. Alcohol-associated pancytopenia with hypocellular bone marrow. Am J Clin Pathol. 1980;73:830–4. doi: 10.1093/ajcp/73.6.830. [DOI] [PubMed] [Google Scholar]
- 183.Heermans EH. Booze and blood: the effects of acute and chronic alcohol abuse on the hematopoietic system. Clin Lab Sci. 1998;11:229–32. [PubMed] [Google Scholar]
- 184.Yeung KY, Klug PP, Lessin LS. Alcohol-induced vacuolization in bone marrow cells: ultrastructure and mechanism of formation. Blood Cells. 1988;13:487–502. [PubMed] [Google Scholar]
- 185.Medici V, Peerson JM, Stabler SP, French SW, Gregory JF, Virata MC. Impaired homocysteine transsulfuration is an indicator of alcoholic liver disease. J Hepatol. 2010;53:551–7. doi: 10.1016/j.jhep.2010.03.029. et al. [DOI] [PMC free article] [PubMed] [Google Scholar]
- 186.Medici V, Halsted CH. Folate, alcohol, and liver disease. Mol Nutr Food Res. 2013;57:596–606. doi: 10.1002/mnfr.201200077. [DOI] [PMC free article] [PubMed] [Google Scholar]
- 187.Wickramasinghe SN, Bond AN, Sloviter HA, Saunders JE. Metabolism of ethanol by human bone marrow cells. Acta haematologica. 1981;66:238. doi: 10.1159/000207128. –. [DOI] [PubMed] [Google Scholar]
- 188.Garaycoechea JI, Crossan GP, Langevin F, Mulderrig L, Louzada S, Yang F. Alcohol and endogenous aldehydes damage chromosomes and mutate stem cells. Nature. 2018;553:171–7. doi: 10.1038/nature25154. et al. [DOI] [PMC free article] [PubMed] [Google Scholar]
- 189.Van Wassenhove LD, Mochly-Rosen D, Weinberg KI. Aldehyde dehydrogenase 2 in aplastic anemia, Fanconi anemia and hematopoietic stem cells. Mol Genet Metab. 2016;119:28–36. doi: 10.1016/j.ymgme.2016.07.004. [DOI] [PMC free article] [PubMed] [Google Scholar]
- 190.Latvala J, Parkkila S, Melkko J, Niemelä O. Acetaldehyde adducts in blood and bone marrow of patients with ethanol-induced erythrocyte abnormalities. Mol Med. 2001;7:401–5. [PMC free article] [PubMed] [Google Scholar]
- 191.Michot F, Gut J. Alcohol-induced bone marrow damage. A bone marrow study in alcohol-dependent individuals. Acta haematologica. 1987;78:252–7. doi: 10.1159/000205888. [DOI] [PubMed] [Google Scholar]
- 192.Latvala J, Parkkila S, Niemelä O. Excess alcohol consumption is common in patients with cytopenia: studies in blood and bone marrow cells. Alcohol Clin Exp Res. 2004;28:619–24. doi: 10.1097/01.alc.0000122766.54544.3b. [DOI] [PubMed] [Google Scholar]
- 193.Roselle GA, Mendenhall CL, Muhleman AF, Chedid A. The ferret: a new model of oral ethanol injury involving the liver, bone marrow, and peripheral blood lymphocytes. Alcohol Clin Exp Res. 1986;10:279–84. doi: 10.1111/j.1530-0277.1986.tb05090.x. [DOI] [PubMed] [Google Scholar]
- 194.Henics T, Wheatley DN. Cytoplasmic vacuolation, adaptation and cell death: a view on new perspectives and features. Biol Cell. 1999;91:485–98. doi: 10.1016/s0248-4900(00)88205-2. [DOI] [PubMed] [Google Scholar]
- 195.Shubin AV, Demidyuk IV, Komissarov AA, Rafieva LM, Kostrov SV. Cytoplasmic vacuolization in cell death and survival. Oncotarget. 2016;7:55863–89. doi: 10.18632/oncotarget.10150. [DOI] [PMC free article] [PubMed] [Google Scholar]
- 196.Das SK, Vasudevan DM. Alcohol-induced oxidative stress. Life Sci. 2007;81:177–87. doi: 10.1016/j.lfs.2007.05.005. [DOI] [PubMed] [Google Scholar]
- 197.Ji C. Advances and New Concepts in Alcohol-Induced Organelle Stress, Unfolded Protein Responses and Organ Damage. Biomolecules. 2015;5:1099–121. doi: 10.3390/biom5021099. [DOI] [PMC free article] [PubMed] [Google Scholar]
- 198.Donohue TM, Thomes PG. Ethanol-induced oxidant stress modulates hepatic autophagy and proteasome activity. Redox Biol. 2014;3:29–39. doi: 10.1016/j.redox.2014.10.006. [DOI] [PMC free article] [PubMed] [Google Scholar]
- 199.Niemelä O. Distribution of ethanol-induced protein adducts in vivo: relationship to tissue injury. Free Radic Biol Med. 2001;31:1533–8. doi: 10.1016/s0891-5849(01)00744-4. [DOI] [PubMed] [Google Scholar]
- 200.Yu HS, Oyama T, Isse T, Kitagawa K, Pham TT, Tanaka M. Formation of acetaldehyde-derived DNA adducts due to alcohol exposure. Chem Biol Interact. 2010;188:367–75. doi: 10.1016/j.cbi.2010.08.005. et al. [DOI] [PubMed] [Google Scholar]
- 201.Koch OR, Pani G, Borrello S, Colavitti R, Cravero A, Farrè S. Oxidative stress and antioxidant defenses in ethanol-induced cell injury. Mol Aspects Med. 2004;25:191–8. doi: 10.1016/j.mam.2004.02.019. et al. [DOI] [PubMed] [Google Scholar]
- 202.Wu D, Zhai Q, Shi X. Alcohol-induced oxidative stress and cell responses. J Gastroenterol Hepatol. 2006;21:S26–S29. doi: 10.1111/j.1440-1746.2006.04589.x. [DOI] [PubMed] [Google Scholar]
- 203.Hipkiss AR, Worthington VC, Himsworth DT, Herwig W. Protective effects of carnosine against protein modification mediated by malondialdehyde and hypochlorite. Biochim Biophys Acta. 1998;1380:46–54. doi: 10.1016/s0304-4165(97)00123-2. [DOI] [PubMed] [Google Scholar]
- 204.Tyulina OV, Huentelman MJ, Prokopieva VD, Boldyrev AA, Johnson P. Does ethanol metabolism affect erythrocyte hemolysis? Biochim Biophys Acta. 2000;1535:69–77. doi: 10.1016/s0925-4439(00)00086-7. [DOI] [PubMed] [Google Scholar]
- 205.Tyulina OV, Prokopieva VD, Dodd RD, Hawkins JR, Clay SW, Wilson DO. In vitro effects of ethanol, acetaldehyde and fatty acid ethyl esters on human erythrocytes. Alcohol Alcohol. 2002;37:179–86. doi: 10.1093/alcalc/37.2.179. et al. [DOI] [PubMed] [Google Scholar]
- 206.Stevens VJ, Fantl WJ, Newman CB, Sims RV, Cerami A, Peterson CM. Acetaldehyde adducts with hemoglobin. J Clin Invest. 1981;67:361–9. doi: 10.1172/JCI110043. [DOI] [PMC free article] [PubMed] [Google Scholar]
- 207.Zhao B, Mei Y, Yang J, Ji P. Erythropoietin-regulated oxidative stress negatively affects enucleation during terminal erythropoiesis. Exp Hematol. 2016;44:975–81. doi: 10.1016/j.exphem.2016.06.249. [DOI] [PMC free article] [PubMed] [Google Scholar]
- 208.Smith C, Gasparetto M, Jordan C, Pollyea DA, Vasiliou V. The effects of alcohol and aldehyde dehydrogenases on disorders of hematopoiesis. Adv Exp Med Biol. 2015;815:349–59. doi: 10.1007/978-3-319-09614-8_20. [DOI] [PubMed] [Google Scholar]
- 209.Chute JP, Muramoto GG, Whitesides J, Colvin M, Safi R, Chao NJ. Inhibition of aldehyde dehydrogenase and retinoid signaling induces the expansion of human hematopoietic stem cells. Proc Natl Acad Sci US A. 2006;103:11707–12. doi: 10.1073/pnas.0603806103. et al. [DOI] [PMC free article] [PubMed] [Google Scholar]
- 210.Gasparetto M, Sekulovic S, Brocker C, Tang P, Zakaryan A, Xiang P. Aldehyde dehydrogenases are regulators of hematopoietic stem cell numbers and B-cell development. Exp Hematol. 2012;40:318–29. doi: 10.1016/j.exphem.2011.12.006. et al. [DOI] [PubMed] [Google Scholar]
- 211.Muramoto GG, Russell JL, Safi R, Salter AB, Himburg HA, Daher P. Inhibition of aldehyde dehydrogenase expands hematopoietic stem cells with radioprotective capacity. Stem Cells. 2010;28:523–34. doi: 10.1002/stem.299. et al. [DOI] [PMC free article] [PubMed] [Google Scholar]
- 212.Liu MX, Wen XY, Leung YK, Zheng YJ, Jin MS, Jin QL. Hemolytic anemia in alcoholic liver disease: Zieve syndrome: A case report and literature review. Medicine (Baltimore) 2017;96:e8742. doi: 10.1097/MD.0000000000008742. et al. [DOI] [PMC free article] [PubMed] [Google Scholar]
- 213.Green R, Dwyre DM. Evaluation of Macrocytic Anemias. Semin Hematol. 2015;52:279–86. doi: 10.1053/j.seminhematol.2015.06.001. [DOI] [PubMed] [Google Scholar]
- 214.Maruyama S, Hirayama C, Yamamoto S, Koda M, Udagawa A, Kadowaki Y. Red blood cell status in alcoholic and non-alcoholic liver disease. J Lab Clin Med. 2001;138:332–7. doi: 10.1067/mlc.2001.119106. et al. [DOI] [PubMed] [Google Scholar]
- 215.Varadi S, Abbott D, Elwis A. Correlation of peripheral white cell and bone marrow changes with folate levels in pregnancy and their clinical significance. J Clin Pathol pathology. 1966;19:33–6. doi: 10.1136/jcp.19.1.33. [DOI] [PMC free article] [PubMed] [Google Scholar]
- 216.Kaferle J, Strzoda CE. Evaluation of macrocytosis. Am Fam Physician. 2009;79:203–8. [PubMed] [Google Scholar]
- 217.Seppä K, Laippala P, Saarni M. Macrocytosis as a consequence of alcohol abuse among patients in general practice. Alcohol Clin Exp Res. 1991;15:871–6. doi: 10.1111/j.1530-0277.1991.tb00615.x. [DOI] [PubMed] [Google Scholar]
- 218.Nagao T, Hirokawa M. Diagnosis and treatment of macrocytic anemias in adults. J Gen Fam Med. 2017;18:200–4. doi: 10.1002/jgf2.31. [DOI] [PMC free article] [PubMed] [Google Scholar]
- 219.Davenport J. Macrocytic anemia. Am Fam Physician. 1996;53:155–62. [PubMed] [Google Scholar]
- 220.Fujiwara T. Sideroblastic anemia. Rinsho Ketsueki. 2019;60:408–16. doi: 10.11406/rinketsu.60.408. [DOI] [PubMed] [Google Scholar]
- 221.Lindenbaum J, Roman MJ. Nutritional anemia in alcoholism. Am J Clin Nutr. 1980;33:2727–35. doi: 10.1093/ajcn/33.12.2727. [DOI] [PubMed] [Google Scholar]
- 222.Harigae H, Furuyama K. Hereditary sideroblastic anemia: pathophysiology and gene mutations. Int J Hematol. 2010;92:425–31. doi: 10.1007/s12185-010-0688-4. [DOI] [PubMed] [Google Scholar]
- 223.Pierce HI, McGuffin RG, Hillman RS. Clinical studies in alcoholic sideroblastosis. Arch Intern Med. 1976;136:283–9. [PubMed] [Google Scholar]
- 224.Fujiwara T. Ring sideroblasts and iron metabolism. Rinsho Ketsueki. 2020;61:770–8. doi: 10.11406/rinketsu.61.770. [DOI] [PubMed] [Google Scholar]
- 225.Medici V, Halsted CH. Folate, alcohol, and liver disease. Mol Nutr Food Res. 2013;57:596–606. doi: 10.1002/mnfr.201200077. [DOI] [PMC free article] [PubMed] [Google Scholar]
- 226.Roselle GA, Mendenhall CL, Muhleman AF, Chedid A. The ferret: a new model of oral ethanol injury involving the liver, bone marrow, and peripheral blood lymphocytes. Alcohol Clin Exp Res. 1986;10:279–84. doi: 10.1111/j.1530-0277.1986.tb05090.x. [DOI] [PubMed] [Google Scholar]
- 227.Seppä K, Laippala P, Saarni M. Macrocytosis as a consequence of alcohol abuse among patients in general practice. Alcohol Clin Exp Res. 1991;15:871–6. doi: 10.1111/j.1530-0277.1991.tb00615.x. [DOI] [PubMed] [Google Scholar]
- 228.Maruyama S, Hirayama C, Yamamoto S, Koda M, Udagawa A, Kadowaki Y. Red blood cell status in alcoholic and non-alcoholic liver disease. J Lab Clin Med. 2001;138:332–7. doi: 10.1067/mlc.2001.119106. et al. [DOI] [PubMed] [Google Scholar]
- 229.Yu HS, Oyama T, Isse T, Kitagawa K, Pham TT, Tanaka M. Formation of acetaldehyde-derived DNA adducts due to alcohol exposure. Chem Biol Interact. 2010;188:367–75. doi: 10.1016/j.cbi.2010.08.005. et al. [DOI] [PubMed] [Google Scholar]
- 230.Morse EE. Mechanisms of hemolysis in liver disease. Ann Clin Lab Sci. 1990;20:169–74. [PubMed] [Google Scholar]
- 231.Fukuda T, Baba Y, Tanaka M, Ishibashi H, Hirata Y, Okamura T. Severe alcoholic cirrhosis associated with spur cell anemia and DIC. Fukuoka Igaku Zasshi. 1991;82:398–402. et al. [PubMed] [Google Scholar]
- 232.Koch OR, Pani G, Borrello S, Colavitti R, Cravero A, Farrè S. Oxidative stress and antioxidant defenses in ethanol-induced cell injury. Mol Aspects Med. 2004;25:191–8. doi: 10.1016/j.mam.2004.02.019. et al. [DOI] [PubMed] [Google Scholar]
- 233.Zhao B, Yang J, Ji P. Chromatin condensation during terminal erythropoiesis. Nucleus. 2016;7:425–9. doi: 10.1080/19491034.2016.1226717. [DOI] [PMC free article] [PubMed] [Google Scholar]