

ABSTRACT
The term “fracture cascade” refers to the sequence of fragility fractures resulting from the increased fracture risk that occurs with aging and following fractures. Here, we evaluate the sequence of previous fractures in women aged 55 to 90 years presenting with a fragility fracture and subsequent (12 to 24 months) fracture incidence. In this retrospective, observational study, women aged 55 to 90 years with an “index” fragility fracture in 2013 were identified from Swedish national registries. A history of previous fractures (2001 to 2012) and osteoporosis treatment was used to characterize fracture cascade patterns. Cumulative incidence of new fractures within 12 to 24 months following the index fracture, based on index fracture type and age, were used to describe the risk of subsequent fractures. A total of 35,146 women with a mean age of 73.8 years were included (7180 hip, 2786 clinical vertebral, and 25,180 nonhip/nonvertebral [NHNV] index fractures); 38% of women with hip, 38% with clinical vertebral, and 25% with NHNV index fractures had one or more previous fractures. Across all index fracture types, the proportion of women with any previous fracture increased with age; 34% to 46% of index hip or clinical vertebral fractures in women ≥70 years were not their first fracture. Following any index fracture, cumulative incidence of a new fracture over 24 months was over 11% (index clinical vertebral 18%; index hip 14%). Osteoporosis treatment rates were low both in patients with (27%) and without (18%) a previous fracture. These descriptive data demonstrate that almost one‐third of women aged 55 to 90 years suffering a new fracture have had a previous fragility fracture. Fracture location influences incidence and type of subsequent fracture during the 24 months following a fragility fracture, with clinical vertebral fractures carrying the greatest imminent fracture risk. These data highlight the clinical impact and need for early, effective treatment soon after any fragility fracture. © 2020 The Authors. Journal of Bone and Mineral Research published by American Society for Bone and Mineral Research
Keywords: BURDEN, FRACTURE CASCADE, FRAGILITY FRACTURE, OSTEOPOROSIS
Introduction
Fragility fractures, a result of the decreased bone strength characteristic of osteoporosis, are an increasing medical, societal, and economic problem. Worldwide, a fragility fracture is estimated to occur every 3 seconds.1 Fragility fractures are a major cause of disability and reduced quality of life.2, 3, 4 In the EU6 (France, Germany, Italy, Spain, Sweden, and United Kingdom), 2.68 million fragility fractures occurred in 2017, leading to a loss of over one million quality‐adjusted life years. These fractures accounted for €37.5 billion in healthcare costs in 2017 alone, with costs expected to rise to €47.4 billion annually by 2030.5
Risk of fragility fracture increases with age, as bone mineral density loss is compounded and skeletal microstructure deteriorates.6, 7 A significant proportion of elderly patients will sustain two or more fragility fractures during their lifetime. A Scottish National Health Service audit of fragility fractures showed that almost one‐half of patients who sustained a hip fracture had a history of up to four previous fractures.8 Risk of a recurrent fracture is higher for women than men, with previous fracture as one of the greatest risk factors for future fracture.9, 10 Furthermore, this risk is not constant over time. The increased risk of suffering a subsequent fracture is highest within the 2 years following the first fragility fracture, then declines.10, 11 During this period, up to 25% of fracture patients will experience a subsequent fracture depending on the type of previous fracture, with vertebral fractures increasing risk the most.12, 13, 14 The marked elevation in risk seen in the 24 months following a fragility fracture as compared to lifetime risk is increasingly recognized and termed “imminent risk.”
Evidence suggests that the risk of a subsequent fracture is cumulative as risk never returns to prefracture levels. As a result, a patient's likelihood of sustaining another fracture successively increases; this has been referred to as the “fracture cascade”.15, 16 Additionally, the pattern of skeletal sites impacted by fragility fracture also changes over a patient's life, with female patients generally progressing from forearm fractures early in menopause to vertebral fractures and then hip/femur fractures later in life.16 Vertebral fracture incidence has also been reported to be higher in patients who have previously experienced a vertebral fracture, a phenomenon termed the “vertebral fracture cascade”.17 Understanding the pattern of fragility fractures, identifying which patients are at highest risk of sustaining subsequent fractures, and addressing gaps in treatment following a fragility fracture will help ensure that patients are treated appropriately to reduce the risk of recurrence.
The primary objective of this study was to evaluate history of previous fracture and osteoporosis treatment in Swedish women aged 55 to 90 years with an incident fragility fracture by fracture type and age. The second objective of this study was to report the patterns of subsequent fragility fractures (within 24 months) following the incident fragility fracture and explore associations between fracture type and age with subsequent fracture risk and mortality in this population.
Patients and Methods
Patients and study design
In this retrospective, observational study, Swedish female patients were identified who (i) had a primary diagnosis of a fragility fracture (“index fracture”) between January 1, 2013 and December 31, 2013; (ii) were aged 55 to 90 years at time of index fracture; and (iii) did not have a diagnosis of Paget's disease or any malignancy other than basal cell carcinoma (Fig. 1). Index fractures were defined as the first fragility fracture that occurred during 2013. A fragility fracture was defined as a fracture typically associated with osteoporosis; International Classification of Diseases, 10th Revision (ICD‐10) codes used to define fragility fractures are listed in Supplementary Table 1. “Previous” fractures were defined as any fracture(s) that occurred between January 1, 2001 (the earliest date that data were available) and the 2013 index fracture. “Subsequent” fractures were defined as any fragility fractures that occurred within 24 months of the index fracture.
Figure 1.
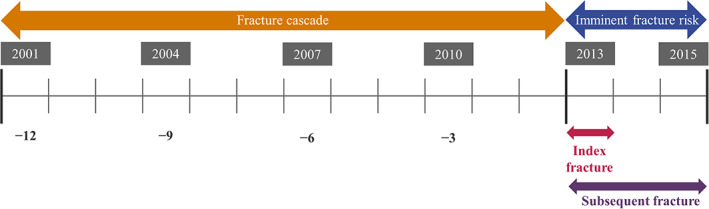
Study design. Swedish female patients were identified who (i) had a primary diagnosis of a fragility fracture (“index fracture”) between January 1, 2013 and December 31, 2013; (ii) were aged 55 to 90 years at time of index fracture; and (iii) did not have a diagnosis of Paget's disease or any malignancy (other than basal cell carcinoma).
Osteoporosis treatment exposure was defined as having been prescribed at least one osteoporosis drug; a list of osteoporosis drugs and their corresponding anatomic therapeutic chemical (ATC) codes used are listed in Supplementary Table 2. Osteoporosis treatment history was assessed for all patients during the 12‐month period prior to index fracture; additionally, for patients without a previous fracture it was assessed for any point between 2001 (the study period start) and the index fracture, or, for patients with a previous fracture, it was assessed between the previous and index fracture.
Data sources
The Swedish National Patient Register was used to identify patients for inclusion; extracted data included gender, patient identification numbers, diagnosis codes, dates of diagnosis, duration of hospitalizations, and specialist visits. Patient prescription data were obtained from Sweden's Prescribed Drug Register; extracted data included patient identification numbers, ATC codes, prescription dates, dispensing dates, defined daily doses per prescribed package, and number of pills/injections. Sweden's Cause of Death Register was used to establish patients' dates of death using patient identification numbers.
A four‐part algorithm was used to avoid double counting of fractures: (i) a primary fracture diagnosis was required for all fractures to be defined as a new event; (ii) hip fractures had to be diagnosed in an inpatient setting; (iii) a fracture diagnosis reoccurring for the same body site was only counted as new if ≥6 months had passed since the previous fracture; and (iv) fracture diagnoses with an ICD‐10 code of Z.094 (follow‐up examination after fracture) were excluded.
Statistical analysis
Fractures were primarily reported as any, hip, clinical vertebral, or nonhip/nonvertebral (NHNV). Fractures commonly designated as major osteoporotic fractures (MOFs), including those at the hip, vertebra, humerus, wrist, and pelvis, were additionally analyzed.
Overall cumulative fracture incidence within 12 and 24 months after the index fracture, and by index fracture type and age group (55 to 59, 60 to 69, 70 to 79, 80 to 89, and 90 years), were assessed taking the competing risk of death into account. Patients were followed until the occurrence of fracture, death, or end of data availability (December 31, 2015), whichever came first. A significance level of 5% was used when calculating two‐sided confidence intervals. Proportions of patients with previous fractures were estimated by index fracture type, age group, and number of previous fractures. Analyses were descriptive in nature and no hypothesis tests were performed. All data management and analyses were conducted in MySQL (Oracle, Redwood City, CA, USA) and Stata 15 (Stata Corporation, Inc., College Station, TX, USA).
Results
Patient characteristics and index fractures
A total of 35,146 women with an index fracture in 2013 were included in the analysis. Mean age at time of index fracture was 73.8 years (range, 55 to 90 years). Patient baseline characteristics are listed in Table 1. One in five (20.7%) patients had a history of osteoporosis treatment at any point before the index fracture, while one in 10 (10.1%) had been treated in the 12 months leading up to the index fracture. Wrist/forearm fractures were the most common type of index fracture (28.5%), followed by hip (20.4%), humerus (14.1%), and clinical vertebral (7.9%) (Table 1). Index fracture types differed by age, with wrist/forearm fractures being most common in patients aged 55 to 79 years and hip fractures being most common in patients ≥80 years. Approximately 70% of all index fractures were MOFs.
Table 1.
Baseline Characteristics of Women With an Index Fracture at Time of Index Fracture (n = 35,146)
| Characteristic (at time of index fracture) | Value |
|---|---|
| Age (years), mean ± SD | 73.8 ± 10.3 |
| >70 years old, n (%) | 21,856 (62.2) |
| Type of index fracture, n (%) | |
| Hip fracture | 7180 (20.4) |
| Clinical vertebral fracture | 2786 (7.9) |
| Wrist/forearm fracture | 10,006 (28.5) |
| Humerus fracture | 4963 (14.1) |
| Other index fracturea | 10,211 (29.1) |
| Days of hospitalization in past 12 months, mean ± SD | 1.7 ± 7.0 |
| Physician specialist visits in past 12 months, mean ± SD | 2.2 ± 5.1 |
| Osteoporosis treatment experience any time before index fracture, n (%) | 7268 (20.7) |
| Osteoporosis treatment experience in past 12 months, n (%) | 3551 (10.1) |
| Number of any different medications in past 12 months, mean ± SD | 8.4 ± 6.6 |
| Glucocorticoid use in past 12 months, n (%) | 2656 (7.6) |
| Assisted drug dispensing, n (%)b | 3930 (11.2) |
| Exposure to drugs that increase risk of falls in past 12 months, n (%) | 25,857 (73.6) |
| Secondary osteoporosis, n (%) | 2859 (8.1) |
| Charlson Index, mean ± SD | 0.4 ± 0.9 |
Other index fractures included that of the rib, pelvis, and patella, among others.
Use of the ApoDos assisted drug dispensing system; used as a broad proxy for frailty, cognitive/functional impairment, and medication burden.
Previous fracture and treatment history
The proportions of women with a previous fracture are presented by index fracture type and age in Fig. 2; 28.6% of patients had experienced at least one previous fracture within the 12 years before the index fracture, and this increased with age (50 to 59 years: 10.3%; 80 to 89 years: 40.2%). Over one‐third of women with an index clinical vertebral (37.9%) or hip (38.0%) fracture had previously sustained at least one fracture. Among all women, 5.6% (n = 1970; mean age, 79.3 years) had a history of two previous fractures before index fracture, and 2.1% (n = 723; mean age, 80.3 years) had three or more.
Figure 2.
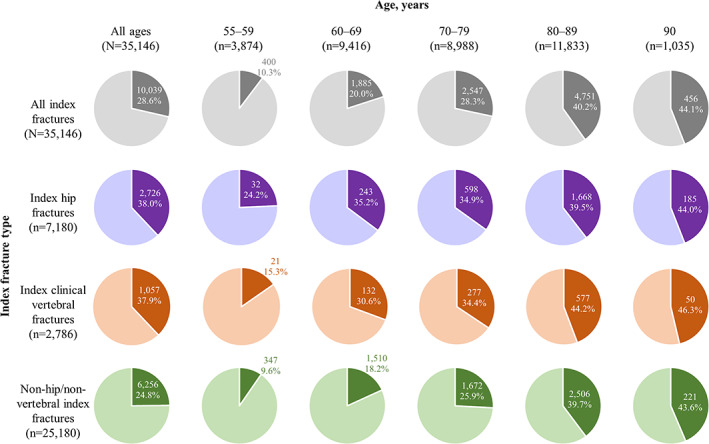
Proportion of women with a previous fracture by index fracture type and age (n = 35,146). Dark shading indicates the proportion of women within that group who experienced a previous fracture before index fracture.
Osteoporosis treatment history by previous fracture history, index fracture type, and age group is listed in Table 2. The proportion of women with osteoporosis treatment before index fracture was higher among women with a previous fracture (27.0%) versus those without (18.2%). Among all patients in the study, those with index hip fractures had the lowest history of osteoporosis treatment (18.3%). The age group with the greatest proportion of patients with a history of osteoporosis treatment was women aged 70 to 79 years at time of index fracture (22.4%).
Table 2.
Osteoporosis Treatment History by Index Fracture Type and Age
| n | Patients with osteoporosis treatment before index fracture n (%) | |
|---|---|---|
| All patients in studya | ||
| Index fracture type | ||
| Any | 35,146 | 7268 (20.7) |
| Hip | 7180 | 1315 (18.3) |
| Clinical vertebral | 2786 | 867 (31.1) |
| Nonhip/nonvertebral | 25,180 | 5086 (20.2) |
| Age group | ||
| 55–59 years | 3874 | 629 (16.2) |
| 60–69 years | 9416 | 1894 (20.1) |
| 70–79 years | 8988 | 2013 (22.4) |
| 80–89 years | 11,833 | 2552 (21.6) |
| 90 years | 1035 | 180 (17.4) |
| Patients with a previous fracture before index fracture (treatment incidence assessed for period between previous and index fracture)a | ||
| Index fracture type | ||
| Any | 10,039 | 2711 (27.0) |
| Hip | 2726 | 635 (23.3) |
| Clinical vertebral | 1057 | 387 (36.6) |
| Nonhip/nonvertebral | 6256 | 1689 (27.0) |
| Age group | ||
| 55–59 years | 400 | 81 (20.3) |
| 60–69 years | 1885 | 474 (25.1) |
| 70–79 years | 2547 | 779 (30.6) |
| 80–89 years | 4751 | 1285 (27.0) |
| 90 years | 456 | 92 (20.2) |
| Patients without a previous fracture before index fracture (treatment incidence assessed between study period start and index fracture)a | ||
| Index fracture type | ||
| Any | 25,107 | 4557 (18.2) |
| Hip | 4454 | 680 (15.3) |
| Clinical vertebral | 1729 | 480 (27.8) |
| Nonhip/nonvertebral | 18,924 | 3397 (18.0) |
| Age group | ||
| 55–59 years | 3474 | 548 (15.8) |
| 60–69 years | 7531 | 1420 (18.9) |
| 70–79 years | 6441 | 1234 (19.2) |
| 80–89 years | 7082 | 1267 (17.9) |
| 90 years | 579 | 88 (15.2) |
For patients with a previous fracture before the index fracture, treatment was assessed between the previous and index fracture; for patients without a previous fracture, treatment was assessed for any point between 2001 (the study period start) and the index fracture.
Cumulative incidence of subsequent fracture and mortality (imminent risk)
Cumulative incidence of each type of subsequent fracture at 12 and 24 months by index fracture type is shown in Fig. 3. Among patients with any type of index fracture, 2310 (6.6%) went on to have a subsequent fracture by 12 months, increasing to 3970 (11.3%) by 24 months. Cumulative incidence of any subsequent fracture at both 12 and 24 months was greatest in those with an index clinical vertebral fracture (n = 299 [10.7%] and n = 491 [17.6%], respectively), followed by an index hip fracture (n = 544 [7.6%] and n = 986 [13.7%], respectively). Among women with a vertebral fracture, a hip fracture was the most common subsequent fracture within both 12 and 24 months. Patients with index humerus fractures also had a high cumulative incidence of subsequent fracture (6.8% and 11.4%, at 12 and 24 months, respectively), often at the hip.
Figure 3.
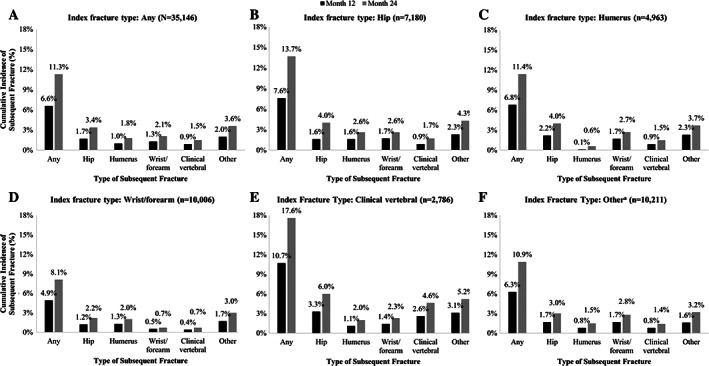
Cumulative incidence of any subsequent fracture at 12 and 24 months by index fracture type: A) any, B) hip, C) humerus, D) wrist/forearm, E) clinical vertebral, and F) othera. a”Other” does not include hip, humerus, wrist/forearm or clinical vertebral fractures.
Cumulative incidence of subsequent fracture within 12 and 24 months increased as a function of age (Table 3). The risk of suffering a subsequent fracture following an index fracture depended on both the type of index fracture and the age at which the index fracture was sustained. Among women aged 55 to 59 years, cumulative incidence of subsequent fracture within 12 months was greater in those with an index clinical vertebral fracture (8.0%) than other women in that age group with any other index fracture type. Within 24 months, cumulative incidence of subsequent fracture was highest in those with an index hip fracture (11.4%). In women aged 80 to 89 years, cumulative incidence of subsequent fracture was highest in those with an index clinical vertebral fracture within both 12 months (12.3%) and 24 months (20.6%).
Table 3.
Cumulative Incidence of Any Subsequent Fracture and Mortality by Index Fracture Type and Age Group at 12 and 24 Monthsa
| Cumulative incidence of any subsequent fracture % (95% CI) | Mortality % (95% CI) | ||||
|---|---|---|---|---|---|
| Index fracture type | n | 12 months | 24 months | 12 months | 24 months |
| Any | |||||
| 55–59 years | 3874 | 2.58 (2.12–3.12) | 5.19 (4.52–5.92) | 0.46 (0.29–0.74) | 0.88 (0.63–1.23) |
| 60–69 years | 9416 | 3.94 (3.56–4.35) | 6.65 (6.16–7.16) | 1.30 (1.09–1.55) | 2.18 (1.90–2.49) |
| 70–79 years | 8988 | 6.58 (6.08–7.10) | 11.46 (10.81–12.13) | 4.13 (3.74–4.56) | 7.61 (7.08–8.18) |
| 80–89 years | 11,833 | 9.55 (9.03–10.09) | 16.29 (15.63–16.96) | 14.44 (13.82–15.08) | 23.78 (23.03–24.56) |
| 90 years | 1035 | 11.42 (9.57–13.45) | 18.01 (15.73–20.41) | 24.88 (22.36–27.63) | 38.92 (36.02–41.96) |
| Hip | |||||
| 55–59 years | 132 | 3.79 (1.42–8.07) | 11.36 (6.67–17.43) | 3.79 (1.59–8.86) | 4.55 (2.07–9.84) |
| 60–69 years | 690 | 5.80 (4.22–7.71) | 11.01 (8.82–13.48) | 4.20 (2.94–5.99) | 6.96 (5.29–9.12) |
| 70–79 years | 1714 | 6.30 (5.22–7.52) | 11.84 (10.37–13.42) | 8.93 (7.67–10.38) | 15.81 (14.17–17.63) |
| 80–89 years | 4224 | 8.23 (7.43–9.09) | 14.71 (13.66–15.79) | 19.97 (18.80–21.21) | 29.98 (28.62–31.39) |
| 90 years | 420 | 10.29 (7.61–13.42) | 16.99 (13.56–20.74) | 31.58 (27.36–36.27) | 46.41 (41.77–51.31) |
| Humerus | |||||
| 55–59 years | 500 | 3.20 (1.91–5.02) | 6.80 (4.82–9.23) | 0.60 (0.19–1.85) | 1.60 (0.80–3.17) |
| 60–69 years | 1506 | 3.32 (2.50–4.31) | 6.18 (5.04–7.47) | 1.20 (0.75–1.89) | 2.06 (1.45–2.91) |
| 70–79 years | 1455 | 8.18 (6.84–9.66) | 12.78 (11.13–14.56) | 2.96 (2.20–3.96) | 5.77 (4.69–7.10) |
| 80–89 years | 1380 | 10.15 (8.63–11.82) | 16.39 (14.49–18.39) | 11.68 (10.09–13.49) | 19.22 (17.23–21.40) |
| 90 years | 122 | 10.66 (5.98–16.86) | 20.49 (13.86–28.04) | 21.31 (15.04–29.70) | 34.43 (26.74–43.58) |
| Wrist/forearm | |||||
| 55–59 years | 1684 | 1.48 (0.99–2.15) | 3.15 (2.39–4.06) | 0.12 (0.03–0.47) | 0.30 (0.12–0.71) |
| 60–69 years | 3647 | 3.15 (2.62–3.76) | 4.74 (4.09–5.47) | 0.25 (0.13–0.47) | 0.66 (0.44–0.98) |
| 70–79 years | 2567 | 5.41 (4.59–6.34) | 9.39 (8.30–10.56) | 1.17 (0.82–1.67) | 2.88 (2.30–3.61) |
| 80–89 years | 1985 | 9.82 (8.56–11.18) | 16.62 (15.02–18.30) | 6.60 (5.59–7.78) | 14.11 (12.65–15.72) |
| 90 years | 123 | 9.76 (5.33–15.77) | 13.82 (8.43–20.53) | 14.63 (9.48–22.22) | 26.02 (19.17–34.73) |
| Clinical vertebral | |||||
| 55–59 years | 137 | 8.03 (4.25–13.34) | 9.49 (5.32–15.10) | 2.19 (0.71–6.63) | 2.19 (0.71–6.63) |
| 60–69 years | 431 | 10.67 (7.98–13.80) | 14.39 (11.26–17.87) | 5.10 (3.39–7.65) | 7.19 (5.11–10.07) |
| 70–79 years | 806 | 8.19 (6.43–10.21) | 15.01 (12.65–17.57) | 7.20 (5.61–9.21) | 12.16 (10.09–14.62) |
| 80–89 years | 1304 | 12.27 (10.56–14.12) | 20.55 (18.40–22.79) | 13.11 (11.40–15.07) | 23.62 (21.41–26.02) |
| 90 years | 108 | 14.81 (8.89–22.16) | 25.00 (17.30–33.45) | 17.59 (11.60–26.18) | 31.48 (23.63–41.15) |
| Other | |||||
| 55–59 years | 1421 | 3.03 (2.23–4.01) | 6.05 (4.89–7.37) | 0.35 (0.15–0.84) | 0.84 (0.48–1.48) |
| 60–69 years | 3142 | 3.82 (3.19–4.53) | 7.07 (6.20–8.00) | 1.40 (1.04–1.88) | 2.26 (1.79–2.84) |
| 70–79 years | 2446 | 6.50 (5.57–7.52) | 11.41 (10.18–12.70) | 3.56 (2.89–4.37) | 6.42 (5.52–7.46) |
| 80–89 years | 2940 | 9.77 (8.73–10.87) | 16.40 (15.09–17.76) | 13.68 (12.49–14.97) | 23.65 (22.15–25.23) |
| 90 years | 262 | 12.98 (9.25–17.35) | 17.56 (13.23–22.40) | 23.66 (18.97–29.29) | 38.17 (32.59–44.34) |
Patients could experience more than one type of subsequent fracture and therefore could be counted in more than one category. CI = confidence interval.
The cumulative incidence of mortality was 11.8% (n = 4140) by 24 months, differed between index fracture types, and increased with age (Table 3). Women with index hip fractures had the highest cumulative mortality in nearly all age groups (up to 31.6% and 46.4%, at 12 and 24 months, respectively, for the oldest age group), except for those aged 60 to 69 years, in which cumulative incidence of mortality was highest for those with index clinical vertebral fractures (5.1% and 7.2%, at 12 and 24 months, respectively).
Discussion
Our study provides additional evidence for recognizing a recent fracture as a clinically important, addressable risk factor for a new fracture within 12 to 24 months, supporting the concept that women with a recent fracture are at imminent risk of another fracture. These data highlight the lack of awareness and missed opportunities for intervention, as shown by the low treatment rates among all fracture types and age groups. Approximately 70% of index fractures were MOFs, with wrist/forearm fractures being the most common overall, followed by hip, humerus, and clinical vertebral fractures. Despite the knowledge and acceptance of the increased risk and clinical impact of a MOF, the treatment gap demonstrated in this study is noteworthy.
In this study, almost one‐third of patients had experienced a previous fragility fracture, exceeding the range of 8.9% to 22.6% in six other European studies,18 and 7.7% had more than one previous fracture. The previous studies used modeled estimates, whereas this study used real‐world data assessing previous fractures over a long time period (12 years), suggesting that more patients presenting with an incident fracture may have already suffered at least one previously.18 Although women with a previous fracture were more likely to have received treatment than those without, treatment rates for both groups were still very low. Nearly three‐quarters of women with a previous fracture were not treated for osteoporosis between the previous and index fracture. This is unsurprising, given the 60% to 85% treatment gap that has been reported for women in Europe.5
Women with index hip fractures were least likely to have a history of osteoporosis treatment at any point before the index fracture, even though nearly two in five had a history of previous fracture. Patients with index hip fractures had the highest mortality rates within both 12 and 24 months in all age groups except those aged 60 to 69 years, echoing other literature demonstrating greater mortality risk following a hip fracture.19 This may be due to the severity of a hip fracture, but also because they primarily affect older patients who are inherently at greater risk of death. In younger women, the high mortality after hip fracture is likely an indicator of severely impaired health. Regardless, hip fractures incur substantial direct and indirect costs in Sweden, averaging €15,021 during the first year following a hip fracture, higher than that of all other fracture types.18 Given the low treatment rates in this group, particularly for patients with previous fractures, these data suggest that, by increasing the number of patients receiving timely and appropriate treatment, the societal and economic burden resulting from hip fractures could be reduced.
Each fragility fracture is followed by a period of imminent risk for subsequent fracture and, as shown in this study, that level of risk varies by type of index fracture. While refracture incidence appears higher for some types of subsequent fractures when preceded by certain types of index fractures (eg, humerus fractures most often being followed by hip fractures), these data were somewhat heterogenous, and an obvious pattern indicating a clear fracture cascade from one type of fracture to the next was not evident. However, subsequent clinical vertebral fractures at both 12 and 24 months were most often preceded by an index clinical vertebral fracture, supporting the idea of a vertebral fracture cascade.17, 20
Older patients were at higher risk of subsequent fracture and death following an index fracture, in line with predictive multivariate regression analyses reported elsewhere.13 Although average time between index and subsequent fracture type was not reported in this study, higher cumulative incidence of subsequent fracture is indicative of a shorter average time between index and subsequent fracture, suggesting that older patients are more likely to experience subsequent fractures, with less time between each fracture.
Patients aged 80 to 89 years made up the largest portion by age group of this study population. Subsequent fracture incidence in this group varied by index fracture type, with most subsequent fractures occurring after an index clinical vertebral fracture and the fewest occurring after an index hip fracture. These results suggest that, in addition to other factors such as age/expected lifespan and general health, a patient's level of mobility following an index fracture may also impact subsequent fracture risk. For example, patients experiencing a hip fracture will have reduced mobility during the period following the fracture, reducing opportunities for subsequent fracture (specifically within the first 12 months).21 Therefore, fracture prevention resources also need to be utilized to target appropriate patients before they experience a fracture.
Strengths and limitations
This study included a large sample of patients from robust, complete registries. All inpatient and outpatient visits associated with fractures occurring in Sweden for a relatively long, 15‐year period were included in the analysis, and a wide variety of major and minor fracture types were included, both of which enhanced the accuracy of fracture counts. However, the study had several limitations. Because data were drawn from real‐world databases, fragility fractures could not be validated; fractures typically associated with osteoporosis were included. There was a risk of some fractures being counted twice if the patient presented in the hospital with complications related to the original fracture more than 6 months after the index fracture; however, this is a standard application and the prespecified rules around fracture complications, re‐diagnosis, and follow‐up visits used to define incident fractures diminished the impact of this possibility.
In this study, 8% of women aged 55 to 90 years presented with a vertebral fracture, lower than that reported by Hernlund and colleagues18 (15%). Hernlund and colleagues18 used statistical methods to estimate the number of morphometric vertebral fractures, whereas this study only counted vertebral fractures that presented clinically and were ICD‐coded. Clinical vertebral fractures represent only a subset of vertebral fractures that develop in patients. It is estimated that around 23% to 42% of vertebral fractures present clinically. Although attempting to provide a better estimate of subsequent fracture risk in this population is not possible because of the uncertainty in these estimates, it can be concluded that the risk seen here is certainly underestimated.18, 22, 23, 24, 25 The descriptive patterns described in this study do not indicate whether a certain index fracture type will lead to a specific subsequent fracture; additional multivariate analyses are required to further understand independent predictors. Finally, the definition of osteoporosis treatment in this study did not include calcium or vitamin D, which some patients may have been using as a preventive mechanism instead of other medications.
Conclusion
The burden of fragility fractures in Swedish women 55 years and older is high, with the majority of patients presenting with MOFs. Following a first fragility fracture, patients are at a significant risk of experiencing subsequent fractures, particularly in the 2 years after the fracture. Regardless of the type or number of prior fractures, treatment rates with drugs known to reduce fracture risk are distressingly low. Healthcare systems need to rapidly and efficiently integrate robust secondary fracture prevention pathways to ensure fewer patients miss treatment opportunities and therefore reduce the occurrence of subsequent fractures. Furthermore, by contextualizing the fracture type and age of a given patient, providers can most effectively utilize available resources and tailor treatments.
Disclosures
ET and CL: employed by and stockholders of UCB Pharma; JB and GO: employed by Quantify Research and funded by UCB Pharma and Amgen Inc. to conduct this study; KA: received lecture fees from Amgen Inc., Eli Lilly, Merck, and UCB Pharma; AS: received lecture fees from Amgen Inc., Eli Lilly, and Mylan.
Supporting information
Supplementary Table 1.. ICD‐10 codes used to identify fragility fractures in the study population.
Supplementary Table 2. Drug products and corresponding ATC codes used to define exposure to osteoporosis treatment.
Acknowledgments
This study was sponsored by UCB Pharma and Amgen Inc. Support for third‐party writing assistance for this article, provided by Kristian Clausen, MPH, and Simon Foulcer, PhD, Costello Medical, UK, was funded by UCB Pharma and Amgen Inc. in accordance with Good Publication Practice (GPP3) guidelines (http://www.ismpp.org/gpp3). We thank the patients, investigators, and their teams who took part in this study. We also acknowledge Helen Chambers, PhD, Costello Medical, UK, for publication coordination and Kristian Clausen, MPH, and Simon Foulcer, PhD from Costello Medical, UK, for medical writing and editorial assistance based on the authors' input and direction. This study was funded by UCB Pharma and Amgen Inc.
Authors' roles: Substantial contributions to study conception and design: ET, JB, KA, AS, GO, and CL; substantial contributions to analysis and interpretation of the data: ET, JB, KA, AS, GO, and CL; drafting the article or revising it critically for important intellectual content: ET, JB, KA, AS, GO, and CL; final approval of the version of the article to be published: ET, JB, KA, AS, GO, and CL.
The peer review history for this article is available at https://publons.com/publon/10.1002/jbmr.3953.
References
- 1. Johnell O, Kanis JA. An estimate of the worldwide prevalence and disability associated with osteoporotic fractures. Osteoporos Int. 2006;17(12):1726–33. [DOI] [PubMed] [Google Scholar]
- 2. Svedbom A, Hernlund E, Ivergard M, et al. Osteoporosis in the European Union: a compendium of country‐specific reports. Arch Osteoporos. 2013;8(1–2):137. [DOI] [PMC free article] [PubMed] [Google Scholar]
- 3. Kerr C, Bottomley C, Shingler S, et al. The importance of physical function to people with osteoporosis. Osteoporos Int. 2017;28(5):1597–607. [DOI] [PMC free article] [PubMed] [Google Scholar]
- 4. Silverman SL, Minshall ME, Shen W, Harper KD, Xie S. The relationship of health‐related quality of life to prevalent and incident vertebral fractures in postmenopausal women with osteoporosis: results from the Multiple Outcomes of Raloxifene Evaluation Study. Arthritis Rheum. 2001;44(11):2611–9. [DOI] [PubMed] [Google Scholar]
- 5.International Osteoporosis Foundation (IOF). Broken bones, broken lives: a roadmap to solve the fragility fracture crisis in Europe [Internet]. Nyon, Switzerland: IOF; 2018 [cited 2020 Jan 14]. Available from: https://www.iofbonehealth.org/broken-bones-broken-lives.
- 6. Aspray TJ. Fragility fracture: recent developments in risk assessment. Ther Adv Musculoskelet Dis. 2015;7(1):17–25. [DOI] [PMC free article] [PubMed] [Google Scholar]
- 7. Ensrud KE. Epidemiology of fracture risk with advancing age. J Gerontol A Biol Sci Med Sci. 2013;68(10):1236–42. [DOI] [PubMed] [Google Scholar]
- 8. McLellan AR, Reid DM, Forbes K, et al. . Effectiveness of strategies for the secondary prevention of osteoporotic fractures in Scotland (CEPS 99/03). Glasgow, Scotland: NHS Quality Improvement Scotland; 2004. [Google Scholar]
- 9. Åkesson K, Mitchell P. Capture the fracture: a global campaign to break the fragility fracture cycle [Internet]. Nyon, Switzerland: International Osteoporosis Foundation (IOF); 2012 [cited 2020 Jan 14]. Available from: http://share.iofbonehealth.org/WOD/2012/report/WOD12-Report.pdf. [DOI] [PMC free article] [PubMed]
- 10. Johansson H, Siggeirsdottir K, Harvey NC, et al. Imminent risk of fracture after fracture. Osteoporos Int. 2017;28(3):775–80. [DOI] [PMC free article] [PubMed] [Google Scholar]
- 11. van Geel TA, van Helden S, Geusens PP, Winkens B, Dinant GJ. Clinical subsequent fractures cluster in time after first fractures. Ann Rheum Dis. 2009;68(1):99–102. [DOI] [PubMed] [Google Scholar]
- 12. van Helden S, Cals J, Kessels F, Brink P, Dinant GJ, Geusens P. Risk of new clinical fractures within 2 years following a fracture. Osteoporos Int. 2006;17(3):348–54. [DOI] [PubMed] [Google Scholar]
- 13. Banefelt J, Åkesson KE, Spångéus A, et al. Risk of imminent fracture following a previous fracture in a Swedish database study. Osteoporos Int. 2019;30(3):601–9. [DOI] [PMC free article] [PubMed] [Google Scholar]
- 14. Balasubramanian A, Zhang J, Chen L, et al. Risk of subsequent fracture after prior fracture among older women. Osteoporos Int. 2019;30(1):79–92. [DOI] [PMC free article] [PubMed] [Google Scholar]
- 15. Kanis JA, Johnell O. The burden of osteoporosis. J Endocrinol Invest. 1999;22(8):583–8. [DOI] [PubMed] [Google Scholar]
- 16. Melton LJ 3rd, Amin S. Is there a specific fracture 'cascade'? Bonekey Rep. 2013;2:367. [DOI] [PMC free article] [PubMed] [Google Scholar]
- 17. Lindsay R, Pack S, Li Z. Longitudinal progression of fracture prevalence through a population of postmenopausal women with osteoporosis. Osteoporos Int. 2005;16(3):306–12. [DOI] [PubMed] [Google Scholar]
- 18. Hernlund E, Svedbom A, Ivergard M, et al. Osteoporosis in the European Union: medical management, epidemiology and economic burden. A report prepared in collaboration with the International Osteoporosis Foundation (IOF) and the European Federation of Pharmaceutical Industry Associations (EFPIA). Arch Osteoporos. 2013;8:136. [DOI] [PMC free article] [PubMed] [Google Scholar]
- 19. von Friesendorff M, McGuigan FE, Wizert A, et al. Hip fracture, mortality risk, and cause of death over two decades. Osteoporos Int. 2016;27(10):2945–53. [DOI] [PubMed] [Google Scholar]
- 20. Klotzbuecher CM, Ross PD, Landsman PB, Abbott TA 3rd, Berger M. Patients with prior fractures have an increased risk of future fractures: a summary of the literature and statistical synthesis. J Bone Miner Res. 2000;15(4):721–39. [DOI] [PubMed] [Google Scholar]
- 21. Dyer SM, Crotty M, Fairhall N, et al. A critical review of the long‐term disability outcomes following hip fracture. BMC Geriatr. 2016;16(1):158. [DOI] [PMC free article] [PubMed] [Google Scholar]
- 22. Cooper C, O'Neill T, Silman A. The epidemiology of vertebral fractures. European Vertebral Osteoporosis Study Group. Bone. 1993;14(Suppl 1):S89–97. [DOI] [PubMed] [Google Scholar]
- 23. Fink HA, Milavetz DL, Palermo L, et al. What proportion of incident radiographic vertebral deformities is clinically diagnosed and vice versa? J Bone Miner Res. 2005;20(7):1216–22. [DOI] [PubMed] [Google Scholar]
- 24. Kanis JA, Johnell O, Oden A, et al. The risk and burden of vertebral fractures in Sweden. Osteoporos Int. 2004;15(1):20–6. [DOI] [PubMed] [Google Scholar]
- 25. Lindsay R, Silverman SL, Cooper C, et al. Risk of new vertebral fracture in the year following a fracture. JAMA. 2001;285(3):320–3. [DOI] [PubMed] [Google Scholar]
Associated Data
This section collects any data citations, data availability statements, or supplementary materials included in this article.
Supplementary Materials
Supplementary Table 1.. ICD‐10 codes used to identify fragility fractures in the study population.
Supplementary Table 2. Drug products and corresponding ATC codes used to define exposure to osteoporosis treatment.