

ABSTRACT
In the oligotrophic oceans, key autotrophs depend on “helper” bacteria to reduce oxidative stress from hydrogen peroxide (H2O2) in the extracellular environment. H2O2 is also a ubiquitous stressor in freshwaters, but the effects of H2O2 on autotrophs and their interactions with bacteria are less well understood in freshwaters. Naturally occurring H2O2 in freshwater systems is proposed to impact the proportion of microcystin-producing (toxic) and non-microcystin-producing (nontoxic) Microcystis in blooms, which influences toxin concentrations and human health impacts. However, how different strains of Microcystis respond to naturally occurring H2O2 concentrations and the microbes responsible for H2O2 decomposition in freshwater cyanobacterial blooms are unknown. To address these knowledge gaps, we used metagenomics and metatranscriptomics to track the presence and expression of genes for H2O2 decomposition by microbes during a cyanobacterial bloom in western Lake Erie in the summer of 2014. katG encodes the key enzyme for decomposing extracellular H2O2 but was absent in most Microcystis cells. katG transcript relative abundance was dominated by heterotrophic bacteria. In axenic Microcystis cultures, an H2O2 scavenger (pyruvate) significantly improved growth rates of one toxic strain while other toxic and nontoxic strains were unaffected. These results indicate that heterotrophic bacteria play a key role in H2O2 decomposition in Microcystis blooms and suggest that their activity may affect the fitness of some Microcystis strains and thus the strain composition of Microcystis blooms but not along a toxic versus nontoxic dichotomy.
IMPORTANCE Cyanobacterial harmful algal blooms (CHABs) threaten freshwater ecosystems globally through the production of toxins. Toxin production by cyanobacterial species and strains during CHABs varies widely over time and space, but the ecological drivers of the succession of toxin-producing species remain unclear. Hydrogen peroxide (H2O2) is ubiquitous in natural waters, inhibits microbial growth, and may determine the relative proportions of Microcystis strains during blooms. However, the mechanisms and organismal interactions involved in H2O2 decomposition are unexplored in CHABs. This study shows that some strains of bloom-forming freshwater cyanobacteria benefit from detoxification of H2O2 by associated heterotrophic bacteria, which may impact bloom development.
KEYWORDS: CHABs, Microcystis, catalase, hydrogen peroxide, metagenomics, metatranscriptomics, peroxidase
INTRODUCTION
Interactions between microorganisms are pervasive in aquatic ecosystems, with potentially far-reaching implications for system productivity, the cycling of nutrients, and the toxin production of harmful algal blooms (1). The importance of interactions between microorganisms is illustrated by the detoxification of hydrogen peroxide (H2O2). H2O2 is a ubiquitous oxidative stressor on microorganisms in natural waters (2–4) that can shape microbial community composition and function (5–7). In oligotrophic marine environments, dominant primary producers such as Prochlorococcus, heterotrophs such as Pelagibacter (SAR11), and nitrifiers such as ammonia-oxidizing Thaumarchaeota lack enzymatic defense against H2O2 and cannot grow in the presence of H2O2 concentrations typical of natural waters (concentrations between 200 nM and ~1 μM) unless associated with organisms that produce catalases to detoxify the H2O2 (7–12). Because H2O2 rapidly diffuses across membranes (13), decomposition of H2O2 by catalase and peroxidase enzymes produced by these heterotrophic “helpers” reduces environmental H2O2 concentrations to tolerable levels and provides community-wide protection to the sensitive “beneficiaries” (8, 10–12, 14). As long as some “helper” bacteria scavenge H2O2 and maintain low environmental H2O2 levels, adaptive loss of catalase genes in other microbes may proceed and allow for the conservation of resources in the nutrient-scarce open ocean (6, 14).
In eutrophic systems, H2O2 has been implicated as a potential factor influencing the toxin concentrations of cyanobacterial harmful algal blooms (CHABs) (15), which are a growing worldwide threat to freshwater ecosystems and associated ecosystem services, including drinking water supplies (16–18). Globally, freshwater CHABs are often dominated by Microcystis spp. that can produce microcystins, which are a class of potent liver toxins (19). Microcystins have been shown to increase the resistance of Microcystis to H2O2 by binding and protecting proteins from oxidative damage (20), leading to the hypothesis that transiently high concentrations of H2O2 in the water column may favor microcystin-producing (“toxic”) strains of Microcystis over non-microcystin-producing (“nontoxic”) strains (15). Through photochemical reduction of O2 by chromophoric dissolved organic matter and aerobic microbial metabolisms, H2O2 often reaches concentrations in freshwaters (21–23) that can have negative effects on cyanobacterial growth (9, 10, 20, 24). The highest concentrations of H2O2 in Lake Erie CHABs precede bloom phases with high microcystin concentrations (25, 26), supporting the idea that high H2O2 concentrations favor the proliferation of toxic Microcystis strains. Some laboratory experiments in cell culture also support this hypothesis by showing that H2O2 disproportionately inhibits the growth of nontoxic Microcystis strains (27). However, a more recent study suggested the opposite, that microcystin interferes with H2O2 decomposition in Microcystis and H2O2 disproportionately inhibits growth of toxic Microcystis (28).
These contrasting conclusions on the impact of H2O2 on the physiology and abundance of Microcystis strains may be due to differences in H2O2 exposure of the cells between lab experiments or in the lab and field. For example, laboratory studies of Microcystis cell cultures generally have not measured natural H2O2 production in the growth medium (20, 27) from autoclaving (29) or irradiation (30) of medium components. Without such H2O2 quantification, the total H2O2 exposure is unknown, and thus the effect of H2O2 on the growth of Microcystis strains remains uncertain. In addition, most studies to date have measured the response of Microcystis to single, large doses of H2O2 that exceed natural concentrations by 3 to 6 orders of magnitude but are typical for doses of H2O2 used to control CHABs (28, 31–37). Thus, the responses of different Microcystis strains to naturally occurring H2O2 concentrations are unknown.
Despite the hypothesized role of H2O2 in influencing Microcystis population dynamics, the microbes responsible for H2O2 decomposition in eutrophic systems or during CHABs have not been studied. The distribution of catalase and peroxidase genes in Microcystis mirrors that of H2O2-sensitive Prochlorococcus and ammonia-oxidizing archaea in that Microcystis lacks catalases and heme peroxidases but has multiple peroxiredoxin genes, suggesting that it may benefit from decomposition of natural H2O2 by other community members (35, 38). Such interactions could potentially improve the fitness of Microcystis strains that are more sensitive to H2O2, thus influencing the relative proportions of Microcystis strains in the environment and, by extension, microcystin concentrations during blooms. Indeed, co-culture with other microorganisms can prevent high doses of H2O2 that are used for lake treatments from inhibiting Microcystis growth (35, 39). However, there are currently no data showing the impacts of community-wide H2O2 detoxification on Microcystis growth at naturally occurring H2O2 concentrations.
Here, we address these questions: (i) What is the impact of naturally occurring H2O2 on the growth of various toxic and nontoxic Microcystis strains? (ii) Which genes encoding proteins that detoxify H2O2 are expressed in Microcystis bloom communities? (iii) Which community members express H2O2 detoxification genes? We analyzed the relative abundance of genes and transcripts encoding enzymes that are responsible for H2O2 decay in aquatic ecosystems (catalases and peroxidases) (40, 41) during the 2014 western Lake Erie Microcystis bloom, which led to a drinking water ban for the city of Toledo, OH (42). Our results show that while catalase transcripts are dominated by heterotrophic bacteria, only some cultured Microcystis strains benefit from an H2O2 scavenger, and the benefit was unrelated to the potential of the strain to synthesize microcystins. The results of this study suggest that the impact of catalase activity from heterotrophic bacteria on Microcystis growth varies between strains and thus may impact in situ Microcystis strain and species composition but not along a toxic versus nontoxic dichotomy.
RESULTS
Dynamics in pigments, microcystin concentrations, and H2O2 in western Lake Erie.
The temporal trends in particulate microcystins and phycocyanin concentrations show that a large toxic Microcystis bloom in August was followed by a large nontoxic Microcystis bloom in the nearshore stations, while the offshore site was impacted only by the toxic Microcystis bloom in August (Fig. 1) (as previously reported in the work of Cory et al. [26] and Berry et al. [43]). Changes in concentrations of pigments and microcystin concentrations at three stations (two nearshore and one offshore [see Fig. S1 in the supplemental material]) during the 2014 western Lake Erie CHAB show that the cyanobacterial bloom more heavily impacted nearshore stations (WE2 and WE12) than the offshore station (WE4). Phycocyanin (a pigment found in cyanobacteria) and chlorophyll a concentrations were highly correlated at all stations, confirming that the blooms were dominated by cyanobacteria (43).
FIG 1.

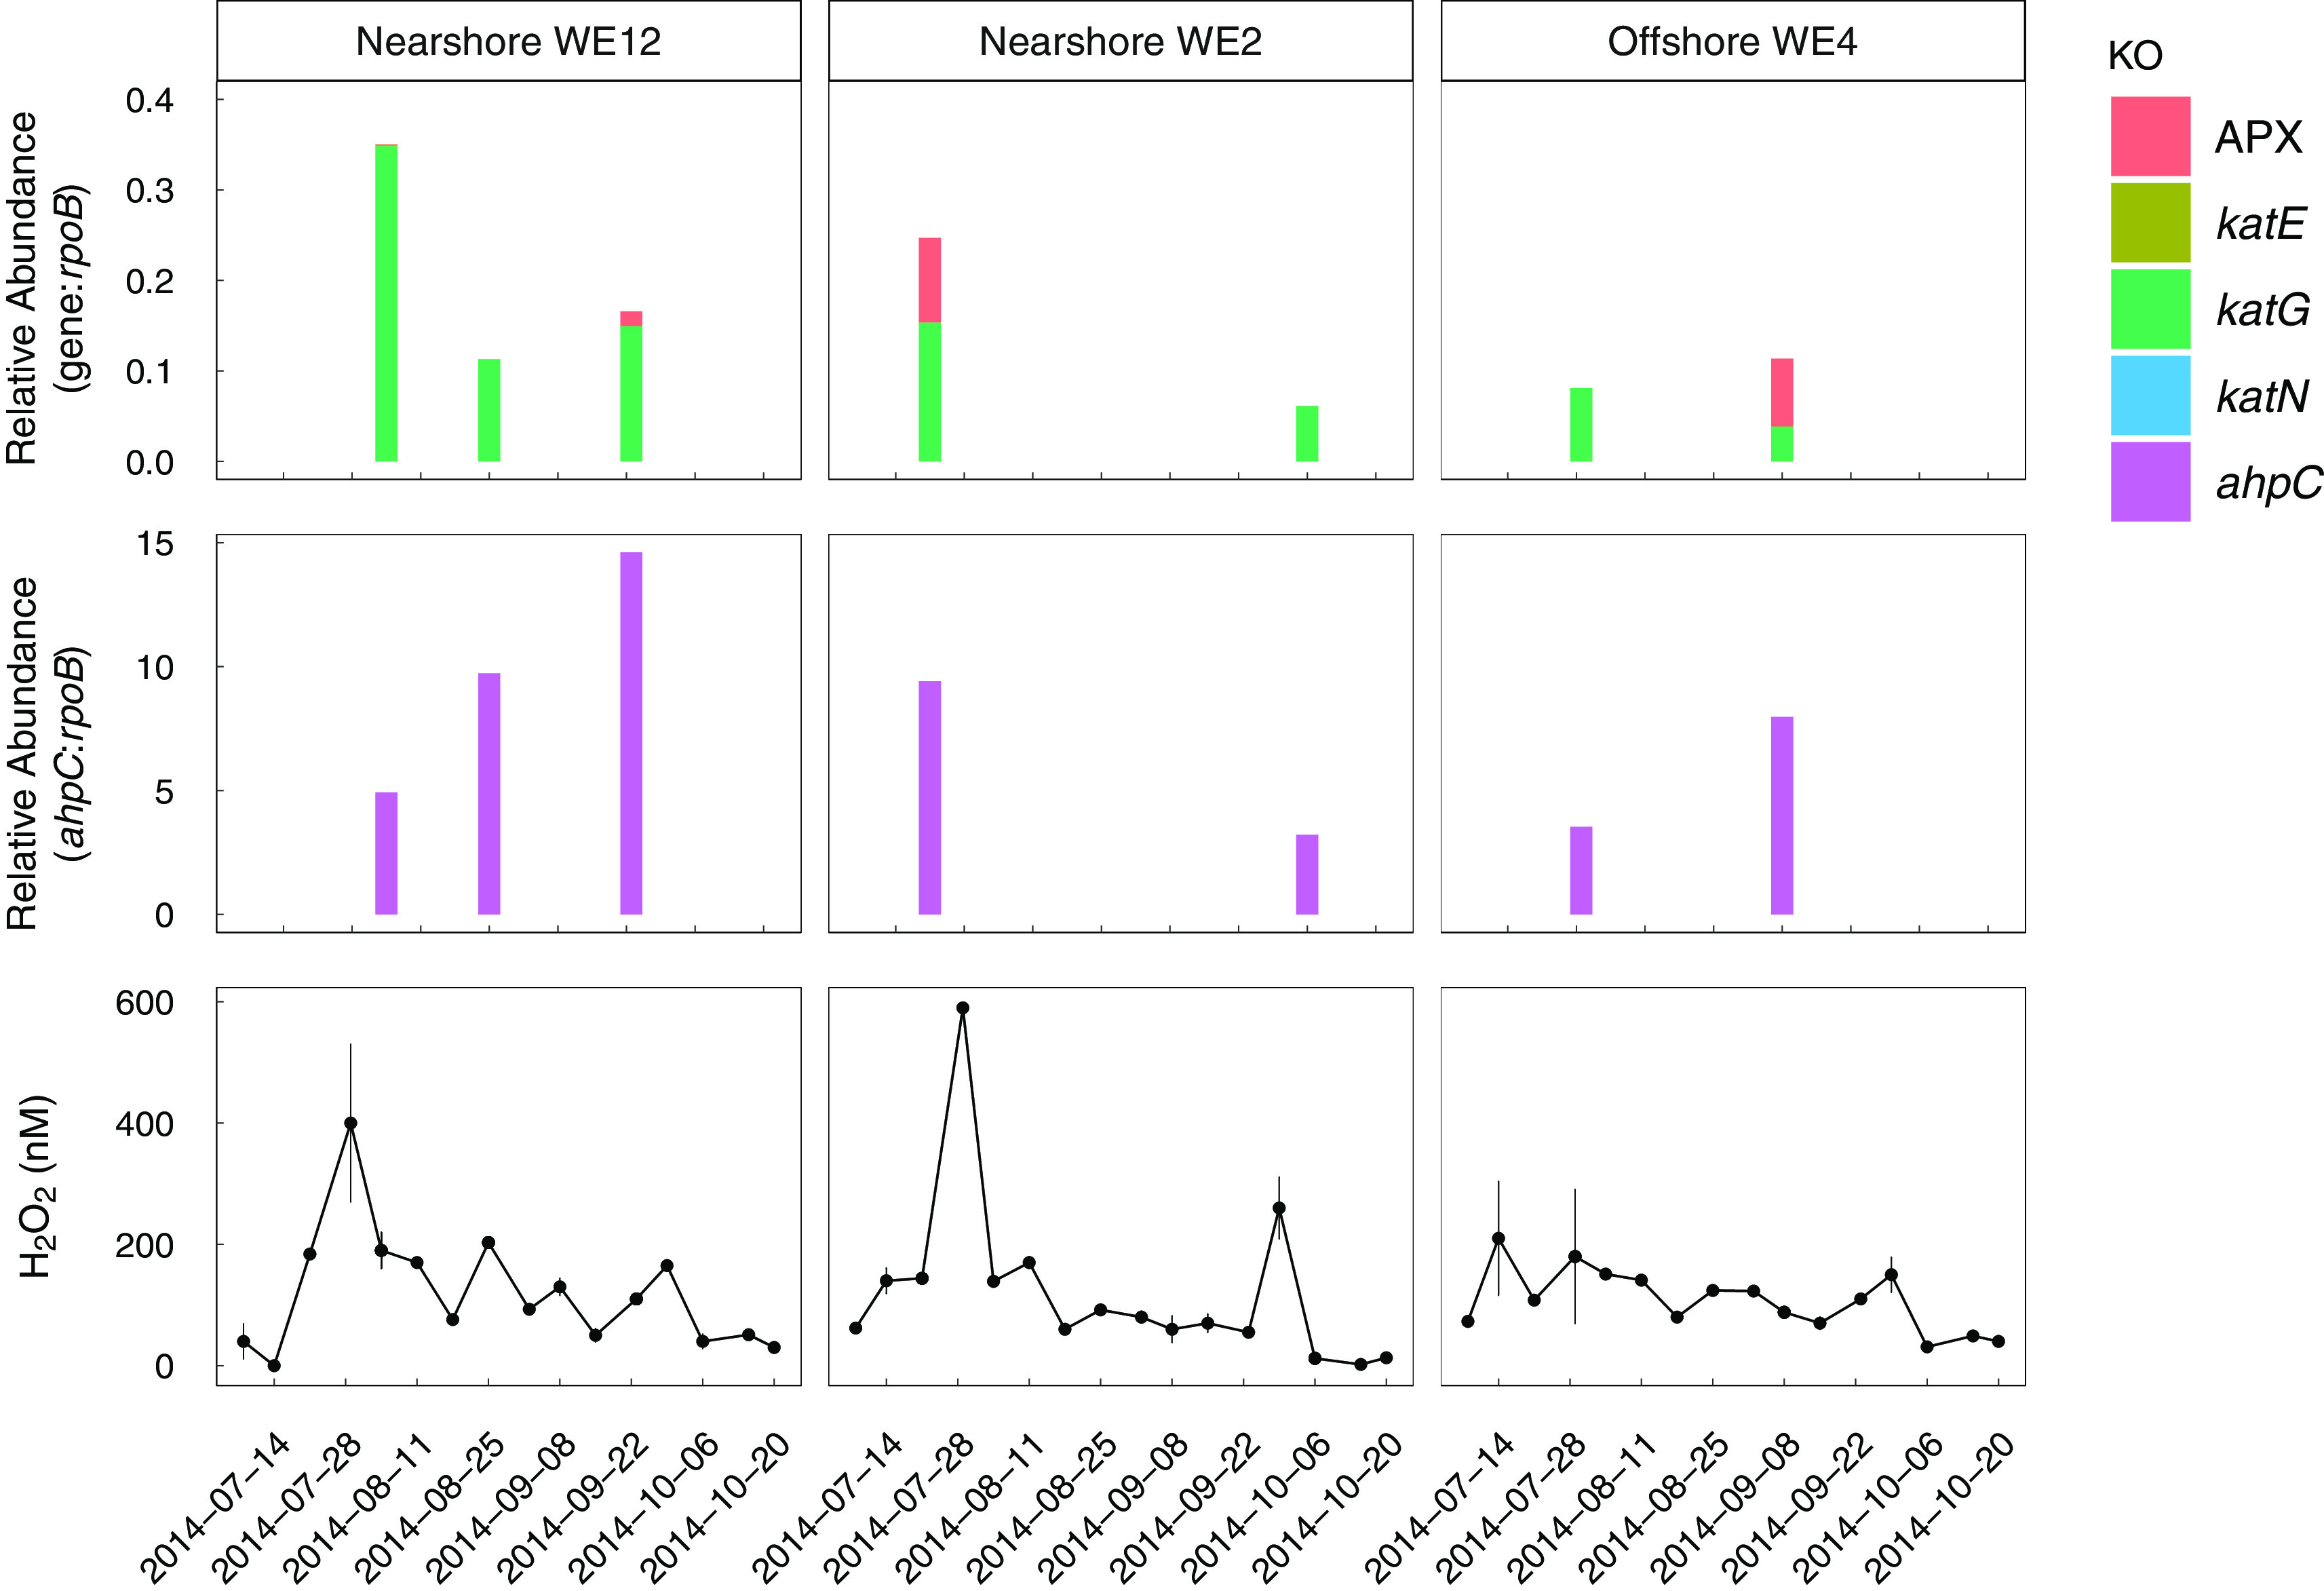
Temporal and spatial trends in the relative abundance of catalase and peroxidase genes in the 2014 western Lake Erie cyanobacterial bloom metagenomes are not correlated with concentrations of phycocyanin, particular microcystins, or H2O2. Genes with KEGG orthology (KO) annotations for catalase-peroxidase (katG) and alkyl hydroperoxide reductase subunit C (ahpC) had the highest relative abundances. The relative abundance of catalase and peroxidase genes shown is the total of all genes with the specified KEGG orthology ID in metagenomes from the >100-μm particle size fraction at each station. Read counts are normalized to the length of the matching gene in the database and to the number of reads that mapped to bacterial rpoB, encoding the beta subunit of RNA polymerases. Error bars on H2O2 concentrations show the standard error of technical replicate measurements (n = 3).
Concentrations of particulate microcystins correlated with phycocyanin concentrations in July through early August, with the highest microcystin concentrations occurring at the nearshore stations in early August (Fig. 1). Microcystin concentrations decreased substantially starting in mid-August and remained low, despite high cyanobacterial biomass and Microcystis relative abundance (43).
H2O2 ranged from 20 ± 36 to 590 ± 4 nM (standard error [SE] for technical replicates) in the surface waters of Lake Erie over the course of the bloom (25, 26). The highest concentrations of H2O2 were observed at each nearshore station in late July, 1 to 2 weeks prior to peaks in the concentrations of both microcystins and pigments. At nearshore station WE2, a smaller second peak in H2O2 (260 ± 51 nM) coincided with the smaller, second peak in microcystin concentrations in September. Peaks in H2O2 concentrations at offshore station WE4 were lower than those nearshore, reaching a maximum of 210 ± 94 nM (Fig. 1).
Catalase and peroxidase gene and transcript relative abundance.
The relative abundances of the following genes were quantified in western Lake Erie metagenomes and metatranscriptomes: monofunctional heme catalase (katE), catalase-peroxidase (katG), manganese catalase (katN), cytochrome c peroxidase (ccpA), ascorbate peroxidase (APX), and alkyl hydroperoxide reductase subunit C (ahpC) (see Materials and Methods). These genes were targeted because there is biochemical evidence supporting that they scavenge H2O2 as a defense against H2O2 toxicity (44) or use H2O2 as a terminal electron acceptor, as in the case of ccpA (45). However, the cytochrome c peroxidases share many structural similarities with the methylamine-utilization protein mauG, and many of the genes identified as ccpA matched equally well with mauG genes in NCBI and paperBLAST (46). Therefore, the role of the genes identified as ccpA in H2O2 decomposition is uncertain, and we report their abundances separately in Fig. S2 as ccpA-mauG. We targeted APX because it can be abundant in marine metatranscriptomes (47). Of the proteins encoded by these genes, the periplasmic KatG has the primary function to decompose extracellular H2O2 while the primary role of the cytoplasmic AhpC is to decompose intracellularly produced H2O2 and organic peroxides (13, 48–51). However, in some bacterial taxa, both KatG and AhpC can compensate for the loss of the other under certain physiological conditions (49–51).
Previous studies have suggested that plankton biomass captured in the >100-μm particle size fraction is responsible for most of the microcystin production and contains 93 to 99% of the total Microcystis biomass during Microcystis blooms (52, 53). This particle size fraction is enriched in Microcystis and excludes microbes not physically attached to large Microcystis colonies and other particles >100 μm in diameter. In contrast, whole water samples (filtered onto a 0.22-μm filter) contain all microbes present in the water column and thus represent the “total community.”
Genes encoding the catalase-peroxidase KatG and the peroxiredoxin AhpC had the highest abundance relative to the beta-subunit of bacterial RNA polymerase (rpoB) in western Lake Erie metagenomes (Fig. 1). katG was equally abundant in both the Microcystis-enriched and total community size fractions, while ahpC had a higher relative abundance in the Microcystis-enriched fraction than in the total community in most cases (Fig. 1). Neither katG nor ahpC gene relative abundances were significantly correlated with microcystins, pigment, or H2O2 concentrations in the lake (P > 0.05, F-test).
To focus on Microcystis and physically-associated bacteria, metatranscriptomes were obtained from the Microcystis-enriched fraction. ahpC transcripts had the highest abundance relative to rpoB, followed by katG (Fig. 2). Transcripts encoding KatE were infrequently present and at low relative abundance, perhaps due to the low relative abundance of katE genes. Transcripts encoding CcpA-MauG were present at low relative abundance with no apparent patterns with any bloom parameters, except for one sample collected on 23 September at WE12, where the abundance of ccpA-mauG relative to bacterial rpoB was comparable to katG relative abundance (Fig. S2). No transcripts for KatN-encoding genes were found in the metatranscriptomes (Fig. 2). APX transcripts were rare (<0.01 relative to bacterial rpoB) or absent in most samples. No significant correlations were observed between the relative abundance of ahpC or katG transcripts and H2O2, phycocyanin, or chlorophyll a concentrations throughout the field season (P > 0.05, F-test).
FIG 2.
Temporal and spatial trends in the relative abundance of total katG and ahpC transcripts in particle- and phytoplankton-attached microbial communities show qualitative patterns with H2O2 concentration. The relative abundance of catalase and peroxidase genes shown is the total of all genes with the specified KEGG orthology (KO) ID in metatranscriptomes from the >100-μm particle size fraction at each station. Read counts are normalized to the length of the matching gene in the database and to the number of reads that mapped to bacterial rpoB, encoding the beta subunit of RNA polymerases. Relative abundance of ahpC is shown separately in the middle panel because it was 2 orders of magnitude higher than the combined total of the other genes. Error bars on H2O2 concentrations show the standard error of technical replicate measurements (n = 3).
Taxonomy of metagenome-assembled genomes that have and express katG.
The taxonomy of metagenome-assembled genomes (MAGs; see supplemental files 1 and 2 for MAG metadata) that contained catalase and peroxidase genes were identified to ascertain which organisms were responsible for H2O2 decomposition in the 2014 western Lake Erie cyanobacterial bloom (Table S1). In all metagenomes of the Microcystis-enriched fraction, reads from diverse groups of bacteria contributed substantially to the total katG read abundance (Fig. 3). Of the genes that could be assigned a taxonomy in the Microcystis-enriched fraction, katG from Microcystis, Phenylobacterium (Alphaproteobacteria), Burkholderiaceae bin 53603 E6 (Betaproteobacteria), Rhodobacteraceae bin 49625 E6 (Alphaproteobacteria), and Flammeovirgaceae bins 42896 C11 and 42896 E20 (Bacteroidetes) were most abundant in the Microcystis-enriched fraction (Fig. 3). Microcystis katG comprised 0 to 4.71% (mean 1.0% ± 1.4%, standard deviation) of the total katG reads in the Microcystis-enriched metagenomes (Fig. 3). katG was also detected in Cyanobium-Synechococcus group MAGs, an abundant cyanobacterial group in the bloom (43), but Cyanobium-Synechococcus group katG was only occasionally present at low relative abundance (Fig. 3).
FIG 3.
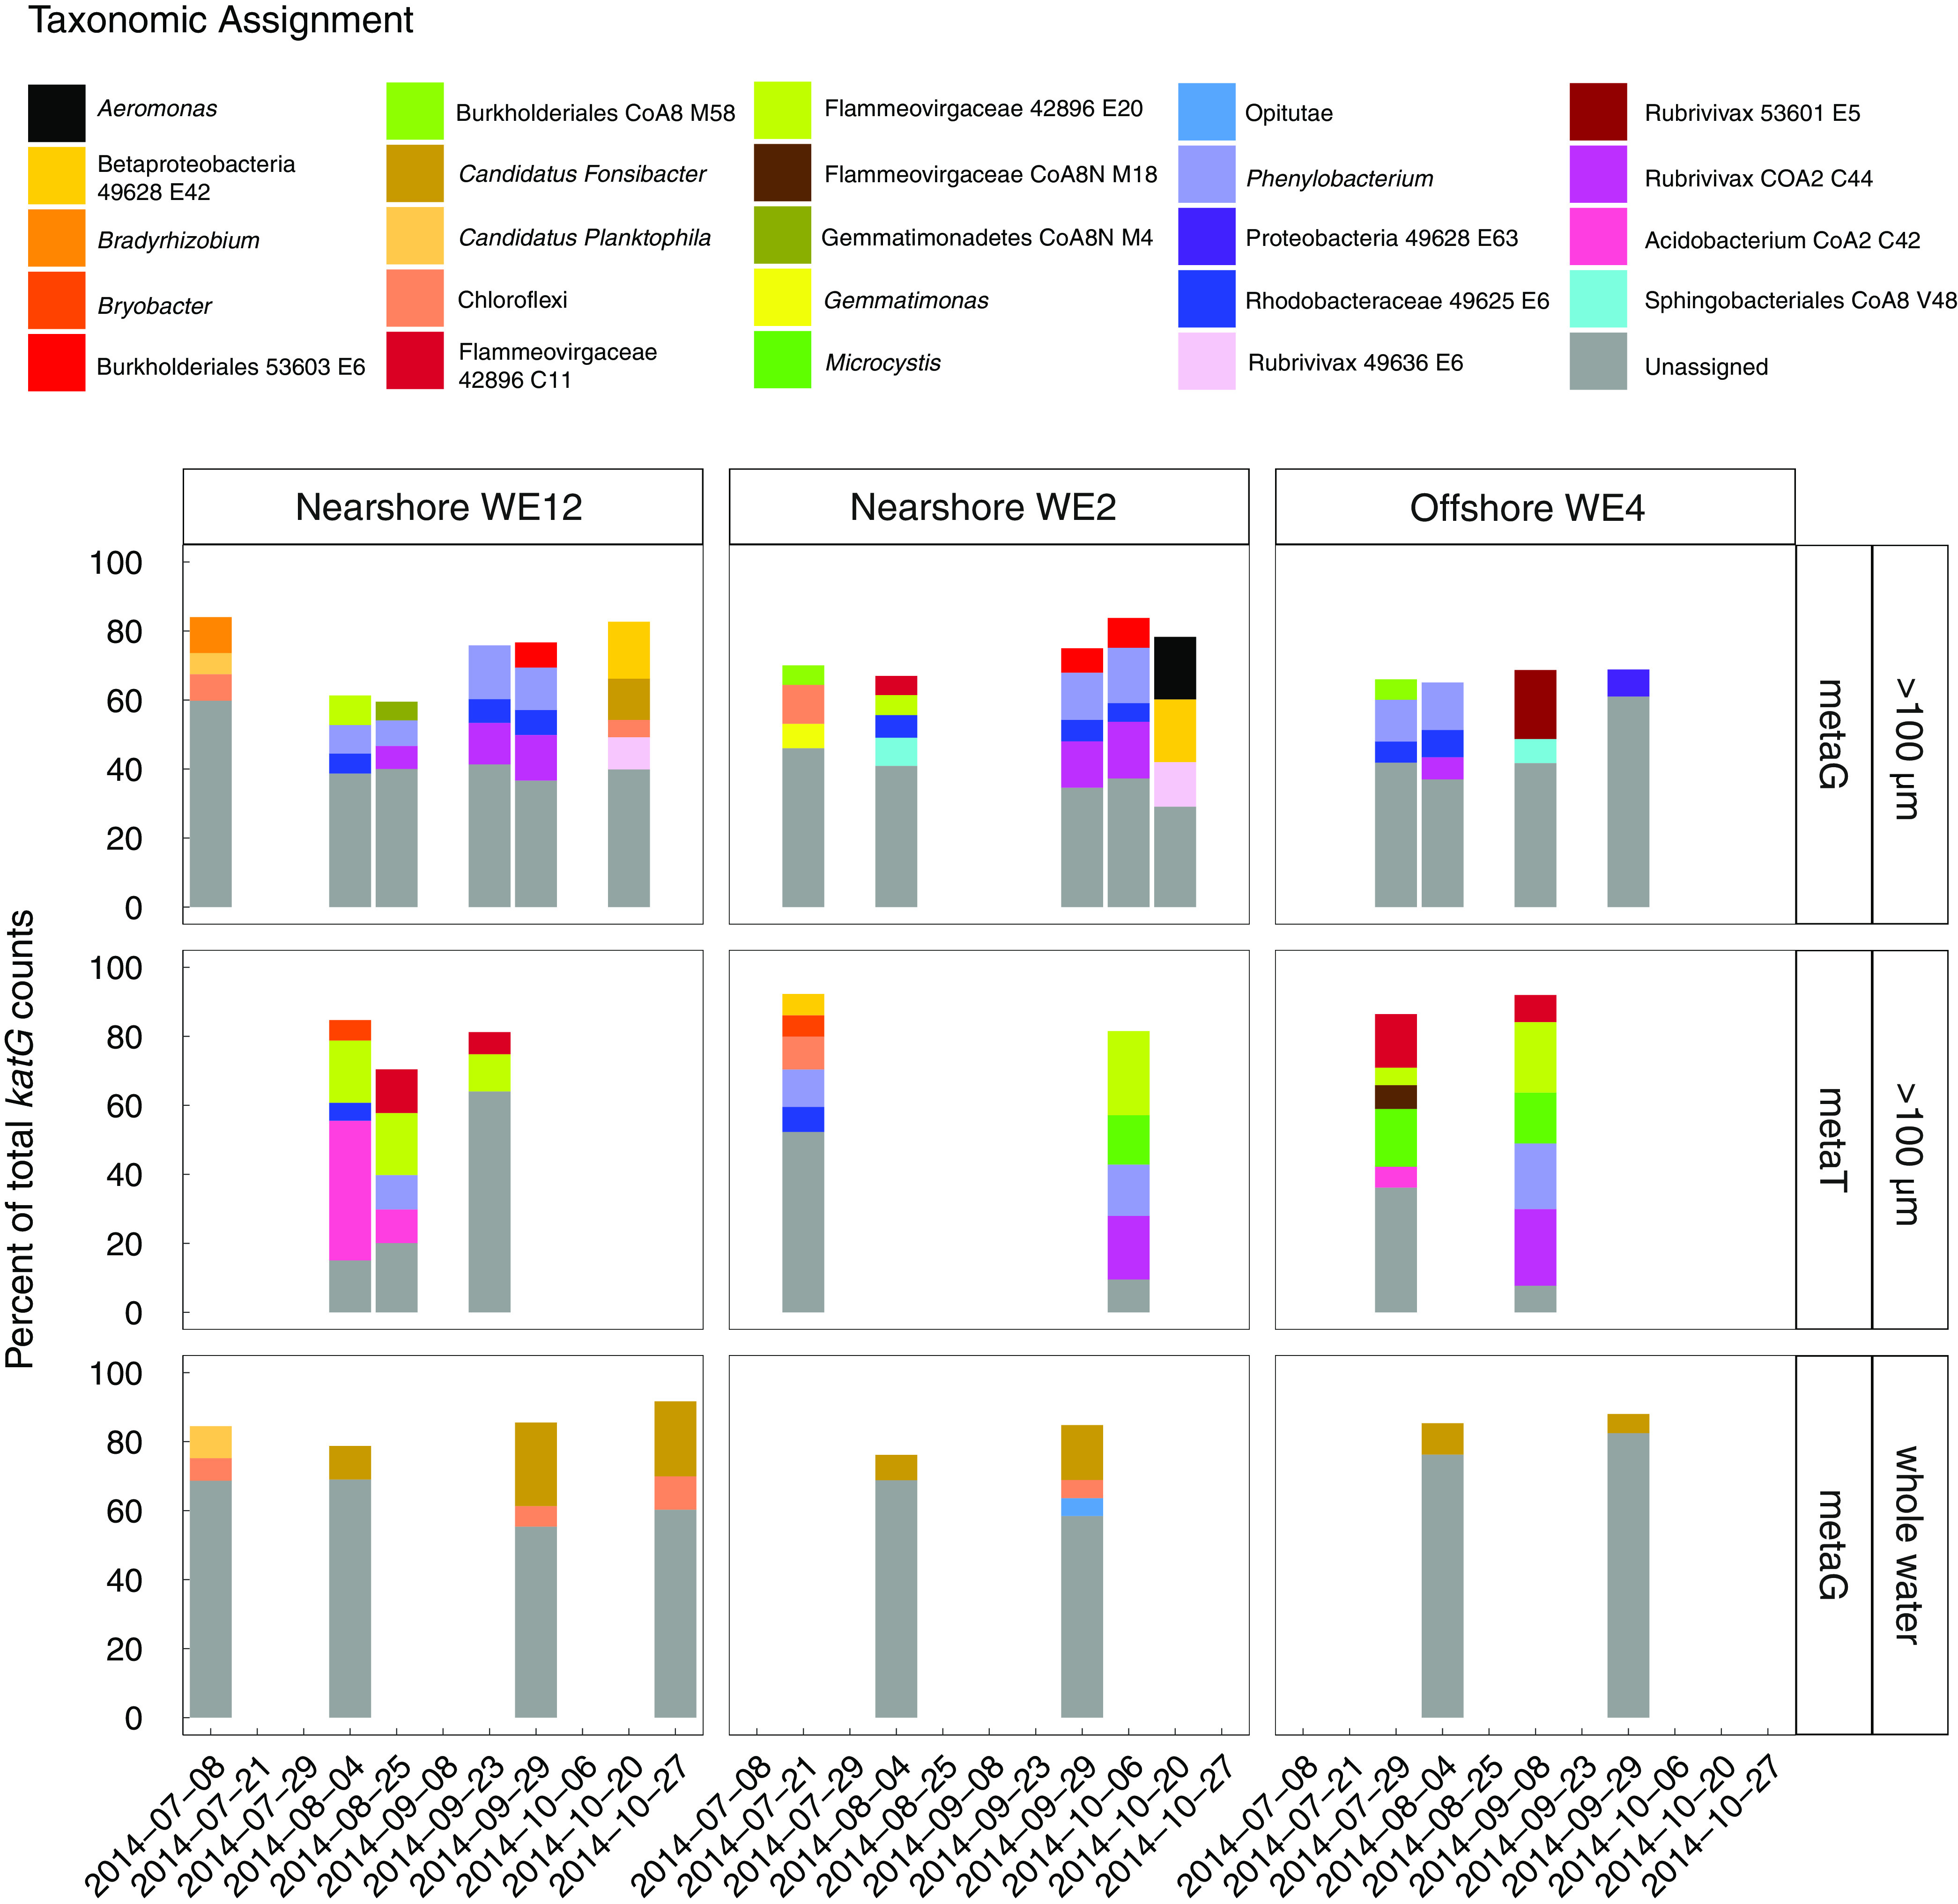
Genes and transcripts encoding KatG in the 2014 western Lake Erie cyanobacterial bloom were from a diverse community of microbes, and katG from Microcystis did not dominate total katG reads. katG reads were summed by taxonomic assignment. For each sample, only taxa that had percent abundances higher than 5% of the total katG reads in the given sample are shown; the remaining white space is made up of taxa with katG that had a percent abundance below 5%. Dates without bars indicate that no data are present for the given combination of date and station. metaG, metagenome samples; metaT, metatranscriptome samples.
The dominant organisms with katG in the whole community were distinct from those in the Microcystis-enriched fraction (Fig. 3). In the whole community, the sum of katG genes that could not be assigned a taxonomy was most abundant. Of the genes that could be assigned taxonomy, katG from “Candidatus Fonsibacter” (Alphaproteobacteria) and unclassified Chloroflexi had the highest abundance consistently throughout the bloom (Fig. 3), but they were largely absent in the Microcystis-enriched fraction. Similarly, the most abundant taxa containing katG in the Microcystis-enriched fraction were rare in the total community fraction, with Microcystis accounting for only 0 to 0.06% of the total katG in the total community metagenomes (mean 0.017% ± 0.022% [Fig. 3]).
Noncyanobacteria dominated katG transcripts in all samples (Fig. 3). Microcystis katG transcripts comprised only 0 to 17% (mean for nonzero samples was 10% ± 8% [standard deviation]) of the total katG reads despite being abundant in the metagenome and accounted for only 0.8% of katG reads during peak katG relative transcript abundance. katG from an uncultured Flammeovirgaceae member (bin 42896 E20, Bacteroidetes) was a significant portion of total katG read counts during peak katG relative abundance (18%, 4 August at WE12 [Fig. S3]) and was a major proportion of total katG transcripts for all dates, with the exception of 21 July at nearshore station WE2 (Fig. 3).
Highly abundant katG transcripts were often from organisms present at low relative abundance in the metagenomic reads (Fig. S3). The most striking example of this result was observed on 4 August at WE12, when total katG transcript relative abundance was the highest; katG from Acidobacteria bin CoA2 C42 and Bryobacter (Acidobacteria) comprised ~40% and ~6% of the total katG RNA reads, respectively (Fig. S3). Bryobacter and Acidobacteria bin CoA2 C42 comprised a lower proportion of the total katG transcripts in other samples, but the relative abundance of transcripts from both organisms was consistently enriched relative to gene abundance when present.
The ratio of Microcystis katG to Microcystis housekeeping genes (estimated by dividing Microcystis katG reads by Microcystis rpoB reads) ranged from 0 to 2.6% (mean 0.5% ± 0.7%, standard deviation), suggesting that most Microcystis cells in the bloom lacked katG. Microcystis katG/rpoB ratios tended to be higher in the early phases of the bloom (Fig. 4A). The abundance of Microcystis katG transcripts relative to Microcystis rpoB transcripts did not show any patterns with H2O2 concentration (Fig. 4B).
FIG 4.

Spatial and temporal variation in Microcystis katG abundance relative to Microcystis rpoB in metagenomes and metatranscriptomes from the 2014 western Lake Erie cyanobacterial bloom. (A) Low and decreasing katG/rpoB ratios with time suggest that a minority of Microcystis genomes in the 2014 bloom have katG and fewer Microcystis genomes have katG in the late summer and fall. (B) There are no quantitative or qualitative relationships between the relative abundance of Microcystis katG transcripts and H2O2 concentrations.
Taxonomy of metagenome-assembled genomes that have and express ahpC.
In contrast to katG, ahpC from Microcystis was the most abundant of the ahpC genes in the Microcystis-enriched fraction, and Microcystis accounted for a larger proportion of the total ahpC reads (2 to 82%, mean 45% ± 28%, standard deviation; Fig. 5) than for total katG reads. In contrast to the Microcystis-enriched fraction, no single organism dominated ahpC reads in the total community (Fig. 5). In the Microcystis-enriched fraction, Microcystis dominated the ahpC transcript pool in all but 2 metatranscriptomes collected on 23 September 2014 at nearshore station WE12 and 21 July 2014 at nearshore station WE2 (Fig. 5).
FIG 5.
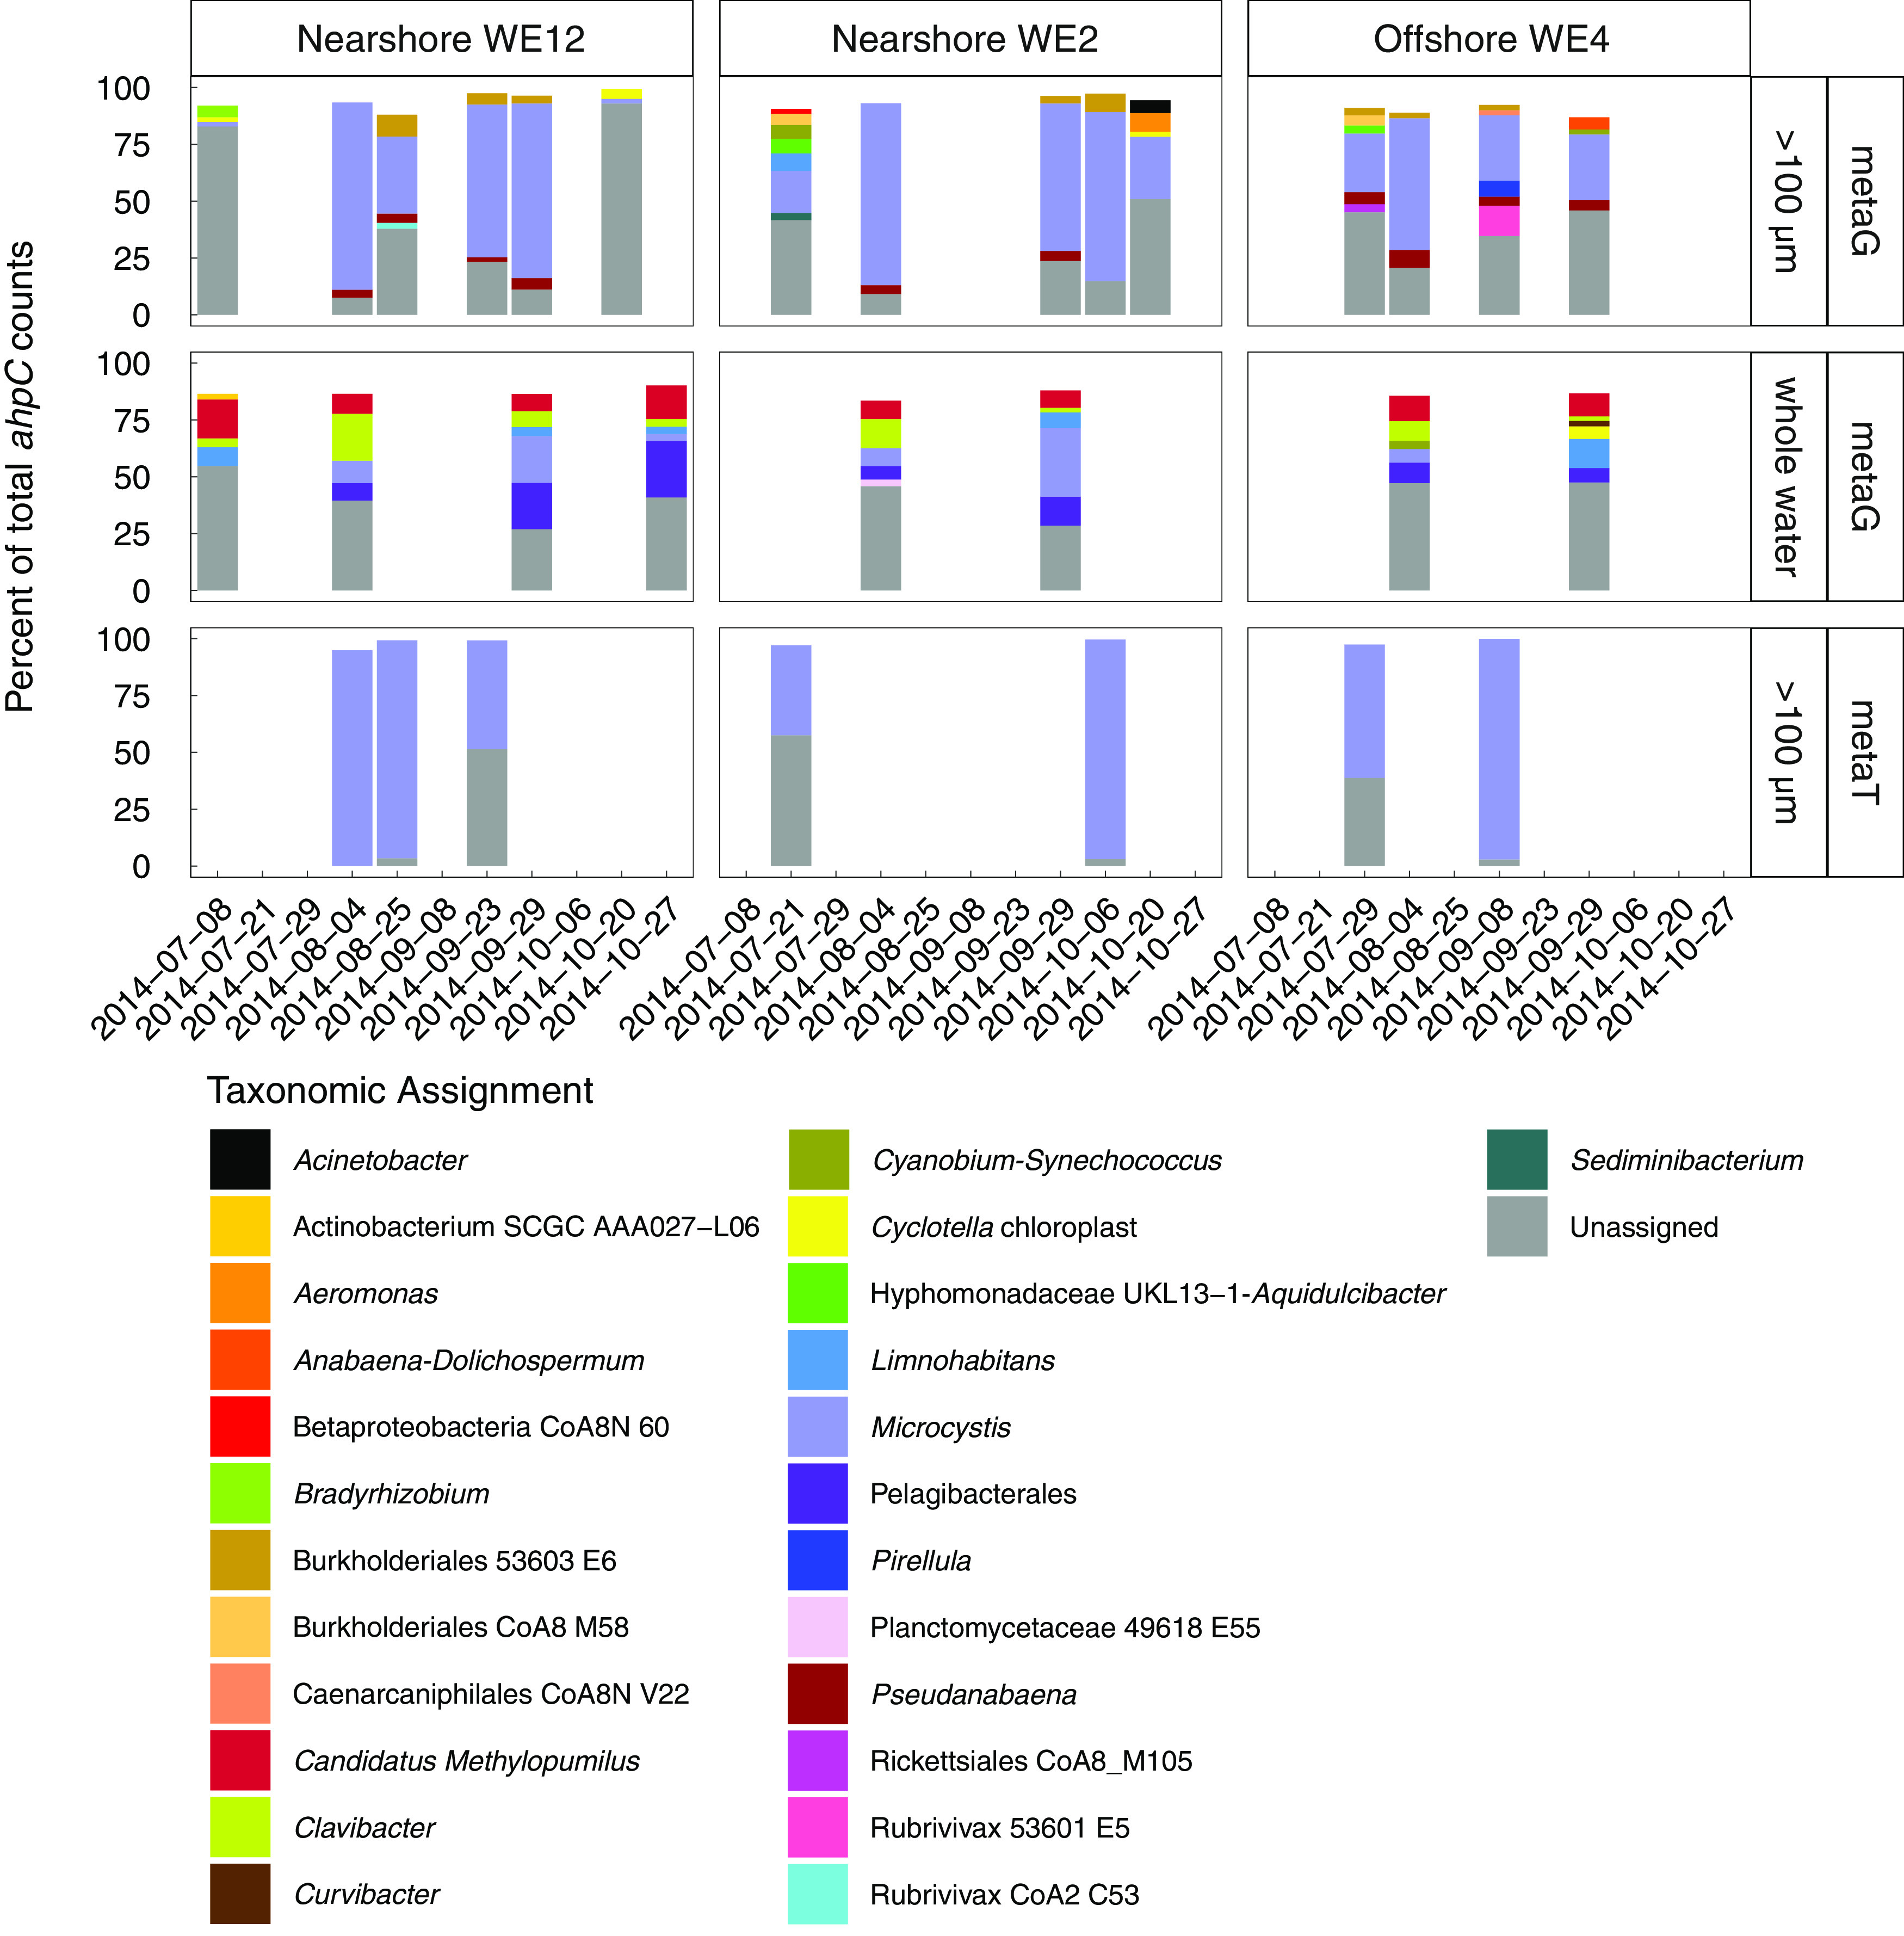
Microcystis ahpC was abundant in most particle- and phytoplankton-associated metagenomic samples and dominated particle- and phytoplankton-associated ahpC transcripts in the 2014 western Lake Erie cyanobacterial bloom, but Microcystis ahpC was less abundant in whole water metagenome samples. ahpC reads were summed by taxonomic assignment. For each sample, only taxa that had percent abundances higher than 2% of the total ahpC reads in the given sample are shown; the remaining white space is made up of taxa with ahpC that had a percent abundance below 2%. Dates without bars indicate that no data are present for the given combination of date and station. metaG, metagenome samples; metaT, metatranscriptome samples.
Catalase and peroxidase genes in published cyanobacterial genomes.
To confirm the presence or absence of catalases in dominant bloom-forming cyanobacteria, we surveyed publicly available genomes of cyanobacteria that are regular members of cyanobacterial blooms in Lake Erie, including the dominant potential microcystin producers, Microcystis and Planktothrix (43, 54–56) (Fig. S4; also see Materials and Methods). We also compared the distribution of catalases and peroxidases in these genomes to that of Prochlorococcus, a dominant cyanobacterium in the open ocean that has been shown to be dependent on other community members for H2O2 detoxification (9).
In total, 343 public genomes were analyzed, and 99% of the genomes had an ahpC gene. Nearly all 150 published Microcystis genomes lack genes encoding catalases, except for four genomes that have a katG gene. Similarly, catalase genes were absent in all published Prochlorococcus genomes, consistent with previous genomic studies and the low tolerance of H2O2 by this genus (10, 57). In contrast, 57% of Pseudanabaena genomes possess catalases, while 43% of Anabaena-Dolichospermum genomes contain manganese catalases. All the Anabaena-Dolichospermum genomes lack heme catalases. A majority of Synechococcus genomes have either or both katE and katG, consistent with previous observations of the relatively high H2O2 tolerance of this genus as well as previous intergenomic comparisons (9, 57).
Axenic culturing experiments.
To assess how bacterial cross-protection from natural H2O2 concentrations impacts the growth of toxic and nontoxic Microcystis strains, we grew axenic Microcystis cultures for 12 to 13 days in the presence and absence of sodium pyruvate, a rapid scavenger of H2O2 that is used to remove H2O2 in cell cultures (8, 24, 29, 58, 59). In unamended Microcystis cultures, H2O2 concentrations at the start of the experiment ranged from 910 to 1,330 nM (mean 1,000 ± 148 nM, 95% confidence interval; Fig. 6A). In four strains, H2O2 concentrations declined to 170 ± 40 nM. The other three strains apparently degraded H2O2 less efficiently, and H2O2 concentrations in these cultures declined to 370 ± 70 nM. In the pyruvate-treated cultures, H2O2 concentrations could not be quantified because pyruvate degraded the H2O2 standard added to the samples during standard addition by 10 to 25% during the flow injection analysis (Fig. S5; see also Materials and Methods). However, the rapid decay of the standard suggests that H2O2 concentrations were maintained at very low levels in the pyruvate treatments.
FIG 6.
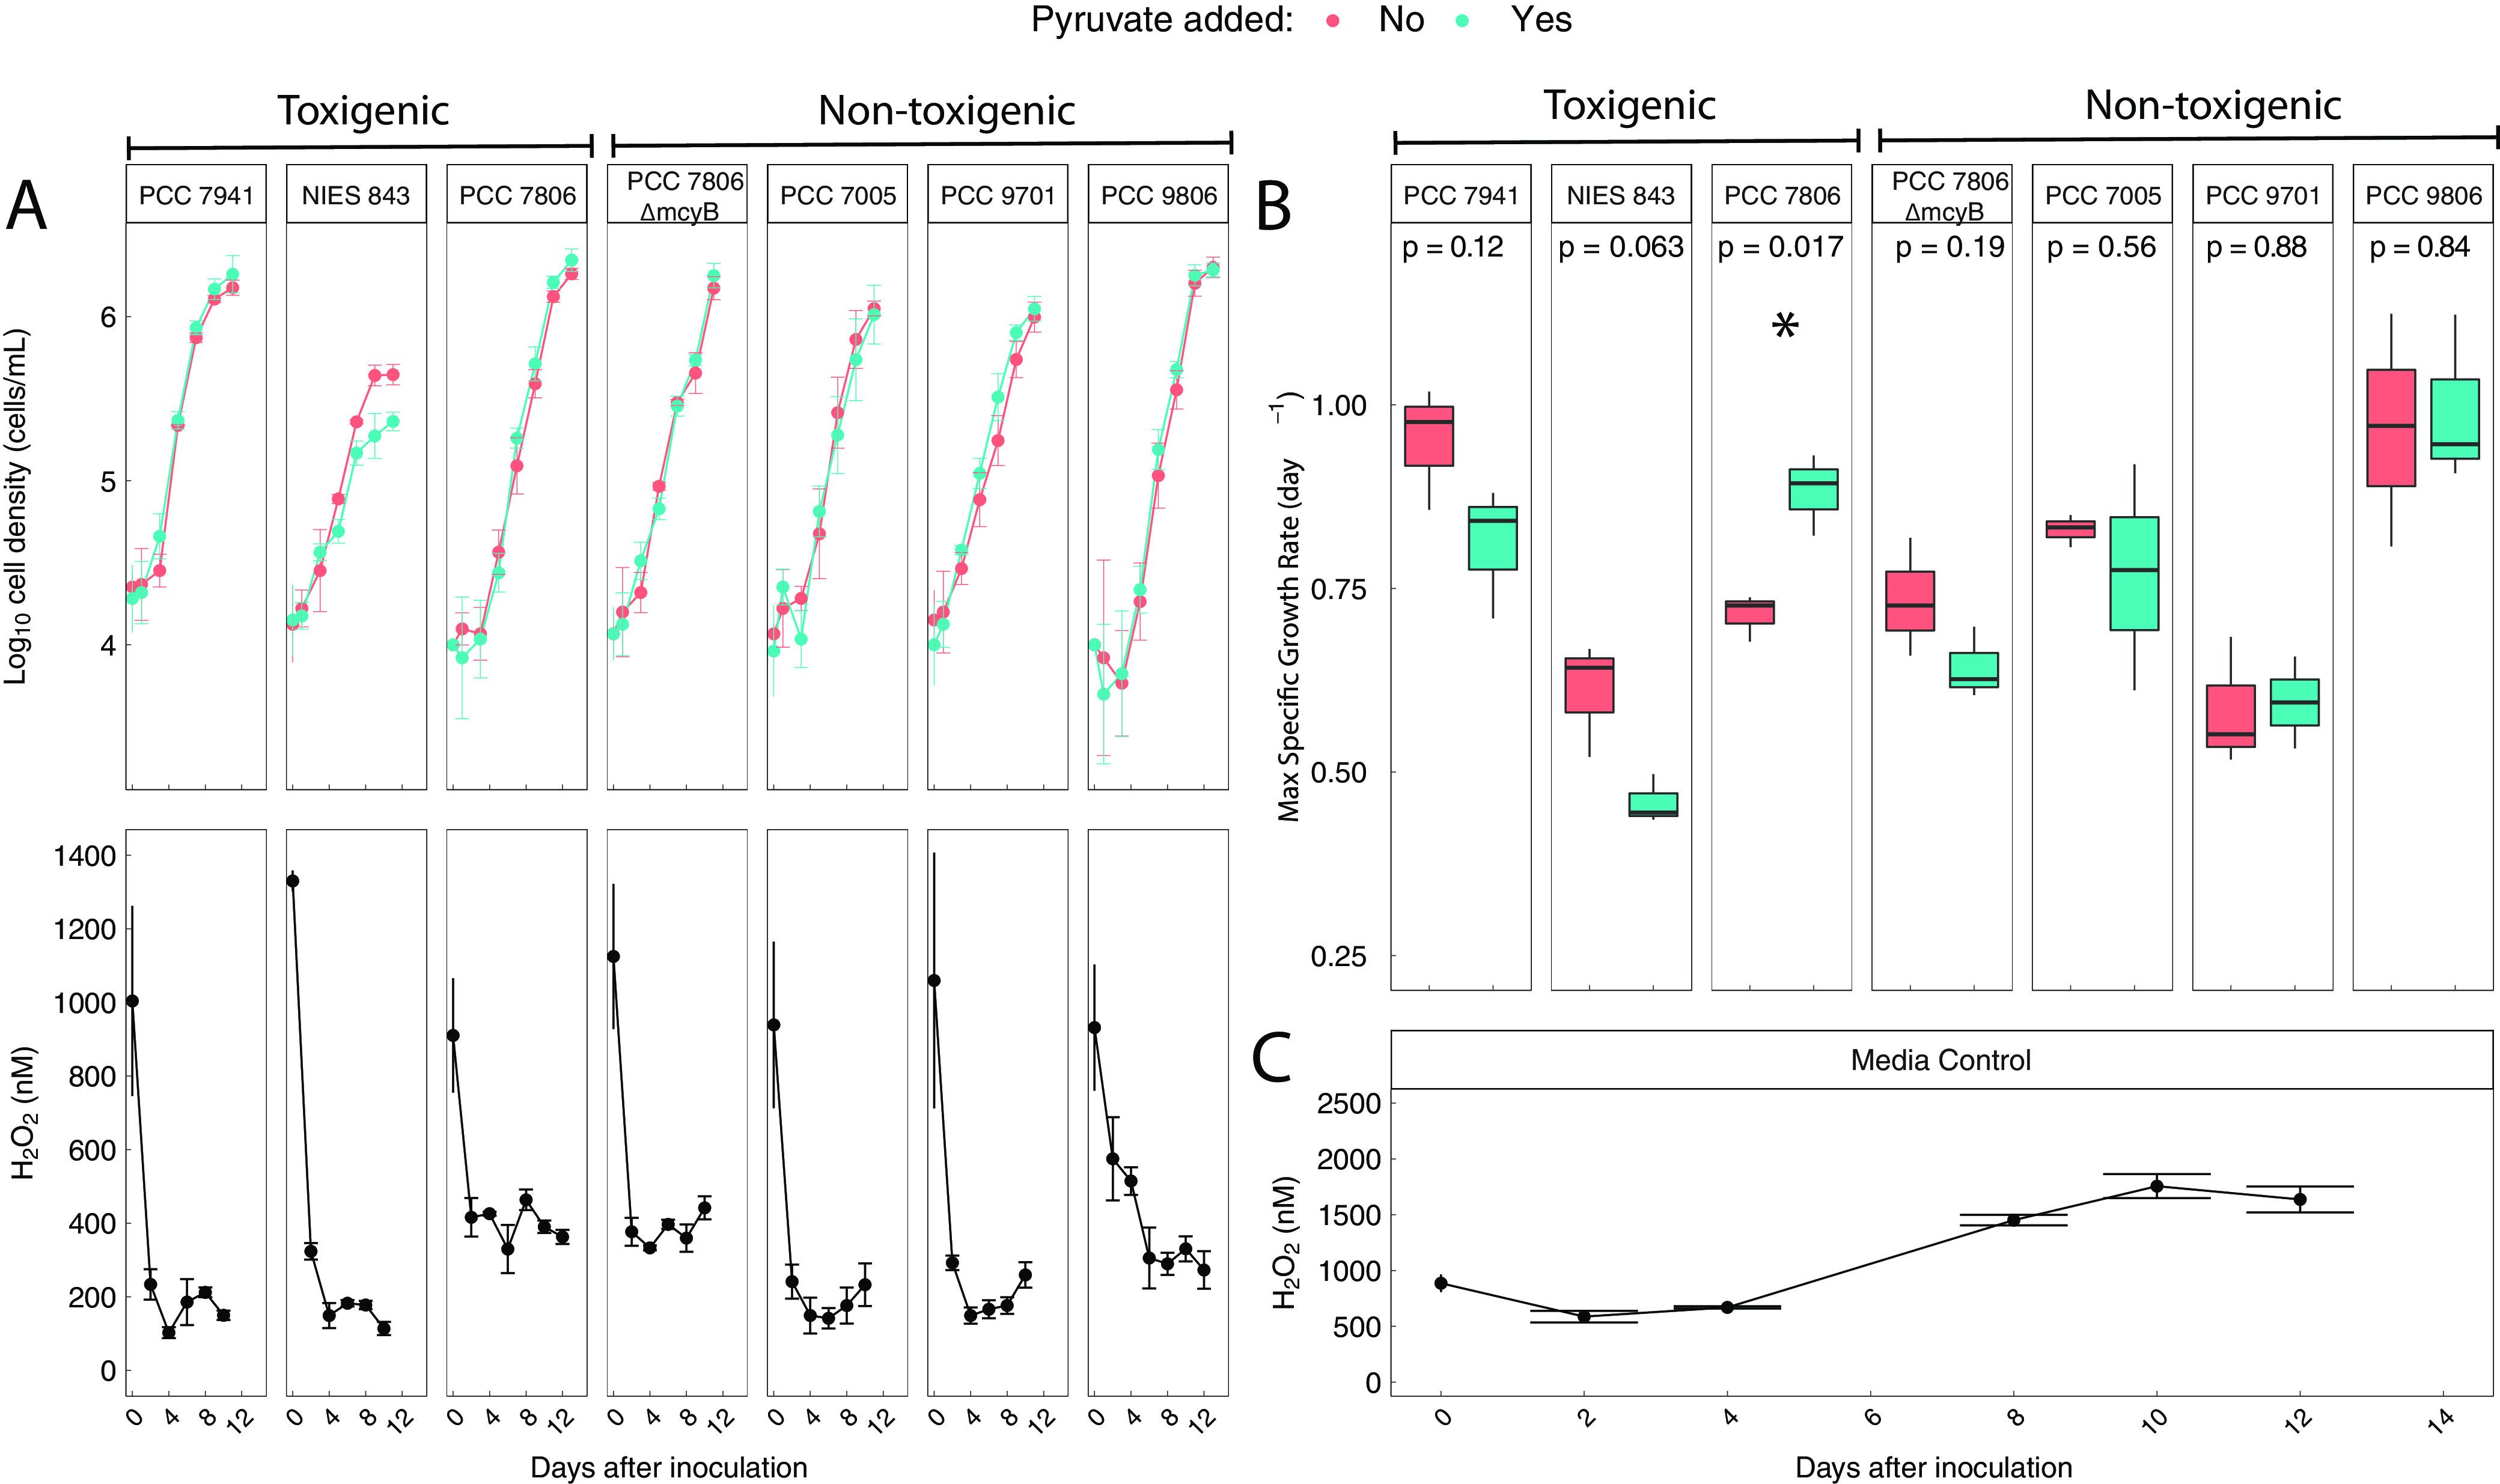
(A) Small differences in cell density between pyruvate and control treatments and the decomposition of initially high, but environmentally relevant, H2O2 concentrations suggest that Microcystis does not require help degrading H2O2 under the experimental conditions despite lacking katG. Error bars depict 95% confidence intervals of biological triplicates. (B) Some Microcystis strains had significant (P < 0.05) improvements in maximum growth rates when cultured with pyruvate, suggesting a benefit from receiving help with H2O2 decomposition. Strain toxigenicity is not an indicator of whether a strain benefits from help decomposing H2O2. Significance was determined with Welch’s two-sided t test. (C) In sterile growth medium, H2O2 concentrations increase over time rather than decrease. Error bars depict 95% confidence intervals of three technical replicates.
Although there were slight increases in the cell densities of four strains when cultured with sodium pyruvate, final cell densities at the end of the experiment were not significantly different in most strains when cultured with pyruvate (P > 0.05, Welch’s t test; Fig. 6A). One strain (strain NIES-843) had significantly lower mean final cell densities when cultured with sodium pyruvate (P = 0.01, Welch’s t test; Fig. 6A). Only one strain (PCC 7806) had a significant improvement in maximum specific growth rate (μmax) when cultured with sodium pyruvate, while the remaining strains showed no differences in maximum specific growth rate (P = 0.05, Welch’s t test; Fig. 6B). Neither Microcystis strain toxigenicity (determined by the presence or absence of the mcy gene cluster in the genome) nor the presence of catalase and peroxidase genes in the genome predicted whether a strain benefited from addition of sodium pyruvate to the growth medium (Fig. 6B).
In sterile BG-11 2N medium, H2O2 concentrations showed complex dynamics, decreasing to 580 ± 50 nM within 2 days and subsequently increasing to 1,700 ± 100 nM (Fig. 6C). Therefore, declines in H2O2 below ~580 nM were attributed to the presence of Microcystis cells. The H2O2 concentrations observed in sterile BG-11 2N medium required both citrate and transition metals present in the medium (Fig. S6).
DISCUSSION
The presence of microcystin biosynthesis genes does not predict the response of a Microcystis strain to an exogenous H2O2 scavenger.
Variations in H2O2 concentrations have been hypothesized to impact the relative proportions of toxic and nontoxic Microcystis strains in the environment (15). However, there is conflicting evidence on whether the growth of toxic Microcystis is either more (20, 27) or less (28) favored by H2O2 than that of nontoxic Microcystis. The Microcystis strains tested here (3 naturally toxic, 3 naturally nontoxic, and 1 nontoxic mutant) showed different impacts of the H2O2 scavenger pyruvate on growth. The maximum growth rate of most strains was not significantly impacted by pyruvate (Fig. 6B), which suggests no fitness benefit from the removal of H2O2 from the growth medium. However, strain PCC 7806 (toxic) showed a significantly higher maximum growth rate when cultured with pyruvate (Fig. 6B; P < 0.05), suggesting that H2O2 in the growth medium reduced growth rates of this strain despite its ability to decompose H2O2 (Fig. 6A). While the H2O2 scavenger had little impact on the carrying capacity of the culture (Fig. 6A), the reduced growth rate may be important in determining the outcome of competition with other Microcystis strains and phytoplankton taxa in natural communities.
It is possible that the breakdown products of the reaction between pyruvate and H2O2 (acetate and carbon dioxide) account for the differences in the maximum growth rates measured for strain PCC 7806. However, previous studies that used sodium pyruvate as an H2O2 scavenger found no evidence that uptake of the reaction products significantly impacts growth or the amount of carbon fixation in other autotrophic organisms (8). Furthermore, the finding that H2O2 reduces PCC 7806 maximum growth rate is consistent with other laboratory culture experiments with this strain that showed growth inhibition of PCC 7806 at higher H2O2 concentrations than those used in this study (20, 27, 28, 60).
In contrast to the wild-type strain, the mutant strain of PCC 7806, incapable of microcystin biosynthesis (61), did not display any significantly different growth rates with pyruvate treatment (Fig. 6B), indicating that the environmentally relevant concentrations of H2O2 in the medium had no detectable effect on growth of the mutant. The observation that H2O2 exposure impacted wild-type growth rates but not microcystin knockout mutant growth rates conflicts with the hypothesized protection from H2O2 provided by microcystins and with previous results showing higher growth impairments of H2O2 additions to the mutant strain than of those to the wild type (20, 27) but is consistent with other experiments that used single, highly concentrated H2O2 additions (28). However, the two strains degraded environmentally relevant H2O2 concentrations similarly (Fig. 6A), which does not support the idea that production of microcystins directly impairs the ability of Microcystis to degrade H2O2 at environmentally relevant concentrations (28).
When grown with the H2O2 scavenger, wild-type PCC 7806 had significantly higher maximum growth rates than the mutant strain (Fig. 6B; P < 0.05, Welch’s two-sided t test). The lower growth rate of the mutant is unrelated to extracellular H2O2 exposure but may be related to its altered metabolome (62, 63), proteome content (64), assembly and subcellular localization of RubisCO (63), or expression of peroxiredoxins and other genes involved in the oxidative stress response (28) compared to the wild type. Such metabolic differences between the wild-type and mutant PCC 7806 may also explain how the two strains differ in whether they benefit from an exogenous H2O2 scavenger despite having similar growth rates when grown without the H2O2 scavenger.
Traits other than the production of microcystins, catalases, and peroxidases must contribute to the overall impact of H2O2 on the growth of a given Microcystis strain. All of the tested strains have ahpC (38), lack katG (38), and degrade H2O2 in the growth medium (Fig. 6A). Thus, the presence or absence of catalases and peroxidases alone does not determine whether a given strain benefits from help decomposing H2O2. While the cell quotas of microcystins vary among Microcystis strains and growth conditions (65–67), microcystins are constitutively produced in a growth-rate-dependent manner (66–68). Therefore, our results cannot be explained by a lack of microcystins in strains containing microcystin biosynthetic genes.
Several other mechanisms may explain the differences in the response of the Microcystis strains to H2O2. Differences between Microcystis strains in exopolysaccharide composition and production (69), which may degrade H2O2 (37) and influence H2O2 permeability (12), could modulate the effect of H2O2 on growth rates. Strain-dependent susceptibility of cellular components to H2O2 damage could also play a role. For example, the proteome varies between Microcystis strains (70), and H2O2 damage is specific to certain protein structures.
Some Microcystis strains benefitted from receiving help with H2O2 decomposition despite their ability to degrade and tolerate H2O2 alone.
All the Microcystis strains tested here could grow to high cell density despite initial H2O2 concentrations in the culture representative of some of the highest concentrations detected in Lake Erie (Fig. 1 and 6A; see also reference 26). H2O2 decomposition by Microcystis has been detected previously (28) and is presumably from ahpC. Others have reported that ahpC can compensate for the loss of katG in some bacteria at the submicromolar concentrations of H2O2 typically observed in natural waters (48–51) and in our experiments (Fig. 6A). These results support that AhpC protein can scavenge extracellular H2O2 for some organisms and suggest that Microcystis can lower environmental H2O2 to some extent even without katG. Thus, the absence of katG may not indicate dependence on helper bacteria as predicted by previous results from Prochlorococcus (9, 10).
The higher maximum growth rates of strain PCC 7806 when cultured with sodium pyruvate occurred despite its ability to degrade H2O2 in the growth medium (Fig. 6A). Growth impairment from H2O2 despite its decomposition has also been observed in other Microcystis strains (34, 39) and may indicate that a portion of H2O2 decay comes from reactions that damage cellular structures or that there is a fitness cost to H2O2 decomposition in some Microcystis strains. Indeed, AhpC protein activity requires NADH and thioredoxin or glutathione as electron donors (44, 51, 71, 72). Thus, H2O2 decomposition in Microcystis may impart a cost to growth under conditions under which electron donor availability is reduced. For example, the form and concentration of nitrogen in the environment change the intracellular concentrations of NAD(P)H in Microcystis (73), which may impact H2O2 decomposition by AhpC. Additionally, if the environmental conditions that cause electron donor limitation vary between Microcystis strains, electron donor availability could be another factor that determines differences in the impact of H2O2 on the growth of different Microcystis strains.
Sources of H2O2 in BG-11 2N medium and caveats concerning H2O2 exposure.
H2O2 production in sterile BG-11 2N medium is likely from visible-light reactions involving trace metal complexes rather than reactions involving UV light and dissolved organic matter as expected in natural waters (see the supplemental material). In lake systems with photochemical H2O2 production and rapid biological decay of H2O2, the total H2O2 exposure of Microcystis spp. may be higher than in these cultivation experiments. For example, if a high H2O2 production rate countered by a high rate of decomposition by other bacteria keeps H2O2 concentrations within a tolerable range, the Microcystis populations may be more dependent on other bacteria for H2O2 decomposition than shown in our lab experiments. The total H2O2 concentrations during the growth phase of our cultures (Fig. 6A) do not provide information on the absolute rates of H2O2 production or decay during the experiment. Thus, we cannot rule out that natural H2O2 production may inhibit growth of the Microcystis strains tested here more broadly or severely than shown by our lab experiments.
Other biological factors complicate extrapolation of the experiment results to natural waters. First, the impact of natural H2O2 concentrations on Microcystis growth and physiology likely depends on light intensity and wavelength (31, 60, 74), nutrient availability (75), and temperature (assuming that Microcystis responds to the interactive effect between temperature and H2O2 in the same manner as Prochlorococcus [24]). Second, the Microcystis strains included in our experiments may not be representative of abundant strains found in western Lake Erie, in part due to inhibition of strains sensitive to H2O2 present in culturing media (29, 30), which exerts a strong bias on the cultivation of bacteria from the environment (76), including some cyanobacterial strains (9, 10).
The relative contribution of attached bacteria to H2O2 decomposition in phytoplankton assemblages.
Metatranscriptomics revealed that Microcystis katG comprised very few total katG transcripts (<1% of total transcripts during peak relative abundance [Fig. 3; see also Fig. S3 in the supplemental material]) in the Microcystis-enriched fraction, and a small fraction of Microcystis cells in Lake Erie had katG (Fig. 4). The most highly expressed katG genes in the Microcystis-enriched fraction were from heterotrophic bacteria, suggesting that they may be responsible for most of the H2O2 degradation in phytoplankton assemblages and thus provide protection from H2O2 to other community members. However, some actinobacteria have catalases with low specific activity and catalytic efficiency (kcat/Km) and still require helpers in order to tolerate naturally relevant H2O2 concentrations (60, 77). Thus, the detection of katG transcripts may not necessarily be indicative of efficient H2O2 decomposition in some bacteria. Given that the organisms responsible for the majority of katG expression are uncultured, no axenic isolates of Microcystis with katG are currently available, and ahpC can compensate for katG at the H2O2 concentrations measured in Lake Erie, it is unclear how katG expression of these organisms relates to rates of H2O2 decomposition in the environment. However, Microcystis colonies are encapsulated by exopolysaccharide slimes (37, 69, 78) that can scavenge H2O2 (37) and are colonized by heterotrophic bacteria (79–81). Thus, bacterial cells attached to the colony perimeter are likely exposed to more exogenous H2O2 than Microcystis cells in the colony interior, perhaps making them larger sinks for exogenous H2O2 than Microcystis cells in the colony interior.
Conclusions.
This study provides evidence that questions the current thinking on the effect of H2O2 on Microcystis physiology and the relative abundance of Microcystis strains in natural waters. The results do not support the hypothesized protection from H2O2 provided by microcystins (20, 27) nor the idea that microcystins directly impair the ability of Microcystis to degrade H2O2 in the environment (28). Every Microcystis strain tested was able to tolerate H2O2 concentrations within the range of some of the highest concentrations observed in Lake Erie blooms (Fig. 1) without katG. Such tolerance of H2O2 by Microcystis is different from H2O2-sensitive Prochlorococcus (9, 10) and ammonia-oxidizing archaea (8, 12) that lack catalases and heme peroxidases. Together, the results suggest that (i) the presence of catalase and peroxidase genes in a genome alone is insufficient for determining the susceptibility of an organism to growth inhibition from H2O2 in natural systems and (ii) changes in H2O2 concentrations in freshwater lakes due to natural biological and photochemical processes do not favor certain Microcystis strains based solely on their ability to produce microcystins.
Although the results suggest that Microcystis spp. are not fully dependent on “helper” bacteria to grow in the H2O2 concentrations observed in freshwater blooms, Microcystis growth rates may be impacted by rates of community-wide H2O2 production and decomposition. Natural variation in H2O2 concentrations in freshwater lakes (26) may have differential impacts on growth rates of Microcystis strains, which have diverse ecophysiological traits (38). Understanding the diversity of these Microcystis strains and how their response to H2O2 is linked with other traits and with the environment may improve our understanding of the widely observed seasonal transitions from high to low microcystin concentrations that are underpinned by successions in toxic and nontoxic Microcystis strains (82–84).
MATERIALS AND METHODS
Field sampling and water chemistry.
Weekly sampling was conducted at three locations in the western basin of Lake Erie in conjunction with the NOAA Great Lakes Environmental Research Laboratory long-term harmful algal bloom (HAB) monitoring program. These sites correspond to NOAA stations WE2, WE12, and WE4 (see Fig. S1 in the supplemental material). The average depth at nearshore stations WE2 and WE12 is 4.8 ± 0.1 m and 5.9 ± 0.1 m, respectively, while the average depth at offshore station WE4 is 7.8 ± 0.1 m. Water chemistry measurements (pH, conductivity, and nutrients) are detailed elsewhere (43). At all stations, pH ranged from 7.80 to 9.29 (mean = 8.55 ± 0.06), conductivity ranged from 175.5 to 314.6 μS/cm (mean = 250.6 ± 5.2 μS/cm), and water temperature ranged from 25.0°C (mid-August) to 12.5°C (mid-October) with a mean of 20.6 ± 0.6°C from June to October. Total N as nitrite/nitrate and ammonium ranged from 0 to 1.1 mg/L and 0.1 to 36.4 μg/L while soluble reactive phosphorus and total phosphorus ranged from 0.04 to 21.2 and 9.9 to 132.7 μg/L, respectively. These values are typical of Lake Erie (82, 85) and other eutrophic lakes impacted by CHABs (86, 87). Water quality data were collected by the NOAA Great Lakes Research Lab and are available under NCEI accession no. 0187718.
In situ hyperspectral light profiles were collected at each sampling site using a Sea-Bird HyperPro II (Sea-Bird Scientific, Philomath, OR) profiler equipped with up- and down-facing HyperOCR radiometers measuring wavelengths 348 to 801 nm (bin size = 3.3 nm), plus an identical fixed-surface radiometer to record sky conditions. The profiler was deployed on the sunny side of the vessel and allowed to free-fall through the water column to avoid the vessel shadow. A duplicate cast was collected as soon as the profiler was returned to the surface to capture identical light conditions. Profiles were collected after the vessel had been drifting without power for several minutes, so the water column through which the profiler traveled had as little artificial disturbance as possible. Light profile data were processed using ProSoft (Sea-Bird Scientific, Philomath, OR). Output spectral light intensities in power units (W/m2) were converted to photon flux units (μmol photons/m2/s) by dividing by the photon energy, which was calculated using the following equation: Eph = hc/λ, where h is Planck’s constant (6.626 × 10⁻³⁴ J/s), c is the speed of light (per m), and λ is the wavelength of light in meters. Total photon flux was calculated as the sum of the spectral photon fluxes from a single Sea-Bird cast.
Microbial samples were obtained from a 20-L depth-integrated water sample collected from the surface to 1 m above the lake bottom. To collect the whole community fraction, 150 mL of depth-integrated sample was filtered onto a 47-mm Millipore Express Plus membrane with a 0.22-μm pore size, placed into 2-mL cryovials with 1 mL RNAlater, and kept on ice during cruise transit. To collect the colony-associated fraction, 2 L of depth-integrated sample was filtered through a 100-μm-pore-size mesh, and the retentate was backwashed into a Falcon tube using altered BG-11 medium (Table S2). RNAlater was added in a 2:1 ratio with the backwash. The backwash was filtered onto a 1.6-μm-pore-size glass fiber filter with a syringe. After filtration, all filters were placed into 2-mL cryovials with 1 mL of RNAlater and kept on ice during cruise transit. Upon arrival at the lab, all filters were frozen at −80°C until extraction. H2O2, chlorophyll, and microcystin measurements were conducted as described in reference 26, and phycocyanin measurements were conducted as described in reference 43.
DNA and RNA extraction and sequencing.
Filters with collected biomass were thawed, folded with biomass facing inward, and rinsed with sterile phosphate-buffered saline (PBS) to remove RNAlater preservative. Filters were pretreated following the Qiagen DNeasy protocol for Gram-negative bacteria. Filters were incubated in 100 μL Qiagen ATL tissue lysis buffer, 300 μL Qiagen AL lysis buffer, and 30 μL proteinase K for 1 h at 56°C on a rotisserie (Qiagen, Hilden, Germany). Cells were further lysed by vortexing in this lysis buffer for 10 min. Addition of lysozyme for Gram-positive bacteria was omitted because previous studies showed that lysozyme addition had variable impacts on DNA yields, often reducing the DNA yield, with minimal impacts on bacterial community composition (88). However, the omission of lysozyme could have biased the extraction against Gram-positive bacteria.
The resulting lysates were homogenized using a QIAshredder column, and DNA was purified from the filtrate using the Qiagen DNeasy blood and tissue kit according to the manufacturer’s standard protocol. The quantity and quality of DNA in each sample were determined using a NanoDrop Lite spectrophotometer (Thermo Scientific). DNA extracts were frozen at −80°C until analysis.
For RNA extraction, the filters were incubated in 600 μL Qiagen RLT+ buffer and 6 μL β-mercaptoethanol for 90 min on a rotisserie. The filters were then vortexed for 10 min and homogenized using a QIAshredder column. RNA was purified from the homogenized solution using the RNeasy kit according to the manufacturer’s standard protocol.
All sequencing was performed at the University of Michigan Sequencing Core. Paired-end DNA sequencing (2 × 125) was conducted on Illumina HiSeq 2000 with V4 chemistry reagents with “low-input prep” using the Rubicon ThruPlex kit. RNA single-read sequencing (1 × 50) was performed on Illumina HiSeq 2000 with V4 chemistry reagents. Before sequencing, RNA libraries were prepared with a 50/50 mix of plant and bacterial Ribo-Zero kits to remove rRNA sequences. In total, 23 metagenomes and 7 metatranscriptomes were sequenced, and the 7 metatranscriptomes were paired with 7 of the metagenomes collected at the same date and sampling location. Of these, 15 metagenomes are from the 100-μm fraction and 8 are from the total community fraction. All metatranscriptomes are from the 100-μm fraction.
Metagenomic assembly.
Metagenomes were obtained from the >0.22-μm size fraction (targeting the whole microbial community) and from the >100-μm Microcystis-enriched fraction (targeting Microcystis colonies, microplankton, and attached bacteria). Metagenomic short reads from each sample were individually processed and assembled de novo. Before assembly, metagenomic short reads from each sample were dereplicated at 100% length and identity using a custom-made dereplicate.pl script, and sequencing adaptors were removed with Scythe (https://github.com/vsbuffalo/scythe). Sickle was then used to remove low-quality reads (89), and the forward and reverse reads were interleaved using the custom script interleave.pl. The de novo assembly for each sample was constructed using IDBA-UD with the following parameters: min kmer = 55, max kmer = 115, kmer step size = 10 (90).
Because the quality of the assembly of a genome from a metagenome can be reduced when its read coverage exceeds 20× (91), we performed a subsampling approach to optimize Microcystis coverage, which could be as high as 1,200× in some samples. Microcystis coverage in each sample was estimated by mapping the unprocessed reads to the complete Microcystis aeruginosa NIES-843 genome using the Burrows-Wheeler Aligner version 0.7.9a (92). Our results confirmed that the longest contigs containing Microcystis housekeeping genes were obtained when Microcystis coverage was between 20× and 35×. Therefore, for each sample in which the Microcystis coverage was greater than 35×, an additional de novo assembly was constructed by obtaining a randomized subset of the reads to normalize the Microcystis coverage to 35× using IDBA-UD with the following parameters: min kmer = 52, max kmer = 92, kmer step = 8 (90). In total, 42 assemblies were constructed from the metagenomic reads.
To improve the assembly of lower-abundance bacteria, combined-sample assemblies (coassemblies) were generated with MEGAHIT (93) using kmin 21, kmax 141, and kmer step size of 12. We performed 3 coassemblies in total: one from the two samples with the highest Acidobacteria CoA2 C42 abundance (Aug-4 and Aug-25 particle metagenomes from WE12), another containing all the samples in which Acidobacteria CoA2 C42 was present (8 samples total), and another with the same 8 samples but in which the read kmer coverage was normalized to 20× prior to assembly with BBnorm in the BBTools package (94). Paired-end short reads were quality and adaptor screened and dereplicated with BBTools prior to coassembly (94). An additional single-sample MEGAHIT assembly was constructed on the particle size fraction sample from 4 August at WE12 following the same pipeline.
Read mapping, contig binning, and MAG quality assessment.
Assembly and binning of sequence reads produced metagenome-assembled genomes (MAGs) of the dominant cyanobacteria (Microcystis, Cyanobium-Synechococcus, Pseudanabaena, and Anabaena-Dolichospermum) and other bacteria (supplemental files 1 and 2), allowing us to assess the distribution and expression of genes encoding catalases and peroxidases among specific microbial taxa during the bloom. The metagenomic read coverage of contigs in each assembly was obtained by mapping reads to their corresponding assembly using Bowtie2 (95). Differential coverage across samples was determined by iteratively mapping reads from each sample used in the assembly to the coassembled contigs.
Binning of contigs in single-sample IDBA-UD assemblies was iteratively performed by clustering assembled contigs by the Euclidean distance of tetranucleotide frequencies and visualized in Databionics Emergent Self-Organizing Maps (ESOMs) (96). Genome sequences of Microcystis aeruginosa NIES-843, Rhizobiales bacterium AUSA02, and Brevundimonas subvibrioides were included in all ESOMs as reference genomes. Each sample received its own ESOM, but contigs generated from full and subsampled reads were binned together in the same ESOM. For most 100-μm fraction samples, contigs greater than 5,000 bp in length were split into 5,000-bp pieces, while contigs below 2,500 bp in length were not included in the binning process. For the total community fraction and the 100-μm sample from 29 September at WE4, a contig size window of 4,000 to 10,000 bp was used because the larger number of contigs above 2,500 bp was computationally unmanageable.
In the coassemblies, contigs were binned using a multialgorithm binning approach. Contigs were binned using differential coverage and tetranucleotide frequencies in CONCOCT (97) and MetaBAT 2 (98) and with tetranucleotide frequencies alone using VizBin (99) and ESOMs. The contig size window for ESOM was 4 to 10 kbp and 2.5 to 10 kbp for the other binners. The resulting redundant bin data sets from each assembly were dereplicated using DASTool (100). The single-sample MEGAHIT assembly was binned using the above coassembly workflow. For this assembly, differential coverage was estimated by mapping reads from 4 August WE12 and 25 August WE12 to the contigs.
The completeness, contamination, and redundancy estimates of each genomic bin were generated using the lineage workflow in CheckM (101). The bins from single-sample IDBA-UD assemblies with contamination metrics greater than or equal to 5%, which is the established benchmark for a draft genome of low contamination (101), were refined by plotting GC content versus the read coverage of all scaffolds within the target bin and removing outlier contigs. Coverage and tetranucleotide frequencies of the coassembly bins were visualized for manual refinement in Anvi’o (102). Refined bins were reanalyzed using the lineage workflow in CheckM (101). All bins with contamination scores greater than 5% after refinement were eliminated from downstream analysis. Contamination scores of the final bins were considered while ignoring the amount of contamination due to strain heterogeneity. Redundant marker genes were considered to be from closely related strains if their shared amino acid identity (AAI) was 95% or more. In total, 315 MAGs were generated with low contamination (<5%) and various levels of completeness (supplemental file 1). This redundant bin data set was dereplicated using dRep (103) with 97% average nucleotide identity (ANI) and 60% alignment coverage cutoffs and skipping the MASH preclustering step. Only MAGs with completeness above 75% were included in the final dereplicated MAG data set, leaving a total of 136 MAGs (supplemental file 2). To improve completeness of one incomplete Acetobacteraceae bin (Bin 42896M_V12), sequences within 50 nodes of binned contigs in the assembly De Bruijn graph were included to the bin.
The taxonomy of each dereplicated bin was obtained with CheckM’s tree qa function and GhoastKoala taxonomy annotations of gene calls (104). Taxonomic classification with these methods remained coarse in many cases, so EMIRGE was used to assemble 16S rRNA genes (105), which were then assigned to bins by matching fragments of the 16S at the ends of contigs via the blastn function of the Basic Local Alignment Search Tool (BLAST, version 2.2.28+) (106). The mean insert size and accompanying standard deviation input used in the EMIRGE 16S assemblies were estimated from the mapping results of the raw metagenomic reads to their corresponding assembled contigs. The SILVA SSU 16S rRNA database version 128 was curated by the emirge_makedb.py script provided in the EMIRGE package and then used as the reference in EMIRGE to map short reads for assembly (107). The final assembled 16S rRNA sequences were compared to the original reference database via BLAST version 2.2.28+, and taxonomy was assigned with the method of Wang et al. (108) in mothur v. 1.43.0 (109). An EMIRGE sequence was considered to belong to a bin only if the percent match to a bin 16S fragment covered greater than 10% of the assembled 16S rRNA gene, had a bit score of at least 50 and an E value of at most 1 × 10⁻⁵, and did not conflict with taxonomy as determined by CheckM and GhostKoala. Final bin taxonomy was assigned using EMIRGE whenever available; otherwise, the CheckM and GhostKoala taxonomy was used.
Gene annotations and abundance.
Gene calls and functional annotations of metagenome-assembled contigs were obtained using the IMG annotation pipeline (110). Genes of interest were obtained from the IMG database by conducting a KEGG orthology search of bacterial genomes in the IMG online interface (111). The following KEGG orthology identifiers (IDs) were used to target our specific genes of interest: K03781 (katE, katA, and catB, here listed collectively as katE), K07217 (katN, ydbDA, cotG, and yjqC, here listed collectively as katN), K03782 (katG), K00428 (ccpA, yhjA, and mauG, here listed collectively as ccpA), K03386 (ahpC), K00434 (ascorbate peroxidase [APX]), and K03043 (rpoB). Custom BLAST databases were constructed from the gene calls with KEGG orthology annotations of interest if their final IMG annotation matched that of the KEGG orthology ID. The taxonomy of genes was assigned to match the taxonomic assignments of the dRep bin cluster in which they were found. Unbinned genes were assigned a taxonomy if they had a ≥95% match to a protein in NCBI nr (as of 17 October 2018) with blastx (106). All other unbinned genes were included as unassigned. Genes in the custom databases were sorted by gene length (longest to shortest) and clustered at 95% identity with vsearch (112) prior to read mapping.
To determine the abundance of catalases and peroxidases in the metagenomes and metatranscriptomes, BBTools-screened short reads were mapped to the assembled gene databases with BLAST version 2.2.31+ (106). The quality-screening pipeline for metatranscriptomic reads did not include a dereplication step. The alignments to the assembled genes were filtered to exclude hits with a percent identity less than 95% and an E value greater than 1 × 10⁻⁵ using the postBlast.pl script. To avoid double counting reads, only the best matches were counted for each read using the top5.pl script. Only read counts to genes with at least 70% amino acid identity (AAI) and 50% alignment coverage to other proteins with the same functional annotation in the NCBI nr protein database with blastx version 2.2.31+ (106) were included. Because more reads inherently map to longer genes, the read counts of each gene were normalized by gene length.
To correct for various library and genome sizes between samples, the gene abundances were reported as ratios to the number of reads that mapped to a custom database of the single-copy housekeeping gene rpoB, encoding the beta subunit of the bacterial RNA polymerase. BLAST mappings against rpoB were filtered and quality checked as described above for the catalase and peroxidase blast searches. We chose to normalize to bacterial rpoB rather than total library size to reduce the impact of eukaryotic genomes on the gene and transcript abundance values for the bacterial community. However, we checked the assumption that rpoB is constitutively expressed and a good normalization strategy by normalizing metatranscriptomic read counts via total library size, expressed as reads per kilobase of transcript per million mapped reads (RPKM). We found that the patterns of katG relative abundance in metatranscriptomes were generally the same, with the exception of the two early samples that showed much lower gene relative abundance overall due to the dominance of eukaryotic genomes (Fig. S7). ahpC relative abundance at station WE12 was lower in September when expressed as RPKM (Fig. S7).
Culturing experiments.
The growth of seven axenic Microcystis cultures was assessed with and without the presence of 1 mM sodium pyruvate, a scavenger of extracellular H2O2 (8, 24). Six strains were purchased axenic from the Pasteur Culture Collection of Cyanobacteria (PCC 7806, PCC 7806 ΔmcyB, PCC 7941, PCC 9806, PCC 9701, and PCC 7005). Strain NIES-843 was generously provided by Steve Wilhelm at the University of Tennessee. The cultures were maintained at room temperature under cool white fluorescent lights (30 to 60 μmol photons/m2/s, 12-h light-dark [L:D] cycle) in BG-11 2N, a variant of standard BG-11 medium (113) with the sodium nitrate concentration reduced to 2 mM. Axenicity was monitored by light microscopy and 4′,6-diamidino-2-phenylindole (DAPI) fluorescence microscopy and by inoculating Microcystis cultures into LB and tryptic soy broth (TSB) media and monitoring for the development of turbidity after 3 to 4 weeks.
The experimental cultures were grown in 1-L glass Pyrex bottles at 24.4°C (average in July to August of 2014 to 2017) and 330 μmol photons/m2/s on a 12-h L:D cycle (average photosynthetically active radiation [PAR] intensity at 0.5-m depth in Lake Erie during July to August of 2017 as determined from approximately biweekly hyperspectral profiles) for 12 to 14 days in a Caron plant growth chamber (model 7311-50; Caron, Marietta, OH). The growth medium was BG-11 2N. The positions of the bottles were randomized to correct for potential differences in light intensity across incubator shelving. Cell densities and H2O2 concentrations were monitored every other day. Cell density was measured via cell counts under a compound microscope using a Reichert Bright-Line hemacytometer (Hausser Scientific, Horsham, PA). Maximum growth rates were determined by taking the first derivative of a spline curve fit to the cell density data of each biological replicate (average R2 = 0.994 ± 0.006, 95% confidence interval).
H2O2 concentration was measured using the chemiluminescent reaction of the conjugate base of hydrogen peroxide with 10-methyl-9-(p-formylphenyl)acridinium carboxylate trifluoromethanesulfonate in a FeLume flow-injection analysis (114). Standard additions of a nominal 200 μM H2O2 solution were added to each sample to correct for matrix effects (final nominal concentrations of added standard were 0, 500, and 750 nM). The concentration of the H2O2 standard solution was measured from its absorbance at 240 nm in a 5-cm quartz cuvette and the molar absorptivity of H2O2 (38.1 M−1 s−1) (114). A new standard solution was prepared from a 30% H2O2 stock solution on each day measurements were performed. Decay of the standard additions during the flow-injection analysis was used to confirm H2O2 degradation by sodium pyruvate-treated samples. Signal decay was monitored by taking 4 replicate injections of each sample, and the normalized signal decay was calculated as the difference in the peak integrals of the chemiluminescent signal in the first and final replicate injections divided by the peak integral of the first injection.
Sodium pyruvate was used as an H2O2 scavenger in the cell culture experiments because bovine liver catalase was not appropriate for these experiments. The light levels used to grow the Microcystis strains resulted in significant reduction of catalase activity within 4 to 5 h (Fig. S8 in the supplemental material) (9, 30).
Scripts and data availability.
All custom bioinformatics scripts and pipelines used in this study can be found on the geomicrobiology lab GitHub page at https://github.com/Geo-omics/scripts. All read data sets are publicly available in NCBI SRA under BioSample accession numbers: SAMN09102072 to SAMN09102087. All metagenomic assemblies were submitted to IMG and are publicly available Gold Study ID Gs0113966. The dereplicated MAG sequences are deposited in NCBI under BioProject no. PRJNA464361 (see supplemental file 2 for how accession numbers are assigned to specific bins and assemblies). The R package growthrates v. 0.8.1 (https://github.com/tpetzoldt/growthrates) was used to calculate growth rates, and Welch’s t tests were computed with base R v. 4.0.2. Data tables and analysis code are available on the geomicrobiology lab GitHub page at https://github.com/Geo-omics/Heterotrophic-Bacteria-Dominate-Catalase-Expression-During-Microcystis-Blooms.
ACKNOWLEDGMENTS
We thank the University of Michigan Water Center, the Cooperative Institute of Great Lakes Research (CIGLR), the Environmental Protection Agency Great Lakes Restoration Initiative, and National Science Foundation grant OCE 1736629 for funding this research.
We also thank Duane Gossiaux, Paul Den Uyl, Dack Stuart, Steve Ruberg, and Sarah Page for field support; Dack Stuart and Steve Ruberg for providing light attenuation data; Kevin Meyer for assistance with metagenomic downsampling and assembly; and Robert Hein for bioinformatics support. Vincent J. Denef contributed to the conceptual design of the field sampling and provided valuable comments on the manuscript.
D.J.S. was supported by student fellowships from CIGLR and the University of Michigan Rackham Graduate School. Field sampling was conducted in collaboration with NOAA Great Lakes Environmental Research Lab’s (NOAA-GLERL) weekly HABs monitoring program. Funding was awarded to the Cooperative Institute for Great Lakes Research (CIGLR) through the NOAA Cooperative Agreement with the University of Michigan (NA17OAR4320152). This is CIGLR contribution number 1180.
Footnotes
For a companion article on this topic, see https://doi.org/10.1128/AEM.01803-21.
Supplemental material is available online only.
Contributor Information
Gregory J. Dick, Email: gdick@umich.edu.
Hideaki Nojiri, University of Tokyo.
ADDENDUM IN PROOF
While the current paper was in press, a modeling study was published that proposes the different H2O2 defense strategies of toxigenic and nontoxigenic Microcystis strains, and their differing susceptibility to nitrogen limitation, influences the strain composition of Microcystis blooms in Lake Erie (115). While the results of the Hellweger et al. paper are inconsistent with our finding that H2O2 at environmentally relevant concentrations does not impact Microcystis strains according to their ability to produce microcystins, we note two important caveats. First, in contrast to Hellweger et al., the current paper did not consider the role of nitrogen availability, as all experiments were conducted under nitrogen replete conditions. Second, while H2O2 concentrations in the current study were in the range of natural conditions, the sources and sinks of H2O2 in our lab experiments differed compared to those in the field, where the main sources of H2O2 are photochemical production and biological production by bacteria other than Microcystis (116). In the lab the sources and sinks of H2O2 included photochemical production and decay from media constituents (not present in the field) along with biological production and decay from Microcystis. Thus, different dynamics of H2O2 production and decay in natural settings could impart greater fitness costs to Microcystis, and varying nitrogen availability could differentially affect the growth of toxigenic versus nontoxigenic strains as suggested by the model in Hellweger et al. (115). The Smith (116) and Hellweger et al. (115) findings highlight the need for better understanding of the physiological diversity of Microcystis strains.
REFERENCES
- 1.Seymour JR, Amin SA, Raina J-B, Stocker R. 2017. Zooming in on the phycosphere: the ecological interface for phytoplankton-bacteria interactions. Nat Microbiol 2:17065. 10.1038/nmicrobiol.2017.65. [DOI] [PubMed] [Google Scholar]
- 2.Imlay JA. 2003. Pathways of oxidative damage. Annu Rev Microbiol 57:395–418. 10.1146/annurev.micro.57.030502.090938. [DOI] [PubMed] [Google Scholar]
- 3.Latifi A, Ruiz M, Zhang C-C. 2009. Oxidative stress in cyanobacteria. FEMS Microbiol Rev 33:258–278. 10.1111/j.1574-6976.2008.00134.x. [DOI] [PubMed] [Google Scholar]
- 4.Imlay JA. 2019. Where in the world do bacteria experience oxidative stress? Environ Microbiol 21:521–530. 10.1111/1462-2920.14445. [DOI] [PMC free article] [PubMed] [Google Scholar]
- 5.Mas A, Jamshidi S, Lagadeuc Y, Eveillard D, Vandenkoornhuyse P. 2016. Beyond the black queen hypothesis. ISME J 10:2085–2091. 10.1038/ismej.2016.22. [DOI] [PMC free article] [PubMed] [Google Scholar]
- 6.Morris JJ. 2015. Black Queen evolution: the role of leakiness in structuring microbial communities. Trends Genet 31:475–482. 10.1016/j.tig.2015.05.004. [DOI] [PubMed] [Google Scholar]
- 7.Zinser ER. 2018. Cross-protection from hydrogen peroxide by helper microbes: the impacts on the cyanobacterium Prochlorococcus and other beneficiaries in marine communities. Environ Microbiol Rep 10:399–411. 10.1111/1758-2229.12625. [DOI] [PubMed] [Google Scholar]
- 8.Kim J-G, Park S-J, Sinninghe Damsté JS, Schouten S, Rijpstra WIC, Jung M-Y, Kim S-J, Gwak J-H, Hong H, Si O-J, Lee S, Madsen EL, Rhee S-K. 2016. Hydrogen peroxide detoxification is a key mechanism for growth of ammonia-oxidizing archaea. Proc Natl Acad Sci USA 113:7888–7893. 10.1073/pnas.1605501113. [DOI] [PMC free article] [PubMed] [Google Scholar]
- 9.Morris JJ, Johnson ZI, Szul MJ, Keller M, Zinser ER. 2011. Dependence of the cyanobacterium Prochlorococcus on hydrogen peroxide scavenging microbes for growth at the ocean's surface. PLoS One 6:e16805. 10.1371/journal.pone.0016805. [DOI] [PMC free article] [PubMed] [Google Scholar]
- 10.Morris JJ, Kirkegaard R, Szul MJ, Johnson ZI, Zinser ER. 2008. Facilitation of robust growth of Prochlorococcus colonies and dilute liquid cultures by “helper” heterotrophic bacteria. Appl Environ Microbiol 74:4530–4534. 10.1128/AEM.02479-07. [DOI] [PMC free article] [PubMed] [Google Scholar]
- 11.Scanlan DJ, Ostrowski M, Mazard S, Dufresne A, Garczarek L, Hess WR, Post AF, Hagemann M, Paulsen I, Partensky F. 2009. Ecological genomics of marine picocyanobacteria. Microbiol Mol Biol Rev 73:249–299. 10.1128/MMBR.00035-08. [DOI] [PMC free article] [PubMed] [Google Scholar]
- 12.Bayer B, Pelikan C, Bittner MJ, Reinthaler T, Könneke M, Herndl GJ, Offre P. 2019. Proteomic response of three marine ammonia-oxidizing archaea to hydrogen peroxide and their metabolic interactions with a heterotrophic alphaproteobacterium. mSystems 4:e00181-19. 10.1128/mSystems.00181-19. [DOI] [PMC free article] [PubMed] [Google Scholar]
- 13.Seaver LC, Imlay JA. 2001. Hydrogen peroxide fluxes and compartmentalization inside growing Escherichia coli. J Bacteriol 183:7182–7189. 10.1128/JB.183.24.7182-7189.2001. [DOI] [PMC free article] [PubMed] [Google Scholar]
- 14.Morris JJ, Lenski RE, Zinser ER. 2012. The Black Queen Hypothesis: evolution of dependencies through adaptive gene loss. mBio 3:e00036-12. 10.1128/mBio.00036-12. [DOI] [PMC free article] [PubMed] [Google Scholar]
- 15.Paerl HW, Otten TG. 2013. Blooms bite the hand that feeds them. Science 342:433–434. 10.1126/science.1245276. [DOI] [PubMed] [Google Scholar]
- 16.Paerl HW, Paul VJ. 2012. Climate change: links to global expansion of harmful cyanobacteria. Water Res 46:1349–1363. 10.1016/j.watres.2011.08.002. [DOI] [PubMed] [Google Scholar]
- 17.Roegner AF, Brena B, González-Sapienza G, Puschner B. 2014. Microcystins in potable surface waters: toxic effects and removal strategies. J Appl Toxicol 34:441–457. 10.1002/jat.2920. [DOI] [PubMed] [Google Scholar]
- 18.Huisman J, Codd GA, Paerl HW, Ibelings BW, Verspagen JM, Visser PM. 2018. Cyanobacterial blooms. Nat Rev Microbiol 16:471–483. 10.1038/s41579-018-0040-1. [DOI] [PubMed] [Google Scholar]
- 19.Harke MJ, Steffen MM, Gobler CJ, Otten TG, Wilhelm SW, Wood SA, Paerl HW. 2016. A review of the global ecology, genomics, and biogeography of the toxic cyanobacterium, Microcystis spp. Harmful Algae 54:4–20. 10.1016/j.hal.2015.12.007. [DOI] [PubMed] [Google Scholar]
- 20.Zilliges Y, Kehr J-C, Meissner S, Ishida K, Mikkat S, Hagemann M, Kaplan A, Börner T, Dittmann E. 2011. The cyanobacterial hepatotoxin microcystin binds to proteins and increases the fitness of Microcystis under oxidative stress conditions. PLoS One 6:e17615. 10.1371/journal.pone.0017615. [DOI] [PMC free article] [PubMed] [Google Scholar]
- 21.Cooper WJ, Lean D, Carey J. 1989. Spatial and temporal patterns of hydrogen peroxide in lake waters. Can J Fish Aquat Sci 46:1227–1231. 10.1139/f89-158. [DOI] [Google Scholar]
- 22.Häkkinen PJ, Anesio AM, Granéli W. 2004. Hydrogen peroxide distribution, production, and decay in boreal lakes. Can J Fish Aquat Sci 61:1520–1527. 10.1139/f04-098. [DOI] [Google Scholar]
- 23.Marsico RM, Schneider RJ, Voelker BM, Zhang T, Diaz JM, Hansel CM, Ushijima S. 2015. Spatial and temporal variability of widespread dark production and decay of hydrogen peroxide in freshwater. Aquat Sci 77:523–533. 10.1007/s00027-015-0399-2. [DOI] [Google Scholar]
- 24.Ma L, Calfee BC, Morris JJ, Johnson ZI, Zinser ER. 2018. Degradation of hydrogen peroxide at the ocean’s surface: the influence of the microbial community on the realized thermal niche of Prochlorococcus. ISME J 12:473–484. 10.1038/ismej.2017.182. [DOI] [PMC free article] [PubMed] [Google Scholar]
- 25.Cory RM, Davis T, Dick G, Johengen T, Denef VJ, Berry M, Page S, Yuhas K, Watson S, Kling GW. 2017. Corrigendum: seasonal dynamics in dissolved organic matter, hydrogen peroxide, and cyanobacterial blooms in Lake Erie. Front Mar Sci 4:377. 10.3389/fmars.2017.00377. [DOI] [Google Scholar]
- 26.Cory RM, Davis TW, Dick GJ, Johengen T, Denef VJ, Berry MA, Page SE, Watson SB, Yuhas K, Kling GW. 2016. Seasonal dynamics in dissolved organic matter, hydrogen peroxide, and cyanobacterial blooms in Lake Erie. Front Mar Sci 3:54. [Google Scholar]
- 27.Dziallas C, Grossart H-P. 2011. Increasing oxygen radicals and water temperature select for toxic Microcystis sp. PLoS One 6:e25569. 10.1371/journal.pone.0025569. [DOI] [PMC free article] [PubMed] [Google Scholar]
- 28.Schuurmans JM, Brinkmann BW, Makower AK, Dittmann E, Huisman J, Matthijs HC. 2018. Microcystin interferes with defense against high oxidative stress in harmful cyanobacteria. Harmful Algae 78:47–55. 10.1016/j.hal.2018.07.008. [DOI] [PubMed] [Google Scholar]
- 29.Kawasaki K, Kamagata Y. 2017. Phosphate-catalyzed hydrogen peroxide formation from agar, gellan, and κ-carrageenan and recovery of microbial cultivability via catalase and pyruvate. Appl Environ Microbiol 83:e01366-17. 10.1128/AEM.01366-17. [DOI] [PMC free article] [PubMed] [Google Scholar]
- 30.Morris JJ, Zinser ER. 2013. Continuous hydrogen peroxide production by organic buffers in phytoplankton culture media. J Phycol 49:1223–1228. 10.1111/jpy.12123. [DOI] [PubMed] [Google Scholar]
- 31.Piel T, Sandrini G, White E, Xu T, Schuurmans JM, Huisman J, Visser PM. 2019. Suppressing cyanobacteria with hydrogen peroxide is more effective at high light intensities. Toxins 12:18–20. 10.3390/toxins12010018. [DOI] [PMC free article] [PubMed] [Google Scholar]
- 32.Ding Y, Gan N, Li J, Sedmak B, Song L. 2012. Hydrogen peroxide induces apoptotic-like cell death in Microcystis aeruginosa (Chroococcales, Cyanobacteria) in a dose-dependent manner. Phycologia 51:567–575. 10.2216/11-107.1. [DOI] [Google Scholar]
- 33.Lürling M, Meng D, Faassen EJ. 2014. Effects of hydrogen peroxide and ultrasound on biomass reduction and toxin release in the cyanobacterium, Microcystis aeruginosa. Toxins (Basel) 6:3260–3280. 10.3390/toxins6123260. [DOI] [PMC free article] [PubMed] [Google Scholar]
- 34.Daniel E, Weiss G, Murik O, Sukenik A, Lieman-Hurwitz J, Kaplan A. 2019. The response of Microcystis aeruginosa strain MGK to a single or two consecutive H2O2 applications. Environ Microbiol Rep 11:621–629. 10.1111/1758-2229.12789. [DOI] [PubMed] [Google Scholar]
- 35.Kim M, Shin B, Lee J, Park HY, Park W. 2019. Culture-independent and culture-dependent analyses of the bacterial community in the phycosphere of cyanobloom-forming Microcystis aeruginosa. Sci Rep 9:20416. 10.1038/s41598-019-56882-1. [DOI] [PMC free article] [PubMed] [Google Scholar]
- 36.Mikula P, Zezulka S, Jancula D, Marsalek B. 2012. Metabolic activity and membrane integrity changes in Microcystis aeruginosa - new findings on hydrogen peroxide toxicity in cyanobacteria. Eur J Phycol 47:195–206. 10.1080/09670262.2012.687144. [DOI] [Google Scholar]
- 37.Gao L, Pan X, Zhang D, Mu S, Lee D-J, Halik U. 2015. Extracellular polymeric substances buffer against the biocidal effect of H2O2 on the bloom-forming cyanobacterium Microcystis aeruginosa. Water Res 69:51–58. 10.1016/j.watres.2014.10.060. [DOI] [PubMed] [Google Scholar]
- 38.Dick GJ, Duhaime MB, Evans JT, Errera RM, Godwin C, Kharbush JJ, Nitschky HS, Powers MA, Vanderploeg HA, Schmidt KC, Smith DJ, Yancey CE, Zwiers CC, Denef VJ. 2021. The genetic and ecophysiological diversity of Microcystis. Environ Microbiol 23:7278–7313. 10.1111/1462-2920.15615. [DOI] [PubMed] [Google Scholar]
- 39.Weenink EFJ, Matthijs HCP, Schuurmans JM, Piel T, van Herk MJ, Sigon CAM, Visser PM, Huisman J. 2021. Interspecific protection against oxidative stress: green algae protect harmful cyanobacteria against hydrogen peroxide. Environ Microbiol 23:2404–2419. 10.1111/1462-2920.15429. [DOI] [PMC free article] [PubMed] [Google Scholar]
- 40.Moffett JW, Zajiriou OC. 1990. An investigation of hydrogen peroxide chemistry in surface waters of Vineyard Sound with H218O2 and 18O2. Limnol Oceanogr 35:1221–1229. 10.4319/lo.1990.35.6.1221. [DOI] [Google Scholar]
- 41.Zinser ER. 2018. The microbial contribution to reactive oxygen species dynamics in marine ecosystems. Environ Microbiol Rep 10:412–427. 10.1111/1758-2229.12626. [DOI] [PubMed] [Google Scholar]
- 42.Steffen MM, Davis TW, McKay RML, Bullerjahn GS, Krausfeldt LE, Stough JMA, Neitzey ML, Gilbert NE, Boyer GL, Johengen TH, Gossiaux DC, Burtner AM, Palladino D, Rowe MD, Dick GJ, Meyer KA, Levy S, Boone BE, Stumpf RP, Wynne TT, Zimba PV, Gutierrez D, Wilhelm SW. 2017. Ecophysiological examination of the Lake Erie Microcystis bloom in 2014: linkages between biology and the water supply shutdown of Toledo, OH. Environ Sci Technol 51:6745–6755. 10.1021/acs.est.7b00856. [DOI] [PubMed] [Google Scholar]
- 43.Berry MA, Davis TW, Cory RM, Duhaime MB, Johengen TH, Kling GW, Marino JA, Den Uyl PA, Gossiaux D, Dick GJ, Denef VJ. 2017. Cyanobacterial harmful algal blooms are a biological disturbance to Western Lake Erie bacterial communities. Environ Microbiol 19:1149–1162. 10.1111/1462-2920.13640. [DOI] [PubMed] [Google Scholar]
- 44.Mishra S, Imlay J. 2012. Why do bacteria use so many enzymes to scavenge hydrogen peroxide? Arch Biochem Biophys 525:145–160. 10.1016/j.abb.2012.04.014. [DOI] [PMC free article] [PubMed] [Google Scholar]
- 45.Khademian M, Imlay JA. 2017. Escherichia coli cytochrome c peroxidase is a respiratory oxidase that enables the use of hydrogen peroxide as a terminal electron acceptor. Proc Natl Acad Sci USA 114:E6922–E6931. 10.1073/pnas.1701587114. [DOI] [PMC free article] [PubMed] [Google Scholar]
- 46.Price MN, Arkin AP. 2017. PaperBLAST: text mining papers for information about homologs. mSystems 2:e00039-17. 10.1128/mSystems.00039-17. [DOI] [PMC free article] [PubMed] [Google Scholar]
- 47.Morris JJ, Johnson ZI, Wilhelm SW, Zinser ER. 2016. Diel regulation of hydrogen peroxide defenses by open ocean microbial communities. J Plankton Res 38:1103–1114. 10.1093/plankt/fbw016. [DOI] [Google Scholar]
- 48.Perelman A, Uzan A, Hacohen D, Schwarz R. 2003. Oxidative stress in Synechococcus sp. strain PCC 7942: various mechanisms for H2O2 detoxification with different physiological roles. J Bacteriol 185:3654–3660. 10.1128/JB.185.12.3654-3660.2003. [DOI] [PMC free article] [PubMed] [Google Scholar]
- 49.Cosgrove K, Coutts G, Jonsson M, Tarkowski A, Kokai-Kun JF, Mond JJ, Foster SJ. 2007. Catalase (KatA) and alkyl hydroperoxide reductase (AhpC) have compensatory roles in peroxide stress resistance and are required for survival, persistence, and nasal colonization in Staphylococcus aureus. J Bacteriol 189:1025–1035. 10.1128/JB.01524-06. [DOI] [PMC free article] [PubMed] [Google Scholar]
- 50.Seaver LC, Imlay JA. 2001. Alkyl hydroperoxide reductase is the primary scavenger of endogenous hydrogen peroxide in Escherichia coli. J Bacteriol 183:7173–7181. 10.1128/JB.183.24.7173-7181.2001. [DOI] [PMC free article] [PubMed] [Google Scholar]
- 51.Tichy M, Vermaas W. 1999. In vivo role of catalase-peroxidase in Synechocystis sp. strain PCC 6803. J Bacteriol 181:1875–1882. 10.1128/JB.181.6.1875-1882.1999. [DOI] [PMC free article] [PubMed] [Google Scholar]
- 52.Kurmayer R, Christiansen G, Chorus I. 2003. The abundance of microcystin-producing genotypes correlates positively with colony size in Microcystis sp. and determines its microcystin net production in Lake Wannsee. Appl Environ Microbiol 69:787–795. 10.1128/AEM.69.2.787-795.2003. [DOI] [PMC free article] [PubMed] [Google Scholar]
- 53.Chaffin JD, Bridgeman TB, Heckathorn SA, Mishra S. 2011. Assessment of Microcystis growth rate potential and nutrient status across a trophic gradient in western Lake Erie. J Great Lakes Res 37:92–100. 10.1016/j.jglr.2010.11.016. [DOI] [Google Scholar]
- 54.Davis TW, Bullerjahn GS, Tuttle T, McKay RM, Watson SB. 2015. Effects of increasing nitrogen and phosphorus concentrations on phytoplankton community growth and toxicity during Planktothrix blooms in Sandusky Bay, Lake Erie. Environ Sci Technol 49:7197–7207. 10.1021/acs.est.5b00799. [DOI] [PubMed] [Google Scholar]
- 55.Ouellette AJ, Handy SM, Wilhelm SW. 2006. Toxic Microcystis is widespread in Lake Erie: PCR detection of toxin genes and molecular characterization of associated cyanobacterial communities. Microb Ecol 51:154–165. 10.1007/s00248-004-0146-z. [DOI] [PubMed] [Google Scholar]
- 56.Davis TW, Watson SB, Rozmarynowycz MJ, Ciborowski JJ, McKay RM, Bullerjahn GS. 2014. Phylogenies of microcystin-producing cyanobacteria in the lower Laurentian Great Lakes suggest extensive genetic connectivity. PLoS One 9:e106093. 10.1371/journal.pone.0106093. [DOI] [PMC free article] [PubMed] [Google Scholar]
- 57.Bernroitner M, Zamocky M, Furtmüller PG, Peschek GA, Obinger C. 2009. Occurrence, phylogeny, structure, and function of catalases and peroxidases in cyanobacteria. J Exp Bot 60:423–440. 10.1093/jxb/ern309. [DOI] [PubMed] [Google Scholar]
- 58.Lopalco A, Dalwadi G, Niu S, Schowen RL, Douglas J, Stella VJ. 2016. Mechanism of decarboxylation of pyruvic acid in the presence of hydrogen peroxide. J Pharm Sci 105:705–713. 10.1002/jps.24653. [DOI] [PMC free article] [PubMed] [Google Scholar]
- 59.Coe A, Ghizzoni J, LeGault K, Biller S, Roggensack SE, Chisholm SW. 2016. Survival of Prochlorococcus in extended darkness. Limnol Oceanogr 61:1375–1388. 10.1002/lno.10302. [DOI] [Google Scholar]
- 60.Kim M, Kim W, Lee Y, Park W. 2021. Linkage between bacterial community-mediated hydrogen peroxide detoxification and the growth of Microcystis aeruginosa. Water Res 207:117784. 10.1016/j.watres.2021.117784. [DOI] [PubMed] [Google Scholar]
- 61.Dittmann E, Neilan BA, Erhard M, Von Döhren H, Börner T. 1997. Insertional mutagenesis of a peptide synthetase gene that is responsible for hepatotoxin production in the cyanobacterium Microcystis aeruginosa PCC 7806. Mol Microbiol 26:779–787. 10.1046/j.1365-2958.1997.6131982.x. [DOI] [PubMed] [Google Scholar]
- 62.Meissner S, Steinhauser D, Dittmann E. 2015. Metabolomic analysis indicates a pivotal role of the hepatotoxin microcystin in high light adaptation of Microcystis. Environ Microbiol 17:1497–1509. 10.1111/1462-2920.12565. [DOI] [PubMed] [Google Scholar]
- 63.Barchewitz T, Guljamow A, Meissner S, Timm S, Henneberg M, Baumann O, Hagemann M, Dittmann E. 2019. Non-canonical localization of RubisCO under high-light conditions in the toxic cyanobacterium Microcystis aeruginosa PCC7806. Environ Microbiol 21:4836–4851. 10.1111/1462-2920.14837. [DOI] [PubMed] [Google Scholar]
- 64.Dittmann E, Erhard M, Kaebernick M, Scheler C, Neilan BA, von Döhren H, Börner T. 2001. Altered expression of two light-dependent genes in a microcystin-lacking mutant of Microcystis aeruginosa PCC 7806. Microbiology 147:3113–3119. 10.1099/00221287-147-11-3113. [DOI] [PubMed] [Google Scholar]
- 65.Vézie C, Rapala J, Vaitomaa J, Seitsonen J, Sivonen K. 2002. Effect of nitrogen and phosphorus on growth of toxic and nontoxic Microcystis strains and on intracellular microcystin concentrations. Microb Ecol 43:443–454. 10.1007/s00248-001-0041-9. [DOI] [PubMed] [Google Scholar]
- 66.Orr PT, Jones GJ. 1998. Relationship between microcystin production and cell division rates in nitrogen-limited Microcystis aeruginosa cultures. Limnol Oceanogr 43:1604–1614. 10.4319/lo.1998.43.7.1604. [DOI] [Google Scholar]
- 67.Oh H-M, Lee SJ, Jang M-H, Yoon B-D. 2000. Microcystin production by Microcystis aeruginosa in a phosphorus-limited chemostat. Appl Environ Microbiol 66:176–179. 10.1128/AEM.66.1.176-179.2000. [DOI] [PMC free article] [PubMed] [Google Scholar]
- 68.Long BM, Jones GJ, Orr PT. 2001. Cellular microcystin content in N-limited Microcystis aeruginosa can be predicted from growth rate. Appl Environ Microbiol 67:278–283. 10.1128/AEM.67.1.278-283.2001. [DOI] [PMC free article] [PubMed] [Google Scholar]
- 69.Forni C, Telo’ FR, Caiola MG. 1997. Comparative analysis of the polysaccharides produced by different species of Microcystis (Chroococcales, Cyanophyta). Phycologia 36:181–185. 10.2216/i0031-8884-36-3-181.1. [DOI] [Google Scholar]
- 70.Alexova R, Haynes PA, Ferrari BC, Neilan BA. 2011. Comparative protein expression in different strains of the bloom-forming cyanobacterium Microcystis aeruginosa. Mol Cell Proteomics 10:M110.003749. 10.1074/mcp.M110.003749. [DOI] [PMC free article] [PubMed] [Google Scholar]
- 71.Hosoya-Matsuda N, Motohashi K, Yoshimura H, Nozaki A, Inoue K, Ohmori M, Hisabori T. 2005. Anti-oxidative stress system in cyanobacteria: significance of type II peroxiredoxin and the role of 1-Cys peroxiredoxin in Synechocystis sp. strain PCC 6803. J Biol Chem 280:840–846. 10.1074/jbc.M411493200. [DOI] [PubMed] [Google Scholar]
- 72.Nogoceke E, Gommel DU, Kiess M, Kalisz HM, Flohé L. 1997. A unique cascade of oxidoreductases catalyses trypanothione-mediated peroxide metabolism in Crithidia fasciculata. Biol Chem 378:827–836. 10.1515/bchm.1997.378.8.827. [DOI] [PubMed] [Google Scholar]
- 73.Steffen MM, Dearth SP, Dill BD, Li Z, Larsen KM, Campagna SR, Wilhelm SW. 2014. Nutrients drive transcriptional changes that maintain metabolic homeostasis but alter genome architecture in Microcystis. ISME J 8:2080–2092. 10.1038/ismej.2014.78. [DOI] [PMC free article] [PubMed] [Google Scholar]
- 74.Drábková M, Admiraal W, Maršálek B. 2007. Combined exposure to hydrogen peroxide and light selective effects on cyanobacteria, green algae, and diatoms. Environ Sci Technol 41:309–314. 10.1021/es060746i. [DOI] [PubMed] [Google Scholar]
- 75.Sandrini G, Piel T, Xu T, White E, Qin H, Slot PC, Huisman J, Visser PM. 2020. Sensitivity to hydrogen peroxide of the bloom-forming cyanobacterium Microcystis PCC 7806 depends on nutrient availability. Harmful Algae 99:101916. 10.1016/j.hal.2020.101916. [DOI] [PubMed] [Google Scholar]
- 76.Tanaka T, Kawasaki K, Daimon S, Kitagawa W, Yamamoto K, Tamaki H, Tanaka M, Nakatsu CH, Kamagata Y. 2014. A hidden pitfall in the preparation of agar media undermines microorganism cultivability. Appl Environ Microbiol 80:7659–7666. 10.1128/AEM.02741-14. [DOI] [PMC free article] [PubMed] [Google Scholar]
- 77.Kim S, Kang I, Seo J-H, Cho J-C. 2019. Culturing the ubiquitous freshwater actinobacterial acI lineage by supplying a biochemical ‘helper’ catalase. ISME J 13:2252–2263. 10.1038/s41396-019-0432-x. [DOI] [PMC free article] [PubMed] [Google Scholar]
- 78.Plude JL, Parker DL, Schommer OJ, Timmerman RJ, Hagstrom SA, Joers JM, Hnasko R. 1991. Chemical characterization of polysaccharide from the slime layer of the cyanobacterium Microcystis flos-aquae C3-40. Appl Environ Microbiol 57:1696–1700. 10.1128/aem.57.6.1696-1700.1991. [DOI] [PMC free article] [PubMed] [Google Scholar]
- 79.Worm J, Søndergaard M. 1998. Dynamics of heterotrophic bacteria attached to Microcystis spp. (Cyanobacteria). Aquat Microb Ecol 14:19–28. 10.3354/ame014019. [DOI] [Google Scholar]
- 80.Brunberg A-K. 1999. Contribution of bacteria in the mucilage of Microcystis spp. (Cyanobacteria) to benthic and pelagic bacterial production in a hypereutrophic lake. FEMS Microbiol Ecol 29:13–22. 10.1111/j.1574-6941.1999.tb00594.x. [DOI] [Google Scholar]
- 81.Parveen B, Ravet V, Djediat C, Mary I, Quiblier C, Debroas D, Humbert JF. 2013. Bacterial communities associated with Microcystis colonies differ from free-living communities living in the same ecosystem. Environ Microbiol Rep 5:716–724. 10.1111/1758-2229.12071. [DOI] [PubMed] [Google Scholar]
- 82.Gobler CJ, Burkholder JM, Davis TW, Harke MJ, Johengen T, Stow CA, Van de Waal DB. 2016. The dual role of nitrogen supply in controlling the growth and toxicity of cyanobacterial blooms. Harmful Algae 54:87–97. 10.1016/j.hal.2016.01.010. [DOI] [PubMed] [Google Scholar]
- 83.Briand E, Escoffier N, Straub C, Sabart M, Quiblier C, Humbert J-F. 2009. Spatiotemporal changes in the genetic diversity of a bloom-forming Microcystis aeruginosa (cyanobacteria) population. ISME J 3:419–429. 10.1038/ismej.2008.121. [DOI] [PubMed] [Google Scholar]
- 84.Kardinaal WEA, Janse I, Kamst-van Agterveld M, Meima M, Snoek J, Mur LR, Huisman J, Zwart G, Visser PM. 2007. Microcystis genotype succession in relation to microcystin concentrations in freshwater lakes. Aquat Microb Ecol 48:1–12. 10.3354/ame048001. [DOI] [Google Scholar]
- 85.Winter JG, Palmer ME, Howell ET, Young JD. 2015. Long term changes in nutrients, chloride, and phytoplankton density in the nearshore waters of Lake Erie. J Great Lakes Res 41:145–155. 10.1016/j.jglr.2014.11.028. [DOI] [Google Scholar]
- 86.Jensen HS, Andersen FO. 1992. Importance of temperature, nitrate, and pH for phosphate release from aerobic sediments of four shallow, eutrophic lakes. Limnol Oceanogr 37:577–589. 10.4319/lo.1992.37.3.0577. [DOI] [Google Scholar]
- 87.Paerl HW, Xu H, McCarthy MJ, Zhu G, Qin B, Li Y, Gardner WS. 2011. Controlling harmful cyanobacterial blooms in a hyper-eutrophic lake (Lake Taihu, China): the need for a dual nutrient (N & P) management strategy. Water Res 45:1973–1983. 10.1016/j.watres.2010.09.018. [DOI] [PubMed] [Google Scholar]
- 88.McCarthy A, Chiang E, Schmidt ML, Denef VJ. 2015. RNA preservation agents and nucleic acid extraction method bias perceived bacterial community composition. PLoS One 10:e0121659. 10.1371/journal.pone.0121659. [DOI] [PMC free article] [PubMed] [Google Scholar]
- 89.Joshi N, Fass J. 2011. Sickle: a sliding-window, adaptive, quality-based trimming tool for FastQ files (version 1.33).
- 90.Peng Y, Leung HC, Yiu S-M, Chin FY. 2012. IDBA-UD: a de novo assembler for single-cell and metagenomic sequencing data with highly uneven depth. Bioinformatics 28:1420–1428. 10.1093/bioinformatics/bts174. [DOI] [PubMed] [Google Scholar]
- 91.Hug LA, Thomas BC, Sharon I, Brown CT, Sharma R, Hettich RL, Wilkins MJ, Williams KH, Singh A, Banfield JF. 2016. Critical biogeochemical functions in the subsurface are associated with bacteria from new phyla and little studied lineages. Environ Microbiol 18:159–173. 10.1111/1462-2920.12930. [DOI] [PubMed] [Google Scholar]
- 92.Li H, Durbin R. 2009. Fast and accurate short read alignment with Burrows–Wheeler transform. Bioinformatics 25:1754–1760. 10.1093/bioinformatics/btp324. [DOI] [PMC free article] [PubMed] [Google Scholar]
- 93.Li D, Liu C-M, Luo R, Sadakane K, Lam T-W. 2015. MEGAHIT: an ultra-fast single-node solution for large and complex metagenomics assembly via succinct de Bruijn graph. Bioinformatics 31:1674–1676. 10.1093/bioinformatics/btv033. [DOI] [PubMed] [Google Scholar]
- 94.Bushnell B. 2018. BBTools: a suite of fast, multithreaded bioinformatics tools designed for analysis of DNA and RNA sequence data. Joint Genome Institute, Berkeley, CA. [Google Scholar]
- 95.Langmead B, Salzberg SL. 2012. Fast gapped-read alignment with Bowtie 2. Nat Methods 9:357–359. 10.1038/nmeth.1923. [DOI] [PMC free article] [PubMed] [Google Scholar]
- 96.Dick GJ, Andersson AF, Baker BJ, Simmons SL, Thomas BC, Yelton AP, Banfield JF. 2009. Community-wide analysis of microbial genome sequence signatures. Genome Biol 10:R85. 10.1186/gb-2009-10-8-r85. [DOI] [PMC free article] [PubMed] [Google Scholar]
- 97.Alneberg J, Bjarnason BS, De Bruijn I, Schirmer M, Quick J, Ijaz UZ, Lahti L, Loman NJ, Andersson AF, Quince C. 2014. Binning metagenomic contigs by coverage and composition. Nat Methods 11:1144–1146. 10.1038/nmeth.3103. [DOI] [PubMed] [Google Scholar]
- 98.Kang DD, Li F, Kirton E, Thomas A, Egan R, An H, Wang Z. 2019. MetaBAT 2: an adaptive binning algorithm for robust and efficient genome reconstruction from metagenome assemblies. PeerJ 7:e7359. 10.7717/peerj.7359. [DOI] [PMC free article] [PubMed] [Google Scholar]
- 99.Laczny CC, Sternal T, Plugaru V, Gawron P, Atashpendar A, Margossian HH, Coronado S, Van der Maaten L, Vlassis N, Wilmes P. 2015. VizBin-an application for reference-independent visualization and human-augmented binning of metagenomic data. Microbiome 3:1. 10.1186/s40168-014-0066-1. [DOI] [PMC free article] [PubMed] [Google Scholar]
- 100.Sieber CM, Probst AJ, Sharrar A, Thomas BC, Hess M, Tringe SG, Banfield JF. 2018. Recovery of genomes from metagenomes via a dereplication, aggregation and scoring strategy. Nat Microbiol 3:836–843. 10.1038/s41564-018-0171-1. [DOI] [PMC free article] [PubMed] [Google Scholar]
- 101.Parks DH, Imelfort M, Skennerton CT, Hugenholtz P, Tyson GW. 2015. CheckM: assessing the quality of microbial genomes recovered from isolates, single cells, and metagenomes. Genome Res 25:1043–1055. 10.1101/gr.186072.114. [DOI] [PMC free article] [PubMed] [Google Scholar]
- 102.Eren AM, Esen ÖC, Quince C, Vineis JH, Morrison HG, Sogin ML, Delmont TO. 2015. Anvi’o: an advanced analysis and visualization platform for ‘omics data. PeerJ 3:e1319. 10.7717/peerj.1319. [DOI] [PMC free article] [PubMed] [Google Scholar]
- 103.Olm MR, Brown CT, Brooks B, Banfield JF. 2017. dRep: a tool for fast and accurate genomic comparisons that enables improved genome recovery from metagenomes through de-replication. ISME J 11:2864–2868. 10.1038/ismej.2017.126. [DOI] [PMC free article] [PubMed] [Google Scholar]
- 104.Kanehisa M, Sato Y, Morishima K. 2016. BlastKOALA and GhostKOALA: KEGG tools for functional characterization of genome and metagenome sequences. J Mol Biol 428:726–731. 10.1016/j.jmb.2015.11.006. [DOI] [PubMed] [Google Scholar]
- 105.Miller CS, Baker BJ, Thomas BC, Singer SW, Banfield JF. 2011. EMIRGE: reconstruction of full-length ribosomal genes from microbial community short read sequencing data. Genome Biol 12:R44. 10.1186/gb-2011-12-5-r44. [DOI] [PMC free article] [PubMed] [Google Scholar]
- 106.Altschul SF, Gish W, Miller W, Myers EW, Lipman DJ. 1990. Basic local alignment search tool. J Mol Biol 215:403–410. 10.1016/S0022-2836(05)80360-2. [DOI] [PubMed] [Google Scholar]
- 107.Pruesse E, Quast C, Knittel K, Fuchs BM, Ludwig W, Peplies J, Glöckner FO. 2007. SILVA: a comprehensive online resource for quality checked and aligned ribosomal RNA sequence data compatible with ARB. Nucleic Acids Res 35:7188–7196. 10.1093/nar/gkm864. [DOI] [PMC free article] [PubMed] [Google Scholar]
- 108.Wang Q, Garrity GM, Tiedje JM, Cole JR. 2007. Naive Bayesian classifier for rapid assignment of rRNA sequences into the new bacterial taxonomy. Appl Environ Microbiol 73:5261–5267. 10.1128/AEM.00062-07. [DOI] [PMC free article] [PubMed] [Google Scholar]
- 109.Schloss PD, Westcott SL, Ryabin T, Hall JR, Hartmann M, Hollister EB, Lesniewski RA, Oakley BB, Parks DH, Robinson CJ, Sahl JW, Stres B, Thallinger GG, Van Horn DJ, Weber CF. 2009. Introducing mothur: open-source, platform-independent, community-supported software for describing and comparing microbial communities. Appl Environ Microbiol 75:7537–7541. 10.1128/AEM.01541-09. [DOI] [PMC free article] [PubMed] [Google Scholar]
- 110.Huntemann M, Ivanova NN, Mavromatis K, Tripp HJ, Paez-Espino D, Palaniappan K, Szeto E, Pillay M, Chen I-MA, Pati A, Nielsen T, Markowitz VM, Kyrpides NC. 2015. The standard operating procedure of the DOE-JGI microbial genome annotation pipeline (MGAP v.4). Stand Genomic Sci 10:86. 10.1186/s40793-015-0077-y. [DOI] [PMC free article] [PubMed] [Google Scholar]
- 111.Markowitz VM, Chen I-MA, Palaniappan K, Chu K, Szeto E, Grechkin Y, Ratner A, Jacob B, Huang J, Williams P, Huntemann M, Anderson I, Mavromatis K, Ivanova NN, Kyrpides NC. 2012. IMG: the integrated microbial genomes database and comparative analysis system. Nucleic Acids Res 40:D115–D122. 10.1093/nar/gkr1044. [DOI] [PMC free article] [PubMed] [Google Scholar]
- 112.Rognes T, Flouri T, Nichols B, Quince C, Mahé F. 2016. VSEARCH: a versatile open source tool for metagenomics. PeerJ 4:e2584. 10.7717/peerj.2584. [DOI] [PMC free article] [PubMed] [Google Scholar]
- 113.Stanier R, Kunisawa R, Mandel M, Cohen-Bazire G. 1971. Purification and properties of unicellular blue-green algae (order Chroococcales). Bacteriol Rev 35:171–205. 10.1128/br.35.2.171-205.1971. [DOI] [PMC free article] [PubMed] [Google Scholar]
- 114.King DW, Cooper WJ, Rusak SA, Peake BM, Kiddle JJ, O’Sullivan DW, Melamed ML, Morgan CR, Theberge SM. 2007. Flow injection analysis of H2O2 in natural waters using acridinium ester chemiluminescence: method development and optimization using a kinetic model. Anal Chem 79:4169–4176. 10.1021/ac062228w. [DOI] [PubMed] [Google Scholar]
- 115.Hellweger FL, Martin RM, Eigemann F, Smith DJ, Dick GJ, Wilhelm SW. 2022. Models predict planned phosphorus load reduction will make Lake Erie more toxic. Science 376:1001–1005. [DOI] [PubMed] [Google Scholar]
- 116.Smith DJ. 2021. The Impact of Microbial Interactions and Hydrogen Peroxide on Western Lake Erie Cyanobacterial Blooms. PhD dissertation, University of Michigan, Ann Arbor, MI. 10.7302/1348. [DOI] [Google Scholar]
Associated Data
This section collects any data citations, data availability statements, or supplementary materials included in this article.
Supplementary Materials
Data Set S3. Download aem.02544-21-s0003.xlsx, XLSX file, 0.2 MB (182.8KB, xlsx)
Data Set S2. Download aem.02544-21-s0002.xlsx, XLSX file, 0.09 MB (92.7KB, xlsx)
Data Set S1. Download aem.02544-21-s0001.xlsx, XLSX file, 0.04 MB (38.7KB, xlsx)
Supplemental results and methods, Tables S1 and S2, and Fig. S1 to S8. Download aem.02544-21-s0004.pdf, PDF file, 0.6 MB (688.6KB, pdf)