Abstract
Improving sensitivity and spatial resolution in small animal Positron Emission Tomography imaging instrumentation constitutes one of the main goals of nuclear imaging research. These parameters are degraded by the presence of gaps between the detectors.
The present manuscript experimentally validates our prototype of an edge-less pre-clinical PET system based on a single LYSO:Ce annulus with an inner diameter of 62 mm and 10 outer facets of 26 × 52 mm2. Scintillation light is read out by arrays of 8 × 8 SiPMs coupled to the facets, using a projection readout of the rows and columns signals. The readout provides accurate Depth of Interaction (DOI). We have implemented a calibration that mitigates the DOI-dependency of the transaxial and axial impact coordinates, and the energy photopeak gain. An energy resolution of 23.4 ± 1.8% was determined. Average spatial resolution of 1.4 ± 0.2 and 1.3 ± 0.4 mm FWHM were achieved for the radial and axial directions, respectively. We found a peak sensitivity of 3.8% at the system center, and a maximum NECR at 40.6 kcps for 0.27 mCi. The image quality was evaluated using reconstructed images of an array of sources and the NEMA image quality phantom was also studied.
Keywords: Calibration, Monolithic scintillators, Positron emission tomography, Silicon photomultipliers
I. Introduction
Positron Emission Tomography (PET) is the molecular imaging technique of choice due to its significantly superior sensitivity when compared to other imaging modalities such as Single Photon Emission Tomography (SPECT) [1][2] or gamma cameras [3].
Most commercial PET scanners are composed of multiple detector blocks typically arranged in a cylindrical configuration to maximize detection area and geometrical sensitivity [4]–[7].
PET detector blocks are responsible for efficiently stopping and converting the incoming 511 keV annihilation photons into measurable electric signals that are later used for the image reconstruction process to provide a visual representation of the radiotracer distribution inside the object or patient under study.
In PET scanners based on the aforementioned modular approach, there are always unavoidable finite distances, called gaps, between detectors in both axial and transaxial planes [8]. The drawbacks associated to these gaps are twofold: first, they cause losses in the system ability to detect annihilation events, resulting in decreased sensitivity and negatively impacting the overall performance of the scanner; and second, modular detectors have edges and, regardless of the scintillator technology used (monolithic crystals or pixelated arrays -specifically for crystal pixel sizes smaller than the photosensor active area), they suffer from edge effects that degrade the spatial resolution toward those edges [9].
To mitigate these limitations, it has been already proposed to construct so-called edge-less PET scanners [10]–[12] in which the scintillation material is made of a single continuous piece instead of modular pieces attached together. This idea was first proposed in 1988; Genna and Smith described a SPECT design based on a single NaI(Tl) scintillation block of 31 cm in diameter [13]. Following this concept, a SPECT system using the same crystal type but with significantly smaller size was built with a field of view (FOV) of just 25.6 mm in diameter for imaging small rodents [14] and, a 26.5 cm diameter brain PET scanner, based on a single NaI(Tl) scintillator, was constructed and evaluated [15]. More recently, it was presented in a simulation study showing the feasibility of a PET scanner based on a continuous cylindrical scintillator shell designed for small animal or dedicated human imaging [16]. The reported system uses novel fast scintillation materials and the photosensors are coupled to both inner and outer faces of the cylinder. Finally, a cylindrical LYSO annulus of 58.5 and 48.5 mm, outer and inner diameters, respectively, was built and tested [17]. Supporting the edge-less idea, Stolin, et al., showed in another simulation study the image quality improvement of a LYSO tube with a cylindrical inner face of 50 mm in diameter and an external face composed of 12 facets [12].
In the present work we show the experimental realization and pilot tests of an edge-less small-animal PET insert following an earlier design study mostly based on simulations [8]. To simplify the complex electronics, we have decided to use a LYSO scintillator with an inner circular face but facetted outer face. As it will be described in detail below, it makes use of Silicon Photomultiplier (SiPM) photosensor technology mounted in a printed circuit board (PCB) compatible with the magnetic fields found in Magnetic Resonance Imaging (MRI) systems [18], together with a radiofrequency shield based on carbon fiber composites [19]. The experimental results of this work are reinforced with Monte Carlo simulations including both nuclear and optical processes. We present here the system performance in terms of 3D spatial and energy resolutions, system sensitivity, count rate capabilities and reconstructed image quality.
II. Materials and Methods
A. System architecture and data acquisition
Our design is based on a single LYSO:Ce (Lu1.8Y2SiO5:Ce) scintillator crystal that defines an axial length of 52 mm. The LYSO:Ce bolus was 62 mm in diameter and was fabricated by Proteus (Ohio, USA) [20]. A unique aspect of this design is the outer face of the annulus which was cut to generate 10 flat faces of 26 × 52 mm2 each, with a maximum crystal diameter of 84.1 mm (see Fig. 1(a)), thus the crystal thickness varies between 9 and 10 mm. All crystal faces of the annulus were polished, with the inner face and endcaps painted black (see Fig. 1(b)) to minimize undesired scintillation light reflections [21].
Fig. 1.
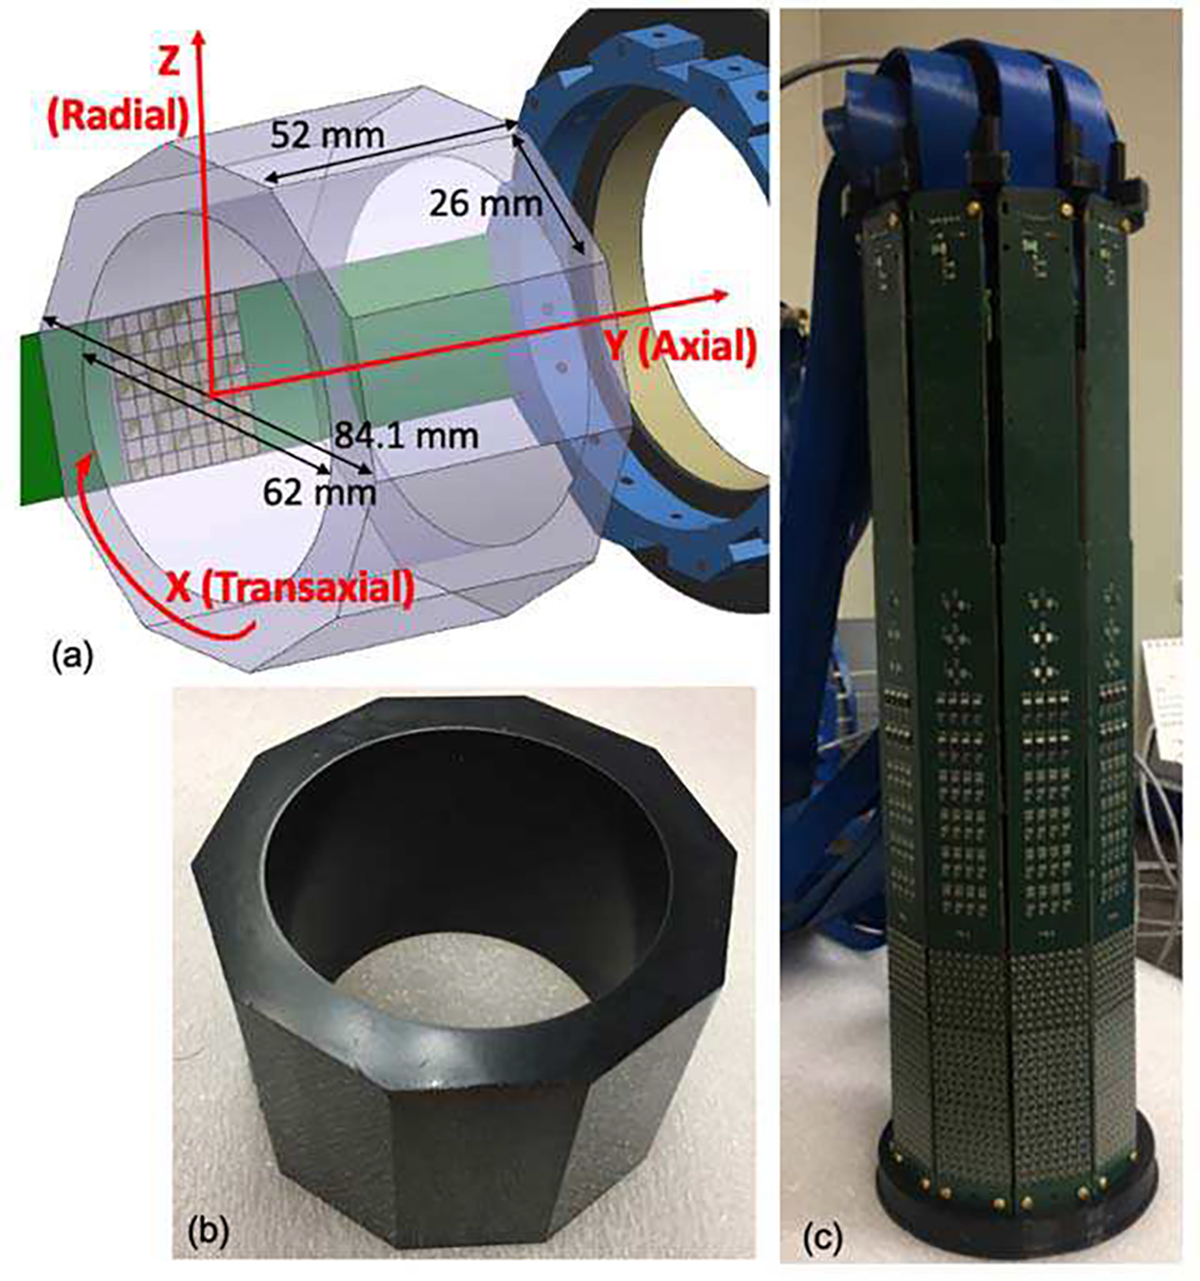
(a) Sketch showing the crystal dimensions and photosensor array position; (b) Photo of the scintillation crystal with black painted inner faces and endcaps (there is no paint on the outer faces); and (c) Photo of the whole PET scanner without the outer housing.
For the readout electronics, we designed PCBs (see Fig. 1(c)) with capability to allocate 3 arrays of 8 × 8 SiPM elements. In particular, we used S14161 (Hamamatsu Photonics, Japan) SiPM arrays with 50 μm cell size, an active area of 3 × 3 mm2, and a pitch of 3.2 mm. The photosensor array has dimensions of 25.8 × 25.8 mm2 matching well the facets of the scintillation ring and was coupled to the crystal using optical grease [20]. To simplify the characterization of the prototype, we have populated each PCB with only one SiPM array. The SiPM arrays were biased at 42 V and placed in the middle of the axial length of the crystal as depicted in Fig. 1(a). Thus, the axial Field of View (FOV) of the system is 25.8 mm. The row and column projection readout was implemented providing 8 + 8 analog output signals for each SiPM array.
All analog signals, the temperature reading signal (each detector block includes a temperature sensor) and trigger signal (determined as the sum of the row signals from a facet) are fed into a data acquisition (DAQ) system using multi-coaxial cabling. The DAQ system is based on 10 Analog to Digital Converters (ADC) with 12-bit precision and an integration window of 250 ns. The analog pulses have rise and decay times of 25–50 ns and 200–300 ns, respectively. Additionally, the system includes a custom-made trigger board that receives the trigger signal, determines its arrival time using a leading-edge discriminator and decides on the validation of an event accordingly to the programmed firmware (coincidence map) and coincidence window [19]. Each ADC is fed with 16 energy signals (8 column + 8 row signals).
The architecture of the acquisition system works in such a way that when a coincidence event is detected (within a 9 ns coincidence window), all ADC channels of the two involved arrays (8 column + 8 row signals) plus the adjacent ones at left and right, are sent to the workstation and processed. Thus, for every coincidence the projections of 48 rows and 48 columns are considered (see Fig. 2 (a)). Every detector has allowed coincidences with its five opposite blocks.
Fig. 2.
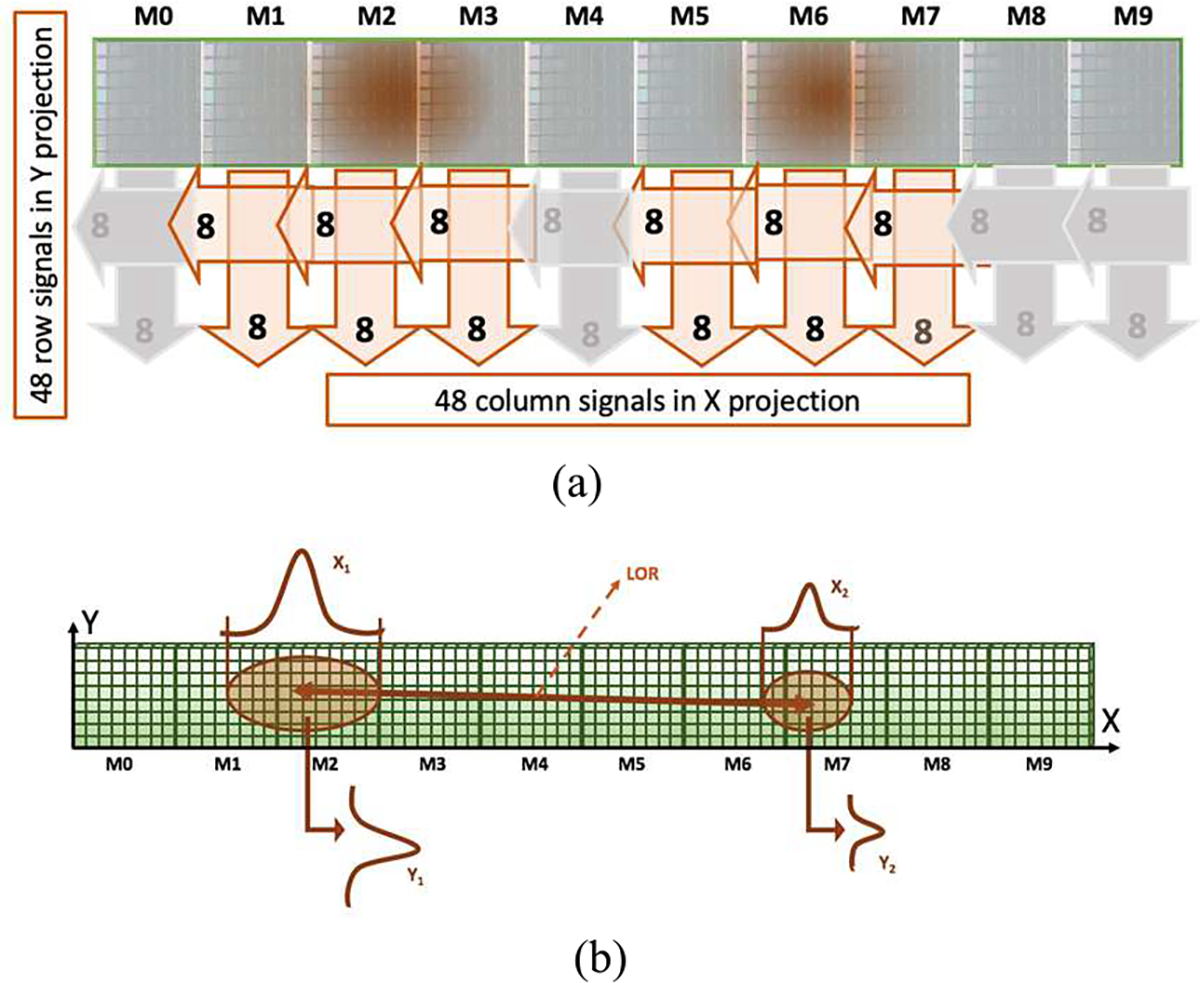
(a) Projection readout implemented providing 8 + 8 signals for each SiPM array. The dark areas represent the scintillation light generated due to the interaction of the annihilation photon with the scintillator material. In this example, the coincidence event has been detected by the arrays corresponding to M2 and M6. The signals of these arrays plus the signals from the adjacent ones (M1 and M3 for the event detected at M2; and M5 and M7 for the event detected at M6) are also processed. (b) x and y projections of a coincidence event. The xi coordinates (along the ring) are calculated as the projection of the columns while the yi coordinates (along the axial axis of the scanner) as the projections of the rows containing the maximum value of the distribution. Notice that both sketches show the tube unfolded.
In this configuration, the light distribution (LD) produced by each incident gamma-ray is shared among several SiPM. The detector readout is based on a highly multiplexed scheme (high capacitance noise), as previously mentioned, in which the photon timing information is obtained through the combination of several SiPMs and thus degraded. The temporal resolution of the system in the 2–3 ns scale which is not useful for time-of-flight (TOF) applications in rodents.
This PET design meets the requirements for operation inside high magnetic field as used in MRI. The PCBs have been designed, based on our previous experience, avoiding the presence of connectors and components containing ferromagnetic materials such that the generation of eddy currents induced by magnetic gradient fields is minimum. Moreover, they are placed between two carbon fiber structures reducing radiofrequency field (RF) cross-talk between the PET insert and the MRI RF. Specifically, the shielding consists on a Faraday-cage made out 3 overlapping carbon fiber sheets of approximately 200 μm thickness each, that helps to prevent electronic noise from both the B1 field and the Eddy currents arising from the switching gradient field. This is a design with high potential for MRI compatibility [19][23]. The inner diameter of the PET insert is roughly 60 mm which leaves plenty of space to accommodate the RF coil and animal. During data acquisition, the PET system was enclosed and kept at a stable temperature of 23°C using vortex tubes. The temperature was monitored using temperature sensors placed at the PCBs (near the SiPM arrays) which are read and used to generate a PID controller that manages the output air temperature [19].
Data was acquired in coincidence mode using different radioactive sources. The evaluation of the spatial resolution and system sensitivity were performed using 22Na small spherical sources with activities of ~515 kBq (0.25 mm in diameter) and ~290 kBq (1 mm in diameter), respectively. For imaging evaluation purposes, we used an array of 11×11 22Na sources (1 mm in diameter each) separated 4.6 mm and with a total activity of ~400 kBq. Additionally, 18F was used for the evaluation of count rates capabilities and image quality during the system evaluation.
B. Data processing: coincidence event identification
The digitized values of all SiPM rows and columns, the coincidence detection time (timestamps), and facet numbers (0–9) associated to the detection of a coincidence event are encoded in binary format and sent to the workstation. The estimation of the 3D photon impact coordinates, including depth of interaction (DOI) information, and energy consists on a three-step process as described below:
The projection of the 48 columns of SiPMs, containing transaxial information of the coincidence detection are merged together to estimate the transaxial coincidence coordinates, x1 and x2. Two sets of 8 rows projections (from the arrays containing x1 and x2) are used to obtain the axial coincidence coordinates, y1 and y2 as shown in Fig. 2 (b). Only those events for which |x1- x2| is larger than the distance defined by 24 SiPMs were considered.
The absolute maximum of the projected columns, which is close to the center of the light distribution (LD) of one event, is first obtained. The signal of 30 SiPMs (± 15 SiPMs on each side of the maximum) are considered to estimate x1. The second maximum is then found, and the same process is applied to estimate x2. For the impact position estimation, the digitized SiPM values were raised to the power of 2 (RTP method) [24], before calculation of the center of gravity (COG). The effect of including more or less SiPMs for the COG estimation, was studied ensuring the best trade-off between positioning and homogeneity in the flood maps. Then, y1 and y2 are estimated (RTP method) using SiPM projection values of the rows.
The energy is estimated as the sum of the projected value of the 8 rows of SiPMs belonging to x1 and x2 positions. The DOI coordinate (defined as z coordinate) is also calculated using these rows, as the ratio of the energy (E) to the maximum row value (Imax), E/Imax method [25].
C. Calibration methodology
Due to the finite size of the design in the axial direction, the LDs exhibit truncation in the y-axis (axial axis), thus impacting the yi calculation. Moreover, due to optical reflections at the facet joints (limit angle variances), there are some light losses along the x-axis (transaxial axis) that affect the estimation of the xi coordinates [26]. In addition, spatial variations in light collection loses due to optical coupling mismatches, photosensor efficiency or, scintillation light yield differences in different parts of the crystal require the calibration of the system.
The calibration method applied for this system is based on a computational geometry technique named Voronoi diagrams [21]. Voronoi diagrams divide the plane in regions, known as Voronoi cells, which are delimited by the point of the plane closest to the cell surroundings. The number of regions corresponds to the number of points contained in the plane which in our case are the calibration points. Figure 3 of reference [22] provides an example of a Voronoi diagram including description of the mathematical terminology.
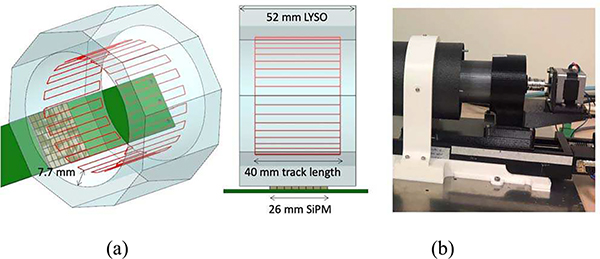
The calibration procedure is a two-step process. The first step, named Tube Calibration, consists of the generation of look-up-tables (LUTs) by acquiring calibration data placing the 22Na source (1 mm in diameter) at 7.7 mm from the inner face of the tube (see Fig. 3(a)). A matrix of 200 calibration positions was obtained acquiring data of the source at known positions in step of 5 mm across the x-axis and in steps of 4 mm across the y-axis (see Fig. 3(a)).
Fig. 3.
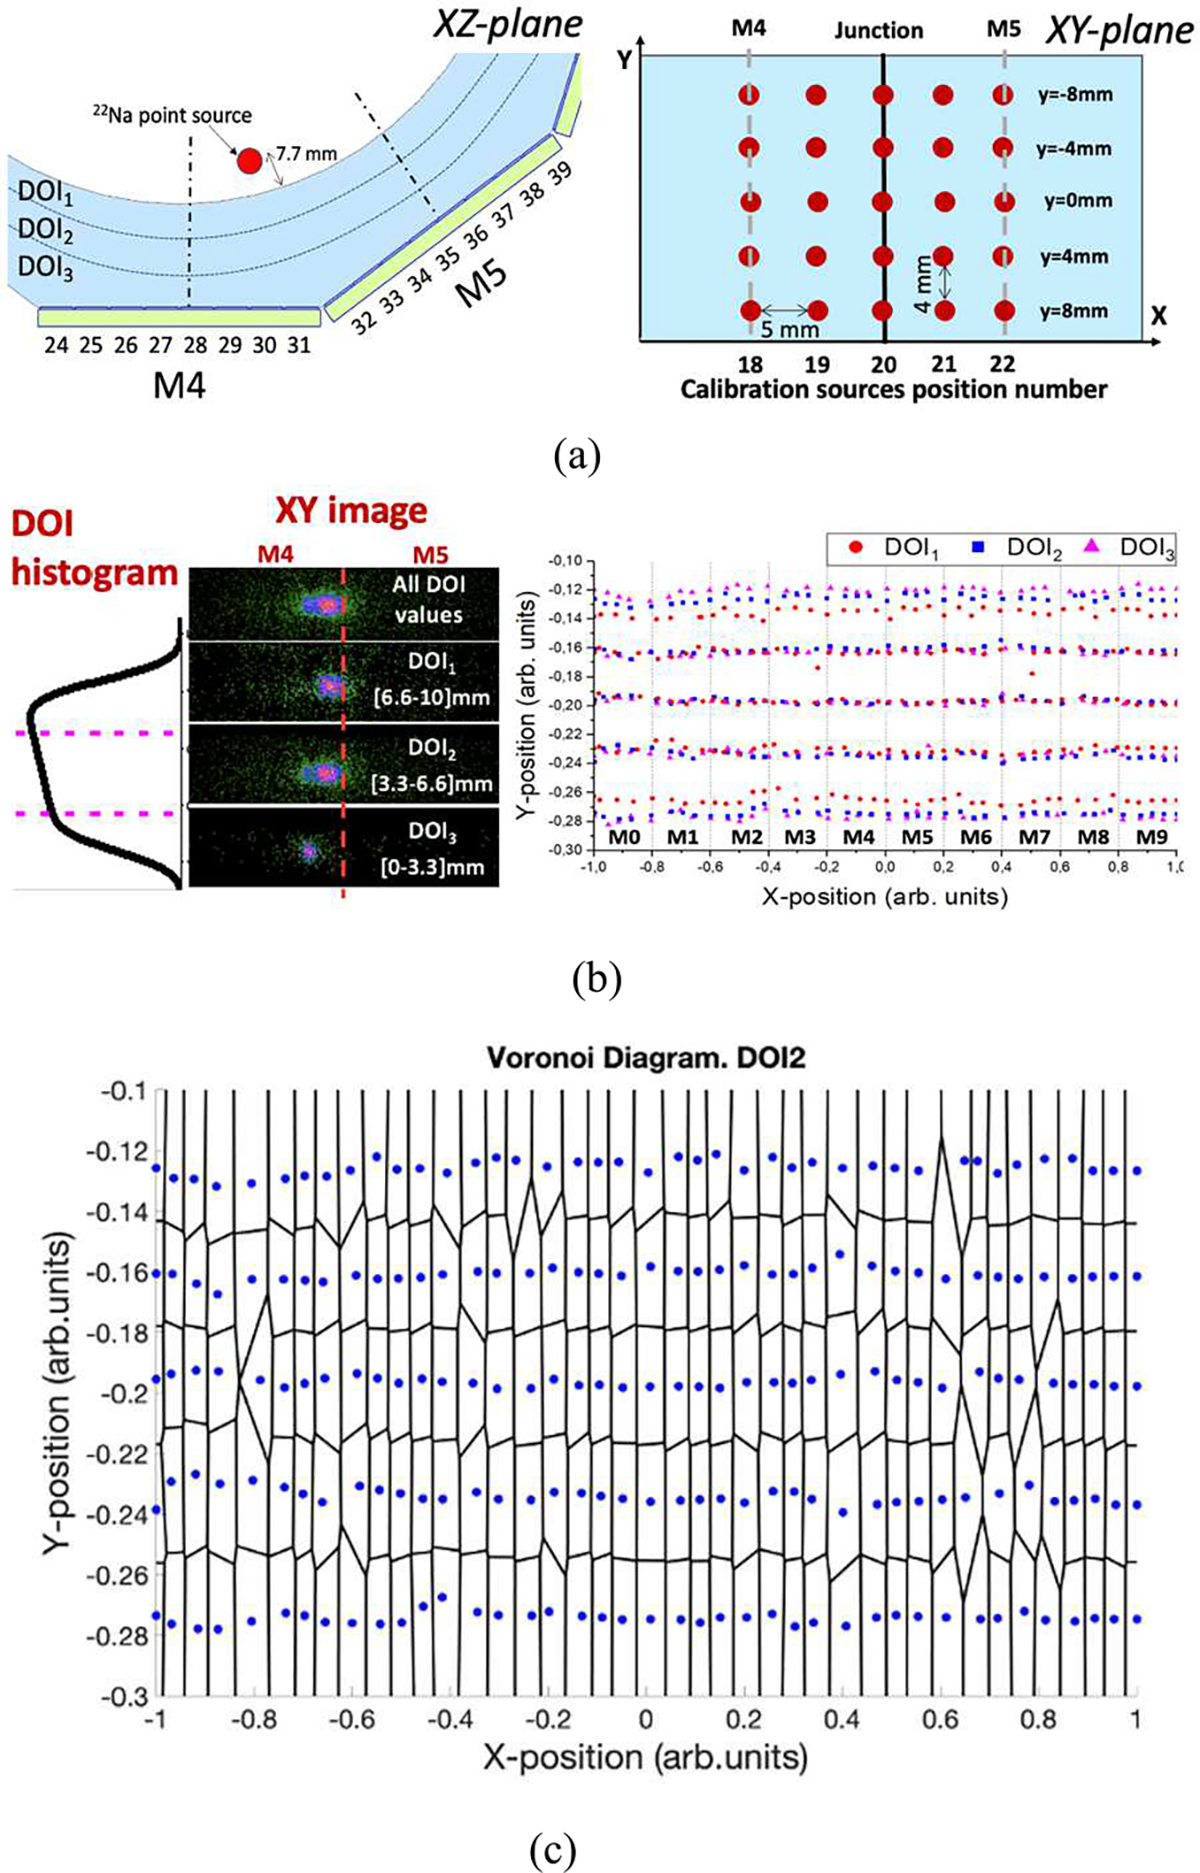
(a) Schematic of a calibration source close to the junction between two facets on XZ-plane and schematic of different calibration source positions on XY-plane, (b) Flood maps (x and y coordinates) of the source number 20 at y=0 mm; including, from top to bottom, all DOI values, DOI1 (impact at the entrance of the scintillator), DOI2 and DOI3 (impacts closer to the photosensor) and measured impact position as a function of the DOI layer for the 200 calibration positions; and (c) Voronoi Diagram of the measured source positions for DOI2 layer.
Both the xi and yi coordinates (see Fig. 3(b)), and the photopeak position are impacted by the facetted geometry as well as by the photon DOI. To account for this dependency, the DOI information was used to modify the conventional calibration procedure [21] as follows: the DOI distribution for each calibration source position has been used to split the acquired calibration data of each source in three layers as a function of the photon DOI (see Fig. 3(b)) [26]. Three pairs of xCalibration and yCalibration coordinates (see Fig. 3(b)), and corresponding photopeak positions, were estimated for each calibration position. Then, a Voronoi diagram was generated for each set of calibration corresponding to each DOI layer (see Fig. 3(c)) and Voronoi factors [21] were determined for each layer generating three , by using the natural neighbor interpolation (see the block named Tube Calibration in Fig. 4(a)). Regarding the calibration of the z coordinate, the E/Imax distributions for each calibration position (including the events of the three DOI layers) were fitted using an empirical equation as shown in [25]. The fitting provides the limits of the histogram namely a and b that are used to calibrate the DOI values into millimeters. In this case, only one LUT was generated: .
Fig. 4.
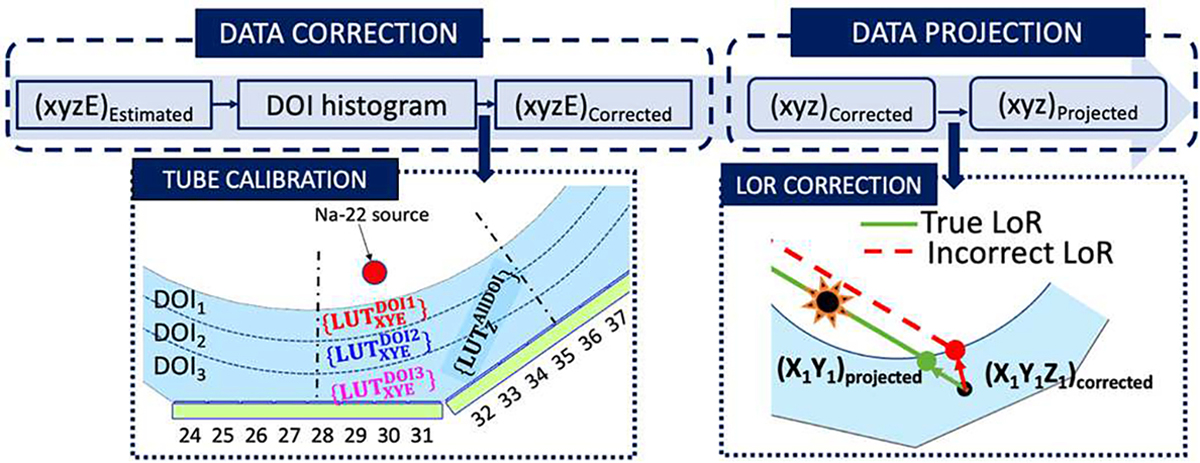
Block diagram of the data processing. Left, calibration procedure or both the 3D coordinates and energy. Right, correction of the parallax error.
The second step of the calibration procedure, named Data Correction, consists of correcting each event (xiyiziEi)Estimated to obtain (xiyiziEi)Corrected by using the generated LUTs. For the z coordinates the was directly applied. For the x and y coordinates and energy, two different methods have been studied:
Discrete method (DM). Voronoi factors for each , n=1,2,3, were considered.
Interpolation method (IM). Each , n=1,2,3, was distance-based weighted using the Voronoi factors corresponding to the two nearest LUTs (see Fig. 4(a)). Both linear and quadratic interpolations were tested without observing significant differences and therefore, for simplicity, only results using the linear case are shown in this work.
Notice that, after calibration, the corrected 3D impact coordinates are in metric units while the energy is in keV. In order to avoid including Compton scattered event, a Gaussian fit to the energy spectrum was determined and only those events that are within the standard deviation from the computed photopeak mean were considered for image reconstruction.
The continuous DOI information was included to also correct the parallax error. As shown in the Data Projection process in Fig. 4, the intersection of the line that connects two points (xi yizi)Corrected with the cylindrical inner face of the tube was calculated resulting in the true coordinates (xi yizi)Projected.
D. Image reconstruction
The data were discretized in virtual crystals pixels of 0.75 mm and 1 mm in transaxial and axial directions respectively and the image reconstruction was performed using the raytracing Joseph projector [27]. In particular, List-Mode ordered subsets expectation maximization (OSEM) reconstruction was applied with an isotropic voxel size of 0.5 × 0.5 × 0.5 mm3. Different combinations of iterations and subsets were tested, namely: 5, 3, 2 and 1 iterations, and 30, 20, 10 and 1 subsets. A Gaussian smoothing of 1.2 mm FWHM was also applied to the data, except for the spatial resolution analysis.
E. Normalization
Normalization data were collected by placing the 0.25 mm 22Na source at 7.7 mm from the inner face of the tube and axially displacing it 40 mm. Note that at the end of the displacement a rotation of 1.8° was included (see Fig. 5(a)). The sensitivity sinogram was computed comparing the measured data to the analytic projections of a cylinder shell of uniform activity, and later back-projected along all LORs. The calculated sensitivity image was used during the reconstruction process. For estimation of the tracer activity 3 iterations and 20 subsets were applied for reconstruction.
Fig. 5.
(a) Sketch of the photosensors, LYSO tube and movement of the 22Na source (red line) during the normalization data acquisition. Note that the rotated angle of the acquisition is less than the one represented on the sketch; and (b) Photograph of the normalization acquisition setup.
F. Detector performance
To study the detector performance, all the 200 measured calibration sources were analyzed. However, we are only reporting the evaluation of selected sources placed at the center of the y-axis and at 5 different position across the x-axis of the detector since this data set represents the behavior of the full system due to the cylindrical symmetry of the design. In particular, we are showing the results obtained for the source positions 18 to 22 (both included), which are placed at the center of the facets named as M4 and M5, respectively, source number 20 was placed exactly between those facet centers (at the facet joint) and source positions 19 and 21 were at 6.5 mm from the facet center (see Fig. 3(a)).
Energy spectra were obtained for each one of these positions and for each one of the DOI layer. The photopeak position and energy resolution were also evaluated for each source. The latter was estimated as the ratio of the FWHM of the distribution to the photopeak position. This evaluation was performed both before and after applying the calibration described in the previous section.
E/Imax distributions were obtained for each one of these source positions and fitted using the empirical equation shown in [25]. The sigma parameter of the fitting is a good estimator of the DOI resolution when the scintillation entrance faces are painted black since the LD is preserved. Note however, that providing an accurate estimation of DOI resolution requires lateral incident experiments, which is highly challenging with the current geometry.
G. System performance and image quality
Regarding system spatial resolution, measurements of the 0.25 mm diameter 22Na point-source were acquired at various radial and axial positions. The emission data were normalized, arc-corrected and grouped in the axial direction with a span of 5 in order to reduce the noise, and finally, were organized in sinograms with radial, angular and axial sampling of 0.375 mm, 1.385° and 0.5 mm, respectively. The spatial resolutions were then obtained as the mean resolutions computed along radial and axial profiles in each measured sinogram projection angle in the direct plane in which the point-source was positioned. The reported resolutions ignore the positron range of the source and assume the system resolution and point-source width added in quadrature.
Experimental data for the sensitivity estimation was acquired by moving the 22Na source (1 mm in diameter) across the system y-axis in steps of 2 mm. Data was analyzed by applying a 30% and a 50% energy window at the photopeak. A measurement of the background activity was also obtained.
Regarding count rate capabilities, data was acquired placing a cylinder of high-density polyethylene with dimensions of 25 mm in diameter and 70 mm length, at the center of the FOV (cFOV). The phantom has a drilled hole of 3.2 mm at a radial offset of 10 mm and was filled with 330 μCi of 18F. Data was acquired for 10 seconds every 30 minutes for a total time of 12 hours. Acquired data was processed following the small animal NEMA NU 4 standard procedure [28]. The true coincidence rate was estimated as the area within the peak, and the random and scattered events were estimated using the background of the distribution. The system noise equivalent count rate (NECR) was studied as a function of the source activity.
The reconstructed image quality was first evaluated acquiring data from a 11 × 11 22Na array source. Experimental data was reconstructed using iterations and subsets sequences of 4/10, 2/5 and 1/1. DOI information and normalization corrections were also included during the reconstruction process. Four different cases of calculating the photon impact were analyzed:
Standard COG algorithm and standard calibration process without splitting the calibration data in three DOI layers.
RTP algorithm (power = 2) and standard calibration process, without splitting the calibration data in three DOI layers.
RTP algorithm and DOI-dependent calibration process using the discrete method (RTP algorithm + DM).
RTP algorithm and DOI-dependent calibration process using the interpolation method (RTP algorithm + IM).
The image quality was evaluated as the Gaussian FWHM, by analyzing the sources profiles of the transaxial view of the reconstructed image of the sources array. Moreover, the image deformation closer to the edges of the FOV was qualitatively evaluated for each case.
In a further step, the image quality was also evaluated using the Micro-PET Image Quality (IQ) phantom proposed in the NEMA NU 4 standard [28]. The IQ phantom is a 50 mm long and 30 mm diameter PMMA cylinder. The first half of the cylinder offers a large cavity of 30 mm in diameter fillable with an 18F (uniformity region) that comprises of two smaller 15 mm long cavities separated from that volume to be filled with water and air (cold regions). The second half of the phantom contains five smaller rods of 1, 2, 3, 4 and 5 mm in diameter, radially aligned around the phantom length axis, thus providing an interconnection to the first half cylinder filled with an isotope. The IQ phantom was filled with a total activity of 82 μCi of 18F and acquired for a total time of 30 min. The data were calibrated using the RTP algorithm + IM and reconstructed using iterations and subsets sequences of 5/3, 2/10 and 2/1 and including normalization correction. We have calculated relative recovery coefficients (RRC) as follow:
| (1) |
where VOI stands for volume of interest. For the hot spots, five cylindrical VOIs with diameters equal to the physical diameter of the phantom rods and 10 mm height, were drawn centered at each rod. For the background measurement, a cylindrical VOI with 25 mm in diameter and 5 mm height was drawn in the center volume of the uniform region of the IQ phantom.
H. Simulations
In order to support the experimental results regarding energy performance and sensitivity, simulations of this edge-less design were carried out using Gate v7.2 platform [29]. A parallelizable detector deadtime of 1 μs [30] was used and the simulations include both nuclear and optical events. An energy resolution of 25% was implemented, allowing coincidences of a detector with its 5 opposites modules. All the LYSO scintillation process characteristics, as the Light Yield and the scintillation spectrum, were included in the simulation, as well as the PDE of the SiPM. The 95% of the scintillation light that reach to the LYSO tube surface was absorbed, being the rest randomly scattered.
Specifically, a study of the energy resolution was performed using the simulations to better understand the impact on light collection due to the reflection at the facet joints. Moreover, the sensitivity results were also simulated considering an energy window of 30 or 50%.
III. Results
A. Detector performance
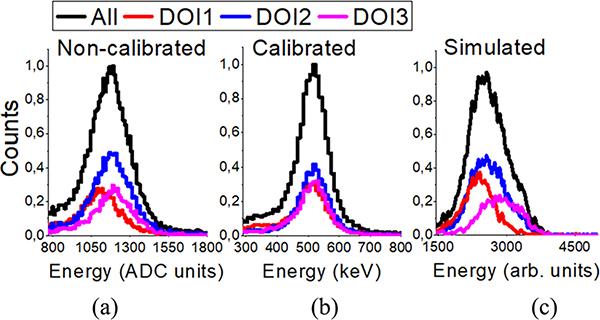
Fig. 6 shows the energy spectra before calibration (a), after calibration using the RTP + IM method (b), and simulated (c); for source position number 20, for the three DOI layers. A DOI dependency of the photopeak energy position is observed for the measured data of source number 20; corroborated by simulated data. After detector calibration the photopeak value is precisely positioned at 511 keV.
Fig. 6.
Energy spectra as a function of DOI position for source position number 20 for (a) non-calibrated data, (b) calibrated data, and (c) simulated data.
Fig. 7(a) and (b) show the non-calibrated and calibrated photopeak position value and the energy resolution as a function of the DOI layer for sources 18 to 22. The black dashed line represents the same calculations, but without DOI layer selection. Fig. 7(c) shows the estimated energy resolution after calibration of the experimental data as a function of the axial position. The average energy resolution was 23.4 ± 1.8%, with best values of 21.0 ± 1.3% at the axial center, worsening to about 25.0 ± 2.1% at the edges, most likely due to scintillation light losses.
Fig. 7.
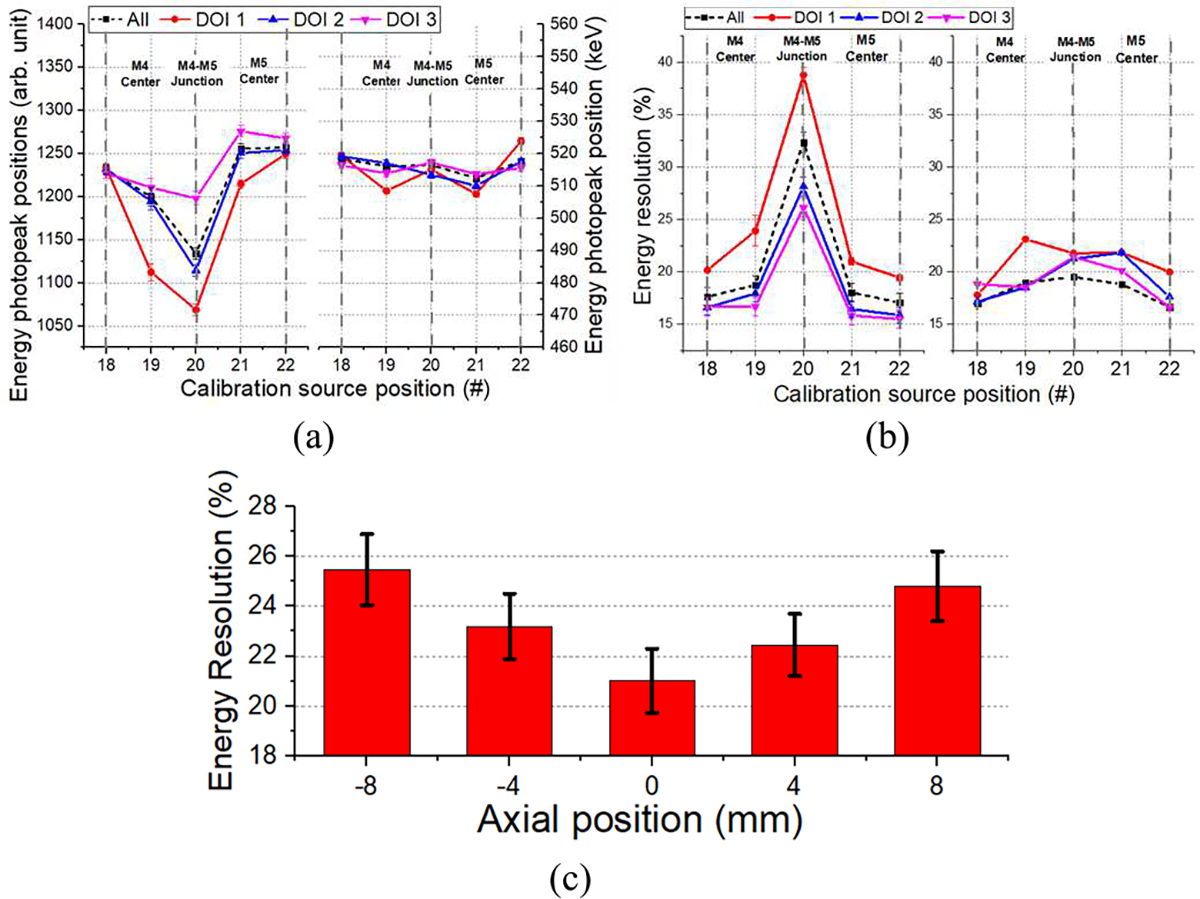
(a) Energy photopeak position as a function of the DOI for the non-calibrated (left) and calibrated (right) data, (b) energy resolution for the non-calibrated (left) and calibrated (right) data as a function of the DOI, and (c) overall energy resolution for source position 18 to 22.
The estimated DOI resolution values after calibration for position numbers 18 to 22 are depicted in Fig. 8. On average, the estimated DOI resolution of the system is 1.8 ± 0.8 mm FWHM.
Fig. 8.
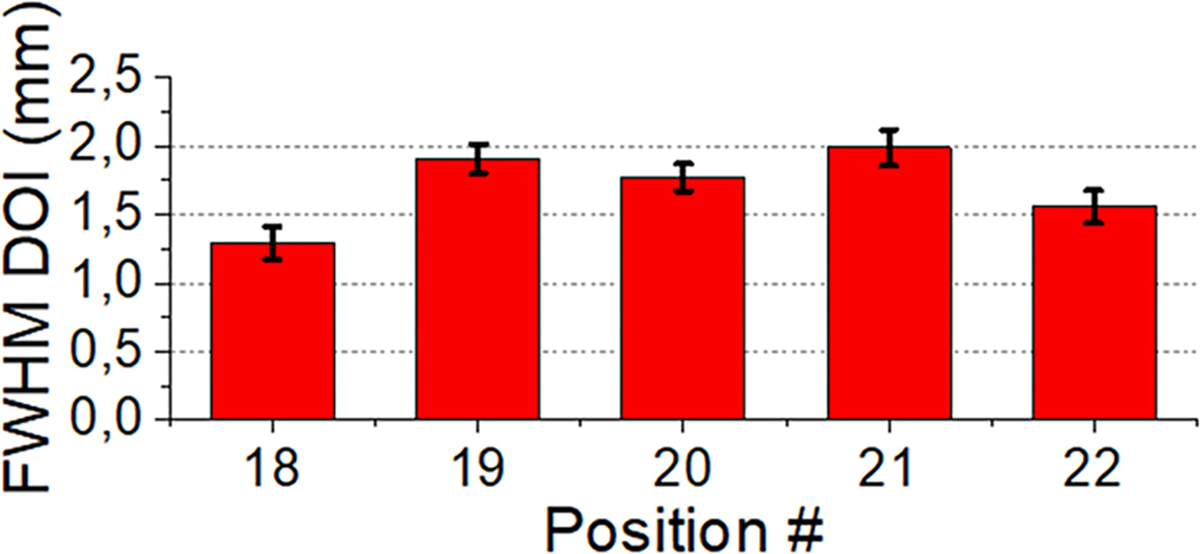
Estimated DOI resolution for source position 18 to 22.
B. System performance and image quality
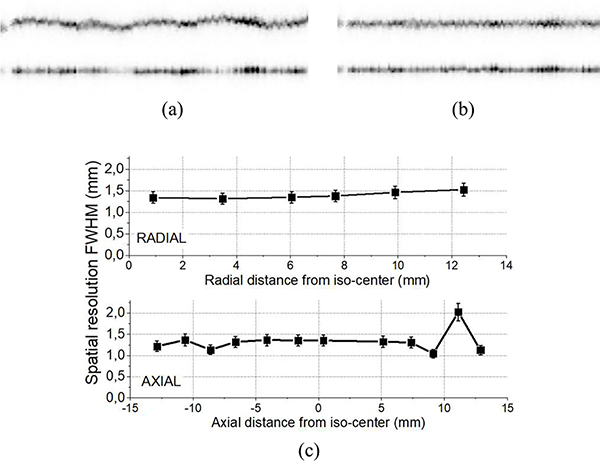
The acquired data with the 0.25 mm diameter 22Na source was processed using the RTP + IM positioning method. Fig. 9(a) depicts the sinogram of the 22Na source centered at the expected sinogram data-bin and computed as the projection of the point-source reconstruction center. Deformations and defragmentation in the radial and axial plots are most likely due to residual calibration issues.
Fig. 9.
(a) Radial (top) and axial (bottom) sinogram views of the 22Na point-source (0.25 mm in diameter) measurements centered at the expected data-bin, and (b) after correction by centering each view at the maximum emission count. (c) Mean radial (top) and axial (bottom) spatial resolutions values computed over all projection angles for each 22Na point-source positioning, these values are determined from sinogram profiles and not reconstructed images.
Fig. 9(b) depicts, the same sinogram after centering the measurements at the data-bin with the most counts in each projection angle. Fig. 9(c) shows the spatial resolutions obtained at varying radial and axial positions, respectively, using the sinogram profiles and not reconstructed images. Notice that the system is intended to be used as a PET insert, so by including the RF coil, the useful diameter is reduced to 30 mm. Regarding the radial component, a degradation of just 10% is observed at the useful FOV edge, when compared to the cFOV. For the axial component, an outlier data point is found at 11.5 mm radial distance, probably due to some small crystal damage or bad painting in this region. Mean values of 1.4 ± 0.2 mm and 1.3 ± 0.4 mm FWHM in the radial and axial dimensions were obtained, respectively.
Fig. 10(a) depicts the calculated sensitivity for 30% (black symbols) and 50% (red symbols) energy windows. Both simulated (open symbols) and experimental results (full symbols) are shown. An experimental sensitivity of 3.8% was estimated at the system center for the 50% energy window, whereas the simulation predicted about 5.4%. Fig. 10(b) shows the experimental results for the total counts, random plus scatter, trues and NECR values as a function of the source activity. The curves follow the typical behavior of linearity at lower activities. The NECR peak was reached at 40.6 kcps for an activity of 270 μCi.
Fig. 10.
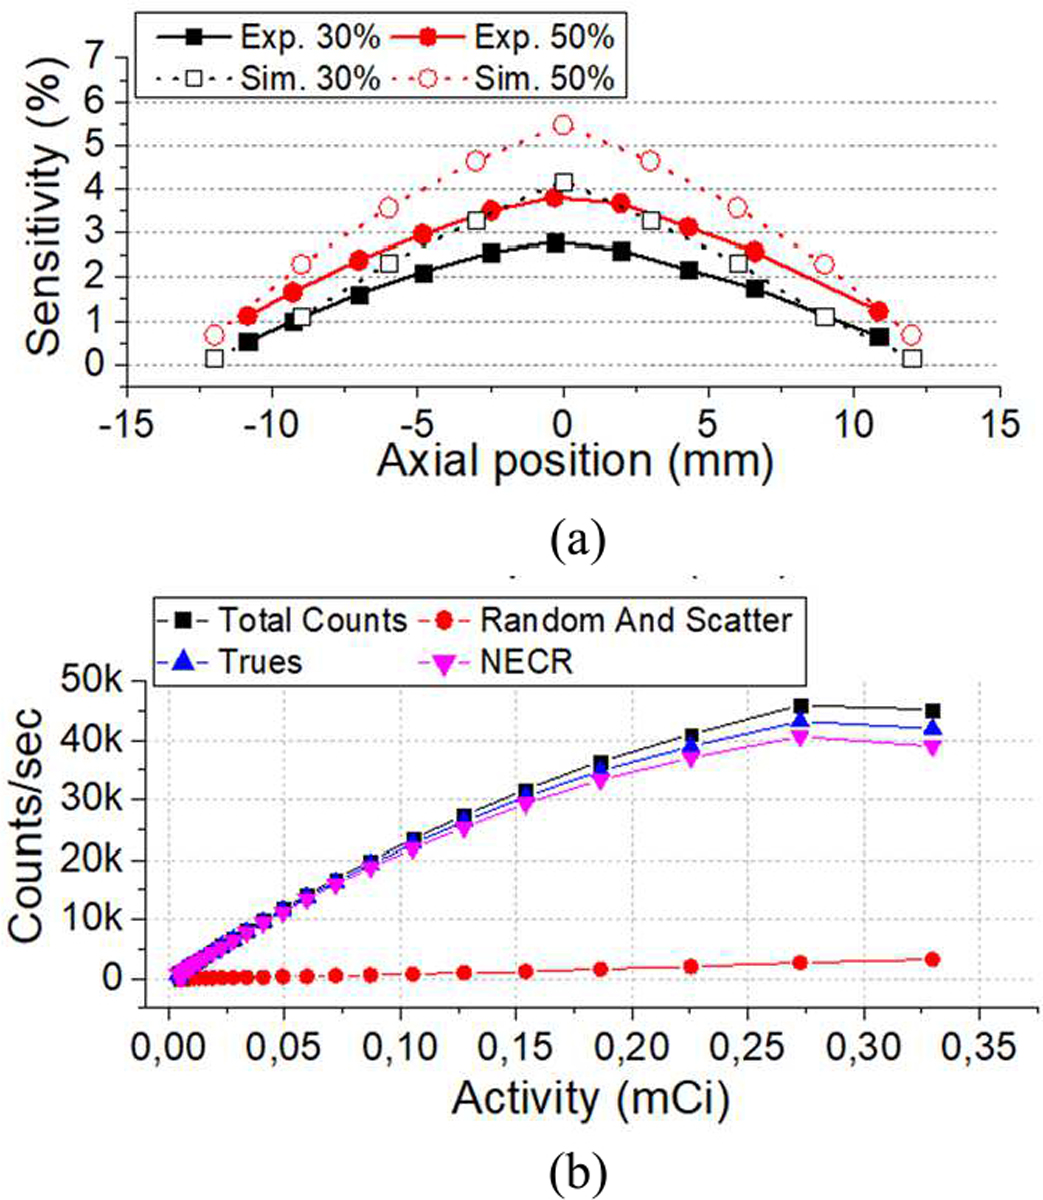
(a) Experimental and simulated system sensitivity for the energy window of 30% and 50%, and (b) count rate measurements.
Concerning the evaluation of the four impact determination methods and calibration processes, Fig. 11(a) shows the transaxial views of the reconstructed array of sources. The red circle indicates the area/volume covered during the normalization process (44.6 mm in diameter). Fig. 11(b) plots the projection of one row of sources for all cases. Average FWHM spatial resolution values of the sources of 2.11 ± 0.54, 1.23 ± 0.51, 1.06 ± 0.15 and 0.97 ± 0.12 mm were obtained for the COG, RTP, RTP + DM and RTP + IM, respectively. Moreover, we have calculated the peak to valley ratio of all source profiles and mean values of 0.07 ± 0.02, 0.22 ± 0.12, 0.20 ± 0.06, 0.21 ± 0.06 were reported for the COG, RTP, RTP + DM and RTP + IM cases, respectively.
Fig. 11.
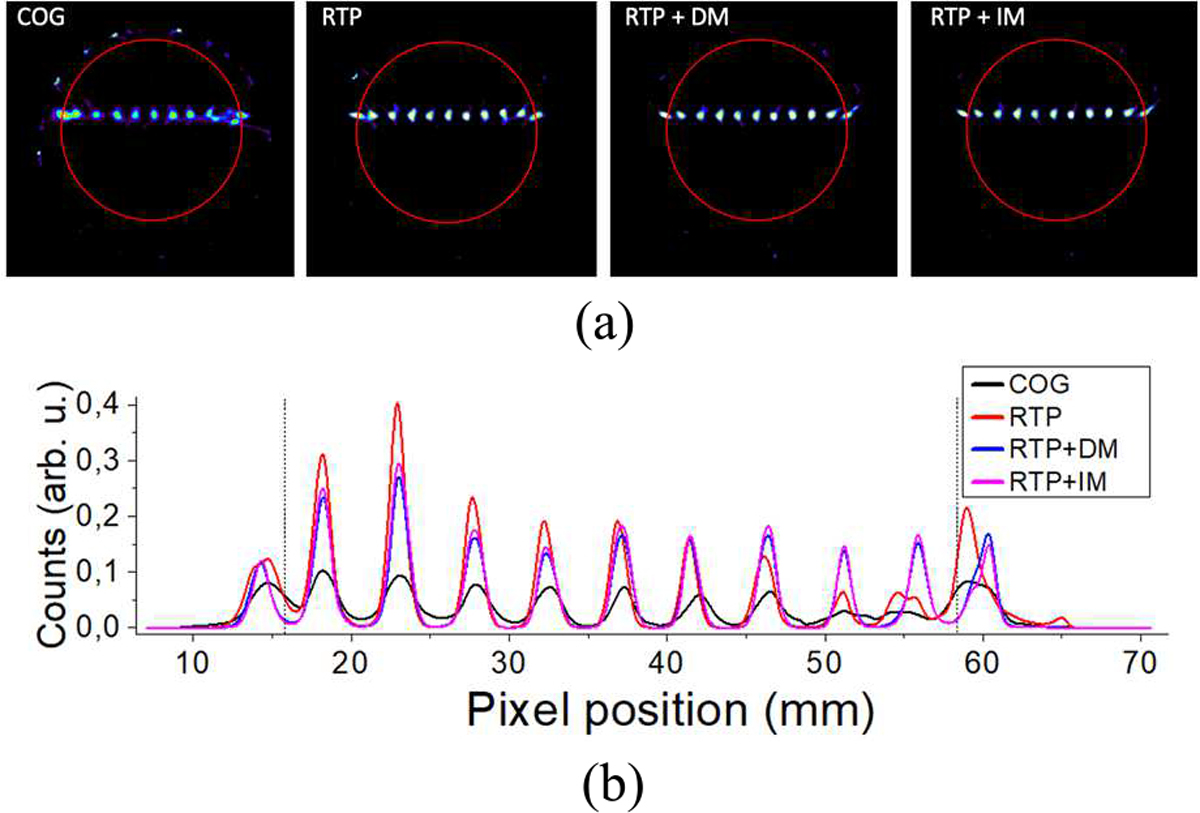
Analysis of the reconstructed array (a) from left to right: COG, RTP, RTP + DM, and RTP + IM, respectively. The red circle shows the limit of the calibration normalization, and (b) projections of the central row of the coronal view of sources for all cases.
The image quality was studied using the NEMA IQ phantom. Fig. 12(a) shows a photograph of the phantom inserted in the PET system with the reconstructed image. The acquired data was calibrated using the RTP + IM case and reconstructed (normalization corrected) with a sequence of iterations/subsets of 5/3, 2/10 and 2/1. Notice that no scatter, random, or attenuation corrections were applied to this data. The profiles of the 1 and 3 mm rods are also shown. Fig. 12(b) shows the measured RRC values as a function of the diameter rod.
Fig. 12.
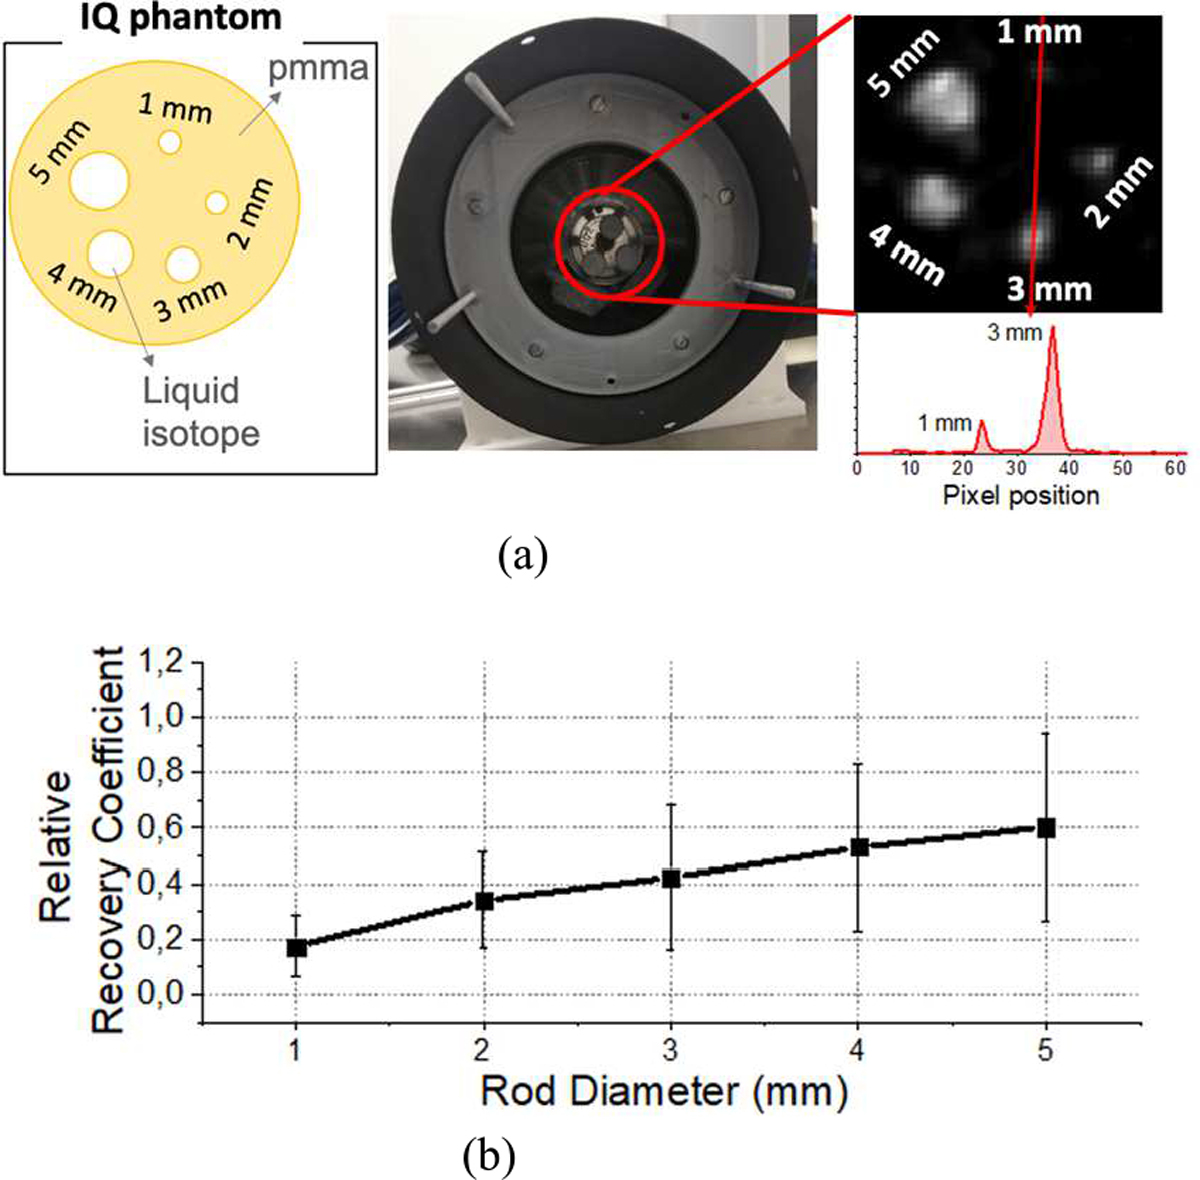
(a) Photograph of the system including the IQ phantom and reconstructed image of the rods showing the profiles across the 1 and 3 mm rods, and (b) measured relative recovery coefficient values.
IV. Discussion
The present work describes and validates a small-animal PET design based on a novel edge-less (single monolithic) LYSO:Ce scintillator with high potential for MRI compatibility. The aim of this design is twofold: first, to enhance state-of-the-art PET system sensitivity by avoiding the typical modular structure with axially and transaxially gaps; and second, enhance spatial resolution by exploiting monolithic-based detectors ability to provide accurate 3D photon impact positioning while mitigating the drop-off in PET performance by suppressing the edges in the transaxial plane.
Our prototype is based on a single LYSO:Ce annular scintillator with an axial length of 52 mm and an outer face that has been cut generating 10 flat faces of 26 × 52 mm2 each. Having flat outer faces simplified photosensor coupling, thus overcoming complex PCB implementations. An outer annular surface has the challenge of coupling the photosensor in the circular surface unless using the endcaps for data reading [17]; But this comes at the cost of missing DOI information. The main challenges associated to the faceted design are the large number of internal light reflections at the joints between facets which increase the DOI dependency of the data and the non-uniform thickness of the scintillator (thicker at the joints). To mitigate these drawbacks, we have implemented a highly accurate position and energy calibration process as a function of the DOI impact information (three layers of 3 mm thick each in our case, see Figs. 3 and 6). Note that more DOI layers are not required due to the DOI resolution of the system which was estimated to be 1.8 ± 0.8 mm FWHM. Moreover, to reduce the number of light reflections in the annulus walls, especially at the junction between facets, both the inner face and endcaps of the annulus were polished and painted black. Based on our previous experience, the use of absorbent black paint, despite preserving the LD profiles and thus improving DOI resolution, improves the determination accuracy of the impact photon position, but reduces the energy performance.
If using reflective treatments, instead of black paint, the amount of light reaching the photosensor will increase, therefore enhancing the energy and timing performance. To explore this, we are currently investigating the use of retroreflector materials to enhance the light collection at the photosensor while preserving the light distribution (required by our methodology to estimate the DOI) and, also, the use of using white reflective paints combined with neural network algorithms for 3D event positioning. This scintillator surface treatment decision for this first prototype was a compromise between impact detectability and the use of analytical methods for impact position determination.
Regarding evaluation at the detector level, we observed a strong dependency of the impact position accuracy and energy resolution as a function of the DOI. For the x and y photon impact positioning, we analyzed both the use of standard COG and RTP methods, concluding that the use of the RTP algorithm is key to providing accurate positioning. Small differences between the x and y calibration as a function of the DOI for the DM and IM methods were observed. The photopeak position and energy resolution dependency with the photon DOI is shown in Fig. 7 and 8. Impacts closer to the entrance face of the scintillator (DOI1) present lower gain impacting on the energy resolution. Identical behavior was observed for all the calibration sources at a given axial position. The photopeak position and DOI histograms exhibit also a dependency on the source position location along the x-axis with a worse characterization at the joints. To achieve highly accurate reconstructed images, the x and y photon impact positions and energy were calibrated using the DOI-dependent calibration methodology (see Fig. 4(a)), and then the LORs were also corrected using the continuous DOI information (see Fig. 4(b)). Fig. 7 and 8 demonstrate the improvement of the calibration methodology (RTP + IM, including DOI-dependent calibration process), which results on an average energy resolution of 23.4 ± 1.8% for the entire annulus and a DOI resolution of 1.8 ± 0.8 mm FWHM.
As shown in Fig. 9(c), average spatial resolution values of 1.4 ± 0.2 mm FWHM and 1.3±0.4 mm FWHM were achieved for the radial and axial dimensions using the 22Na source, respectively. Even with the small dimensions of the scintillation tube and relatively wide FOV, there is still a high homogeneity of the spatial resolution across the whole FOV. However, the facets on the external face of the tube cause some light losses due to internal reflections, degrading the spatial resolution of the system.
The study of the system sensitivity shows a mismatch between the simulation and experimental data (see Fig. 10(a)). We hypothesize that these discrepancies might arise from some data transfer capability differences between the experimental and simulated system. Using acquired data, the system exhibited a sensitivity of 3.8% at the system center for a 50% energy window. As shown in Fig. 10(b), the NECR curve follows the expected behavior as a function of measured activity, being linear at lower activities. The NECR peak was reached at 40.6 kcps for an activity 270 μCi, which is acceptable for a small animal PET imaging.
The image quality was also evaluated. Fig. 11 shows the reconstructed image of the array of multiple 22Na sources by applying the four different event positioning and calibration combinations. As described above, the calibration of x and y coordinates as a function of its DOI played an important role for the image quality assessment. Artifacts observed at the limits of the FOV for the COG method were totally removed using the RTP + IM method. Moreover, the best average spatial resolution value, for one row of sources, was obtained for the RTP + IM case (0.97 ± 0.12 mm FWHM). Regarding the peak-to-valley parameter, the best overall combination (higher peak-to-valley value but a small standard deviation) was also obtained for the RTP + IM case. Additionally, the NEMA IQ phantom was calibrated with the RTP + IM method and reconstructed. Some artifacts can be observed due to the loss of light produced by the faceted exit faces. As shown in Fig. 12(b), the measured relative recovery coefficient values follow the expected behavior, but were a little lower than expected because attenuation correction was not applied. Table. I summarizes the most relevant performance parameters of the state-of-the-art small animal inserts. As can be seen the performance reported with our edge-less design is comparable [33].
TABLE I.
State-of-the-art commercial small animal PET systems.
| System | Modality | Detector | S. Res (mm) | DOI | FOV Trans/Axial |
|---|---|---|---|---|---|
| NuPET (Cubresa) | Insert | 1.2×1.2×4 top ×6 bottom LYSO | 0.9–1.3 | yes | 59/67 |
| HALO 3.0 (Inviscan) | PET/MRI Insert | 1.5×l.5×6 LYSO | 1.1 | no | 75/80 |
| PET insert (MR solutions) | Insert | 1.4×1.4×4 top ×6 (bottom) LYSO | 0.8 | yes | 45–60/150 |
| Nano Scan (Mediso) | PET/MRI | 1.12×1.12×13 LYSO | 1.5 | no | 45,94 – 120/94 |
| SimPET (Scintica) | Insert | 1.2×1.2×10 LYSO | 0.8 | no | 65/55 |
| MRI/PET (SynchroPET) | Insert | 2,3×2.3×8 LYSO | 1.8 | no | 44,85/25,26 |
| Albira Si (Bruker) | Insert | 50×50×10 LYSO monolithic | 0.7–1.0 | yes | 80–46/148 |
| Edge-less | Insert | LYSO monolithic tube | 1.4 | yes | 30/26 |
One of the limitations of the edge-less concept is the scintillator crystal growth process that constrains the maximum size of the piece. Lutetium-based scintillator ingots have approximated maximum dimensions of ~90 mm diameter and ~150 mm height. For the maximum possible outer diameter of 90 mm, the inner diameter of the scintillation piece may be in the range of ~60–70 mm, to ensure a thickness of at least 10 mm. These dimensions are well suited only for mice and other small rodents, thus confining the design to the small animal research field. It may be possible to increase the size of the scanner without having gaps and thus expand this technology to human size scanners for the clinic, by optically-gluing multiple scintillation sections using matching high refractive index materials. Feasibility for this has been shown by simulations [31][32].
Finally, although not shown in this work, we are confident about the high potential MR compatibility of this prototype, since it uses design principles applied in prior prototypes already working immersed in high magnetic fields [19][23].
V. Conclusions
The present manuscript validates and characterizes a novel edge-less small-animal PET insert design based on a LYSO:Ce annular scintillator.
A method for coincident event identification in the scintillation tube based on the LD profiles is provided including a modified version of the conventional calibration method based on Voronoi diagrams, which already demonstrated to correct for typical edge effects [21]. The methodology introduces a calibration procedure that is DOI-dependent, allowing to mitigate the DOI-dependency of the x- and y-axis, as well as the energy photopeak gain, thus demonstrating the advantage of performing DOI-dependent position and energy calibrations. The proposed edge-less PET prototype behaves as expected, minimizing event positioning challenges. Reported results at detector and system level demonstrate the feasibility of using an edge-less PET scanner.
For the next design we planned to enhance the system performance using a completely cylindrical geometry and a novel implementation of the photosensors around the external cylindrical face using flexible PCBs. The NU-4 procedures will be applied for its characterization.
We are optimistic this edge-less design may open a new era of high sensitivity and high-performance PET scanners.
Acknowledgments
This project has received founding from NIH (grant agreement No 1R01EB029450-01) and also received funding from the European Research Council (ERC) under the European Union’s Horizon 2020 research and innovation program (grant agreement No 695536) (Corresponding author: Andrea Gonzalez-Montoro).
Contributor Information
Marta Freire, Instituto de Instrumentación para la Imagen Molecular (i3M-CSIC-UPV), Valencia, Spain.
Andrea Gonzalez-Montoro, Instituto de Instrumentación para la Imagen Molecular (i3M-CSIC-UPV), Valencia, Spain.
Gabriel Cañizares, Instituto de Instrumentación para la Imagen Molecular (i3M-CSIC-UPV), Valencia, Spain.
Ahmadreza Rezaei, Department of Imaging and Pathology, Nuclear Medicine & Molecular imaging, KU Leuven, Leuven, Belgium.
Johan Nuyts, Department of Imaging and Pathology, Nuclear Medicine & Molecular imaging, KU Leuven, Leuven, Belgium.
Stuart S. Berr, Department of Radiology and Medical Imaging, The University of Virginia, Charlottesville, Virginia, United States.
Mark B. Williams, Department of Radiology and Medical Imaging, The University of Virginia, Charlottesville, Virginia, United States.
Jose M. Benlloch, Instituto de Instrumentación para la Imagen Molecular (i3M-CSIC-UPV), Valencia, Spain
Antonio J. Gonzalez, Instituto de Instrumentación para la Imagen Molecular (i3M-CSIC-UPV), Valencia, Spain.
References
- [1].Kuntner C and Stout D, “Quantitative preclinical PET imaging: opportunities and challenges,” Front. Med, vol. 2, no. 1, pp. 12, 2014. [Google Scholar]
- [2].Judenhofer MS and Cherry SR, 2013. “Applications for Preclinical PET/MRI,” Sem Nucl Med, vol. 43, pp. 19–29. [DOI] [PubMed] [Google Scholar]
- [3].Seshadri N, et al. , “Superiority of 18F-FDG PET compared to 111In-labelled leucocyte scintigraphy in the evaluation of fever of unknown origin.” J Inf, vol. 65, no. 1 pp. 71–79, 2012. [DOI] [PubMed] [Google Scholar]
- [4].España S, Marcinkowski R, Keereman V, Vandenberghe S and Van Holen R, “DigiPET: sub- millimeter spatial resolution small-animal PET imaging using thin monolithic scintillators,” Phys Med Biol, vol. 59, no. 13, pp. 3405, 2014. [DOI] [PubMed] [Google Scholar]
- [5].Yang Y, Bec J, Zhou J, Zhang M, Judenhofer MS and Bai X, “A prototype high-resolution small-animal PET scanner dedicated to mouse brain imaging,” J Nucl Med, vol. 57, no. 7, pp. 1130, 2016. [DOI] [PMC free article] [PubMed] [Google Scholar]
- [6].Yamamoto S, Watabe H H, Kanai Y, Watabe T, Kato K and Hatazawa J, “Development of an ultrahigh resolution SiPM based PET system for small animals,” Phys Med Biol, vol. 58, no. 21, pp. 7875, 2013. [DOI] [PubMed] [Google Scholar]
- [7].Godinez F, Gong K, Zhou J, Judenhofer MS, Chaudhari AJ and Badawi RD “Development of an ultra high resolution PET scanner for imaging rodent paws: PawPET,” IEEE Trans Rad Plasma Med Sci, vol. 2, no. 1, pp. 7–16, 2018. [DOI] [PMC free article] [PubMed] [Google Scholar]
- [8].Gonzalez AJ, Berr SS, Cañizares G, Gonzalez-Montoro A, Orero A, Correcher C, Rezaei A, Nuyts J, Sanchez F, Majewski S and Benlloch JM, “Feasibility Study of a Small Animal PET Insert Based on a Single LYSO Monolithic Tube,” Front Med, vol. 5, pp. 328, 2018. [DOI] [PMC free article] [PubMed] [Google Scholar]
- [9].Gonzalez-Montoro A, “Evolution of PET Detectors and Event Positioning Algorithms Using Monolithic Scintillation Crystals,” IEEE Trans Rad Plasma Med Sci, vol. 5, no. 3, pp. 282–305, 2021. [Google Scholar]
- [10].Berr SS, Majewski S, Gonzalez AJ, Williams MB, Gonzalez-Montoro A, Martí RA, “Novel PET scanner based on an edgeless, continuous scintillator tube (ScintoTube™)” presented in The World Molecular Imaging Congress (WMIC), Philadelphia, Sept. 13–16, 2017 [Google Scholar]
- [11].Xie S, Zhao Z, Yang M, Weng F, Huang Q, Xu J and Peng Q, “LOR-PET: a novel PET camera constructed with a monolithic scintillator ring,” in IEEE NSS-MIC Conference Proceeding, Atlanta, GA, USA, 2017. [Google Scholar]
- [12].Stolin AV, Martone PF, Jaliparthi G and Raylman RR, “Preclinical positron emission tomography scanner based on a monolithic annulus of scintillator: initial design study,” J Med Imag, vol. 4, no. 1, pp. 011007, 2017. [DOI] [PMC free article] [PubMed] [Google Scholar]
- [13].Genna S and Smith AP, “ The development of APSECT, an annular single crystal brain camera for high efficiency SPECT,” IEEE Trans Nucl Sci, vol. 35, no. 1, pp. 654–658, 1988. [Google Scholar]
- [14].Goertzen AL, Jones DW, Seidel J, Li K and Green MV, “First results from the high-resolution mouse SPECT annular scintillation camera,” IEEE Trans Med Imaging, vol. 24, no. 7, pp. 863–867, 2005. [DOI] [PubMed] [Google Scholar]
- [15].Freifelder R, Karp JS, Geagan M and Muehllehner G, “Design and performance of the HEAD PENN-PET scanner,” IEEE Trans Nucl Sci, vol. 41, pp. 1436–1440, 1994. [Google Scholar]
- [16].Wilson KJ, Alabd R, Abolhasan M, Franklin DR and Safavi-Naeini M, “Localisation of the Lines of Response in a Continuous Cylindrical Shell PET Scanner,” in Annu Int Conf IEEE Eng Med Biol Soc, pp. 4844–4850, 2019. [DOI] [PubMed] [Google Scholar]
- [17].Xu J, Xie S, Zhang X, Tao W, Yang J, Zhao Z, Weng F, Huang Q, Yi F and Peng Q, “A preclinical PET detector constructed with a monolithic scintillator ring,” Phys Med Biol, vol. 64, no. 15, pp. 155009, 2019. [DOI] [PMC free article] [PubMed] [Google Scholar]
- [18].Gsell W, Molinos C, Correcher C, Belderbos S, Wouters J, Junge S, Heidenreich M, Van de Velde G, Rezaei A, Nuyts J, Cawthorne C, Cleeren F, Nannan L, Deroose CM, Himmelreich U and González AJ, “Characterization of a preclinical PET insert in a 7 Tesla MRI scanner: beyond NEMA testing,” Phys Med Biol, vol. 65, no. 24, pp. 245016, 2020. [DOI] [PubMed] [Google Scholar]
- [19].Gonzalez AJ, Gonzalez-Montoro A, Vidal LF, Barbera J, Aussenhofer S, Hernandez L, Moliner L, Sanchez F, Correcher C, Pincay EJ, Cañizares G, Lamprou E, Sanchez S, Catret JV, Jimenez-Serrano S, Cabello J, Schwaiger M, Iborra A, Thibaut M, Visvikis D and Benlloch JM, “Initial Results on the MINDView PET Insert Inside the 3T mMR,” IEEE Trans Rad Plasma Med Sci, vol. 3, no. 3, pp. 343–351, 2019. [Google Scholar]
- [20].Saint-Gobain 2017, BC-630 Silicone Grease DATASHEET from https://www.crystals.saint-gobain.com/sites/imdf.crystals.com/files/documents/bc-630.pdf
- [21].Freire M, Gonzalez-Montoro A, Sanchez F, Benlloch JM and Gonzalez AJ, “Calibration of Gamma Ray Impacts in Monolithic-Based Detectors Using Voronoi Diagrams,” IEEE Trans Rad Plasma Med Sci, vol. 4, no. 3, pp. 350–360, 2019. [Google Scholar]
- [22].Gonzalez-Montoro A, et al. , “Validation of photon collimation techniques for monolithic PET detector calibration,” IEEE Trans Rad Plasma Med Sci, Early Acces: 10.1109/TRPMS.2020.3043397 [DOI] [Google Scholar]
- [23].Gonzalez AJ, Correcher C, Benlloch JM, Junge S and Bruckbauer T, “Next Generation of the Albira Small Animal PET Based on SiPM Detectors and Continuous Crystals Albira Si Documentation, Bruker BioSpin Corporation, 2015. [Google Scholar]
- [24].Pani R, Bettiol M, Preziosi E, Cinti MN, Borrazzo C, Pellegrini R, Di Castro E and Fabbri A, “Position algorithm for monolithic scintillation crystals based on charge projection readout,” J Inst, vol. 11, no. 1, pp. C01061, 2016. [Google Scholar]
- [25].Gonzalez-Montoro A, Aguilar A, Cañizares G, Conde P, Vidal LF, Hernandez L, Galasso M, Fabbri A, Sanchez F, Benlloch JM and Gonzalez AJ, “Performance study of a large monolithic LYSO PET detector with accurate photon DOI using retroreflector layers,” IEEE Trans Rad Plasma Med Sci, vol. 1, no. 3, pp. 229–237, 2017. [Google Scholar]
- [26].Gonzalez-Montoro A, Sanchez F, Marti R, Hernandez L, Aguilar A, Barbera J, Catret JV, Cañizares G, Conde P, Lamprou E, Martos F, Sanchez S, Vidal LF, Benlloch JM and Gonzalez AJ, “Detector block performance based on a monolithic LYSO crystal using a novel signal multiplexing method,” Nucl Inst Meth A, vol. 912, pp. 372–377, 2018. [Google Scholar]
- [27].Joseph PM, “An Improved Algorithms for Reprojecting Rays Through Pixel Images,” IEEE Trans Med Imaging, vol. 1, no. 3, pp. 192–196, 1982. [DOI] [PubMed] [Google Scholar]
- [28].National Electrical Manufacturers Association. NEMA Standard Publication NU 4–2008: Performance Measurements of Small Animal Positron Emission Tomographs 2008. Rosslyn, VA: National Electrical Manufacturers Association [Google Scholar]
- [29].Gate v7.2 user guide, from http://wiki.opengatecollaboration.org/index.php/Users_Guide_V7
- [30].Jan S, et al. , “GATE: a simulation toolkit for PET and SPECT,” Phys Med Biol, vol. 49, no. 19, pp 4543, 2004. [DOI] [PMC free article] [PubMed] [Google Scholar]
- [31].Vinke R R and Levin CS, “A method to achieve spatial linearity and uniform resolution at the edges of monolithic scintillation crystal detector,” Phys Med Biol, vol. 59, no. 12, pp. 2975, 2014. [DOI] [PubMed] [Google Scholar]
- [32].Morrocchi M, et al. “Evaluation of event position reconstruction in monolithic crystals that are optically coupled.” Phys Med Biol, vol 61, no. 23, pp. 8298, 2016. [DOI] [PMC free article] [PubMed] [Google Scholar]
- [33].Miyaoka RS and Lehnert AL, “Small animal PET: a review of what we have done and where we are going,” Phys. Med. Biol. 65 24TR04, 2020. [DOI] [PubMed] [Google Scholar]


