

Abstract
Genetic screens are powerful tools for both resolving biological function and identifying potential therapeutic targets, but require physiologically accurate systems to glean biologically useful information. Here, we enable genetic screens in physiologically relevant ex vivo cancer tissue models by integrating CRISPR-Cas-based genome engineering and biofabrication technologies. We first present a novel method for generating perfusable tissue constructs, and validate its functionality by using it to generate three-dimensional perfusable dense cultures of cancer cell lines and sustain otherwise ex vivo unculturable patient-derived xenografts. Using this system we enable large-scale CRISPR screens in perfused tissue cultures, as well as emulate a novel point-of-care diagnostics scenario of a clinically actionable CRISPR knockout (CRISPRko) screen of genes with FDA-approved drug treatments in ex vivo PDX cell cultures. Our results reveal differences across in vitro and in vivo cancer model systems, and highlight the utility of programmable tissue engineered models for screening therapeutically relevant cancer vulnerabilities.
Keywords: Bioprinting, Breast cancer model, Medulloblastoma model, CRISPR screens, Point-of-care functional screens
1. Introduction
The last decade has seen a number of advances in tissue engineering and biofabrication techniques that have facilitated the development of tissue and cancer models that better mimic living tissues in both structural organization and biological function [1–7]. While much of this progress is dedicated towards regenerative medicine [1,8,9], engineered tissues have also seen increased use as an avenue for therapeutic discovery [3–6,10,11]. At the most fundamental level, organoid technologies expand upon existing cell culture techniques by incorporating 3D cell-cell interactions to recapitulate certain organ-specific functions [3, 4,12–14]. Organ-chip technologies often incorporate organoid models, but further introduce elements of flow [5,6,15,16] and allow for reproduction of many biological phenomena such as tissue-tissue interface development [5,6,17,18], and cancer metastasis [5,6,19]. Meanwhile, advances in lithography [9,20], 3D printing [9,21–26], and induced neovascularization [8,27,28] have made it possible to generate perfusable networks of increasing complexity with high degrees of spatial control. Additionally, these advances have allowed for the construction of tissue models from a variety of natural and synthetic materials that are more representative of their biological counterparts in both scale [25,29] and cell density [24,30].
In parallel, there have been efforts to develop and optimize high-throughput analytic technologies such as RNAi [31–33] and CRISPR-based genetic perturbation screening [34–43] in order to systematically identify genetic vulnerabilities, with a prominent focus on cancer. In particular, CRISPR-screens have become an important method by which this is accomplished [32,33,41,42,44–50]. However, the majority of screens have been conducted either in 2D [32,44,47,48,51–53] or in animal models [37], and there has been a recent push to enable them in 3D systems to account for behavioral differences in a more biologically accurate environment [34,43,49,50]. Although the scale of many 3D-printed tissue constructs gives them the potential to be integrated with high-throughput screening technologies, they have rarely been used in this space. To this end, we develop a method for manufacturing densely-cellularized engineered cancer models ex vivo, and integrate it with CRISPRko screening technologies to emulate its application towards patient-specific cancer diagnostics. Characterization studies indicated our model more closely mimicked in vivo conditions compared to existing methods of cell culture, and results of a targeted CRISPR screen consisting of genes with FDA-approved drug treatments [54,55] suggest that the method has the potential for application in patient-specific therapeutics.
2. Results
2.1. Perfused MDA-MB-231 tumor models show greater similarities to in vivo tumors compared to 2D cell culture and static 3D culture
While CRISPRko screens are useful in a cancer-therapeutic context, they have traditionally been conducted in 2D monolayer culture [32,33, 41,42,44–50], which often fails to replicate many features of tumor biology [56]. As such, we sought to engineer a tissue construct that would allow for multi-week support of model tumor systems ex vivo, as well as promote growth at a scale that would permit large-scale genetic screening. A workflow for the fabrication of perfused tissue constructs is outlined in Fig. 1A. Specifically, first a sacrificial poly (vinyl alcohol) (PVA) scaffold is printed in a desired geometry and inserted into a silicone holder. A cell-loaded matrix generated from biologically-derived materials [57] is then used to encapsulate the scaffold. The matrix formulation is allowed to gelate, while the PVA scaffold slowly dissolves. A lumen is then formed via evacuation of the dissolved PVA scaffold using warm media. At this stage, the construct is perfusable, but is also sealed on all four sides. Next, to allow for higher flow rates, the construct is removed from the holder, and placed within an open chamber into which excess fluid can flow before being channeled through an outlet. This format makes it possible to sustain flow rates exceeding 1 mL/min, inducing physiological shear stresses exceeding 1 dyne/cm2. Furthermore, the higher pressure generated from the higher flow rates can introduce interstitial flow into the system, emulating what is also seen in tumor tissues, and enables perfusion of the surroundings of the construct in addition to direct perfusion of the lumen. Indeed a direct comparison between lower (15 μL/min) and higher (1 mL/min) flow rates resulted in a ten-fold increase in the growth of MDA-MB-231 breast cancer cells over the course of 15 days (Fig. 1B).
Fig. 1.
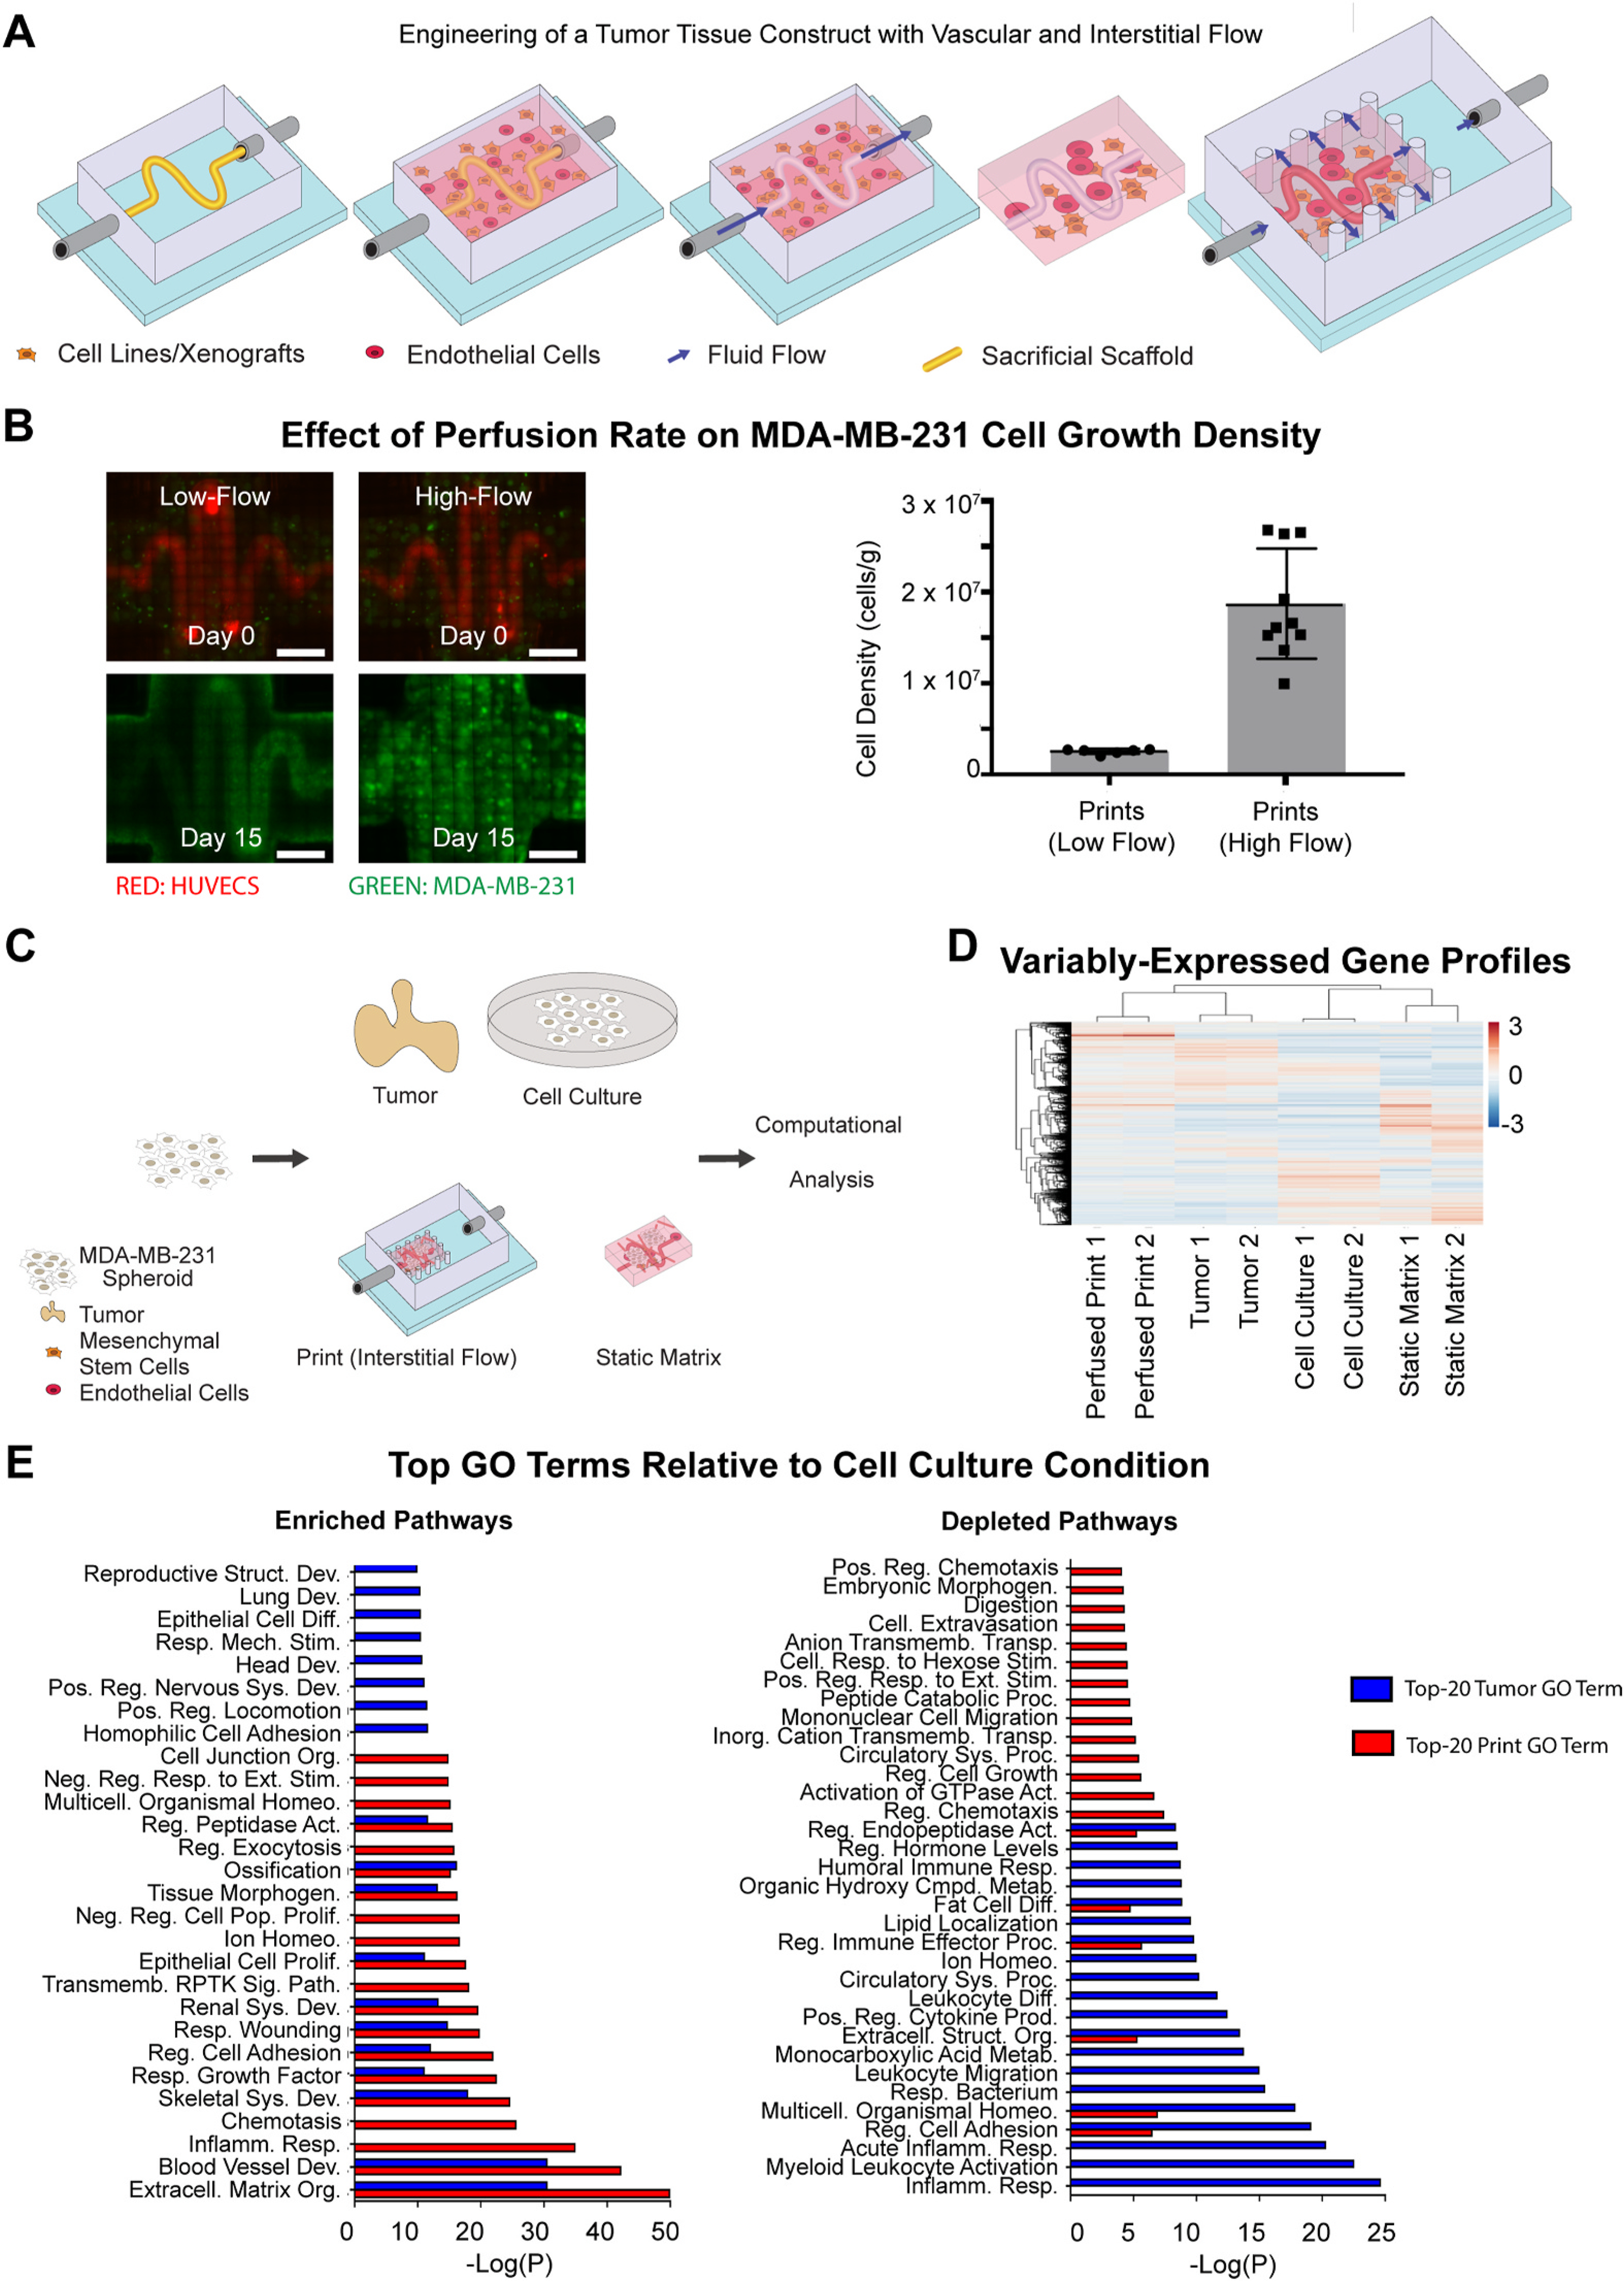
3D-Printing of Perfused Tissue Constructs and Transcriptomic Profiling of MDA-MB-231 Tumor Models. (A) Schematic representation of the perfusable construct manufacturing procedure. A PVA scaffold of desired geometry is printed and inserted into a silicone holder. The PVA scaffold is then encapsulated within a matrix formulation of desired composition. The matrix formulation is allowed to gelate and simultaneously, the PVA scaffold slowly dissolves. The scaffold is then evacuated using warm media. At this stage, the construct can be perfused, though nutrients will be distributed only by diffusion. The construct is then removed from the holder, and placed into the chamber of a larger silicone construct that allows for open perfusion on all sides. At this stage, interstitial flow may be introduced, and perfusion is possible around as well as within the construct. (B) Fluorescent images (left) showing the growth of GFP-labeled MDA-MB-231 cells in matrices at low flow rates without interstitial flow (15 μL/min) and high flow rates with interstitial flow (500μmL/min). Scale bars: 2 mm. Cell density counts (right) for MDA-MB-231 cells in matrices at low flow rates (n = 6) and high flow rates (n = 10). Error bars show standard deviation. (C) Schematic representation of MDA-MB-231 culture conditions. MDA-MB-231 cells are distributed across four conditions: 2D-cell culture, static matrices, perfused printed constructs, and tumors in mice injected orthotopically in the mammary fat pad. Conditions are sustained over 2 weeks, after which RNA is extracted, amplified, and sequenced. (D) Hierarchical clustering diagram comparing relative transcriptomic profiles of all expressed genes in MDA-MB-231 cells grown in various conditions (n = 2 for each condition). (E) Top-20 Metascape-generated enriched (left) and depleted (right) Gene Ontology Biological Process Pathways that are shared by perfused print and tumor conditions in comparison to the cell culture condition.
We next optimized media and loading conditions to allow for co-culture of MDA-MB-231 cells with human umbilical vein endothelial cells (HUVECs) and human mesenchymal stem cells (hMSCs) serving as pericytes. In particular, hMSCs are known to play a role in shaping the tumor microenvironment and promoting key characteristics such as proliferation and motility [58]. MDA-MB-231 cells, HUVECs, and hMSCs were grown in a variety of media conditions containing DMEM, EGM-2, MSCGM, or mixtures of DMEM with either medium, all supplemented with FBS. Qualitative images and quantitative measurements via the CCK8 reagent (Figure S1A–C) both indicated that growth in EGM-2 with 10% FBS would allow for co-culture with HUVECs and hMSCs without negatively impacting MDA-MB-231 growth. To assess the impact of hMSCs on the proliferative and migratory capacity, MDA-MB-231 cells were cultured in the presence of hMSCs at a 4:1 ratio over 6 days, and examined for spreading and elongated morphologies, both known indicators of the cytoskeletal remodeling associated with increased migratory behavior [59]. MDA-MB-231 cells cultured with hMSCs showed greater degrees of spreading morphology (Figure S2A) compared to controls, with individual cells displaying more elongated morphologies (Figure S2B), confirmed with confocal images (Figure S2C) and visualization of F-actin distribution (Figure S2D). To determine optimal 3D loading conditions, MDA-MB-231 cells were encapsulated in perfused prints either alone as spheroids or with HUVECs and hMSCs as condensate organoid buds [14] (Figure S2E). After 10 days of culture, qualitative images suggested significantly greater growth when loaded as spheroids (Figure S2F).
To assess the ability of the optimized system to emulate the in vivo tumor environment, we next performed a gene expression analysis comparing MDA-MB-231 cells grown in vivo to those grown in 2D monolayer culture, 3D static matrix culture, and our perfused tissue constructs (Fig. 1C). Towards this, MDA-MB-231 cells were grown over a period of 4 weeks in orthotopic MDA-MB-231 mammary tumors, 2D cell culture, static matrices, or perfused printed constructs, after which RNA was extracted. Of note, because of potential transcriptomic interference from HUVECs and hMSCs present alongside the MDA-MB-231 cells in perfused culture, additional perfused prints were prepared without either cell type present. Transcriptomic profiles were generated through bulk-RNA sequencing, followed by STAR alignment [60] and analysis with the DESeq2 pipeline [61]. Hierarchical clustering was performed across all expressed genes across the four conditions, and showed closer alignment of tumors and perfused print conditions compared to both static matrices and 2D cell culture (Fig. 1D).
At a pathway-level, differentially expressed genes were compared between all four conditions, identified through DESeq2. Genes were categorized as either highly enriched or highly depleted if they possessed both a |Zscore| > 1.5, and an FDR <0.1. Metascape was used to perform pathway-enrichment analysis within the Gene Ontology Biological Processes domain. Notably, the perfused print condition showed a substantially lower number of differentially expressed genes relative to tumor conditions than the 2D cell culture or static matrix conditions (Figure S3A). Differentially expressed pathways in both perfused print and tumor conditions relative to 2D cell culture (Figure 1E) and 3D static matrices (Figure S3B) were identified, and both perfused print and in vivo conditions were found to share a number of enriched and depleted pathways of interest [62,63]. Of note, when comparing the top 20 enriched pathways in both conditions relative to cell culture, over 50% were shared, including those associated with the biological processes of extracellular matrix organization, cell adhesion, and cell proliferation, all key differences that may arise in a 3D growth environment. Similarly, when comparing relative to static matrices, over 50% were shared, including those associated with extracellular matrix organization, locomotion, cell adhesion, and cell junction organization. Furthermore, both were enriched in pathways of growth factor response and transmembrane receptor-protein tyrosine kinase signaling, both prominent in cancer progression.
In comparing the standard perfused prints to those without hMSCs or HUVECs, their transcriptomic profiles clustered most closely to each other as expected, and both were more similar to tumors than either non-perfused condition (Figure S4A-B). This was expected, as the two conditions share all features save the presence of the HUVECs and hMSCs, both of which are minor populations relative to the MDA-MB-231 cells. In terms of pathways, a number of pathways that would be expected to be associated with hMSCs and HUVECs were predictably enriched in the condition that contained them, such as blood vessel development and ECM organization (Figure S4C). However, when compared to 2D cell culture, both conditions shared 60% of their top-20 enriched pathways, including most of the prominent pathways originally shared with the tumor condition, such as those associated with ECM organization, blood vessel development, cell adhesion, and cell proliferation (Figure S4D). While the extent of enrichment is greater in the presence of the HUVECs and hMSCs, the degree of similarity indicates that the presence of these cell types may not be essential for replicating key tumor characteristics. Overall however, this data suggests that regardless of the presence of hMSCs and HUVECs, the perfused model was more transcriptomically similar to in vivo conditions.
2.2. A kinome-wide CRISPRko screen reveals shared vulnerabilities in perfused MDA-MB-231 tumor models and in vivo tumors
Having established a platform for better emulation of in vivo-like conditions, we then integrated the system with genetic screening technologies as a means to systematically identify genetic vulnerabilities in cancers. We again incorporated the MDA-MB-231 cell line in our system as a model for breast cancer, and compared the model to 2D and orthotopic MDA-MB-231 mammary growth conditions towards enabling more biologically relevant genetic screens. We initiated a CRISPRko screen by transducing MDA-MB-231 cells with a 3152-element subset of the Brunello CRISPRko library, encompassing 763 genes of the kinome [64]. A portion of the transduced cells was harvested and frozen at Day 3, while the rest were split across 2D-cell culture, perfused printed constructs, and orthotopic mammary tumor growth conditions. A full workflow is shown in Fig. 2A. Replicates for all conditions were loaded with at least 3 × 10⁶ cells each to achieve 1000-fold coverage at initial onset, and cells in all conditions were allowed to grow for 4 weeks. Genomic DNA from all samples was subsequently extracted, sequenced, and analyzed using the MAGeCK pipeline [65].
Fig. 2.
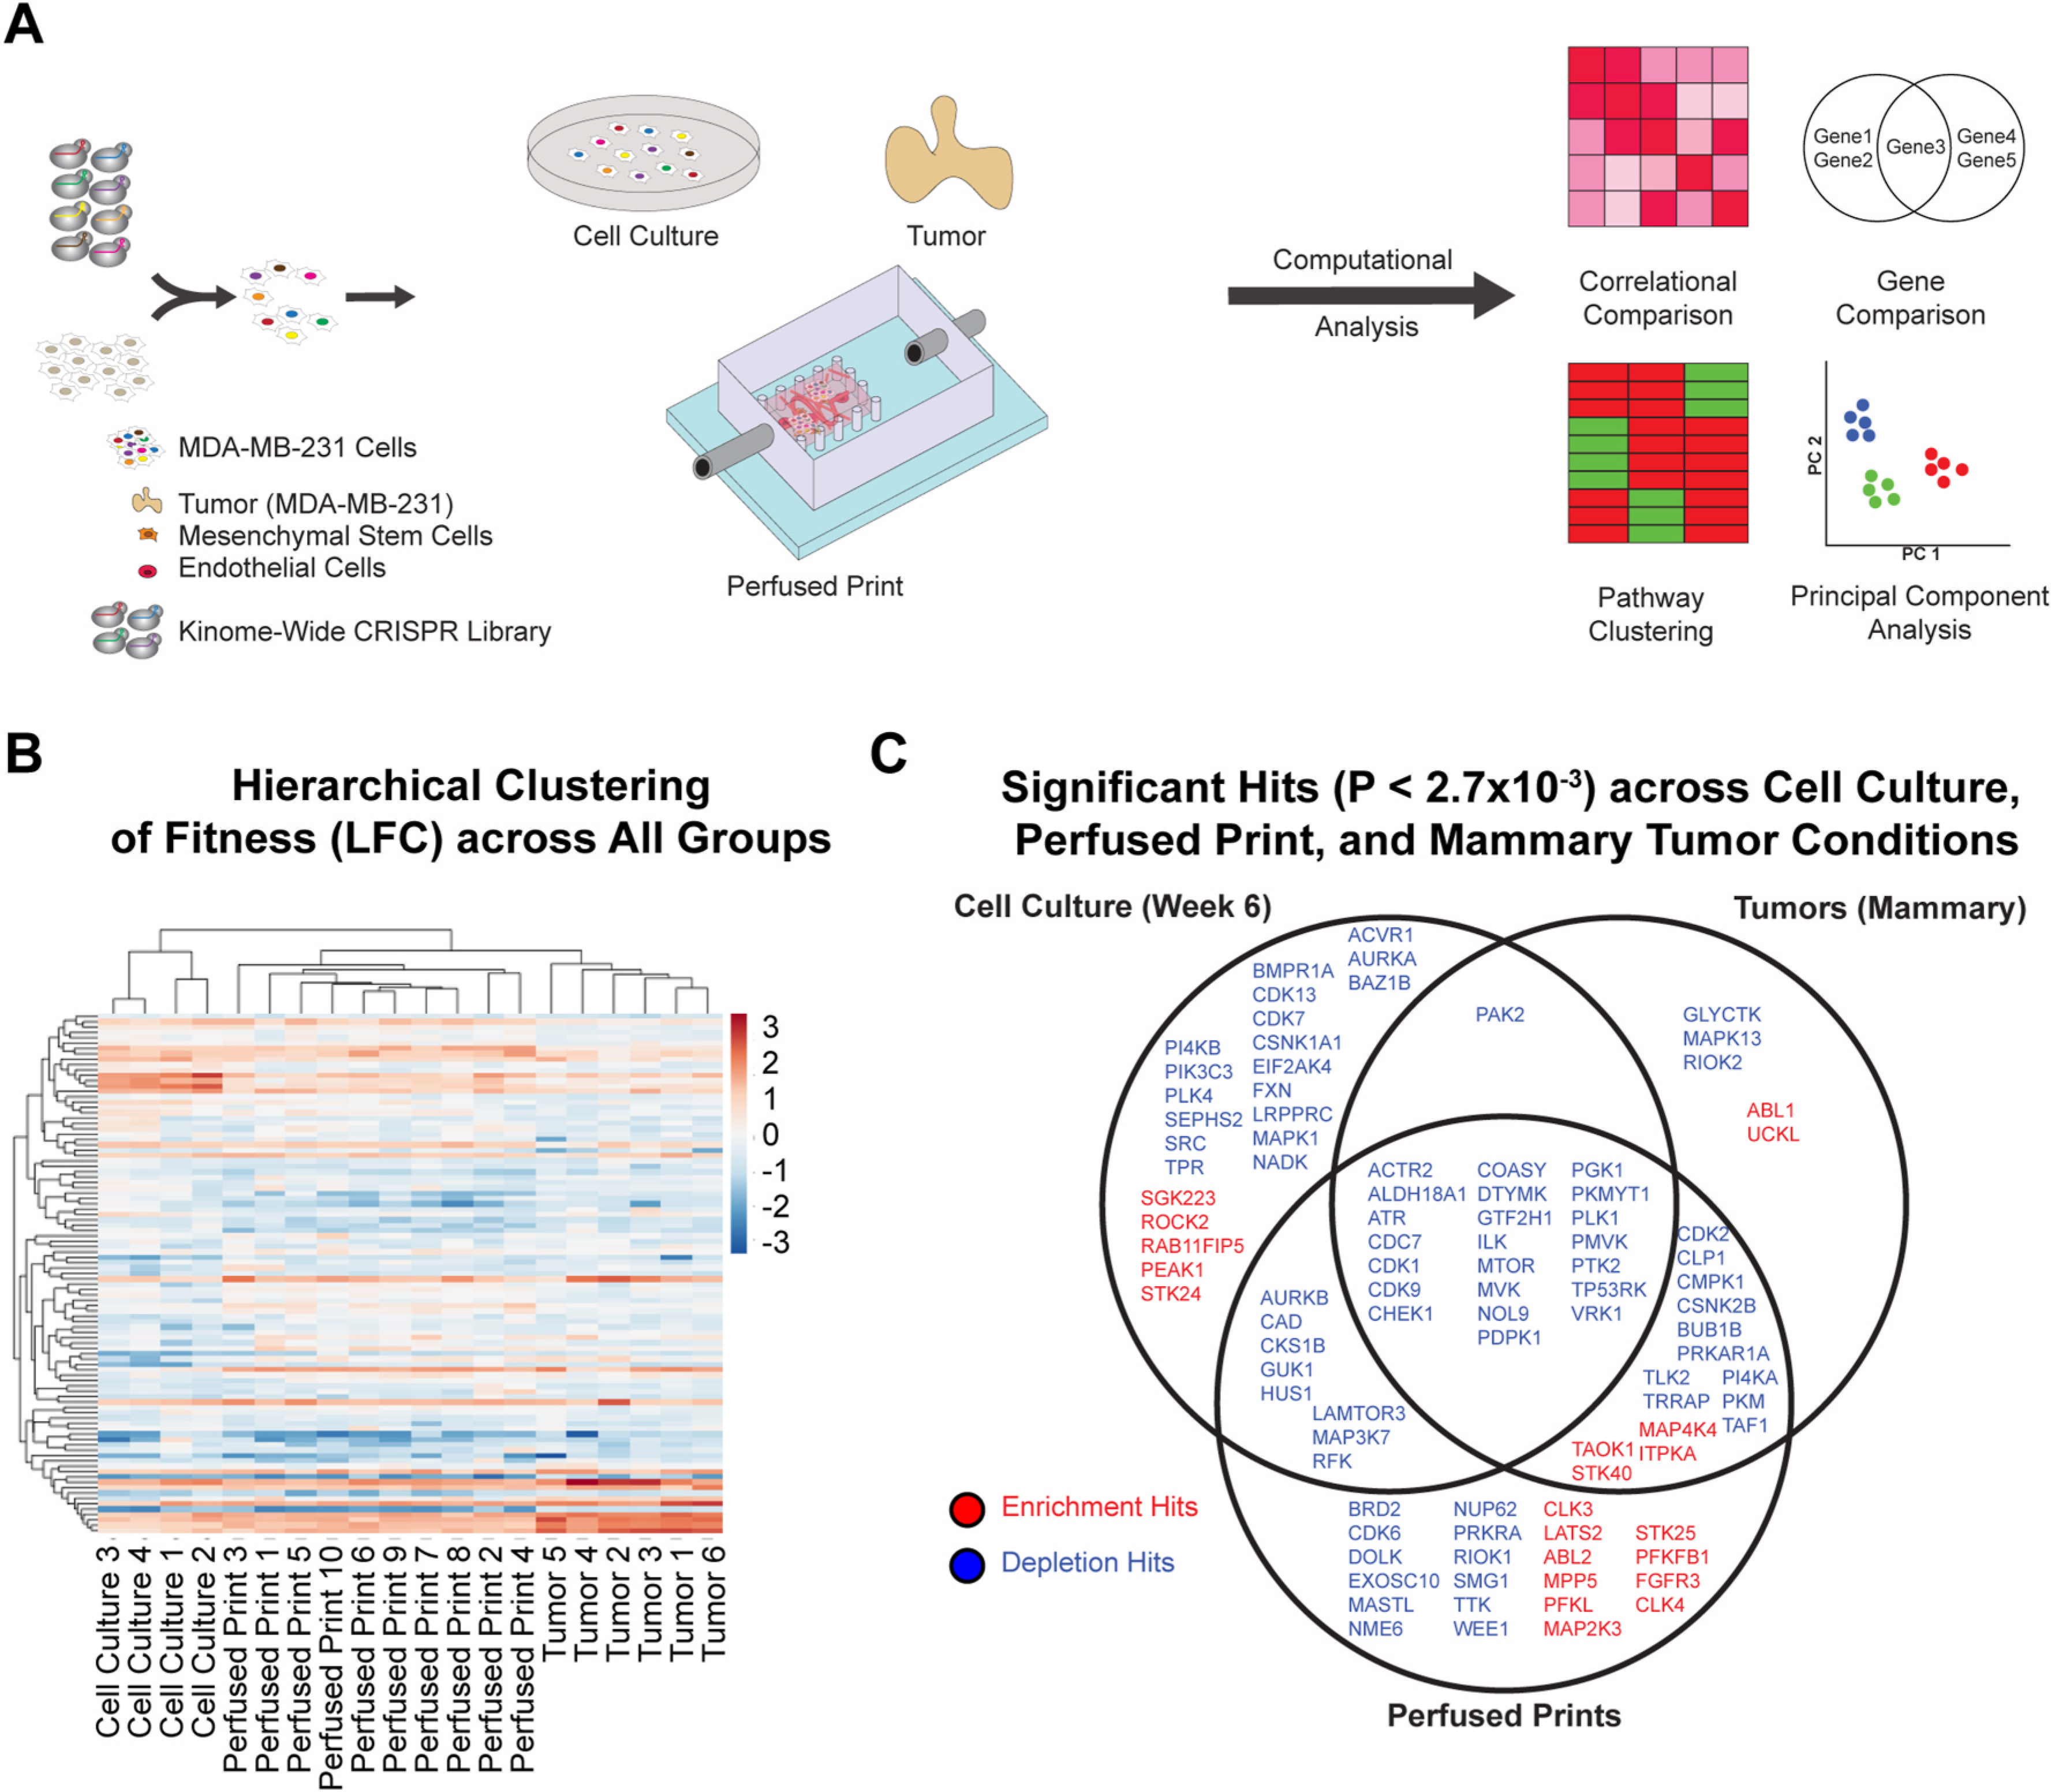
Kinome-wide CRISPRko screens in MDA-MB-231 cells cultured in in vitro 2D conditions, in the ex vivo perfused 3D model, and in in vivo orthotopic locations in mice. (A) Schematic representation of the kinome-wide CRISPR knockout screen. MDA-MB-231 cells are lentivirally transduced with a 3152-element CRISPR knockout library. Cells are collected and distributed across three conditions: 2D-cell culture, perfused printed constructs, and tumors in mice injected orthotopically in the mammary fat pad. Conditions are sustained over 4 weeks, after which gDNA is extracted, amplified, sequenced, and processed. (B) Results of hierarchical clustering performed for top hit genes of all individual replicates for each treatment condition. (C) Venn diagram comparing top depletion and enrichment hits for cell culture, mammary tumor, and perfused print growth conditions, as determined by the MAGeCK algorithm. Criteria consisted of p-value < 0.0027, as well as a LFC value reflecting status as an enriched or depleted hit.
To confirm data efficacy, log2fold change measurements at the gene-level for all genes were compared between Day-21 cell culture samples and the publicly available DepMap dataset (AVANA v.19Q3) for MDA-MB-231 cells [53] (Figure S5A). To contrast enrichment and depletion behavior across groups within our study, hierarchical clustering was performed based on log2fold change measurements of all top hit genes (p-value < 0.0027) across all conditions (Fig. 2B). Notably, results indicated that perfused print conditions clustered better with mammary tumor conditions compared to cell culture, and as expected, replicates of a given condition tended to cluster together first. A principal component analysis performed across top hit genes for all replicates (Figure S5C) further reinforced the aforementioned patterns, and when samples were correlated based on log2fold change in paired comparisons across replicates of all conditions, perfused prints correlated better with mammary tumor conditions compared to cell culture (Figure S5D). When comparing top depletion and enrichment hits between cell culture, mammary tumor, and perfused print conditions (Fig. 2C), results clearly showed that mammary tumors shared a much greater number of hits with perfused prints compared to cell culture, though the cell culture condition had the greatest number of unique hits overall. Upon performing pathway-enrichment analysis on the top-20 depleted terms of each condition within the Gene Ontology Biological Process domain, this trend was reinforced [62,63] (Figure S5B) [66].
Biologically, shared hits between all conditions consisted largely of genes with essential roles in cell cycle regulation, transcription, and damage response [62,63]. As might be expected, many of these genes are known to be lethal when mutated, such as CDK1, MVK, CDC7, and PTK2. With regards to the 2D cell culture condition in particular, the majority of significant hits appeared to be attributable to various cell-cycle regulators, such as CDK7 and ACVR1. In contrast, a greater proportion of hits shared between high-flow prints and tumors, as well hits shared between high-flow prints and cell culture, had roles in cellular metabolism [62,63], for instance, CMPK1, and PI4KA. Notably, perfused prints showed the greatest number of enrichment hits, a phenomenon that has been previously observed in another 3D culture model [34].
In order to validate results, we selected six top depletion hits and six top enrichment hits unique to or selectively shared within the cell culture, perfused print, and mammary tumor conditions. Knockout constructs for each target were created by inserting a single sgRNA for each target, as well as a non-targeting control into the lentiCRISPRv2 backbone [40]. A competitive growth assay was then conducted in MDA-MB-231 cells between each sgRNA and the non-targeting control in cell culture, perfused prints, and mammary tumors. Genomic DNA from all samples was subsequently extracted and sequenced. Relative depletion and enrichment levels for each guide under each condition were then calculated relative to the starting plasmid pool. The resulting data are shown in Figure S6A–B. In general, validation behavior matched the expected behavior based on screen result, confirming the overall efficacy of the studies.
2.3. Perfused PDX medulloblastoma tumor models show greater similarities to in vivo tumors compared to 2D cell culture and static 3D culture
Spurred by these encouraging results, we next evaluated the ability of the system to culture primary patient-derived cancer tissues. Specifically, we explored patient-derived xenograft cells, which are known to often be difficult to culture in vitro without genetic reprogramming [67], but offer the closest available model of a primary human tumor. Towards this, mCherry-labeled medulloblastoma PDX cells were orthotopically injected into the cerebellum of immunodeficient (NOD-SCID-IL2R gamma knockout, or NSG) mice, allowed to grow over 6 weeks, harvested and dissociated into single cells. We determined optimal growth conditions by encapsulating the dissociated cells in one of four static matrix conditions or in perfused prints, and then culturing them over 10 days. Static matrix conditions contained either blends of fibrin and hyaluronic acid (HA), materials relevant for brain tumor models [7], or a blend of the biologically derived matrices: fibrin, gelatin, and Matrigel [57]. Prints were constructed from blends of fibrin and HA. Each condition was grown in either supplemented NeuroCult medium (NC) (StemCell Technologies), or a 1:1 mixture of NC and Endothelial Growth Medium 2 (EGM-2) (Lonza), with EGM-2 being present to permit potential co-culture with endothelial cells. Growth in various 3D matrix conditions was assessed both qualitatively via microscopic images, and quantitatively (Figure S7A) using the Cell-Counting Kit 8 reagent (Dojindo). Results suggested that the presence of HA significantly increased cell growth. Additionally, the degree of growth in blends of fibrin/HA and fibrin/gelatin/Matrigel showed no significant difference. Upon comparing static matrix conditions and perfused print conditions, both qualitative images (Figure S7B) and cell density measurements (Figure S7C) indicated significantly more growth in perfused prints, regardless of matrix composition.
To further characterize the system, we performed a gene expression analysis comparing PDX medulloblastoma cells grown in vivo to those grown in several in vitro conditions. Specifically, PDX medulloblastoma cells grown orthotopically in mice were compared to those grown in static matrix and perfused print conditions, and to those grown in suspension culture, as is standard for many established medulloblastoma cell lines [68–70] (Fig. 3A). Of note, hMSC and HUVECs were not included in these cultures, as hMSCs are not a prominent population in the brain, and culturing conditions were not optimal for endothelial cells. For the orthotopic condition, mRNA was extracted directly from cells dissociated from PDX tumors. For all in vitro conditions, cells were grown over a period of 10 days, after which mRNA was extracted. Transcriptomic profiles were generated through bulk-RNA sequencing, followed by STAR alignment [60] and analysis with the DESeq2 pipeline [61]. Initially, we compared relative expression levels of common medulloblastoma marker genes, or those associated specifically with one of the four medulloblastoma subtypes [71,72] across all conditions. Log-normalized expression of common marker genes in medulloblastomas (NES, MYC, and CD276) as well as marker genes associated with Group 3 medulloblastomas appeared consistent across nearly all conditions (Supplementary Table 1), suggesting that the Group 3 medulloblastoma characteristics appear to be maintained under in vitro growth conditions. Hierarchical clustering performed based on the transcriptomic profiles revealed that, like with the MDA-MB-231 cells analyzed previously, perfused prints clustered more closely with tumors compared to both the static matrix and cell culture conditions (Fig. 3B). A principal component analysis performed across expression profiles of all genes showed tumors separating from perfused print and cell culture conditions, but with the perfused print condition remaining closer overall. Furthermore, like before, the number of differentially expressed genes between perfused prints and tumors was lower than either cell culture or static matrix conditions compared to tumors (Figure S8A). Of note, data associated with PDX medulloblastoma cells grown with a mixture of NeuroCult and EGM-2 media was analyzed as well, but both a principal component analysis and hierarchical clustering based on all expressed genes revealed that the transcriptomic profiles deviated extremely heavily from all other conditions (Figure S8B–C). This is likely the result of the serum present within the EGM-2 media, as NeuroCult is normally a serum-free formulation. Because of these differences, the data associated with these samples was not analyzed any further, and it is also for this reason that co-culture with endothelial cells was not further pursued.
Fig. 3.
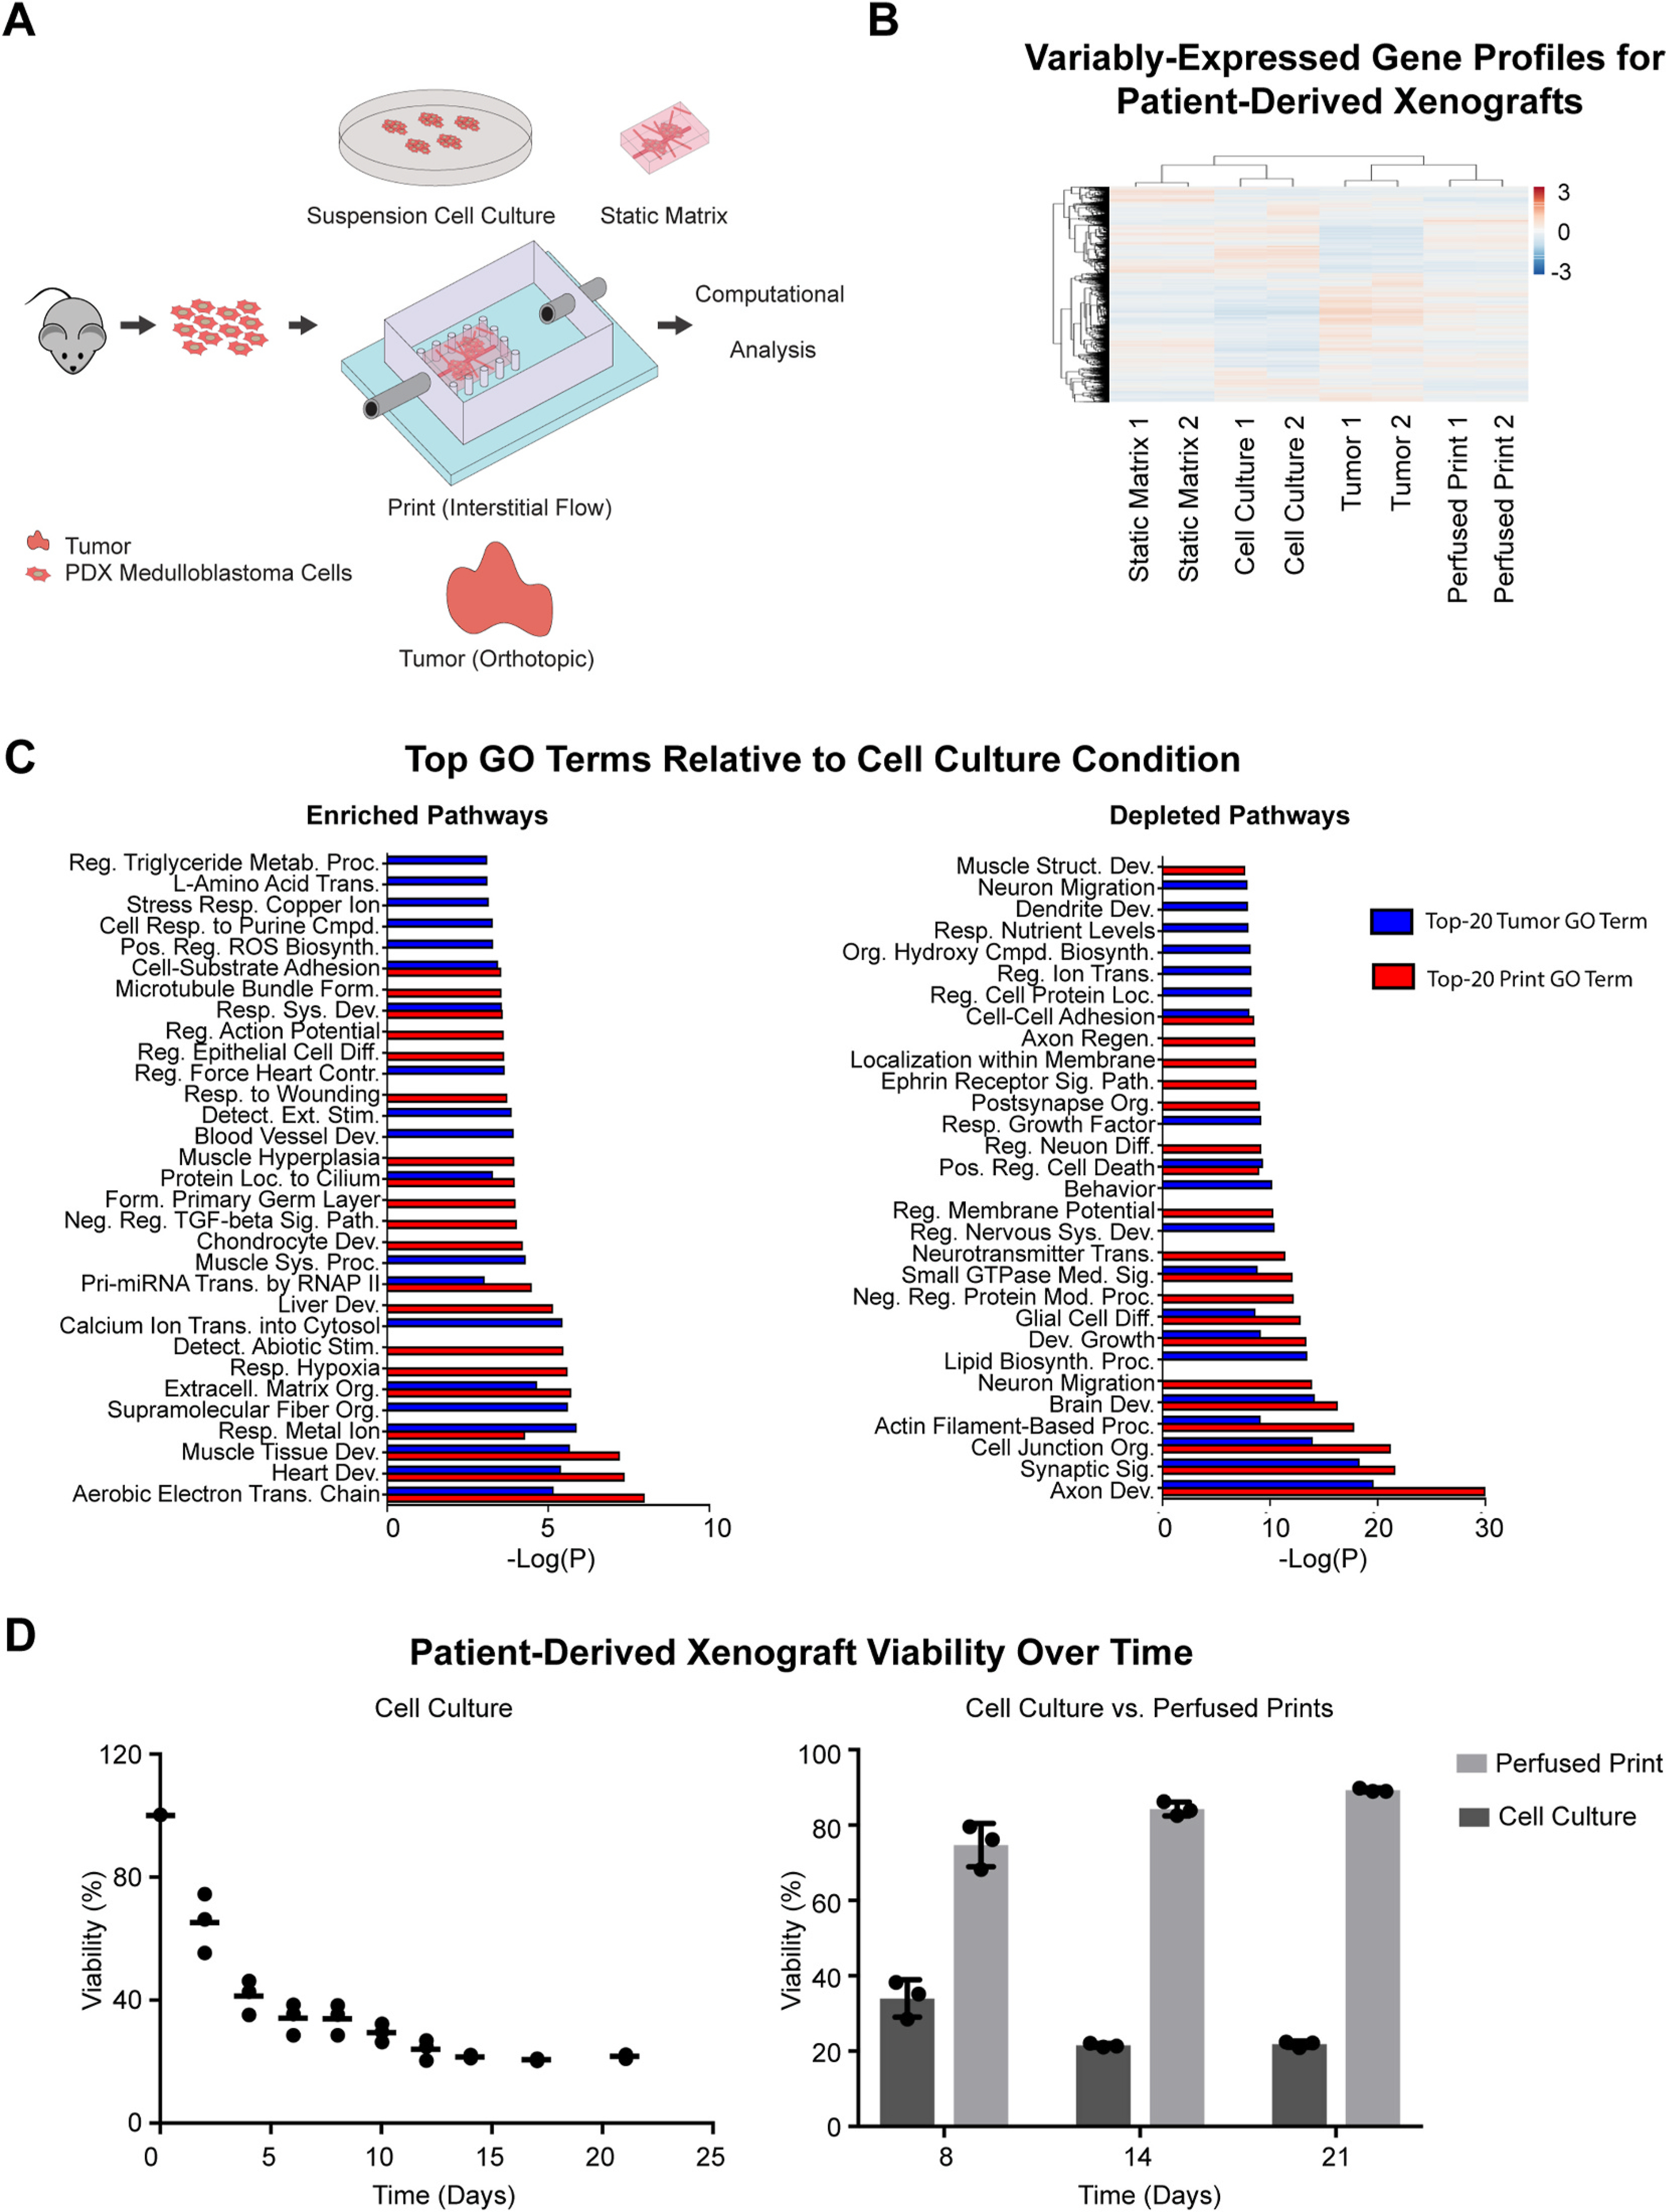
Transcriptomic profiling of PDX medulloblastoma cells cultured ex vivo in various model conditions. (A) Schematic representation of PDX medulloblastoma culture conditions. PDX medulloblastoma cells are isolated from tumors, then distributed across several conditions: suspension cell culture, static matrices, perfused printed constructs, and tumors in mice injected orthotopically in the cerebellum. Conditions are sustained over 10 days, after which RNA is extracted, amplified, and sequenced. (B) Hierarchical clustering diagram comparing relative transcriptomic profiles of all expressed genes in PDX medulloblastoma cells grown in suspension cell culture, static matrix, perfused print, and orthotopic tumor conditions (n = 2 for each condition). (C) Top-20 Metascape-generated enriched (left) and depleted (right) Gene Ontology Biological Process Pathways that are shared by perfused print and tumor conditions in comparison to the suspension cell culture condition. (D) Survival of PDX medulloblastoma cells over time when grown in suspension cell culture (left), and comparison of PDX medulloblastoma cell survival in suspension cell culture vs. perfused prints (right).
Because our previous analyses indicated that the perfused print conditions appeared more similar to the orthotopic tumors, we performed a closer examination of the gene-level similarities between the two conditions. Both the perfused print condition and orthotopic tumor condition were compared to the cell culture condition (Fig. 3C) and the static matrix condition (Figure S8D) as baselines, and differentially expressed genes were identified through DESeq2. Genes were categorized as either highly enriched or highly depleted if they possessed both a |Zscore| > 1.5, and an FDR <0.1. Metascape was used to perform pathway-enrichment analysis within the Gene Ontology Biological Processes domain, and both tumors and perfused prints were found to share 40% of their top 20 enriched pathways and over 50% of their top 20 depleted pathways compared to cell culture, and 25% of their top 20 enriched pathways and over 50% of their top 20 depleted pathways compared to static matrices [62,63]. Similar to the analysis in MDA-MB-231 cells described previously, tumor and perfused print conditions showed significant enrichment in extracellular matrix organizational processes, compared to both suspension cell culture and static matrix conditions. In addition, there was also enrichment in genes associated with the electron transport chain relative to cell culture, suggesting potential metabolic differences, and both tumor and perfused print conditions showed depletion in genes associated with positive regulation of apoptosis. This included genes such as BAD, GADD45A, and CTNNA1 [73–75], all known to be involved in positively promoting apoptotic pathways. Consistent with this, upon comparing viability of the PDX medulloblastoma cells in suspension cell culture relative to perfused prints (Fig. 3D), we noted viability was high immediately following dissociation from tumors, but progressively decreased over time in suspension cell culture, but in contrast, ex vivo viability remained both high and stable when cultured in perfused prints.
2.4. A curated CRISPRko screen of genes with FDA-approved drug treatments reveals targetable vulnerabilities in PDX medulloblastoma models
In an ideal bed-side diagnostic scenario, a perturbation screen could be used to fully characterize a patient’s tumor to develop a patient-specific treatment plan. However, tumor biopsies are typically obtained via syringe, with even large cores being no more than 1/16″ in diameter and 1/2″ in length. A genome-wide perturbation screen requires hundreds of millions of cells for necessary coverage when accounting for transduction efficiencies [35,37,40], and as such, would be impractical in this setting. In contrast, a smaller-scale but targeted screen containing sgRNAs for genes of high therapeutic interest would be much more applicable and of greatest utility to clinicians.
To this end, we construct a 74-element CRISPRko library from gene-targets of known FDA-approved anti-cancer drugs [54], as well as genes known to have prominent roles in Group 3 medulloblastomas [72] (Fig. 4A). This library was to be integrated with the aforementioned PDX models. In addition to replicating aspects of the in vivo microenvironment, the perfused culture system was capable of growing the PDX cells ex vivo with greater survivability compared to suspension cell culture, and at higher growth rates compared to static 3D culture, both key requirements in conducting a successful depletion screen.
Fig. 4.
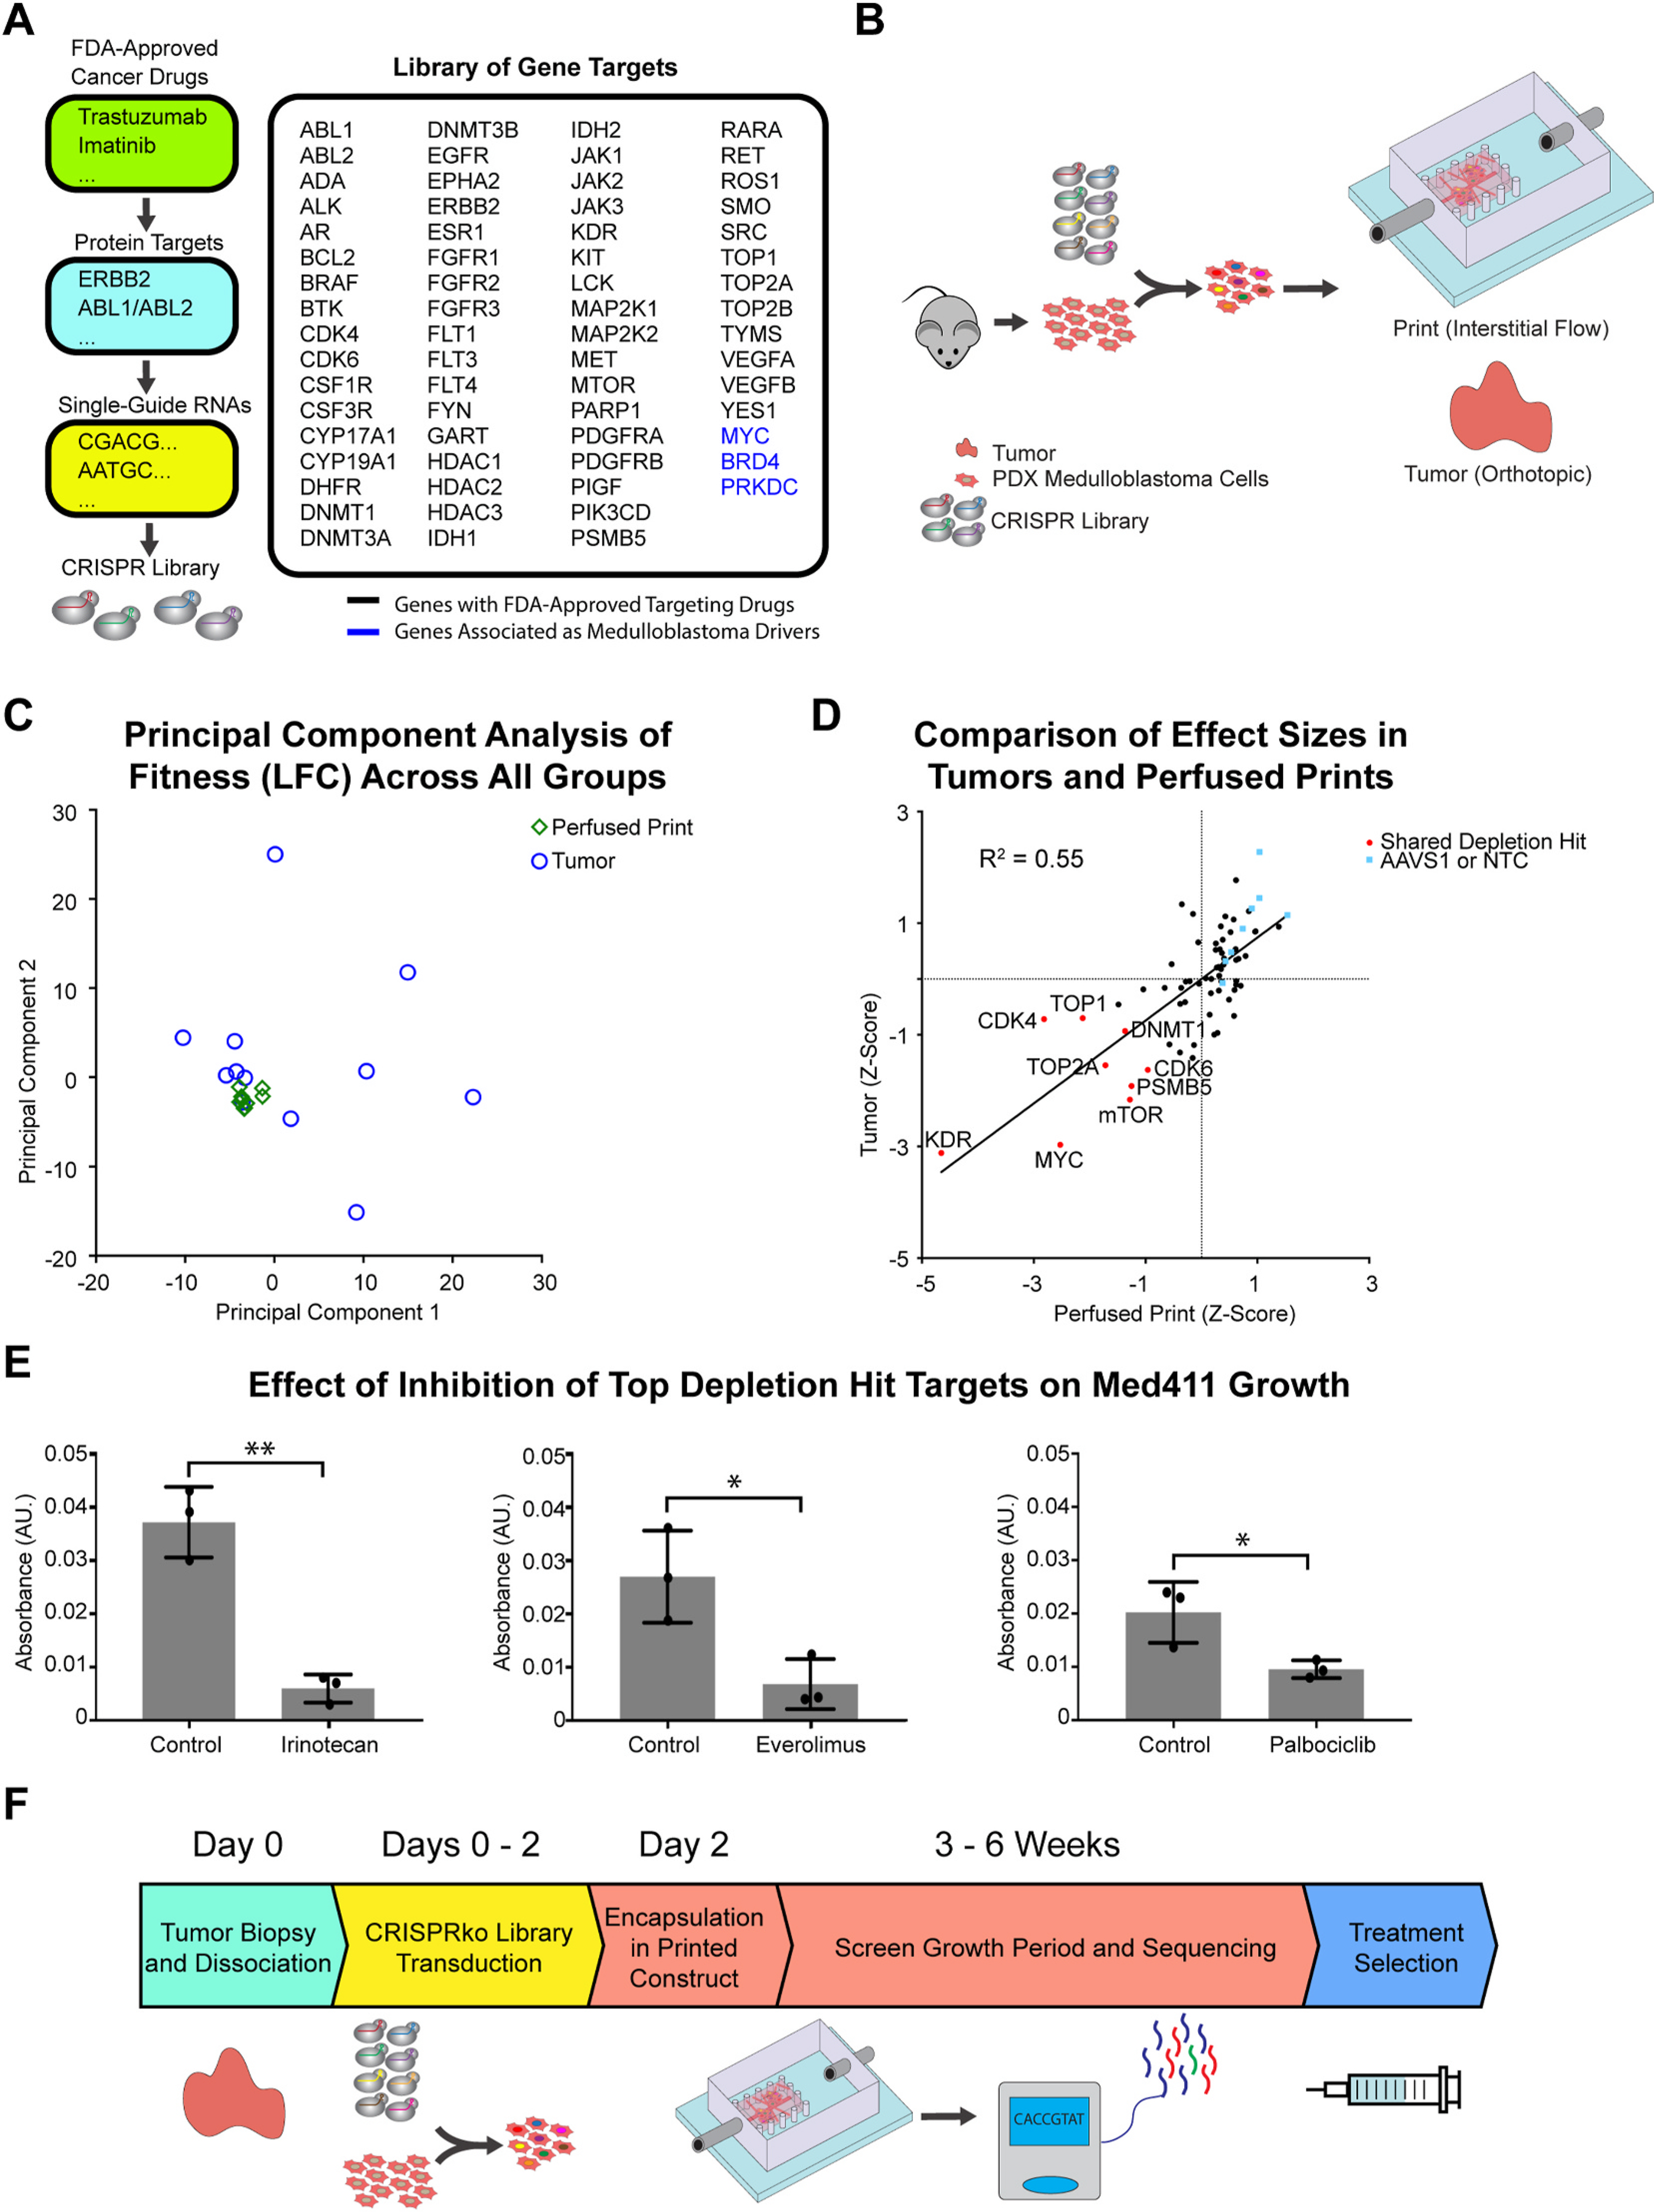
Targeted CRISPRko screen in PDX medulloblastoma cells cultured in the ex vivo perfused 3D model, and in in vivo orthotopic locations in mice. (A) Overview of CRISPR knockout library design. Target genes of single-guide RNAs were assembled from a list of genes with FDA-approved drugs targeting their products. (B) Schematic representation of the targeted CRISPR knockout screen. PDX-medulloblastoma cells are isolated from tumors, and lentivirally transduced with a 74-element CRISPR knockout library. Cells are collected and distributed in perfused printed constructs and tumors in mice injected orthotopically in the cerebellum. Conditions are sustained over 6 weeks, after which gDNA is extracted, amplified, sequenced, and processed. (C) Results of a principal component analysis performed across all genes of all individual replicates for each treatment condition. (D) Comparison of effect sizes (Z-Score) for all 74 sgRNA targets in perfused prints and orthotopic tumors. AAVS1 and NTC respectively represent sgRNAs targeting the adeno-associated virus integration site 1 and non-targeting controls, both serving as controls. (E) Metabolic activity measurements of PDX medulloblastoma cells grown in perfused prints when treated with various drugs inhibiting top depletion targets of the CRISPRko screen (n = 3 with P values *P < 0.05 and **P < 0.01). (F) Timeline for a potential point-of-care functional oncology setting outlining the use of focused CRISPR screens in a perfused printed model for patient-specific cancer vulnerability screening.
We initiated the CRISPRko screen by transducing the library into PDX medulloblastoma cells. A portion of the transduced cells was harvested and frozen at Day 3, while the rest were split by being either encapsulated into perfused printed constructs, or injected into the cerebellum of immunodeficient (NOD-SCID-IL2R gamma knockout, or NSG) mice. A full workflow is shown in Fig. 4B. This experiment was conducted twice to ensure reproducibility of results, with the first and second trials respectively including n = 4 and n = 5 replicates for perfused prints, and n = 6 replicates for tumors. Each replicate was loaded with over 1 × 10⁵ transduced cells each to achieve over 1000-fold coverage at initial onset, and cells in all conditions were allowed to grow for 6 weeks. Genomic DNA from all samples was subsequently extracted, sequenced, and analyzed using the MAGeCK pipeline [65]. Fitness for individual genes was estimated by calculating the Zscores of the log2foldchange.
A fitness comparison between perfused prints of the first and second trials showed relatively high correlation and consistent behavior (Figure S9B) while a similar comparison between tumors of the first and second trials showed substantially more variability (Figure S9C). This was further reflected when a principal component analysis was performed across all genes of all replicates, and indicated close clustering of all print replicates, and substantially greater variation for all tumor replicates (Fig. 4C). A fitness comparison between tumor and perfused print conditions revealed a number of shared genes depleted in both conditions (Fig. 4D). These included KDR, MYC, mTOR, TOP, CDK4, and CDK6. MYC, while lacking a therapeutic targeting agent, is known to be a primary driver of Group 3 Medulloblastomas [72], and as such, its behavior is as expected. Potential use of KDR, mTOR, and CDK4/6 inhibitors in the context of medulloblastomas have been investigated with positive results [76–79], while topoisomerases have also been found to be highly expressed in medulloblastomas [80]. To validate results, inhibitory drugs against TOP, mTOR, and CDK4/6 were obtained and a growth comparison was made in perfused print PDX medulloblastoma models grown with and without each respective drug. A quantitative comparison of cell viability using the CCK8 assay revealed significantly inhibited growth in each case (Fig. 4E). Together, the results and validation confirm the overall efficacy of the studies and potential utility of this methodology in point-of-care oncology settings. As such, in a hypothetical diagnostic scenario, a targeted CRISPRko library could be transduced into a small number of cells obtained from a tumor biopsy. The transduced cells could subsequently be cultured, and the distribution of sgRNAs sequenced to obtain potential patient-specific treatment targets in a matter of weeks (Fig. 4F).
3. Discussion and conclusions
Taken together, we have developed a platform and approach to conduct therapeutically relevant genetic screens in ex vivo tissue models. Specifically, our biologically-derived matrix systems enabled long-term tissue culture, as well as ex vivo maintenance of PDXs, which are typically refractory to in vitro culture. Furthermore, the comprehensive evaluation of transcriptomic and phenotypic responses confirmed that our tissue engineered models better mimicked in vivo conditions compared to traditional 2D cell culture techniques. As reliable identification of therapeutic targets depends on the biological accuracy of the model being used, the above encouraged us to repurpose our engineered tissue model towards a point-of-care oncology application, and results of our CRISPRko screen for therapeutically-actionable targets in a medulloblastoma PDX model revealed and validated several notable hits, including mTOR, CDK4/6, and TOP all of which have been evaluated as potential targets in medulloblastomas. While no model system is ideal or a complete recapitulation of the native biological setting, our methodology enables sustained perfusable co-cultures of multiple cell types, and with media and material optimization can enable progressively closer replication of the in vivo tumor microenvironment. We thus anticipate our screening format integrating tissue engineering with existing analytic technologies could allow for both better understanding of pathological behavior in various types of cancers, as well as improved discovery of drug targets.
4. Materials and methods
4.1. 3D printing of silicone holders and long-term perfusion
Construction and long-term perfusion of flow chambers were accomplished as previously described [57]. Briefly, perfusion culture utilized a 3-component system consisting of a media reservoir, a flow chamber constructed via extrusion-printed silicone (Dow Corning Toray Sylgard SE1700), and a peristaltic pump (Watson Marlow 205U).
4.2. Cell lines
HUVECs and hMSCs used in the study were obtained from Lonza, and were each used until passage 10. HUVECs were cultured in EGM-2 (Lonza), and hMSCs were cultured in mesenchymal stem cell growth medium (MSCGM) (Lonza). MDA-MB-231 cells were obtained from ATCC and were cultured in DMEM supplemented with 10% FBS and 2 mM L-Glutamine. HEK293T cells were obtained from ATCC and were cultured in DMEM supplemented with 10% FBS. The Med411-FH medulloblastoma patient-derived xenograft line [77,81] was maintained in the Wechsler-Reya lab. Tumors were harvested and dissociated into single cells the day of culture, and were subsequently encapsulated in their respective growth environments. For Med411-FH, media was composed of NeuroCult basal medium supplemented with Proliferation Kit (StemCell Technologies), 2 μg/mL heparin (Sigma), 20 ng/mL epidermal growth factor (Sigma), and 20 ng/mL fibroblast growth factor (Lonza).
4.3. Animals
Rag2−/−; gc−/− immunodeficient mice used for orthotopic breast cancer models were maintained in animal facilities at the Powell-Focht Bioengineering Hall at the University of California San Diego. Non-obese diabetic, severe combined immunodeficiency, interleukin-2 receptor gamma knockout (NOD-SCID gamma, or NSG) mice used for intracranial tumor transplantation were purchased from Jackson Labs (Stock No: 005557 Bar Harbor, ME) and maintained in animal facilities at the Sanford Consortium for Regenerative Medicine. All experiments were performed in accordance with national guidelines and regulations, and with the approval of animal care and use committees at Sanford Burnham Prebys Medical Discovery Institute and the University of California San Diego.
4.4. Spheroidal and condensed bud cultures
Spheroids of MDA-MB-231 cells were formed by distributing cells into 96-well low-adhesion plates (Corning) at approximately 30,000 cells per well. Each well formed a single spheroid, allowed to condense over 72 h before harvesting. To form condensed buds, individual wells of 48-well plates were first coated with Matrigel (5 mg/mL). Then, approximately 30,000 MDA-MB-231 cells, 30,000 HUVECs, and 7500 hMSCs were distributed into each well, and allowed to condense over 72 h before harvesting. To harvest spheroids, wells were gently pipetted twice with a P1000 pipette to dislodge and collect the spheroid. To harvest condensed buds, a P1000 pipette tip was cut near the tip to increase the opening diameter, and used to gently pipette to dislodge and collect the bud. Spheroids or condensed buds were then collected with media into a single centrifuge tube, allowed to settle, and then had media removed by gentle pipetting.
4.5. Preparation of perfusable tissue constructs
Free-standing PVA structures were designed as previously described [57]. Briefly, geometries of interest were designed in AutoDesk Inventor, exported to the Ultimaker Cura software, and printed using the Ultimaker [3] from solid PVA filaments (Ultimaker).
For printed constructs used in the transcriptomic analysis, or the kinome-wide CRISPRko screen and validations, matrix solutions were prepared as previously described [57]. Matrices were formulated with Matrigel (4 mg/mL), fibrinogen (7.5 mg/mL), gelatin (10 mg/mL), transglutaminase (2 mg/mL), CaCl2 (2.5 mM), and thrombin (2 U/mL). Briefly, stock solutions of gelatin, CaCl2, and thrombin were prepared prior to formulation. Type A porcine skin gelatin (Sigma-Aldrich) was dissolved overnight in water (15 wt/vol %) at 70 °C, buffered to pH 7.4 using 1 M NaOH, passed through a 0.22 mm filter (Millipore), and stored at 4 °C. CaCl2 was dissolved at 250 mM in Dulbecco’s phosphate buffered saline (dPBS), and Thrombin (Sigma-Aldrich) was prepared at 500 U/mL, aliquoted, and stored at −20 °C. Solutions of both bovine plasma fibrinogen (Millipore) and transglutaminase (MooGloo) were dissolved in dPBS at 37 °C immediately prior to use, and at respective concentrations of 100 mg/mL and 50 mg/mL. During formulation, all components except Matrigel and thrombin were mixed and incubated at 37 °C for 20 min, after which Matrigel and thrombin were rapidly added. The solution was mixed, used to resuspend cells, poured into silicone single-chamber holders, and allowed to gelate over 1.5 h. PVA was then evacuated via perfusion of warm media. For printed constructs perfused at low flow rates (15 μL/min), perfusion was initiated immediately. For printed constructs perfused at high flow rates (>500 μL/min), the cured constructs were removed from single-chamber holders, and transferred to dual-chamber holders prior to perfusion (Fig. 1A).
For printed constructs used to culture human xenografts, matrix solutions were formulated from fibrinogen (7.5 mg/mL), hyaluronic acid (1 mg/mL), and thrombin (2 U/mL). All components except hyaluronic acid were prepared as previously described. Hyaluronic acid (LifeCore) was prepared at a stock concentration of 10 mg/mL by stirring overnight in PBS at 4 °C. Matrices were prepared by directly mixing all components, resuspending cells in the matrix solution, pouring into single-chamber silicone holders, allowing for gelation, and then transferring into dual-chamber holders prior to perfusion.
Endothelialization of printed constructs was achieved by resuspending HUVECs at a concentration of 5 × 10⁶ cells/mL, then injecting them into the lumen. Constructs were incubated for 30 min on either side, and left overnight to allow for adhesion before reintroducing flow.
4.6. 2D, 3D, and in vivo culture of MDA-MB-231 cells
MDA-MB-231 cells were harvested and distributed into 2D monolayer culture, static matrix, perfused print, or orthotopic mammary tumor conditions, and allowed to grow over 4 weeks. Perfused prints were prepared as previously described in a blend of Matrigel (4 mg/mL), fibrinogen (7.5 mg/mL), and gelatin (10 mg/mL). Cells selected for prints were distributed into low-adhesion 96-well plates (Corning) with approximately 30,000 cells per well. Spheroids were allowed to congregate for 72 h, after which they were harvested and encapsulated within their respective growth environments along with hMSCs at respective densities of 1 × 10⁶ cells/mL and 2.5 × 10⁵ cells/mL. Perfused prints prepared in the absence of hMSCs or HUVECs were prepared identically, but without the addition of hMSCs and with no endothelialization. Static matrices were prepared identically, but without the subsequent perfusion. Cells selected for orthotopic tumor conditions were resuspended in a 1:1 mixture of Matrigel and EGM-2, and were injected into the mammary fat pad [82] of female anesthetized Rag2−/−; gc−/− immunodeficient mice.
4.7. Spreading analysis of MDA-MB-231 cells
MDA-MB-231 cells were harvested and encapsulated in static matrices on a glass cover-slip-bottomed plate (MakTek), either with or without the addition of hMSCs. Matrices were prepared as a blend of Matrigel (4 mg/mL), fibrinogen (7.5 mg/mL), and gelatin (10 mg/mL). Cells were encapsulated at densities of 1 × 10⁶ cells/mL for MDA-MB-231, and 2.5 × 10⁵ cells/mL for hMSCs. Cells were grown in static matrix culture for 6 days, after which they were either imaged directly via confocal microscopy, or fixed, stained for F-actin, and then imaged. For quantitative elongation and spreading analysis, length and width measurements of individual cells were obtained in ImageJ.
4.8. Ex vivo culture of human xenografts
The Med411-FH PDX line [77,81] was generated by Jim Olson’s lab at Fred Hutchinson Cancer Research Center and maintained in the Wechsler-Reya Lab via orthotopic implantation of approximately 1 × 10⁵ dissociated tumor cells into the cerebellum of male NSG mice. Lines were subsequently propagated from mouse-to-mouse [81,83,84]. Immediately prior to the study, tumors were allowed to grow for approximately 6 weeks before being harvested and dissociated into single cells via treatment with 10U/mL papain (Worthington). Cells were either snap-frozen in liquid nitrogen and stored at −80 °C, immediately resuspended into media, into one of several static matrix conditions, or into perfused print conditions, and allowed to grow over 10 days. Matrix composition in static matrix conditions consisted of a blend of either Matrigel (4 mg/mL), fibrinogen (7.5 mg/mL), and gelatin (10 mg/mL), or fibrinogen (7.5 mg/mL) and hyaluronic acid (1 mg/mL). Matrix composition in perfused prints consisted of fibrinogen (7.5 mg/mL) and hyaluronic acid (1 mg/mL). Subsequent media used was either the previously-described NeuroCult formulation, or a 1:1 mixture of the NeuroCult formulation with EGM-2 (Lonza).
4.9. Extraction of RNA from MDA-MB-231 cells or PDX medulloblastoma cells for transcriptomic analysis
Snap-frozen cells had RNA extracted directly using the RNeasy Kit (Qiagen). For matrix and perfused print conditions containing only fibrin or a combination of fibrin and hyaluronic acid, matrices were cut into <1 mm pieces, resuspended in 10U/mL papain (Worthington), and allowed to incubate for 1 h at 37 °C to digest the matrix. For matrix and perfused print conditions containing Matrigel, gelatin, and fibrin, matrices were cut into <1 mm pieces, resuspended in Dispase II solution, and placed on a shaker at 60 rpm at 37 °C for 1 h. The solution was then centrifuged at 300 g for 5 min and supernatant was removed. The remaining cells and matrix fragments were then resuspended in a digestion solution provided by the Miltenyi Tumor Dissociation Kit and placed on a shaker at 60 rpm at 37 °C for 1 h. To collect cells following all matrix digestions, solutions were centrifuged at 300 g for 5 min, and supernatant was aspirated. RNA was then extracted using the RNeasy Kit.
Following RNA extraction, approximately 500 ng of RNA from each condition was used to synthesize cDNA using the NEBNext poly(A) mRNA Magnetic Isolation Module (New England Biosystems). Libraries were then constructed and indexed using the NEBNext Ultra II RNA Library Prep Kit (New England Biosystems) and NEB Multiplex Primers. The final product was purified using 1.0x Ampure XP beads, pooled in equal ratios, and sequenced using the NovaSeq with either paired end 250 bp reads or paired end 100 bp reads.
4.10. Computational analysis of MDA-MB-231 and patient-derived xenograft data
For 250 bp runs, raw reads within FASTQ files were trimmed to 100bp to remove any 3’ adapter sequences. Reads were aligned to both reference genomes HG38 and mm10 using STAR [60], and mouse read contamination was removed using XenofilteR [85]. Read counts were generated by mapping to reference transcriptome GenCode v33 using FeatureCounts. Read counts were normalized in DESeq2 both across all samples for a given gene using the geometric mean, and within each sample using the median. Relative expression profiles and differentially expressed gene lists were subsequently generated using the DESeq2 pipeline. Hierarchical clustering between replicates was performed based on the average distance in relative expression levels of all expressed genes across replicates. Principal component analysis was performed using relative expression levels of all genes across replicates. Enriched and depleted pathways were identified using Metascape [66]. Differentially expressed genes with both |Zscore| > 1.5 and FDR <0.1 were input into Metascape, and pathway lists were restricted to terms within the Gene Ontology Biological Process domain.
4.11. Comparison of cell viability for PDX medulloblastoma cells
PDX medulloblastoma cells were either suspended in culture medium, or encapsulated in a perfused printed construct composed of 7.5 mg/mL fibrin and 1 mg/mL hyaluronan, then allowed to grow over 21 days. Notably, because the matrix was repeatedly being digested by the medulloblastoma cells, cells in the perfused print conditions needed to be extracted from the matrix via papain-dissociation at 8 and 14 days. Cell viability was measured using a Trypan Blue assay, at 2-day or 3-day intervals for the suspension cell culture condition, and at each instance of re-encapsulation for the perfused print condition.
4.12. Kinome-wide CRISPR knockout screen
The Brunello Human Kinome CRISPR Knockout Library [86] (Addgene 75314) was transformed into Stbl4 chemically competent Escherichia coli (Invitrogen), which were subsequently incubated overnight at 37 °C in 100 mL of carbenicillin (50 mg/mL). Plasmid DNA was then extracted with a QIAprep Spin Maxiprep Kit (Qiagen).
To create individual validation constructs, the LentiCRISPR v2 plasmid [40] (Addgene 52961) was digested via BSMB1, and individual guide sequences were inserted by Gibson assembly. Resulting plasmids were transformed into Stbl3 chemically competent Escherichia coli, which were plated on carbenicillin (50 mg/mL) LB plates and incubated for 18 h at 37 °C. Colonies were individually transferred into 5 mL of carbenicillin (50 mg/mL), and plasmid DNA was extracted with a Qiaprep Spin Miniprep Kit (Qiagen).
To produce lentivirus particles, 36 mL of Lipofectamine 2000 (Life Technologies) was added to 1.5 mL of Opti-MEM (Life Technologies), while 3 mg of pMD2. G (Addgene 12259), 12 mg of pCMV delta R8.2 (Addgene 12263), and either 12 mg of the pooled vector library or 9 mg of a single guide construct were added to a separate 1.5 mL of Opti-MEM. Both solutions were incubated for 5 min at room temperature, after which they were mixed and allowed to incubate for an additional 30 min. This final transfection solution was added dropwise to a 15 cm tissue culture dish of HEK 293 T cells at approximately 60% confluency prior. Notably, a single solution of this composition was used to transfect a single 15 cm dish. Supernatant was collected after 48 and 72 h, filtered through 0.45 mm Steriflip filters (Millipore), and concentrated using Amicon Ultra-15 centrifugal ultrafilters (Millipore). Final viral solutions were aliquoted and stored long-term at −80 °C.
For viral transduction, MDA-MB-231 cells were grown to approximately 30% confluency on 15 cm tissue culture dishes, and supplemented with medium containing polybrene (8 mg/mL, Millipore) and enough viral particles to produce a 0.3 MOI. After 24 h, medium was replaced. After an additional 24 h, selection was initiated by supplementing medium with puromycin (4 mg/mL, Millipore). Selection was allowed to continue for 24 h, after which cells were harvested and distributed into one of seven conditions. Replicates for each condition contained a minimum of 3 million cells each to achieve approximately 1000-fold library coverage. Cells selected for cell culture conditions were passaged immediately onto tissue culture plates. Cells selected for orthotopic tumor conditions were resuspended in a 1:1 mixture of Matrigel and EGM-2, and were respectively injected into the mammary fat pad [70,82] of anesthetized Rag2−/−; gc−/− immunodeficient mice. Cells selected for perfused print conditions were distributed into low-adhesion 96-well plates (Corning) with approximately 30,000 cells per well. Spheroids were allowed to congregate for 72 h, after which spheroids selected for static matrix or either of two perfused print conditions were harvested and encapsulated within their respective growth environments.
4.13. Targeted CRISPR knockout screen in PDX models
The puromycin-resistance domain of the LentiCRISPR v2 plasmid [40] was excised and replaced with an eGIP reporter sequence [87]. A total of 66 unique gene-targeting sgRNAs, 4 non-targeting control sgRNAs, and 4 AAVS1-targeting sgRNAs were inserted individually by Gibson assembly into the plasmid via a BsmBI cut site. For each sgRNA, the Gibson assembly was transformed into chemically competent Stbl3 cells (Invitrogen), and sgRNA identity was confirmed via sanger sequencing of individually purified clones. Plasmid DNA here was extracted using a QIAprep Spin Miniprep Kit (Qiagen). The sequence validated plasmids were then pooled and transformed into Stbl4 electrocompetent Escherichia coli (Invitrogen), which were recovered for 1 h at 37 °C in SOC media (Thermo). Subsequently, the transformed Escherichia coli were used to inoculate a 100 mL culture of LB-carbenicillin (50 mg/mL) and incubated overnight at 37 °C. Plasmid DNA was then extracted with a QIAprep Spin Maxiprep Kit (Qiagen).
Production of lentivirus particles was conducted identically to the previous description. For viral transduction, PDX medulloblastoma cells were supplemented with medium containing polybrene (8 mg/mL, Millipore) and enough viral particles to produce a 0.3 MOI. After 24 h, medium was replaced. After 72 h, cells were harvested and distributed into either perfused print conditions, or orthotopic tumor conditions. Replicates for each condition contained a minimum of 1 × 10⁵ transduced cells to achieve >1000-fold library coverage. Cells selected for perfused print conditions were encapsulated within a matrix of 5 mg/mL fibrin and 1 mg/mL hyaluronan, and allowed to grow for 6 weeks. Because digestion of the matrices occurred, cells were intermittently freed from the matrices via papain-digestion, and re-encapsulated.
4.14. Extraction and processing of gDNA for screen analysis
Genomic DNA was directly extracted from cell culture samples via the DNeasy Blood and Tissue Kit (Qiagen). For perfused print and tumor samples, cells were first isolated from their matrix environments. Matrices or tissue were cut into <1 mm fragments, then resuspended in Dispase II solution (Millipore) and incubated at 37 °C on a shaker at 60 rpm for 1.5 h. The solution was then centrifuged for 5 min at 300 g, supernatant was aspirated, and the remaining cells and matrix fragments were resuspended in the digestion solution provided by the Miltenyi Tumor Dissociation Kit (Miltenyi Biotec) and incubated at 37 °C on a shaker at 60 rpm for 1.5 h. The solution was then centrifuged for 5 min at 300 g, and supernatant was aspirated. DNA was then extracted from the remaining cells via the DNeasy Blood and Tissue Kit (Qiagen).
Guide RNA sequences were amplified using Kapa Hifi HotStart polymerase (Roche). An approximately 350 bp fragment was amplified in the PCR 1 reaction using primers containing the Illumina adaptor sequences, with input quantities achieving 1000-fold coverage. Of note, conditions without enough cells or DNA to account for a minimum 500-fold coverage were not processed further. Amplicons were purified using the PCR Purification Kit (Qiagen), and 50 ng of product was transferred to the PCR 2 reaction. Amplicons from the knockout library samples were indexed using either NEBNext Single Index Oligos for Illumina (New England Biosystems) or NEBNext Multiplex Oligos for Illumina kit (New England Biosystems). The final product was purified using 1.2x volume of Ampure XP beads, mixed in equal ratios, and sequenced on either the HiSeq 4000 or NovaSeq with single end 75 bp reads or paired end 100 bp reads respectively. Amplicons from validation samples were indexed using NEBNext Multiplex Oligos for Illumina kit (New England Biosystems). The final product was purified using 1.0x volume of Ampure XP beads, mixed in equal ratios, and sequenced on the NovaSeq with paired end 250 bp reads.
4.15. Computational analysis of kinome-wide knockout library data
Raw FASTQ files were analyzed using the MAGeCK software to both quantify guides and test for enrichment or depletion. Guides with absolute counts lower than 50 in Day 3 samples were removed from analysis. All samples were median-normalized, and replicates were compared to Day 3 samples to calculate both positive and negative guide enrichment. Alpha-robust rank aggregation (RRA) was applied to guide-level enrichment scores to obtain gene-level scores. Log2-fold change (LFC) measurements were also calculated for each guide, and gene-level LFC was calculated as the median value for all guides targeting a given gene. Notably, this was performed for all individual replicates, and for overall treatment conditions obtained by grouping all replicates for a given condition.
Coefficients of determination were calculated for pairs of both individual replicates and overall conditions by comparing gene-level LFCs for either all genes, or the union of genes in each pair with an algorithmically-determined p-value < 0.0027. Hierarchical clustering of correlational comparisons was performed using the hclust function in R, and heatmaps were generated using Prism.
Hierarchical clustering between replicates was performed based on the average distance in relative expression levels of a subset of genes consisting of the union of all genes across the 3 treatment conditions with an algorithmically-determined enrichment or depletion score of p < 0.0027, as well as a LFC value reflecting its depleted or enriched status. Principal component analysis was performed using normalized gene-level LFC values for all replicates via the C PCA function in R.
Depletion pathways were identified using Metascape [66]. The top 40 depleted hits in the cell culture, tumor, and hi-flow perfused print conditions were input into Metascape, and enriched pathway lists were restricted to terms within the Gene Ontology Biological Process domain.
4.16. Comparison to DepMap data
The raw readcount file and guide map (DepMap Public 19Q3) associated with the AVANA dataset was downloaded from the DepMap website. Genome-wide data for two experimental replicates for MDA-MB-231 cells was processed in MAGeCK and compared to plasmid data to calculate gene-level log2fold changes. Log2fold change data for all genes overlapping with those of the Brunello Human Kinome CRISPR Knockout Library was then extracted and compared to equivalent data from our week 3 samples. The resulting correlational comparison was used to calculate a coefficient of determination.
4.17. Computational analysis of targeted knockout library
Raw FASTQ files were analyzed using the MAGeCK software to both quantify guides and test for enrichment or depletion. All samples were median-normalized, and replicates were compared to Day 3 samples to calculate both positive and negative guide enrichment. Log2-fold change (LFC) measurements were calculated for each guide for all individual replicates, and for overall treatment conditions obtained by grouping all replicates for a given condition. Zscores were calculated directly from Log2-fold change measurements.
4.18. Validation of screen hits with drug treatments
Top hits from the screen, mTOR, Topoisomerase, and CDK4/6 were respectively targeted using Everolimus (SelleckChem), Irinotecan (SelleckChem), and Palbociclib (SelleckChem). For storage, stock solutions of Everolimus and Irinotecan were prepared by dissolving at 10 mM in DMSO, while a stock solution of Palbociclib was prepared by dissolving at 10 mM in water. All stock solutions were stored at −80 °C. In all cases, perfused prints with PDX medulloblastoma cells were prepared as previously described, and allowed to grow for 72 h. Perfusion media was then supplemented with drugs for 48 h. Everolimus and Palbociclib were respectively supplemented at 10 μM, while Irinotecan was supplemented at 5 μM. After 48 h, the drug supplementation was removed, and perfusion with non-drug treated media was continued for 24 h, after which quantitative viability measurements were obtained using the CCK8 assay.
4.19. Actin staining
To stain for F-actin, matrices containing MDA-MB-231 cells were fixed in paraformaldehyde (4%) for 1 h, washed with three rinses of PBS for 30 min each, and blocked overnight using a solution of bovine serum albumin (BSA) (1%) and Triton-X100 (0.125) in PBS. Constructs were then subject to an overnight incubation with Alexa-594 phalloidin (Thermofisher) in blocking buffer at 4 °C, followed by an overnight wash with PBS.
4.20. Cell density calculations
For cell density comparisons with the MDA-MB-231 cell line, wet mass values for matrices, prints, and tumor fragments were obtained using a mass balance. Cells were then isolated from their matrix environments using a combination of Dispase II solution and the Miltenyi Tumor Dissociation Kit as described previously. Living cells were then counted using the Trypan Blue assay, and density was calculated based on the number of living cells and the final wet mass for each replicate.
For Med411-FH PDX cells, matrices could not be easily removed from their holders. Consequently, approximate cell density comparisons were calculated using the initial matrix masses loaded for each matrix and print condition. Cells were isolated from their matrix environments using either Dispase II solution or Papain as described previously. Living cells were counted using the Trypan Blue assay, and density was approximated using the number of living cells, and the original mass of matrix solution used for each condition.
4.21. Statistical analyses
Statistical parameters (mean, standard deviation) for all data shown in bar graphs were processed using GraphPad Prism v7.0. Direct statistical comparisons where indicated were conducted using a two-sided t-test. Samples used in the data are biological replicates. Hierarchical clustering for RNA-seq data was performed in R using the DESeq2, stats, genefilter, and pheatmap packages. Clustering was performed using the Pearson Correlation as the measure of distance, and the Average Distance as the method. Principal component analysis for both RNA-seq and CRISPR screening data was performed in R using the Stats package. For CRISPR screening data, all log2fold measurements were normalized as Zscores prior to analysis. Correlational comparisons, linear regressions, and calculations of coefficients of determination (R2) for all CRISPR screening datasets was performed in MATLAB.
4.22. Imaging
Widefield fluorescent microscopy images were obtained using the Leica DMi8 microscope at 10× magnification with a resolution of 0.1118 mm. Confocal images were obtained using the Zeiss 880 Airyscan Confocal.
Supplementary Material
Acknowledgements
We thank members of the Mali lab for advice with experiments and analyses. This work was generously supported by UCSD Institutional Funds, and NIH grants R01HG009285 (P.M), R01CA222826 (P.M.), R01GM123313 (P.M.), U54CA209891 (P.M.), R01CA159859 (R W.-R.), P30CA30199 (R W.-R.). Imaging was accomplished with support of the UCSD Neuroscience Microscopy Shared Facility Grant (P30 NS047101).
Footnotes
Declaration of competing interest
The authors declare the following financial interests/personal relationships which may be considered as potential competing interests: P. M. is a scientific co-founder of Shape Therapeutics, Boundless Biosciences, Navega Therapeutics, and Engine Biosciences, which have no commercial interests related to this study. The terms of these arrangements have been reviewed and approved by the University of California, San Diego in accordance with its conflict of interest policies.
Appendix A. Supplementary data
Supplementary data to this article can be found online at https://doi.org/10.1016/j.biomaterials.2021.121276.
Data availability
The data supporting this study are primarily contained within the manuscript itself along with relevant supplementary materials, and are otherwise available from the corresponding author upon request. Sequencing data from RNA-seq experiments and CRISPR screens will be available through the NCBI SRA database under the accession number PRJNA785667.
References
- [1].Levato R, et al. , From Shape to function: the next step in bioprinting, Adv. Mater. 32 (2020) 1906423. [DOI] [PMC free article] [PubMed] [Google Scholar]
- [2].Dasgupta Q, Black LD, A FRESH SLATE for 3D bioprinting, Science 365 (2019) 446–447. [DOI] [PubMed] [Google Scholar]
- [3].Lancaster MA, Knoblich JA, Organogenesis in a dish: modeling development and disease using organoid technologies, Science 345 (2014), 1247125–1247125. [DOI] [PubMed] [Google Scholar]
- [4].Drost J, Clevers H, Organoids in cancer research, Nat. Rev. Cancer 18 (2018) 407–418. [DOI] [PubMed] [Google Scholar]
- [5].Skardal A, Shupe T, Atala A, Organoid-on-a-chip and body-on-a-chip systems for drug screening and disease modeling, Drug Discov. Today 21 (2016) 1399–1411. [DOI] [PMC free article] [PubMed] [Google Scholar]
- [6].Sontheimer-Phelps A, Hassell BA, Ingber DE, Modelling cancer in microfluidic human organs-on-chips, Nat. Rev. Cancer 19 (2019) 65–81. [DOI] [PubMed] [Google Scholar]
- [7].Wolf KJ, Chen J, Coombes JD, Aghi MK, Kumar S, Dissecting and rebuilding the glioblastoma microenvironment with engineered materials, Nat. Rev. Mater. 4 (2019) 651–668. [DOI] [PMC free article] [PubMed] [Google Scholar]
- [8].Song H-HG, Rumma RT, Ozaki CK, Edelman ER, Chen CS, Vascular tissue engineering: progress, challenges, and clinical promise, Cell Stem Cell 22 (2018) 340–354. [DOI] [PMC free article] [PubMed] [Google Scholar]
- [9].Prendergast ME, Burdick JA, Recent advances in enabling technologies in 3D printing for precision medicine, Adv. Mater. 32 (2020) 1902516. [DOI] [PubMed] [Google Scholar]
- [10].Langhans SA, Three-dimensional in vitro cell culture models in drug discovery and drug repositioning, Front. Pharmacol. 9 (2018) 6. [DOI] [PMC free article] [PubMed] [Google Scholar]
- [11].Ma X, et al. , 3D bioprinting of functional tissue models for personalized drug screening and in vitro disease modeling, Adv. Drug Deliv. Rev. 132 (2018) 235–251. [DOI] [PMC free article] [PubMed] [Google Scholar]
- [12].Neal JT, et al. , Organoid modeling of the tumor immune microenvironment, Cell 175 (2018) 1972–1988, e16. [DOI] [PMC free article] [PubMed] [Google Scholar]
- [13].Li X, et al. , Oncogenic transformation of diverse gastrointestinal tissues in primary organoid culture, Nat. Med. 20 (2014) 769–777. [DOI] [PMC free article] [PubMed] [Google Scholar]
- [14].Takebe T, et al. , Vascularized and functional human liver from an iPSC-derived organ bud transplant, Nature 499 (2013) 481–484. [DOI] [PubMed] [Google Scholar]
- [15].Kim S, Lee H, Chung M, Jeon NL, Engineering of functional, perfusable 3D microvascular networks on a chip, Lab Chip 13 (2013) 1489. [DOI] [PubMed] [Google Scholar]
- [16].Hsu Y-H, Moya ML, Hughes CCW, George SC, Lee AP, A microfluidic platform for generating large-scale nearly identical human microphysiological vascularized tissue arrays, Lab Chip 13 (2013) 2990. [DOI] [PMC free article] [PubMed] [Google Scholar]
- [17].Choi Y, et al. , A microengineered pathophysiological model of early-stage breast cancer, Lab Chip 15 (2015) 3350–3357. [DOI] [PMC free article] [PubMed] [Google Scholar]
- [18].Hassell BA, et al. , Human organ chip models recapitulate orthotopic lung cancer growth, therapeutic responses, and tumor dormancy in vitro, Cell Rep. 21 (2017) 508–516. [DOI] [PubMed] [Google Scholar]
- [19].Bersini S, et al. , A microfluidic 3D in vitro model for specificity of breast cancer metastasis to bone, Biomaterials 35 (2014) 2454–2461. [DOI] [PMC free article] [PubMed] [Google Scholar]
- [20].Grigoryan B, et al. , Multivascular networks and functional intravascular topologies within biocompatible hydrogels, Science 364 (2019) 458–464. [DOI] [PMC free article] [PubMed] [Google Scholar]
- [21].Kolesky DB, Homan KA, Skylar-Scott MA, Lewis JA, Three-dimensional bioprinting of thick vascularized tissues, Proc. Natl. Acad. Sci. Unit. States Am. 113 (2016) 3179–3184. [DOI] [PMC free article] [PubMed] [Google Scholar]
- [22].Bhattacharjee T, et al. , Writing in the granular gel medium, Sci. Adv. 1 (2015), e1500655. [DOI] [PMC free article] [PubMed] [Google Scholar]
- [23].Wang Z, Mithieux SM, Weiss AS, Fabrication techniques for vascular and vascularized tissue engineering, Adv. Healthc. Mater. 8 (2019) 1900742. [DOI] [PubMed] [Google Scholar]
- [24].Kinstlinger IS, et al. , Generation of model tissues with dendritic vascular networks via sacrificial laser-sintered carbohydrate templates, Nat. Biomed. Eng. (2020), 10.1038/s41551-020-0566-1. [DOI] [PubMed] [Google Scholar]
- [25].Kang H-W, et al. , A 3D bioprinting system to produce human-scale tissue constructs with structural integrity, Nat. Biotechnol. 34 (2016) 312–319. [DOI] [PubMed] [Google Scholar]
- [26].Kim W, et al. , Efficient myotube formation in 3D bioprinted tissue construct by biochemical and topographical cues, Biomaterials 230 (2020) 119632. [DOI] [PMC free article] [PubMed] [Google Scholar]
- [27].Nguyen D-HT, et al. , Biomimetic model to reconstitute angiogenic sprouting morphogenesis in vitro, Proc. Natl. Acad. Sci. Unit. States Am. 110 (2013) 6712–6717. [DOI] [PMC free article] [PubMed] [Google Scholar]
- [28].Song KH, Highley CB, Rouff A, Burdick JA, Complex 3D-printed microchannels within cell-degradable hydrogels, Adv. Funct. Mater. 28 (2018) 1801331. [Google Scholar]
- [29].Lee A, et al. , 3D bioprinting of collagen to rebuild components of the human heart, Science 365 (2019) 482–487. [DOI] [PubMed] [Google Scholar]
- [30].Skylar-Scott MA, et al. , Biomanufacturing of organ-specific tissues with high cellular density and embedded vascular channels, Sci. Adv. 5 (2019), eaaw2459. [DOI] [PMC free article] [PubMed] [Google Scholar]
- [31].Kampmann M, Bassik MC, Weissman JS, Functional genomics platform for pooled screening and generation of mammalian genetic interaction maps, Nat. Protoc. 9 (2014) 1825–1847. [DOI] [PMC free article] [PubMed] [Google Scholar]
- [32].Morgens DW, Deans RM, Li A, Bassik MC, Systematic comparison of CRISPR/Cas9 and RNAi screens for essential genes, Nat. Biotechnol. 34 (2016) 634–636. [DOI] [PMC free article] [PubMed] [Google Scholar]
- [33].Schuster A, et al. , RNAi/CRISPR screens: from a pool to a valid hit, Trends Biotechnol. 37 (2019) 38–55. [DOI] [PubMed] [Google Scholar]
- [34].Han K, et al. , CRISPR screens in cancer spheroids identify 3D growth-specific vulnerabilities, Nature 580 (2020) 136–141. [DOI] [PMC free article] [PubMed] [Google Scholar]
- [35].Doench JG, Am I ready for CRISPR? A user’s guide to genetic screens, Nat. Rev. Genet. 19 (2018) 67–80. [DOI] [PubMed] [Google Scholar]
- [36].Koike-Yusa H, Li Y, Tan E-P, Velasco-Herrera MDC, Yusa K, Genome-wide recessive genetic screening in mammalian cells with a lentiviral CRISPR-guide RNA library, Nat. Biotechnol. 32 (2014) 267–273. [DOI] [PubMed] [Google Scholar]
- [37].Chen S, et al. , Genome-wide CRISPR screen in a mouse model of tumor growth and metastasis, Cell 160 (2015) 1246–1260. [DOI] [PMC free article] [PubMed] [Google Scholar]
- [38].Liberali P, Snijder B, Pelkmans L, Single-cell and multivariate approaches in genetic perturbation screens, Nat. Rev. Genet. 16 (2015) 18–32. [DOI] [PubMed] [Google Scholar]
- [39].Gilbert LA, et al. , Genome-scale CRISPR-mediated control of gene repression and activation, Cell 159 (2014) 647–661. [DOI] [PMC free article] [PubMed] [Google Scholar]
- [40].Sanjana NE, Shalem O, Zhang F, Improved vectors and genome-wide libraries for CRISPR screening, Nat. Methods 11 (2014) 783–784. [DOI] [PMC free article] [PubMed] [Google Scholar]
- [41].Shalem O, Sanjana NE, Zhang F, High-throughput functional genomics using CRISPR–Cas9, Nat. Rev. Genet. 16 (2015) 299–311. [DOI] [PMC free article] [PubMed] [Google Scholar]
- [42].Replogle JM, et al. , Combinatorial single-cell CRISPR screens by direct guide RNA capture and targeted sequencing, Nat. Biotechnol. (2020), 10.1038/s41587-020-0470-y. [DOI] [PMC free article] [PubMed] [Google Scholar]
- [43].Takahashi N, et al. , 3D culture models with CRISPR screens reveal hyperactive NRF2 as a prerequisite for spheroid formation via regulation of proliferation and ferroptosis, Mol. Cell. (2020). [DOI] [PMC free article] [PubMed] [Google Scholar]
- [44].Wong ASL, et al. , Multiplexed barcoded CRISPR-Cas9 screening enabled by CombiGEM, Proc. Natl. Acad. Sci. Unit. States Am. 113 (2016) 2544–2549. [DOI] [PMC free article] [PubMed] [Google Scholar]
- [45].Joung J, et al. , Genome-scale CRISPR-Cas9 knockout and transcriptional activation screening, Nat. Protoc. 12 (2017) 828–863. [DOI] [PMC free article] [PubMed] [Google Scholar]
- [46].Adamson B, et al. , A multiplexed single-cell CRISPR screening platform enables systematic dissection of the unfolded protein response, Cell 167 (2016) 1867–1882, e21. [DOI] [PMC free article] [PubMed] [Google Scholar]
- [47].Shen JP, et al. , Combinatorial CRISPR–Cas9 screens for de novo mapping of genetic interactions, Nat. Methods 14 (2017) 573–576. [DOI] [PMC free article] [PubMed] [Google Scholar]
- [48].Mengwasser KE, et al. , Genetic screens reveal FEN1 and APEX2 as BRCA2 synthetic lethal targets, Mol. Cell. 73 (2019) 885–899, e6. [DOI] [PMC free article] [PubMed] [Google Scholar]
- [49].Ringel T, et al. , Genome-scale CRISPR screening in human intestinal organoids identifies drivers of TGF-β resistance, Cell Stem Cell 26 (2020) 431–440, e8. [DOI] [PubMed] [Google Scholar]
- [50].Murakami K, et al. , A genome-scale CRISPR screen reveals factors regulating Wnt-dependent renewal of mouse gastric epithelial cells, Proc. Natl. Acad. Sci. Unit. States Am. 118 (2021), e2016806118. [DOI] [PMC free article] [PubMed] [Google Scholar]
- [51].Luo J, CRISPR/Cas9: from genome engineering to cancer drug discovery, Trends Canc. 2 (2016) 313–324. [DOI] [PMC free article] [PubMed] [Google Scholar]
- [52].Behan FM, et al. , Prioritization of cancer therapeutic targets using CRISPR–Cas9 screens, Nature 568 (2019) 511–516. [DOI] [PubMed] [Google Scholar]
- [53].Meyers RM, et al. , Computational correction of copy number effect improves specificity of CRISPR–Cas9 essentiality screens in cancer cells, Nat. Genet. 49 (2017) 1779–1784. [DOI] [PMC free article] [PubMed] [Google Scholar]
- [54].Kesselheim AS, Avorn J, The most transformative drugs of the past 25 years: a survey of physicians, Nat. Rev. Drug Discov. 12 (2013) 425–431. [DOI] [PubMed] [Google Scholar]
- [55].Martino SD et al. Overview OF FDA-approved anti cancer drugs used for targeted therapy. Mult. Myeloma 8. [Google Scholar]
- [56].Fong ELS, Harrington DA, Farach-Carson MC, Yu H, Heralding a new paradigm in 3D tumor modeling, Biomaterials 108 (2016) 197–213. [DOI] [PMC free article] [PubMed] [Google Scholar]
- [57].Hu M, et al. , Facile engineering of long-term culturable ex vivo vascularized tissues using biologically derived matrices, Adv. Healthc. Mater. 7 (2018) 1800845. [DOI] [PMC free article] [PubMed] [Google Scholar]
- [58].Martin FT, et al. , Potential role of mesenchymal stem cells (MSCs) in the breast tumour microenvironment: stimulation of epithelial to mesenchymal transition (EMT), Breast Cancer Res. Treat. 124 (2010) 317–326. [DOI] [PubMed] [Google Scholar]
- [59].Betapudi V, Licate LS, Egelhoff TT, Distinct roles of nonmuscle myosin II isoforms in the regulation of MDA-MB-231 breast cancer cell spreading and migration, Cancer Res. 66 (2006) 4725–4733. [DOI] [PubMed] [Google Scholar]
- [60].Dobin A, et al. , STAR: ultrafast universal RNA-seq aligner, Bioinformatics 29 (2013) 15–21. [DOI] [PMC free article] [PubMed] [Google Scholar]
- [61].Love MI, Huber W, Anders S, Moderated estimation of fold change and dispersion for RNA-seq data with DESeq2, Genome Biol. 15 (2014) 550. [DOI] [PMC free article] [PubMed] [Google Scholar]
- [62].Ashburner M, et al. , Gene Ontology: tool for the unification of biology, Nat. Genet. 25 (2000) 25–29. [DOI] [PMC free article] [PubMed] [Google Scholar]
- [63].The Gene Ontology Consortium, The gene Ontology resource: 20 years and still GOing strong, Nucleic Acids Res. 47 (2019) D330–D338. [DOI] [PMC free article] [PubMed] [Google Scholar]
- [64].Sanson KR, et al. , Optimized libraries for CRISPR-Cas9 genetic screens with multiple modalities, Nat. Commun. 9 (2018) 5416. [DOI] [PMC free article] [PubMed] [Google Scholar]
- [65].Li W, et al. , MAGeCK Enables Robust Identification of Essential Genes from Genome-Scale CRISPR/Cas9 Knockout Screens, 2014, p. 12. [DOI] [PMC free article] [PubMed] [Google Scholar]
- [66].Zhou Y, et al. , Metascape provides a biologist-oriented resource for the analysis of systems-level datasets, Nat. Commun. 10 (2019) 1523. [DOI] [PMC free article] [PubMed] [Google Scholar]
- [67].Liu X, et al. , Conditional reprogramming and long-term expansion of normal and tumor cells from human biospecimens, Nat. Protoc. 12 (2017) 439–451. [DOI] [PMC free article] [PubMed] [Google Scholar]
- [68].Friedman HS, et al. , Establishment and characterization of the human medulloblastoma cell line and transplantable xenograft D283 med, J. Neuropathol. Exp. Neurol. 44 (1985) 592–605. [DOI] [PubMed] [Google Scholar]
- [69].Jacobsen PF, Jenkyn DJ, Papadimitriou JM, Establishment of a human medulloblastoma cell line and its heterotransplantation into nude mice, J. Neuropathol. Exp. Neurol. 44 (1985) 472–485. [DOI] [PubMed] [Google Scholar]
- [70].McAllister RM, et al. , Establishment of a human medulloblastoma cell line, Int. J. Cancer 20 (1977) 206–212. [DOI] [PubMed] [Google Scholar]
- [71].Northcott PA, Dubuc AM, Pfister S, Taylor MD, Molecular subgroups of medulloblastoma, Expert Rev. Neurother. 12 (2012) 871–884. [DOI] [PMC free article] [PubMed] [Google Scholar]
- [72].Menyhárt O, Giangaspero F, Győrffy B, Molecular markers and potential therapeutic targets in non-WNT/non-SHH (group 3 and group 4) medulloblastomas, J. Hematol. Oncol.J Hematol Oncol 12 (2019) 29. [DOI] [PMC free article] [PubMed] [Google Scholar]
- [73].Pawlowski J, Kraft AS, Bax-induced apoptotic cell death, Proc. Natl. Acad. Sci. Unit. States Am. 97 (2000) 529–531. [DOI] [PMC free article] [PubMed] [Google Scholar]
- [74].Sheikh MS, Hollander MC, Fornace AJ, Role of Gadd 45 in apoptosis, Biochem. Pharmacol. 59 (2000) 43–45. [DOI] [PubMed] [Google Scholar]
- [75].Chi Q, et al. , α-E-Catenin (CTNNA1) inhibits cell proliferation, invasion and EMT of bladder cancer, Cancer Manag. Res. 12 (2020) 12747–12758. [DOI] [PMC free article] [PubMed] [Google Scholar]
- [76].Bai R-Y, Staedtke V, Rudin CM, Bunz F, Riggins GJ, Effective treatment of diverse medulloblastoma models with mebendazole and its impact on tumor angiogenesis, Neuro Oncol. 17 (2015) 545–554. [DOI] [PMC free article] [PubMed] [Google Scholar]
- [77].Pei Y, et al. , HDAC and PI3K antagonists cooperate to inhibit growth of MYC-driven medulloblastoma, Cancer Cell 29 (2016) 311–323. [DOI] [PMC free article] [PubMed] [Google Scholar]
- [78].Cook Sangar ML, et al. , Inhibition of CDK4/6 by Palbociclib significantly extends survival in medulloblastoma patient-derived xenograft mouse models, Clin. Cancer Res. 23 (2017) 5802–5813. [DOI] [PMC free article] [PubMed] [Google Scholar]
- [79].Buonamici S, et al. , Interfering with resistance to smoothened antagonists by inhibition of the PI3K pathway in medulloblastoma, Sci. Transl. Med. 2 (2010), 51ra70–51ra70. [DOI] [PMC free article] [PubMed] [Google Scholar]
- [80].Hashimoto Y, et al. , Rethinking medulloblastoma from a targeted therapeutics perspective, J. Neuro Oncol. 139 (2018) 713–720. [DOI] [PMC free article] [PubMed] [Google Scholar]
- [81].Brabetz S, et al. , A biobank of patient-derived pediatric brain tumor models, Nat. Med. 24 (2018) 1752–1761. [DOI] [PubMed] [Google Scholar]
- [82].Zhang G-L, Zhang Y, Cao K-X, Wang X-M, Orthotopic injection of breast cancer cells into the mice mammary fat pad, JoVE 58604 (2019), 10.3791/58604. [DOI] [PubMed] [Google Scholar]
- [83].Girard E, et al. , Efficacy of cabazitaxel in mouse models of pediatric brain tumors, Neuro Oncol. 17 (2015) 107–115. [DOI] [PMC free article] [PubMed] [Google Scholar]
- [84].Morfouace M, et al. , Pemetrexed and gemcitabine as combination therapy for the treatment of Group 3 medulloblastoma, Cancer Cell 25 (2014) 516–529. [DOI] [PMC free article] [PubMed] [Google Scholar]
- [85].Kluin RJC, et al. , XenofilteR: computational deconvolution of mouse and human reads in tumor xenograft sequence data, BMC Bioinf. 19 (2018) 366. [DOI] [PMC free article] [PubMed] [Google Scholar]
- [86].Doench JG, et al. , Optimized sgRNA design to maximize activity and minimize off-target effects of CRISPR-Cas9, Nat. Biotechnol. 34 (2016) 184–191. [DOI] [PMC free article] [PubMed] [Google Scholar]
- [87].Zou J, et al. , Gene targeting of a disease-related gene in human induced pluripotent stem and embryonic stem cells, Cell Stem Cell 5 (2009) 97–110. [DOI] [PMC free article] [PubMed] [Google Scholar]
Associated Data
This section collects any data citations, data availability statements, or supplementary materials included in this article.
Supplementary Materials
Data Availability Statement
The data supporting this study are primarily contained within the manuscript itself along with relevant supplementary materials, and are otherwise available from the corresponding author upon request. Sequencing data from RNA-seq experiments and CRISPR screens will be available through the NCBI SRA database under the accession number PRJNA785667.