

Summary
The application of enzymes as biocatalysts in industrial processes has great potential due to their outstanding stereo‐, regio‐ and chemoselectivity. Using autodisplay, enzymes can be immobilized on the cell surface of Gram‐negative bacteria such as Escherichia coli. In the present study, the surface display of an alcohol dehydrogenase (ADH) and a cyclohexanone monooxygenase (CHMO) on E. coli was investigated. Displaying these enzymes on the surface of E. coli resulted in whole‐cell biocatalysts accessible for substrates without further purification. An apparent maximal reaction velocity V MAX(app) for the oxidation of cyclohexanol with the ADH whole‐cell biocatalysts was determined as 59.9 mU ml−1. For the oxidation of cyclohexanone with the CHMO whole‐cell biocatalysts a V MAX(app) of 491 mU ml−1 was obtained. A direct conversion of cyclohexanol to ε‐caprolactone, which is a known building block for the valuable biodegradable polymer polycaprolactone, was possible by combining the two whole‐cell biocatalysts. Gas chromatography was applied to quantify the yield of ε‐caprolactone. 1.12 mM ε‐caprolactone was produced using ADH and CHMO displaying whole‐cell biocatalysts in a ratio of 1:5 after 4 h in a cell suspension of OD578nm 10. Furthermore, the reaction cascade as applied provided a self‐sufficient regeneration of NADPH for CHMO by the ADH whole‐cell biocatalyst.
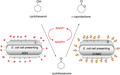
Autodisplay for enzymatic cascade reactions. Conversion of cyclohexanol to ε‐caprolactone with E. coli cells displaying ADH and CHMO. The cascade as applied provided a self‐sufficient regeneration of NADPH for CHMO by the ADH whole‐cell biocatalyst.
Introduction
Biocatalysts provide great advantages in comparison to conventional catalysts. Enzymatic reactions are environmentally friendly due to the absence of organic solvents and milder reaction conditions resulting in lower energy costs (Winkler et al., 2021). These properties make them attractive for industrial applications. Furthermore, biocatalysts often provide a high chemo‐, regio‐ and enantioselectivity, which is difficult to facilitate with conventional chemical catalysts (Clouthier and Pelletier, 2012). By combining two or more enzymes or biocatalysts in one reaction, multi‐enzyme cascades that produce compounds in one setup without the isolation of intermediates can be created. However, there are several limitations for the large‐scale application of biocatalysts in industrial processes, such as stability issues or insufficient functional expression of the biocatalysts (Aalbers and Fraaije, 2017). Another drawback is that for some enzymes elaborate purification steps are necessary to obtain the biocatalysts in pure form. The cofactor dependency of some enzymes could be a challenge as well, in particular in case these enzymes require expensive cofactors as e.g. NADPH.
Enzyme immobilization has been used to enhance the stability of various enzymes (Bornscheuer, 2003). Displaying recombinant proteins on the surface of Gram‐negative bacteria using natural protein transport pathways appears as a kind of natural immobilization, as alternative to methods such as entrapment in polymeric gels or binding to nanoparticles (Dyal et al., 2003). The natural immobilization of enzymes by surface anchoring leads to stabilizing effects as shown before (Kranen et al., 2011). The display of recombinant proteins on the cell surface by the type Va secretion pathway of Gram‐negative bacteria using autotransporters, referred to as autodisplay, has been successfully applied to a number of different enzymes such as esterases, oxidoreductases and electron transfer proteins (Jose and Meyer, 2007; Schüürmann et al., 2014). Type Va autotransporters are the so‐called classical autotransporters. They consist of a N‐terminal signal peptide, followed by the passenger domain and a C‐terminal translocation unit, containing a β‐barrel (Meuskens et al., 2019). The signal peptide is required for transport across the inner membrane via the Sec‐pathway. During transport the signal peptide is cleaved off and in the periplasm, the protein is kept in an unfolded state by several chaperones (Henderson et al., 1998; Mori and Ito, 2001). By the aid of the β‐barrel assembly machinery, the β‐barrel of the translocation unit is inserted into the outer membrane and the passenger is translocated to the cell surface (Ieva et al., 2011). Employing this strategy, the enzymes were transported to the cell surface by C‐terminal fusion to an autotransporter translocation unit. The β‐barrel of the translocation unit serves as an anchor for the catalytically active enzyme. More recently, it has been shown that recombinant enzymes can be displayed by a so‐called inverse autotransporter domain as well on the surface of a Gram‐negative bacterium (Gercke et al., 2021). Inverse autotransporters belong to secretion type Ve and have a different domain organization compared to classical autotransporters (Oberhettinger et al., 2015). Type Ve autotransporters possess an N‐terminal signal peptide as well, which is, however, followed by the translocation unit (β‐barrel plus linker) and the passenger domain at the C‐terminus. The major difference with respect to the display of recombinant proteins is that with classical autotransporters the passenger is connected with its C‐terminus to the membrane anchoring β‐barrel, whereas with the inverse autotransporters, the passenger is connected by its N‐terminus to the membrane anchoring β‐barrel. This may be of consequence for the enzyme activity of the passenger, depending on the location of the active site or whether flexibility is required for e.g. substrate uptake at the C‐terminus or the N‐terminus (Gercke et al., 2021). The whole biocatalyst obtained by autodisplay, independent of using a classical or an inverse autotransporter, can easily be separated from any kind of solution by centrifugation. This enables a simple purification and even a reusability of the biocatalyst (Tozakidis et al., 2015; Schüürmann et al., 2017). In comparison to whole‐cell biocatalysts with intracellular expression of recombinant enzymes, displaying enzymes at the cell surface could alleviate such problems as limited substrate uptake or partitioning of oxygen for oxygenase‐based catalysis and respiration. Furthermore, for some transmembrane enzymes a membrane is inevitable for activity (Miyamoto et al., 2015). In addition, the anchoring of proteins on the cell surface was shown to have stabilizing effects (Kranen et al., 2011; Quehl et al., 2017).
ε‐Caprolactone is an important industrial building block for different polymers such as polycaprolactone or nylon 6. In industrial processes currently applied, ε‐caprolactone is produced by the UCC (Union Carbide Corporation) process with an output of over 10 000 metric tons annually (Weissermel et al., 2003). In this process, ε‐caprolactone is obtained by the Baeyer‐Villiger oxidation of cyclohexanone using stoichiometric amounts of peracetic acid. Baeyer‐Villiger monooxygenases (BVMOs) can be used as an enzymatic alternative to produce ε‐caprolactone. BVMOs are known to oxidize cyclohexanone to ε‐caprolactone using molecular oxygen and the cofactor NADPH (Balke et al., 2018). To start with cyclohexanol as a substrate, such BVMO needs to act in concert with an alcohol dehydrogenase (ADH), which can oxidize cyclohexanol to cyclohexanone. The cofactor NADPH can be generated from NADP+ simultaneously by the ADH reaction. Such reaction cascade was reported before by Mallin et al. (2013) using a thermostable polyol dehydrogenase and a cyclohexanone monooxygenase (CHMO). As BVMO, CHMO is able to convert cyclohexanone to ε‐caprolactone by utilizing NADPH as a cofactor. 4.2 mM cyclohexanol were converted into ε‐caprolactone after 4.5 h. The activity of the CHMO was determined to be the limiting step in the formation of ε‐caprolactone (Mallin et al., 2013). Kohl et al. (2018) showed that the co‐expression of CHMO from Acinetobacter calcoaceticus with four mutations (C376L/M400I/T415C/A463C) and an ADH from Lactobacillus kefir in a single cell of E. coli led to the conversion of cyclohexanol to ε‐caprolactone by the whole‐cell biocatalyst obtained thereby. The four mutations within CHMO led to a higher long‐term stability in comparison to the wild type enzyme (Schmidt et al., 2015a).
In the present study, it is shown that an ADH (EC 1.1.1.2) from Lactobacillus kefir and the mutated CHMO (EC 1.14.13.22) from Acinetobacter sp. (Kohl et al., 2018) can be displayed on the surface of E. coli in an active form. E. coli cells displaying ADH oxidized cyclohexanol to cyclohexanone under reduction of NADP+ to NADPH. In consequence, with cyclohexanol as substrate a combination of E. coli cells displaying ADH and E. coli cells displaying CHMO led to the synthesis of ε‐caprolactone. Moreover, the surface displayed ADH enabled a regeneration of the cofactor NADPH from NADP+, which was sufficient for the oxidation reaction of CHMO (Fig. 1).
Fig. 1.
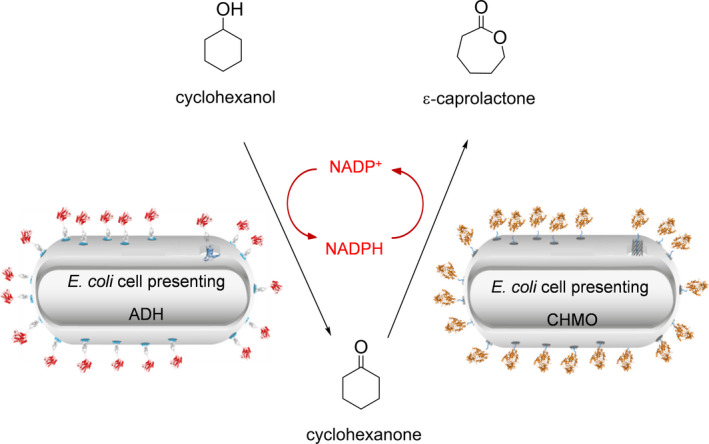
Conversion of cyclohexanol to ε‐caprolactone with E. coli cells displaying the ADH and E. coli cells displaying the CHMO. The ADH oxidizes cyclohexanol with the cofactor NADP+, resulting in the products cyclohexanone and NADPH. These are then converted by the CHMO into ε‐caprolactone and NADP+.
Results and discussion
Surface display of cyclohexanone monooxygenase (CHMO) from Acinetobacter sp
The autotransporter secretion pathway as known from Gram‐negative bacteria was used to display the cyclohexanone monooxygenase (CHMO) from Acinetobacter sp. on the cell surface of E. coli. Therefore, a plasmid was constructed containing the coding sequence for an artificial autotransporter fusion protein comprising CHMO and the autotransporter translocation domain of EhaA. EhaA belongs to the classical autotransporter proteins and was described for maximized autotransporter‐mediated expression (MATE) before (Sichwart et al., 2015). The artificial autotransporter fusion protein CHMO‐EhaA consisted of a CtxB signal peptide at the N‐terminus, followed by the passenger CHMO with four mutations (C376L/M400I/T415C/A463C) (Schmidt et al., 2015a) (Fig. S1), a G4S‐G2S‐G4S‐G4S‐G4S linker (GS‐linker), and the EhaA autotransporter translocation domain (Quehl et al., 2017) (Fig. 2A). The GS‐linker between the CHMO and the EhaA autotransporter translocation domain was incorporated to increase the flexibility between CHMO and its membrane anchor. It was shown before that this additional amino acid sequence can increase the activity of displayed enzymes (Quehl et al., 2017; Schüürmann et al., 2017). Expression of the CHMO‐EhaA autotransporter fusion protein was set under control of a rhamnose‐dependent rhaBAD promoter and the resulting plasmid was named pCHMO‐EhaA.
Fig. 2.
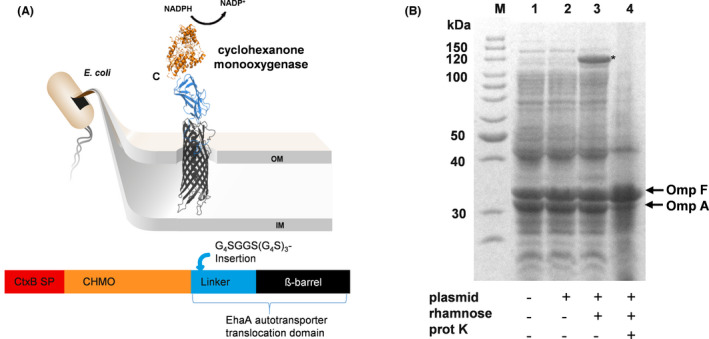
Schematic illustration of the CHMO‐EhaA autotransporter fusion protein (A) and SDS‐PAGE of the outer membrane protein preparations (B). A schematically shows the recombinant autotransporter fusion protein for the surface display of the enzyme CHMO. The protein structures were predicted with the web server RaptorX. B: Expression of EhaA‐CHMO autotransporter fusion protein and proof of surface display of CHMO via SDS‐PAGE of outer membrane protein preparations and protease accessibility test. M: Protein marker. Lane 1: Sample from E. coli cells without pCHMO‐EhaA; Lane 2: Sample from E. coli cells with the plasmid pCHMO‐EhaA but without l‐rhamnose during cultivation; Lane 3: Sample from E. coli cells with pCHMO‐EhaA and l‐rhamnose during cultivation; Lane 4: Sample from E. coli cells with pCHMO‐EhaA after treatment with proteinase K. The protein band of the CHMO autotransporter fusion protein is marked with (*).
Escherichia coli BL21 was transformed with pCHMO‐EhaA and expression of the CHMO‐EhaA autotransporter fusion protein was analysed by SDS‐PAGE. For this purpose, outer membrane proteins were isolated after induction by 1 mM l‐rhamnose. As shown in Fig. 2B, induction of protein expression resulted in a clearly visible band at around 120 kDa (lane 3). This band did not appear in E. coli BL21 cells without plasmid and E. coli BL21 cells with plasmid but without l‐rhamnose addition, which both served as controls (Fig. 2B, lane 1 and 2). The size of approximately 120 kDa is in accordance with the expected size of the autotransporter fusion protein CHMO‐EhaA, which was calculated to be 115.4 kDa without signal peptide. To verify the surface exposure of CHMO, a protease accessibility test with proteinase K was applied. For this purpose, E. coli BL21 pCHMO‐EhaA cells were treated with proteinase K after induction with l‐rhamnose. Proteinase K is not able to cross the outer membrane, and hence, it can only digest proteins located at the cell surface. After proteinase K digestion the protein band of 120 kDa corresponding to the CHMO‐EhaA autotransporter fusion protein was no longer detectable in the outer membrane protein preparation (Fig. 2B, lane 4), indicating its surface exposure. The natural outer membrane protein A (Omp A) of E. coli with a size of 35 kDa can be considered as an internal control of membrane integrity. It possesses a periplasmic extension, which is degraded, resulting in a degradation product of 19 kDa, in case the outer membrane becomes leaky, allowing larger molecules such as proteinase K to enter the periplasm (Maurer et al., 1997; Jong et al., 2012). After treatment with proteinase K, the Omp A band appears to be less prominent than the Omp A band before treatment with proteinase K (Fig. 2B, lane 4 vs. lane 3). However, this seems not to be due to the degradation of Omp A, because a degradation band of Omp A at 19 kDa was not visible. The slight reduction in band intensity is more probably caused by a variation in the entire amount of protein in the sample applied to this lane of the SDS‐gel.
Activity assay of E. coli cells displaying CHMO by monitoring the NADPH consumption
The enzymatic activity of E. coli BL21 cells displaying CHMO was determined by monitoring the NADPH consumption at 340 nm. For this purpose, a 100 µl reaction mixture with 0.3 mM NADPH, 600 µM cyclohexanone in 50 mM sodium phosphate buffer (pH 7) was applied in a well of a microplate. The decrease in absorbance indicating a consumption of NADPH was monitored at 340 nm for 30 min (Fig. 3A). From the linear range of this curve an activity of 29.3 mU ml−1 was determined for the whole‐cell biocatalyst applied at an OD578nm of 5. In the next step, the pH optimum of the CHMO whole‐cell biocatalyst was investigated using two different buffers, a sodium phosphate buffer (50 mM) with pH 7 and pH 8 and a glycine buffer (50 mM) within the range of pH 8 to pH 11. Again, E. coli cells (OD578nm: 5) displaying CHMO were used. The surface displayed CHMO had an activity of 19.7 mU ml−1 in the sodium phosphate buffer at pH 8 (Fig. 3B), in comparison to 36.2 mU ml−1 in glycine buffer with the same pH value. The highest activity of E. coli BL21 cells displaying CHMO was obtained in glycine buffer at pH 10 with 105.7 mU ml−1. At pH 11 in glycine buffer the activity of displayed CHMO decreased to a marginal value of 2.6 mU ml−1. In consequence, the pH optimum for the reaction of the CHMO whole‐cell biocatalyst was determined as pH 10. This pH optimum is higher than the pH optima that have been determined for purified CHMOs, which were reported to be best active between pH 7 and 9 (Trudgill, 1990; Sheng et al., 2001). Alterations in substrate specificities (Jose and von Schwichow, 2004) or turnover number (Schumacher et al., 2012) by the surface display of enzymes have been reported before, as well as that surface displayed enzymes showed an altered pH optimum (Bussamara et al., 2012; Gercke et al., 2021). In addition, as shown by the example of cellulases, the same enzyme exhibited different pH optima when displayed on different host cells (Obeng et al., 2018).
Fig. 3.
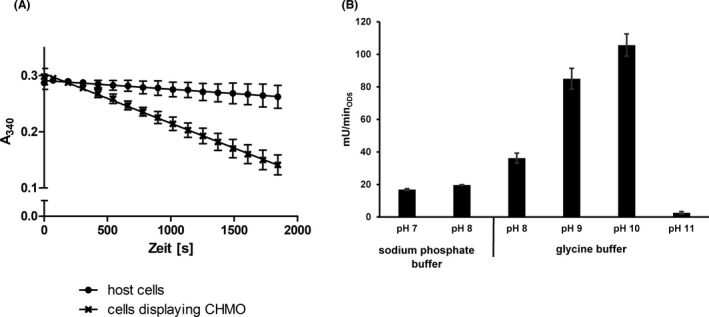
Activity assay of E. coli cells displaying CHMO monitoring the consumption of NADPH with an OD578nm of 5.
A. Absorbance of NADPH measured at 340 nm with E. coli host cells (●) or with E. coli cells displaying CHMO (×) in 50 mM sodium phosphate buffer with pH 7. For each data point given in the curve for “cells displaying CHMO”, the absorption value at 340 nm for cells displaying CHMO + substrate – NADPH was subtracted from the absorption value at 340 nm of cells displaying CHMO + substrate + NADPH. The same was done for the data points of the curve for “host cells”.
B. Two different buffers, 50 mM sodium phosphate buffer with pH 7 and 8 as well as 50 mM glycine buffer with pH 8–11, were applied for the activity assay of displayed CHMO. The E. coli cells displaying CHMO showed the highest activity in the glycine buffer with a pH of 10. Means ± SD of three biological triplicates are given.
Surface display of ADH
For the surface display of alcohol dehydrogenase (ADH) from Lactobacillus kefir (Kohl et al., 2018), the plasmid pADH‐EhaA was constructed using the backbone from the plasmid pCHMO‐EhaA described above. This plasmid encoded an artificial autotransporter fusion protein comprising the CtxB signal peptide, ADH as the passenger, a GS‐linker as described above and the EhaA autotransporter translocation domain, correspondent to the construct shown in Fig. 2A for CHMO. However, cells of E. coli BL21 harbouring this plasmid did not show any activity with cyclohexanol as substrate when monitoring the formation of NADPH from NADP+ by measuring the increase in absorbance at 340 nm (data not shown). ADH is a member of the family of short chain dehydrogenases, which form dimers or tetramers to be catalytically active. Crystal structure analysis revealed that the C‐termini of the monomers within the ADH tetramer need to be in close vicinity (Noey et al., 2015). This could be impaired by the C‐terminal fusion of ADH with the EhaA autotransporter translocation unit, hindering the C‐termini to move in the right conformation. Dimerization (Jose et al., 2002; Jose and von Schwichow, 2004), tetramerization (Gratz et al., 2015) or even higher multimerization (Detzel et al., 2011) is not a problem as such in the autodisplay of enzymes as shown before. Most probably it is facilitated by the mobility of the anchoring β‐barrel within the outer membrane (Jose and Meyer, 2007). But in case the C‐termini of the enzyme subunits require more degrees of freedom than the linkage to the anchoring domain allows, this could result in an inactive conformational state. To overcome this limitation, an inverse autotransporter was chosen to immobilize ADH by its N‐terminus on the cell surface and hence allow greater flexibility of the C‐termini. Most recently the YeeJ autotransporter has been reported to belong to the subfamily of inverse autotransporters (Martinez‐Gil et al., 2017), which are categorized as secretion type Ve (Meuskens et al., 2019). The major difference between classical and inverse autotransporters is that in the latter the passenger domain is fused by its N‐terminus to the β‐barrel containing translocation domain, which itself is located at the N‐terminus of the fusion protein (Fig. 4A). The use of the YeeJ autotransporter translocation domain for the surface display of enzymes has been reported just recently (Gercke et al., 2021). In consequence, a plasmid was constructed (pYeeJ‐ADH) encoding a YeeJ‐ADH autotransporter fusion protein. Again, the l‐rhamnose‐dependent rhaBAD promoter was used for regulation of fusion protein expression. The YeeJ‐ADH autotransporter fusion protein comprises the YeeJ signal peptide, the YeeJ translocation domain, followed by a GS‐Linker as described above, and ADH from Lactobacillus kefir (Fig. 4A). The expression of the YeeJ‐ADH autotransporter fusion protein in E. coli BL21 cells was analysed after induction with 1 mM l‐rhamnose. Subsequently outer membrane proteins were isolated and subjected to SDS‐PAGE. As can be seen in Fig. 4B (lane 3), a single protein band at around 85 kDa was visible after induction of protein expression. This was in good accordance with the calculated size of YeeJ‐ADH autotransporter fusion protein without signal peptide (82.8 kDa). Furthermore, a band of this size was not visible either in the outer membrane proteins of host cells without plasmid (Fig. 4B, lane 1) or in the outer membrane proteins of cells with plasmid but without induction of protein expression by l‐rhamnose (Fig. 4B, lane 2). Therefore, the protein band at around 85 kDa was assigned to the YeeJ‐ADH autotransporter fusion protein. As described in more detail above, proteinase K is a too large molecule to pass the outer membrane. Hence the digestion of a protein, when proteinase K is added to intact cells, indicates its surface exposure. As can be seen in Fig. 4B (lane 4), addition of proteinase K to cells expressing the YeeJ‐ADH autotransporter fusion protein led to a complete disappearance of the protein band at around 85 kDa, indicating the surface display of ADH by the inverse autotransporter.
Fig. 4.
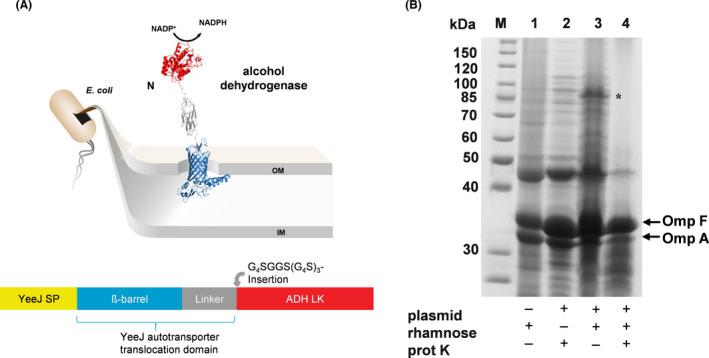
Schematic illustration of the YeeJ‐ADH autotransporter fusion protein (A) and SDS‐PAGE of the outer membrane protein preparations (B). A schematically shows the recombinant autotransporter fusion protein for surface display of the enzyme ADH. The protein structures were predicted with the web server RaptorX. B: Expression of YeeJ‐ADH autotransporter fusion protein and proof of surface display of ADH via SDS‐PAGE of outer membrane protein preparations and protease accessibility test. M: Protein marker. Lane 1: Sample from E. coli cells without pYeeJ‐ADH; Lane 2: Sample from E. coli cells with pYeeJ‐ADH but without l‐rhamnose during cultivation; Lane 3: Sample from E. coli cells with pYeeJ‐ADH and l‐rhamnose during cultivation; Lane 4: Sample from E. coli cells with pYeeJ‐ADH after treatment with proteinase K. Omp F and Omp A are natural outer membrane proteins of E. coli cells. The protein band of the ADH‐YeeJ autotransporter fusion protein is marked with an asterisk.
Enzyme activity of ADH displaying E. coli BL21 cells
For an ADH activity assay a cell suspension with a final OD578nm of 5 was incubated with 4 mM NADP+ and 2 mM cyclohexanol as substrate in a final volume of 100 µl in the well of a 96‐well microplate for 30 min. The absorbance at 340 nm was monitored in a microplate reader. By this set up, an enzymatic activity of 4.8 mU ml−1 at an OD578nm of 5 was determined (Fig. 5A). For evaluating the pH optimum of the reaction, a triethanolamine (TEA) buffer (50 mM) within a pH range of 7 to 8 and the previously mentioned glycine buffer within a pH range of 8 to 10 were used and the ADH activity of YeeJ‐ADH expressing cells was analysed. In the TEA buffer an activity of 4.7 mU ml−1 at pH 7 and an activity of 6.0 mU ml−1 at pH 8 was measured (Fig. 5B). At the same pH of 8 in glycine buffer the enzymatic activity appeared to be reduced to 1.5 mU ml−1. The highest activity of surface displayed ADH was obtained at a pH of 9 in glycine buffer with 10.8 mU ml−1. The enzymatic activity at higher pH values such as 9.5 and 10 was dramatically reduced, indicating a pH optimum of 9 for the ADH reaction. Again, as observed for CHMO, the pH optimum of the surface displayed ADH is higher than that for the purified enzyme, reported to be pH 7 (Weckbecker and Hummel, 2006). Thus, the surface displayed CHMO and ADH both showed a higher pH optimum than the corresponding free enzymes. Since the activity of E. coli BL21 cells displaying CHMO differed not much between pH 9 and 10 (Fig. 3B) and E. coli BL21 cells displaying ADH showed the highest activity at pH 9 with a strong decrease in activity at higher pH values (Fig. 5B), the following experiments with both enzymes were performed in glycine buffer at a pH of 9.
Fig. 5.
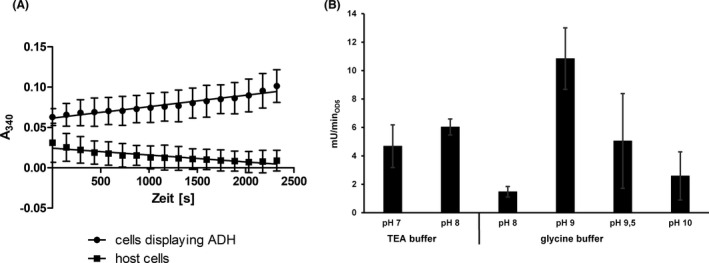
Activity assay of E. coli cells displaying ADH monitoring the formation of NADPH at 340 nm with an OD578nm of 5. A: NADPH absorption curve at 340 nm with E. coli host cells (●) or with E. coli cells displaying ADH (×) in a final OD578nm of 5. For an ADH activity assay a cell suspension was incubated with 4 mM NADP+ and 2 mM cyclohexanol as substrate in a final volume of 100 µl in the well of a 96‐well microplate for 30 min. For each data point given in the curve for “cells displaying ADH”, the absorption value at 340 nm for cells displaying ADH + substrate – NADP+ was subtracted from the absorption value at 340 nm of cells displaying CHMO + substrate + NADP+. The same was done for the data points of the curve for “host cells”. B: Activity assay of surface displayed ADH with 50 mM TEA buffer and 50 mM glycine buffer with a pH range between 7 and 10 with 4 mM NADP+ and 2 mM cyclohexanol as substrate in a final volume of 100 µl in the well of a 96‐well microplate for 30 min. E. coli cells presenting ADH shows the highest activity in the glycine buffer at pH 9. Means ± SD of three biological triplicates are given.
Kinetic parameters of E. coli cells displaying ADH and E. coli cells displaying CHMO
The kinetic parameters V MAX and K M of were determined for both, E. coli cells displaying ADH and E. coli cells displaying CHMO in separate experiments. These parameters are essential to know before both surface displayed enzymes can be used in a combined set up to produce ε‐caprolactone most efficiently. V MAX and K M values of E. coli cells displaying ADH were determined with cyclohexanol as substrate in glycine buffer (50 mM, pH 9). In a 100 µl reaction mixture cells (OD578nm = 5) with 4 mM NADP+ as cofactor were applied. Substrate concentration was varied between 5 mM and 70 mM and the NADPH formation was monitored as increase in absorbance at 340 nm for 30 min at 30°C for each concentration. By this strategy, an apparent V MAX(app) of 59.9 mU ml−1 and a K M value of 17.6 mM were determined for E. coli BL21 cells displaying ADH (Fig. 6A). In consequence, in the following experiments a concentration of 50 mM cyclohexanol, about three times K M, was applied. Subsequently, V MAX and K M of the co‐substrate NADP+ was determined with cyclohexanol as substrate. For this purpose, concentrations ranging from 0.1 mM bis 5 mM NADP+ were applied and a V MAX(app) of 48.5 mU ml−1 and a K M value of 216.5 µM were determined (Fig. 6B). Because in both cases, the co‐substrate concentration for determining K M and V MAX of the substrate, as well as the substrate concentration for determining K M and V MAX of the co‐substrate, was in the range of 3 to 4 times KM, respectively; the conversion rates, and hence V MAX, appear to be underestimated. In consequence we referred to V MAX(app) instead of V MAX.
Fig. 6.
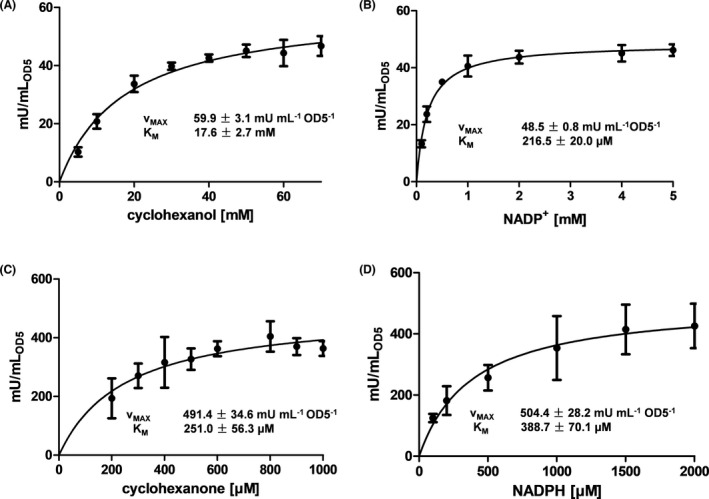
Determination of K M and V MAX(app) with ADH whole‐cell biocatalysts and with CHMO whole‐cell biocatalysts. A and B: Activity assay of E. coli cells displaying ADH with cyclohexanol and NADP+ by monitoring the formation of NADPH at 340 nm with an OD578nm of 5 for 30 min. A: Cyclohexanol in the concentration range of 5 mM to 70 mM with 4 mM NADP+ was used. The conversion rates were then plotted against the concentration. B: NADP+ in concentrations from 0.1 mM to 5 mM with 50 mM cyclohexanol was applied in the activity assay for cells displaying ADH. C and D: Activity assay of E. coli cells displaying CHMO with cyclohexanone and NADPH monitored by the consumption of NADPH at 340 nm with an OD578nm of 5. C: Cyclohexanone in concentrations from 0.2 mM to 1 mM with 1 mM NADPH was used. D: NADPH concentrations varied from 0.2 mM to 2 mM with 1 mM cyclohexanone was applied in the activity assay. The conversion rates were then plotted against the concentrations. Nonlinear regression for Michaelis‐Menten kinetics was used to calculate K M and V MAX. Means ± SD of three biological triplicates are given.
The amount of surface displayed ADH molecules can be calculated by the aid of the Omp A band in the same lane of the SDS‐gel with the software ImageJ. The number of Omp A molecules is known to be a constant of 100 000 per cell (Koebnik et al., 2000). The ratio of the molecular weights of Omp A (34.5 kDa) and the ADH autotransporter fusion protein (82.8 kDa) multiplicated with the corresponding ratio of the density of the two proteins in the same lane of the SDS‐gel and 100 000 gives the overall number of ADH molecules. By applying these numbers as obtained, 20 607 ADH molecules were determined to be on the surface of a single E. coli cell. An OD578 = 1 corresponds to 8.6 × 10⁷ cells per ml (Gratz et al., 2015). With a V MAX(app) of 59.9 mU ml−1 (Fig. 6A) a turnover number of 13.6 s−1 was calculated for the surface displayed ADH. This is in a similar range as the turnover number reported before for purified ADH (22.0 s−1) (Srinivasamurthy et al., 2020).
For investigating V MAX and K M of E. coli BL21 cells displaying CHMO, a bacteria suspension with an OD578nm of 5 was applied in a 100 µl reaction mixture with 1 mM NADPH and increasing concentrations of cyclohexanone from 0.2 mM to 1 mM. The consumption of NADPH was monitored as reduction in absorbance at 340 nm for 30 min at 30°C for all concentrations. By this strategy, a V MAX(app) of 491.4 mU ml−1 and a K M value of 251 µM were determined (Fig. 6C). For the determination of V MAX(app) and K M for the co‐substrate NADPH a cyclohexanone concentration of 1 mM was applied. The NADPH concentration was varied between 0.1 mM and 2 mM and a V MAX(app) value of 504.4 mU ml−1 and a K M value of 388 µM was determined (Fig. 6D). Again, as in the case of ADH, the co‐substrate concentration for determining K M and V MAX of the substrate, as well as the substrate concentration for determining K M and V MAX of the co‐substrate, was in the range of 3 to 4 times K M, respectively, and in consequence the conversion rates, and hence V MAX, appear to be underestimated. Therefore, we referred to V MAX(app) instead of V MAX.
By applying the same calculation as described above for ADH, 48 461 CHMO molecules were determined to be on the surface of a single E. coli cell. With a V MAX(app) of 504.4 mU ml−1 (Fig. 6C) a turnover number of 48.6 s−1 was determined for surface displayed CHMO. This value is in the same order of magnitude as determined for the purified CHMO, reported to be 39.5 s−1 before (Srinivasamurthy et al., 2020). The K M value as determined for the surface displayed CHMO was about 20 times higher than the K M value reported for purified CHMO (0.003–0.021 mM) (van Beek et al., 2014; Schmidt et al., 2015b, 2015c). This could have been an effect of the surface display, which a priori leads to a restricted flexibility of the enzyme at its C‐terminus. As mentioned above, alterations in turnover number and pH optima have been described for surface displayed enzymes before. An increase in K M value was observed for surface displayed cytochrome P450 reductase (Quehl et al., 2017). Such effects, however, are hardly predictable, as they are strongly depending on the structure and the function of the enzyme displayed, but can be affected by the properties of the surface as well (Liese and Hilterhaus, 2013; Quehl, 2016). In addition, E. coli BL21 cells displaying CHMO exhibited a ten times higher V MAX(app) than E. coli BL21 cells displaying ADH when applied at the same OD578nm.
For the purified enzymes, it has been reported before that the substrate for ADH, cyclohexanol, and the product of the enzymatic cascade reaction, ε‐caprolactone, have an inhibitory effect on the activity of CHMO (Staudt et al., 2013). In the presence of 10 mM cyclohexanol, the activity of CHMO was reduced by 70% (Mallin et al., 2013). To find out whether such inhibition also appears with surface displayed CHMO, the enzyme activity was determined in the presence of increasing concentrations of cyclohexanol and ε‐caprolactone. Up to a concentration of 20 mM ε‐caprolactone no loss in the activity of CHMO displaying E. coli cells was detectable (Fig. S2). In contrast, the CHMO reaction was dramatically impaired by cyclohexanol. With a concentration of 10 mM cyclohexanol the activity of CHMO was reduced to 68% of the initial value. With 50 mM cyclohexanol less than 12% of the initial activity remained (Fig. S3). This needs to be taken into consideration, when both cell types with the different enzymes are supposed to be combined in a cascade reaction setup.
Combination of E. coli cells displaying CHMO with E. coli cells displaying ADH for a cascade reaction
Both cell types, those displaying ADH and those displaying CHMO, were combined to set up a cascade reaction from cyclohexanol as substrate to ε‐caprolactone as final product. For a better insight into the reactions step by step, gas chromatography (GC) was applied to analyse the substrate cyclohexanol, the intermediate cyclohexanone and the product ε‐caprolactone simultaneously. In a first step, this analysis was used to determine the optimal ratio between the two surface displayed enzymes. In similar cascade reactions, with the same substrate but with different enzymes from other species, the ratio of ADH and CHMO was reported to be between 1:3 for purified enzymes (Mallin et al., 2013) and 1:10 for immobilized enzymes, as well as for whole‐cell biocatalysts (Mallin et al., 2013; Schmidt et al., 2015c). Here, the determined V MAX(app) value of E. coli cells displaying CHMO was about 10 times higher than V MAX(app) of cells displaying ADH. Therefore, a ratio of ADH and CHMO between 10:1 to 1:10 in a total OD578nm of 10 was investigated with regard to the yield of ε‐caprolactone at 30°C for 1 h. By this strategy, the optimal ratio of E. coli cells displaying ADH and E. coli cells displaying CHMO turned out to be 1:5 (Fig. S4). This is in agreement with the previously reported values. With this ratio, no intermediate cyclohexanone was detectable and the highest amount of ε‐caprolactone (0.97 mM) was measured after 1 h reaction at 30°C.
By separating the surface display of ADH and CHMO on two different E. coli cells, the ratio between the two enzymes is easy to adjust. Another possibility to work with two surface displayed enzymes is to co‐express them on the surface of one E. coli cell using different plasmids. Displaying two different enzymes on a single cell was established with human cytochrome P450 enzyme CYP1A2 and the cytochrome P450 reductase (Quehl et al., 2016). Another possibility to balance the expression level of the two enzymes in a single cell could be to modify the ribosomal binding site. This was shown before for intracellular expression of ADH and CHMO using one plasmid (Kohl et al., 2018). However, the co‐display of ADH and CHMO on the surface of a single cell could impair the tetramerization of ADH on the cell surface due to the hindering by displayed CHMO.
For the combination of E. coli cells displaying ADH and E. coli cells displaying CHMO, 50 mM glycine buffer of pH 9 with an initial substrate concentration of 50 mM cyclohexanol and 2 mM NADP+ was applied. Although there was a high reduction of surface displayed CHMO activity with 50 mM cyclohexanol (88%), this substrate concentration was applied in the combined setup, due to the overall higher yield of ε‐caprolactone, as was obtained with lower cyclohexanol concentrations such as 10 mM (Fig. S5). E. coli cells displaying ADH and E. coli cells displaying CHMO with a total OD578nm of 10 were mixed in a final ratio of 1:5 in a 2 ml reaction mixture. The formation of the product ε‐caprolactone was determined after 1, 2 and 4 h. After 4 h 1.1 mM ε‐caprolactone was detectable by GC (Fig. 7A). This is less than the value published for a combination of co‐immobilized polyol dehydrogenase and CHMO after 5.5 h (3.4 mM) (Mallin et al., 2013). We also determined the reaction yield after 24 h, but no increase was observed. Therefore, the reaction time was set to 4 h.
Fig. 7.
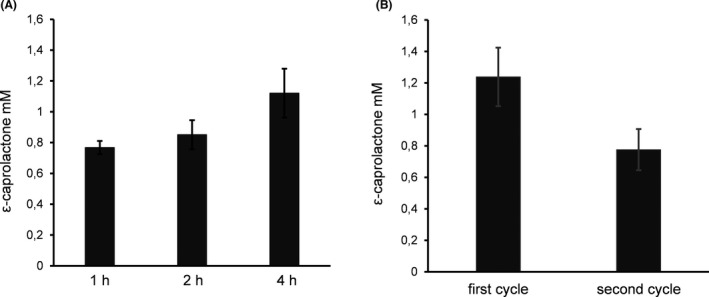
Yield of ε‐caprolactone with ADH and CHMO whole‐cell biocatalysts in combination in dependence of time (A) and reusability (B). E. coli cells displaying ADH and E. coli cells displaying CHMO in a ratio of 1:5 with a total OD578nm of 10 were incubated with 50 mM cyclohexanol and 2 mM NADP+ for 1, 2 and 4 h. 1.5 ml supernatant was taken after centrifugation and extracted twice with 2 ml dichloromethane. The organic solvent was vaporized and the sample resuspended in 100 µl dichloromethane. One µl of the sample was analysed with gas chromatography. Means ± SD of three biological triplicates are given.
It was not possible to quantify the intermediate cyclohexanone due to the very low peak area as obtained by GC. Nevertheless, a matrix calibration as done for ε‐caprolactone was made for cyclohexanol as well. The concentration of cyclohexanol after 4 h of reaction was determined to be 46.0 mM. The sum of cyclohexanol and ε‐caprolactone was determined to be 47.1 mM, and hence, 94.2% of the initially applied substrate was detectable. The loss of material (5.8%) could have been due to spontaneous hydrolysis of ε‐caprolactone to 6‐hydroxyhexanoic acid. Also, a small part of cyclohexanol could have been taken up by the cells. The uptake of cyclohexanol has been reported to be limited (Reimer et al., 2017), and with Pseudomonas taiwanensis, a substrate uptake constant (K S) of 3.57 mM was determined (Schäfer et al., 2020).
One advantage of using whole‐cell biocatalysts with surface displayed enzymes is the simple separation of the biocatalyst from the reaction mixture. Hence, after 4 h conversion at 30°C, E. coli cells were separated by centrifugation, and suspended in fresh buffer containing cofactor and substrate. After a second round of 4 h enzymatic conversion further 0.8 mM product was formed (Fig. 7B), corresponding to 63% of the yield of the first cycle. The reduction in yield of ε‐caprolactone after the second cycle could have been due to an instability of the enzymes displayed. Another reason could have been that not all of the cells could be recovered by centrifugation. For analysis, the OD578nm of the reaction mixture was determined after the first cycle indicating a cell loss of around 15%, which could at least partly explain the reduction in the yield of ε‐caprolactone.
In summary the combination of E. coli cells displaying ADH and E. coli cells displaying CHMO enabled the conversion of cyclohexanol to ε‐caprolactone. The reusability of the whole‐cell biocatalysts was fulfilled at least partly; in the second cycle the yield of the product ε‐caprolactone was still 63% of the yield in first cycle.
NADP+ was added externally to the reaction mix and converted into NADPH by cells displaying ADH. NADPH serving as a cofactor for the CHMO reaction, however, is considered as chemically unstable (Wu et al., 1986). The stability of NADPH is affected by pH and temperature. The half‐life of NADPH under the reaction conditions applied here, with pH 9 and 30°C, has been determined before to be 7 h (Wu et al., 1986). In our study, reaction time was 4 h at 30°C. From this point of view, the instability of NADPH should only have a minor effect on the production of ε‐caprolactone. NADPH is not able to cross membranes, unless it is actively transported by nucleotide transporter proteins (Preusch, 2007). Because there are no nucleotide transporters known in the OM, and NADPH is too large to pass the porins, it is considered not to be taken up and consumed by the bacterial cells applied here. NADPH can, however, be consumed in the well‐known uncoupling reaction of CHMO (Gran‐Scheuch et al., 2021). In controls with CHMO cells and 2 mM NADPH but without substrate, a NADPH degradation rate of 1.84 mU ml−1 was determined. This results in a maximal NADPH degradation of 0.44 µmol ml−1 after 4 h, which is about 20% of the amount of NADPH added. Therefore, it cannot be excluded that the instability of NADPH has an impact on the yield of ε‐caprolactone in the reaction as applied.
Factors that potentially limited the chemical yield were the ratio of the two whole‐cell biocatalysts and the starting concentration of the substrate cyclohexanol. The chemical yield was determined with a ratio of ADH and CHMO whole‐cell biocatalysts ranging from 10:1 to 1:10 and with 10 mM cyclohexanol as substrate. In these experiments an optimal ratio of ADH displaying cells to CHMO displaying cells was determined as 5:1 (Fig. S4). The chemical yield with 50 mM cyclohexanol was roughly twice as produced with 10 mM cyclohexanol (Fig. S5), whereas the activity of ADH at 10 mM was 35% and 75% at 50 mM cyclohexanol of V MAX(app) (Fig. 6A). This is to indicate that the activity of surface displayed ADH could be the limiting factor. Due to the strong inhibitory effect of cyclohexanol on CHMO activity, less than 12% of the CHMO activity remained at a concentration of 50 mM cyclohexanol; a higher concentration of cyclohexanol to increase ADH activity was not reasonable. Therefore, it could be taken into consideration to reduce the number of total cells and increase the ratio of ADH displaying cells to CHMO displaying cells far beyond 10:1 to increase the overall chemical yield.
For a higher yield of the product, a continuous feeding of the substrate cyclohexanol could alternatively be an option to reduce the inhibitory effect of cyclohexanol on CHMO activity. There are different processes reported for avoiding substrate inhibition, which could be adapted for the cascade with surface displayed enzymes here. A complete conversion of 200 mM cyclohexanol with a continuous substrate feeding in a combined system of an ADH and a double mutant of CHMO was achieved after 48 h by Schmidt et al. (2015c). Srinivasamurthy et al. (2020) published an optimized fed‐batch process with a substrate feeding rate of 4.5 mM h−1 to produce ε‐caprolactone in a 200 mM scale using ADH and CHMO whole‐cell biocatalysts. In a fed‐batch process a conversion rate of 98% and a product titre of 20 g l−1 were obtained (Srinivasamurthy et al., 2020). With this optimized process using surface displayed ADH and CHMO, a significantly higher yield can be expected, since the turnover numbers of the enzymes applied appear to be in a similar range. The most prominent advantage in comparison to the chemical synthesis of ε‐caprolactone by the UCC process, which holds true for all enzymatic processes, is that there is no need for peracetic acid or other harmful compounds.
Conclusion
We have demonstrated that a cyclohexanone monooxygenase (CHMO) from Acinetobacter sp. using the EhaA autotransporter translocation domain and an alcohol dehydrogenase (ADH) from Lactobacillus kefir using the YeeJ‐autotransporter translocation domain could be functionally displayed on the surface of E. coli in an active conformation. Starting with cyclohexanol as substrate, a combination of the two whole‐cell biocatalysts led to the synthesis of ε‐caprolactone, which is a precursor molecule for biodegradable polymers. With this combination, a self‐sufficient regeneration of NADPH from NADP+ was accomplished. The generated NADPH from NADP+ by ADH was utilized by CHMO for the oxidation of cyclohexanone. Although there are still limitations to overcome, these results indicate the potential of surface displayed enzymes for cascade reactions.
Experimental procedures
Bacterial strains and cultivation conditions
Escherichia coli DH5α (F−, endA1, hsdS(rK‐ mK+), supE44, thi‐1, λ‐, recA1, gyrA96, relA1, φ80dlacZΔM15) cells were used for cloning. E. coli DH5α and E. coli BL21 (B, F−, ompT, gal, dcm, lon, hsdSB (rB – mB –), [malB +]K‐12(λS)) cells were cultivated in lysogeny broth (LB) medium containing 10 g l−1 tryptone/peptone, 5 g l−1 yeast extract and 10 g l−1 sodium chloride. Fifty mg ml−1 carbenicillin was added to the medium if the cells were carrying plasmid. The overnight pre‐culture was cultivated in LB medium at 37°C for 14 h. Hundred ml LB medium were inoculated with 1 ml of the overnight pre‐culture. The main culture was supplemented with 0.5 g l−1 glucose and 1 mM l‐rhamnose to induce the gene expression of the corresponding autotransporter fusion protein. Until the glucose is consumed, it represses the rhaBAD promoter controlled rhamnose‐dependent expression of the autotransporter fusion protein. In this case the provided glucose is depleted at an OD578nm of approx. 0.5. The main culture was cultivated in a 500 ml flask at 23°C, 200 rpm for 18.5 h. For the expression and activity experiments E. coli BL21 cells were used.
Construction of the plasmids for surface display of CHMO and ADH
For plasmid construction, the restriction‐free In‐Fusion technique was used (Berrow et al., 2007). For the surface display of CHMO, the plasmid pCHMO‐EhaA was constructed. The coding sequence of CHMO from Acinetobacter sp. (Genbank accession no. BAA86293.1) containing four mutations with a N‐terminal his tag (Schmidt et al., 2015a) was placed upstream of the coding sequence for the EhaA autotransporter translocation domain. The DNA sequence for the EhaA autotransporter translocation domain was amplified from the plasmid pPQ52. The fused DNA fragment encoding CHMO and EhaA autotransporter translocation domain had a size of 3225 bp. This fragment was fused to the backbone of pPQ94. The backbone (4049 bp) from pPQ94 contained the coding sequence of ß‐lactamase, pBR322 ori, rhaBAD promoter and the coding sequence of the CtxB signal peptide (Quehl et al., 2017). Finally, the coding sequence (69 bp) of a G4S‐G2S‐G4S‐G4S‐G4S linker (GS‐linker) was inserted between the CHMO coding sequence and the EhaA transporter translocation domain to obtain pCHMO‐EhaA. The final plasmid pCHMO‐EhaA consists of the coding sequence of the N‐terminal CtxB signal peptide, his tagged CHMO, GS‐linker, EhaA autotransporter translocation domain, ß‐lactamase, pBR322 ori and rhaBAD promoter. This plasmid was used to construct another plasmid for the autodisplay of ADH. Instead of the his tagged CHMO coding sequence the ADH sequence from Lactobacillus kefir (Genbank accession no. AY267012.1) without the first three nucleotides, encoding methionine, was inserted between the CtxB signal peptide coding sequence and the GS‐linker coding sequence. The amino acid sequence of ADH was checked by the web tool Signal P, with the result that there is no significance for the presence of a signal peptide. The resulting plasmid was named pADH‐EhaA. Based on pADH‐EhaA a further plasmid pYeeJ‐ADH was constructed. For this plasmid, the coding sequence of the GS‐linker and the EhaA autotransporter translocation domain in pADH‐EhaA were removed. The YeeJ autotransporter translocation domain coding sequence was then placed upstream of the ADH coding sequence. Additionally, the CtxB signal peptide coding sequence was replaced by the YeeJ signal peptide coding sequence. Finally, the coding sequence of the GS‐linker was inserted between the YeeJ autotransporter translocation domain coding sequence and the ADH coding sequence to obtain the plasmid pYeeJ‐ADH. Taken together the plasmid pYeeJ‐ADH encodes the DNA sequence of YeeJ signal peptide, YeeJ autotransporter translocation unit, GS‐linker, ADH, ß‐lactamase, pBR322 ori and rhaBAD promoter. The coding sequence of the YeeJ autotransporter translocation domain and of the YeeJ signal peptide was amplified from genomic DNA of E. coli DH5α. The used amino acid sequences of CHMO and ADH are listed in the Supporting Information.
Outer membrane protein isolation and protease accessibility
The expression of the autotransporter fusion protein was analysed with outer membrane protein isolation. The outer membrane protein isolation was performed according to a published protocol (Park et al., 2015). Therefore, the E. coli BL21 pCHMO‐EhaA cells or E. coli BL21 pYeeJ‐ADH cells were cultivated with 0.5 g l−1 glucose and 1 mM l‐Rhamnose for 18.5 h at 23°C. E. coli cells without plasmid and E. coli cells with plasmid, but without the l‐rhamnose, were used as controls. The surface exposure of the passenger was analysed by protease accessibility. For the protease accessibility test, 40 ml of cultivated E. coli cells displaying CHMO or ADH respectively were centrifuged down (5 min, 3850 g) and resuspended in 1 ml 0.1 mM PBS buffer. 12.5 µl (5 mg ml−1) proteinase K was added to the cell suspension and incubated at 37°C for 1 h. The reaction was stopped by adding 50 mM PMSF. After centrifugation for 5 min (3850 g) the E. coli cells were resuspended in 1.5 ml 0.2 M Tris buffer (pH 8) and processed like the other samples for outer membrane protein isolation. The outer membrane protein samples were resuspended in 2× SDS buffer 100 mM Tris/HCl (pH 6.8), 4% (w/v) SDS, 0.2% (w/v) bromophenol blue, 20% (v/v) glycerol with 30 mg ml−1 DTT, heated at 95°C for 25 min and analysed by SDS‐PAGE using 10% SDS‐gels. Then, the SDS‐gels with separated proteins were stained with Coomassie Brilliant Blue G‐250 and unstained with 10% (v/v) acetic acid to visualize the protein bands.
Activity assay monitoring the NADPH formation and consumption
The E. coli cells displaying CHMO or E. coli cells displaying ADH were harvested through centrifugation (5 min, 3850 g) after cultivation for 18.5 h at 23°C. After that the E. coli cells were resuspended with 10 ml 50 mM glycine buffer or 10 ml 50 mM sodium phosphate buffer and washed three times (centrifugation 5 min, 3850 g, then resuspension with 10 ml). The ADH activity assay was performed with cells in a final OD578nm of 5 with 4 mM NADP+ and 2 mM cyclohexanol as substrate in a final volume of 100 µl in a 96‐well microplate for 30 min. For each data point given in the curve for “cells displaying ADH” (Fig. 5), the absorption value at 340 nm for cells displaying ADH + substrate – NADP+ was subtracted from the absorption value at 340 nm of cells displaying ADH + substrate + NADP+. This was to specify an effect coming from the cells or the plasmid. For each data point given in the curve for “host cells” (Fig. 5), the absorption value at 340 nm for cells (E. coli BL21) + substrate – NADP+ was subtracted from the absorption value at 340 nm of cells + substrate + NADP+. This was to specify an effect of the cells on the absorption at 340 nm. The activity assay for E. coli cells displaying CHMO was performed in a 100 µl reaction mixture with 0.3 mM NADPH and 600 µM cyclohexanone in a 96‐well microplate. For each data point given in the curve for “cells displaying CHMO” (Fig. 3), the absorption value at 340 nm for cells displaying CHMO + substrate – NADPH was subtracted from the absorption value at 340 nm of cells displaying CHMO + substrate + NADPH. Host cells were treated identically as host cells in the experiments with ADH. For the kinetic studies, cyclohexanol from 5 mM up to 70 mM with 4 mM NADP+ as well as NADP+ from 0.1 mM up to 5 mM with 50 mM cyclohexanol was tested for displayed ADH. For E. coli cells displaying CHMO cyclohexanone concentrations from 0.2 µM up to 1 mM with 1 mM NADPH and NADPH concentrations from 0.1 mM up to 2 mM with 1 mM cyclohexanone were applied in the activity assay. NADPH was measured at 340 nm for 30 min using a microplate reader (Infinite M200 Pro Tecan, Männedorf, Switzerland). The change in the NADPH concentration was calculated with the molar extinction coefficient 5.6 mM−1cm−1 and a path length of 0.29 cm.
Combination of E. coli cells displaying ADH and E. coli cells displaying CHMO and detection of ε‐caprolactone with gas chromatography flame‐ionization detector
To combine the E. coli cells displaying ADH with the E. coli cells displaying CHMO, the cells were washed three times (5 min centrifugation at 3850 g, then resuspension with 10 ml buffer) with 50 mM glycine buffer (pH 9) after harvest and adjusted to an OD578nm of 20. A 2 ml reaction mixture was composed of 1 ml cells of OD578nm 20 in a ratio from 10:1 to 1:10 of E. coli cells displaying ADH and E. coli cells displaying CHMO, 1 ml glycine buffer containing 50 mM cyclohexanol, and 2 mM NADP+. The reaction was conducted for 1 h, 2 h and 4 h. After the reaction time, the cells were centrifuged down (8000 g) for 2 min. 1.5 ml supernatant was taken and blended with 2 ml dichloromethane for extraction. After vortexing for 3 min the organic phase was separated from the water phase through centrifugation (5 min, 3850 g). The extraction with dichloromethane was repeated once. Then the organic solvent of the two extraction steps was merged and vaporized. The sample was resuspended in 100 µl dichloromethane. One µl of the sample was injected with split injection on a gas chromatograph (Trace 1300™ Thermofisher Scientific) equipped with an HP‐5 column (30 m × 0.32 mm, Agilent Technologies) and detected with a flame‐ionization detector. A split ratio of 20 with a split flow of 100 ml min−1 was adjusted. A temperature gradient which started at 60°C with a heating ramp of 5°C per min and a holding at 100°C for 2 min (retention times: cyclohexanol 1.9 min; cyclohexanone 2.1 min; ε‐caprolactone 5.9 min) was applied (Fig. S6). A matrix calibration curve with five different concentrations of ε‐caprolactone was recorded to transform the peak areas as obtained into concentrations.
Conflict of interest
The authors declare no conflicts of interest.
Supporting information
Fig. S1. Amino acid sequences of the enzymes investigated.
Fig. S2. Relative activity of E. coli cells displaying the CHMO in the presence of ε‐caprolactone with increasing concentrations by monitoring the consumption of NADPH at 340 nm with an OD578nm of 5. Up to 20 mM no significant loss of activity of the displayed CHMO was detected.
Fig. S3. Relative activity of E. coli cells surface displaying the CHMO in the presence of cyclohexanol with increasing concentrations by monitoring the consumption of NADPH at 340 nm with an OD578nm of 5.
Fig. S4. Peak area of the of ε‐caprolactone in GC with different ratios of E. coli cells displaying the ADH and E. coli cells displaying the CHMO at a total OD578nm of 10. E. coli cells displaying ADH and E. coli cells displaying CHMO in different ratios at a total amount of OD578nm 10 were incubated with 50 mM cyclohexanol and 2 mM NADP+ for 1 h. 1.5 ml supernatant was taken after centrifugation, extracted with 2 ml dichloromethane twice. The organic solvent was vaporized and the sample was resuspended in 100 µL 1 µL of the sample was analyzed with GC.
Fig. S5. Peak area of ε‐caprolactone in GC with the ratio 1:1 of E. coli cells displaying the ADH and E. coli cells displaying the CHMO at a total OD578nm of 10. E. coli cells displaying ADH and E. coli cells displaying CHMO in a ratio at a total amount of OD578nm 10 were incubated with 10 or 50 mM cyclohexanol and 2 mM NADP+ for 1 h. 1.5 ml supernatant was taken after centrifugation, extracted with 2 ml dichloromethane twice. The organic solvent was vaporized and the sample was resuspended in 100 µl 1 µl of the sample was analyzed with GC.
Fig. S6. A gas chromatography chromatogram with the peaks of the three substances cyclohexanol, cyclohexanone and ε‐caprolactone in a concentration of 0.6 mM. Retention times: cyclohexanol 1.9 min; cyclohexanone 2.1 min; ε‐caprolactone 5.9 min.
Acknowledgements
The authors thank Dr. Dominique Böttcher and Dr. Kathleen Balke for their insightful discussions and useful inputs.
Microbial Biotechnology (2022) 15(8), 2235–2249
Funding information
No funding information provided.
References
- Aalbers, F.S. , and Fraaije, M.W. (2017) Coupled reactions by coupled enzymes: alcohol to lactone cascade with alcohol dehydrogenase–cyclohexanone monooxygenase fusions. Appl Microbiol Biotechnol 101: 7557–7565. [DOI] [PMC free article] [PubMed] [Google Scholar]
- Balke, K. , Beier, A. , and Bornscheuer, U.T. (2018) Hot spots for the protein engineering of Baeyer‐Villiger monooxygenases. Biotechnol Adv 36: 247–263. [DOI] [PubMed] [Google Scholar]
- van Beek, H.L. , Wijma, H.J. , Fromont, L. , Janssen, D.B. , and Fraaije, M.W. (2014) Stabilization of cyclohexanone monooxygenase by a computationally designed disulfide bond spanning only one residue. FEBS Open Bio 4: 168–174. [DOI] [PMC free article] [PubMed] [Google Scholar]
- Berrow, N.S. , Alderton, D. , Sainsbury, S. , Nettleship, J. , Assenberg, R. , Rahman, N. , et al. (2007) A versatile ligation‐independent cloning method suitable for high‐throughput expression screening applications. Nucleic Acids Res 35: e45. [DOI] [PMC free article] [PubMed] [Google Scholar]
- Bornscheuer, U. (2003) Immobilizing enzymes: How to create more suitable biocatalysts. Angew Chem Int Ed 42: 3336–3337. [DOI] [PubMed] [Google Scholar]
- Bussamara, R. , Dall'agnol, L. , Schrank, A. , Fernandes, K.F. , and Vainstein, M.H. (2012) Optimal conditions for continuous immobilization of Pseudozyma hubeiensis (Strain HB85A) lipase by adsorption in a packed‐bed reactor by response surface methodology. Enzyme Res 2012: 329178. [DOI] [PMC free article] [PubMed] [Google Scholar]
- Clouthier, C.M. , and Pelletier, J.N. (2012) Expanding the organic toolbox: a guide to integrating biocatalysis in synthesis. Chem Soc Rev 41: 1585–1605. [DOI] [PubMed] [Google Scholar]
- Detzel, C. , Maas, R. , and Jose, J. (2011) Autodisplay of nitrilase from Alcaligenes faecalis in E. coli yields a whole cell biocatalyst for the synthesis of enantiomerically pure (R)‐mandelic acid. ChemCatChem 3: 719–725. [Google Scholar]
- Dyal, A. , Loos, K. , Noto, M. , Chang, S.W. , Spagnoli, C. , Shafi, K.V.P.M. , et al. (2003) Activity of Candida rugosa lipase immobilized on γ‐Fe2O3 magnetic nanoparticles. J Am Chem Soc 125: 1684–1685. [DOI] [PubMed] [Google Scholar]
- Gercke, D. , Furtmann, C. , Tozakidis, I.E.P. , and Jose, J. (2021) Highly crystalline post‐consumer PET waste hydrolysis by surface displayed PETase using a bacterial whole‐cell biocatalyst. ChemCatChem 13: 3479–3489. [Google Scholar]
- Gran‐Scheuch, A. , Parra, L. , and Fraaije, M.W. (2021) Systematic assessment of uncoupling in flavoprotein oxidases and monooxygenases. ACS Sustain Chem Eng. doi: 10.1021/acssuschemeng.1c02012 [DOI] [Google Scholar]
- Gratz, A. , Bollacke, A. , Stephan, S. , Nienberg, C. , Le Borgne, M. , Götz, C. , and Jose, J. (2015) Functional display of heterotetrameric human protein kinase CK2 on Escherichia coli: a novel tool for drug discovery. Microb Cell Fact 14: 74. [DOI] [PMC free article] [PubMed] [Google Scholar]
- Henderson, I.R. , Navarro‐Garcia, F. , and Nataro, J.P. (1998) The great escape: structure and function of the autotransporter proteins. Trends Microbiol 6: 370–378. [DOI] [PubMed] [Google Scholar]
- Ieva, R. , Tian, P. , Peterson, J.H. , and Bernstein, H.D. (2011) Sequential and spatially restricted interactions of assembly factors with an autotransporter β domain. Proc Natl Acad Sci USA 108: E383–E391. [DOI] [PMC free article] [PubMed] [Google Scholar]
- Jong, W.S.P. , Soprova, Z. , de Punder, K. , ten Hagen‐Jongman, C.M. , Wagner, S. , Wickström, D. , et al. (2012) A structurally informed autotransporter platform for efficient heterologous protein secretion and display. Microb Cell Fact 11: 85. [DOI] [PMC free article] [PubMed] [Google Scholar]
- Jose, J. , Bernhardt, R. , and Hannemann, F. (2002) Cellular surface display of dimeric Adx and whole cell P450‐mediated steroid synthesis on E. coli . J Biotechnol 95: 257–268. [DOI] [PubMed] [Google Scholar]
- Jose, J. , and Meyer, T.F. (2007) The autodisplay story, from discovery to biotechnical and biomedical applications. Microbiol Mol Biol Rev 71: 600–619. [DOI] [PMC free article] [PubMed] [Google Scholar]
- Jose, J. , and von Schwichow, S. (2004) Autodisplay of active sorbitol dehydrogenase (SDH) yields a whole cell biocatalyst for the synthesis of rare sugars. ChemBioChem 5: 491–499. [DOI] [PubMed] [Google Scholar]
- Koebnik, R. , Locher, K.P. , and Van Gelder, P. (2000) Structure and function of bacterial outer membrane proteins: barrels in a nutshell. Mol Microbiol 37: 239–253. [DOI] [PubMed] [Google Scholar]
- Kohl, A. , Srinivasamurthy, V. , Böttcher, D. , Kabisch, J. , and Bornscheuer, U.T. (2018) Co‐expression of an alcohol dehydrogenase and a cyclohexanone monooxygenase for cascade reactions facilitates the regeneration of the NADPH cofactor. Enzyme Microb Technol 108: 53–58. [DOI] [PubMed] [Google Scholar]
- Kranen, E. , Steffan, N. , Maas, R. , Li, S.‐M. , and Jose, J. (2011) Development of a whole cell biocatalyst for the efficient prenylation of indole derivatives by Autodisplay of the aromatic prenyltransferase FgaPT2. ChemCatChem 3: 1200–1207. [Google Scholar]
- Liese, A. , and Hilterhaus, L. (2013) Evaluation of immobilized enzymes for industrial applications. Chem Soc Rev 42: 6236–6249. [DOI] [PubMed] [Google Scholar]
- Mallin, H. , Wulf, H. , and Bornscheuer, U.T. (2013) A self‐sufficient Baeyer‐Villiger biocatalysis system for the synthesis of ɛ‐caprolactone from cyclohexanol. Enzyme Microbiol Technol 53: 283–287. [DOI] [PubMed] [Google Scholar]
- Martinez‐Gil, M. , Goh, K.G.K. , Rackaityte, E. , Sakamoto, C. , Audrain, B. , Moriel, D.G. , et al. (2017) YeeJ is an inverse autotransporter from Escherichia coli that binds to peptidoglycan and promotes biofilm formation. Sci Rep 7: 11326. [DOI] [PMC free article] [PubMed] [Google Scholar]
- Maurer, J. , Jose, J. , and Meyer, T.F. (1997) Autodisplay: one‐component system for efficient surface display and release of soluble recombinant proteins from Escherichia coli . J Bacteriol 179: 794–804. [DOI] [PMC free article] [PubMed] [Google Scholar]
- Meuskens, I. , Saragliadis, A. , Leo, J.C. , and Linke, D. (2019) Type V secretion systems: an overview of passenger domain functions. Front Microbiol 10: 1163. [DOI] [PMC free article] [PubMed] [Google Scholar]
- Miyamoto, M. , Yamashita, T. , Yasuhara, Y. , Hayasaki, A. , Hosokawa, Y. , Tsujino, H. , and Uno, T. (2015) Membrane anchor of cytochrome P450 reductase suppresses the uncoupling of cytochrome P450. Chem Pharm Bull (Tokyo) 63: 286–294. [DOI] [PubMed] [Google Scholar]
- Mori, H. , and Ito, K. (2001) The sec protein‐translocation pathway. Trends Microbiol 9: 494–500. [DOI] [PubMed] [Google Scholar]
- Noey, E.L. , Tibrewal, N. , Jiménez‐Osés, G. , Osuna, S. , Park, J. , Bond, C.M. , et al. (2015) Origins of stereoselectivity in evolved ketoreductases. Proc Natl Acad Sci USA 112: E7065–E7072. [DOI] [PMC free article] [PubMed] [Google Scholar]
- Obeng, E.M. , Brossette, T. , Ongkudon, C.M. , Budiman, C. , Maas, R. , and Jose, J. (2018) The workability of Escherichia coli BL21 (DE3) and Pseudomonas putida KT2440 expression platforms with autodisplayed cellulases: a comparison. Appl Microb Biotechnol 102: 4829–4841. [DOI] [PubMed] [Google Scholar]
- Oberhettinger, P. , Leo, J.C. , Linke, D. , Autenrieth, I.B. , and Schütz, M.S. (2015) The inverse autotransporter intimin exports its passenger domain via a hairpin intermediate. J Biol Chem 290: 1837–1849. [DOI] [PMC free article] [PubMed] [Google Scholar]
- Park, M. , Yoo, G. , Bong, J.‐H. , Jose, J. , Kang, M.‐J. , and Pyun, J.‐C. (2015) Isolation and characterization of the outer membrane of Escherichia coli with autodisplayed Z‐domains. Biochim Biophys Acta Biomembr 1848: 842–847. [DOI] [PubMed] [Google Scholar]
- Preusch, P.C. (2007) CHAPTER 14 – Equilibrative and concentrative transport mechanisms. In Principles of Clinical Pharmacology, 2nd edn. Atkinson, A.J. , Abernethy, D.R. , Daniels, C.E. , Dedrick, R.L. , and Markey, S.P. (eds). Burlington: Academic Press, pp. 197–227. [Google Scholar]
- Quehl, P. (2016) Untersuchungen zur Expression und Aktivität der humanen Cytochrom P450 Reduktase an der Zelloberfläche von Escherichia coli. Münster, Germany: Dissertation, Westfälische Wilhelms‐Universität Münster. [Google Scholar]
- Quehl, P. , Hollender, J. , Schüürmann, J. , Brossette, T. , Maas, R. , and Jose, J. (2016) Co‐expression of active human cytochrome P450 1A2 and cytochrome P450 reductase on the cell surface of Escherichia coli . Microb Cell Fact 15: 26. [DOI] [PMC free article] [PubMed] [Google Scholar]
- Quehl, P. , Schüürmann, J. , Hollender, J. , and Jose, J. (2017) Improving the activity of surface displayed cytochrome P450 enzymes by optimizing the outer membrane linker. Biochim Biophys Acta Biomembranes 1859: 104–116. [DOI] [PubMed] [Google Scholar]
- Reimer, A. , Wedde, S. , Staudt, S. , Schmidt, S. , Höffer, D. , Hummel, W. , et al. (2017) Process development through solvent engineering in the biocatalytic synthesis of the heterocyclic bulk chemical ε‐caprolactone. J Heterocycl Chem 54: 391–396. [Google Scholar]
- Schäfer, L. , Bühler, K. , Karande, R. , and Bühler, B. (2020) Rational engineering of a multi‐step biocatalytic cascade for the conversion of cyclohexane to polycaprolactone monomers in Pseudomonas taiwanensis . Biotechnol J 15: 2000091. [DOI] [PubMed] [Google Scholar]
- Schmidt, S. , Büchsenschütz, H.C. , Scherkus, C. , Liese, A. , Gröger, H. , and Bornscheuer, U.T. (2015a) Biocatalytic access to chiral polyesters by an artificial enzyme cascade synthesis. ChemCatChem 7: 3951–3955. [Google Scholar]
- Schmidt, S. , Genz, M. , Balke, K. , and Bornscheuer, U.T. (2015b) The effect of disulfide bond introduction and related Cys/Ser mutations on the stability of a cyclohexanone monooxygenase. J Biotechnol 214: 199–211. [DOI] [PubMed] [Google Scholar]
- Schmidt, S. , Scherkus, C. , Muschiol, J. , Menyes, U. , Winkler, T. , Hummel, W. , et al. (2015c) An enzyme cascade synthesis of ε‐caprolactone and its oligomers. Angew Chem Int Ed 54: 2784–2787. [DOI] [PubMed] [Google Scholar]
- Schumacher, S.D. , Hannemann, F. , Teese, M.G. , Bernhardt, R. , and Jose, J. (2012) Autodisplay of functional CYP106A2 in Escherichia coli . J Biotechnol 161: 104–112. [DOI] [PubMed] [Google Scholar]
- Schüürmann, J. , Quehl, P. , Festel, G. , and Jose, J. (2014) Bacterial whole‐cell biocatalysts by surface display of enzymes: toward industrial application. Appl Microbiol Biotechnol 98: 8031–8046. [DOI] [PubMed] [Google Scholar]
- Schüürmann, J. , Quehl, P. , Lindhorst, F. , Lang, K. , and Jose, J. (2017) Autodisplay of glucose‐6‐phosphate dehydrogenase for redox cofactor regeneration at the cell surface. Biotechnol Bioeng 114: 1658–1669. [DOI] [PubMed] [Google Scholar]
- Sheng, D. , Ballou, D.P. , and Massey, V. (2001) Mechanistic studies of cyclohexanone monooxygenase: chemical properties of intermediates involved in catalysis. Biochemistry 40: 11156–11167. [DOI] [PubMed] [Google Scholar]
- Sichwart, S. , Tozakidis, I.E.P. , Teese, M. , and Jose, J. (2015) Maximized autotransporter‐mediated expression (MATE) for surface display and secretion of recombinant proteins in Escherichia coli . Food Technol Biotechnol 53: 9. [DOI] [PMC free article] [PubMed] [Google Scholar]
- Srinivasamurthy, V.S.T. , Böttcher, D. , Engel, J. , Kara, S. , and Bornscheuer, U.T. (2020) A whole‐cell process for the production of ε‐caprolactone in aqueous media. Process Biochem 88: 22–30. [Google Scholar]
- Staudt, S. , Bornscheuer, U.T. , Menyes, U. , Hummel, W. , and Gröger, H. (2013) Direct biocatalytic one‐pot‐transformation of cyclohexanol with molecular oxygen into ɛ‐caprolactone. Enzyme Microb Technol 53: 288–292. [DOI] [PubMed] [Google Scholar]
- Tozakidis, I.E.P. , Quehl, P. , Schüürmann, J. , and Jose, J. (2015) Let’s do it outside: neue Biokatalysatoren mittels surface display. Biospektrum 21: 668–671. [Google Scholar]
- Trudgill, P.W. (1990) Cyclohexanone 1,2‐monooxygenase from Acinetobacter NCIMB 9871. In Meth in Enzymol. Lidstrom, M.E. (ed.). Cambridge, MA, USA: Academic Press, pp. 70–77. [DOI] [PubMed] [Google Scholar]
- Weckbecker, A. , and Hummel, W. (2006) Cloning, expression, and characterization of an (R)‐specific alcohol dehydrogenase from Lactobacillus kefir . Biocatal Biotransfor 24: 380–389. [Google Scholar]
- Weissermel, K. , and Arpe, H.J. (2003) Industrial Organic Chemistry, 4th edn. Weinheim, Germany: Wiley‐VCH. [Google Scholar]
- Winkler, C.K. , Schrittwieser, J.H. , and Kroutil, W. (2021) Power of biocatalysis for organic synthesis. ACS Cent Sci 7: 55–71. [DOI] [PMC free article] [PubMed] [Google Scholar]
- Wu, J.T. , Wu, L.H. , and Knight, J.A. (1986) Stability of NADPH: effect of various factors on the kinetics of degradation. Clin Chem 32: 314–319. [PubMed] [Google Scholar]
Associated Data
This section collects any data citations, data availability statements, or supplementary materials included in this article.
Supplementary Materials
Fig. S1. Amino acid sequences of the enzymes investigated.
Fig. S2. Relative activity of E. coli cells displaying the CHMO in the presence of ε‐caprolactone with increasing concentrations by monitoring the consumption of NADPH at 340 nm with an OD578nm of 5. Up to 20 mM no significant loss of activity of the displayed CHMO was detected.
Fig. S3. Relative activity of E. coli cells surface displaying the CHMO in the presence of cyclohexanol with increasing concentrations by monitoring the consumption of NADPH at 340 nm with an OD578nm of 5.
Fig. S4. Peak area of the of ε‐caprolactone in GC with different ratios of E. coli cells displaying the ADH and E. coli cells displaying the CHMO at a total OD578nm of 10. E. coli cells displaying ADH and E. coli cells displaying CHMO in different ratios at a total amount of OD578nm 10 were incubated with 50 mM cyclohexanol and 2 mM NADP+ for 1 h. 1.5 ml supernatant was taken after centrifugation, extracted with 2 ml dichloromethane twice. The organic solvent was vaporized and the sample was resuspended in 100 µL 1 µL of the sample was analyzed with GC.
Fig. S5. Peak area of ε‐caprolactone in GC with the ratio 1:1 of E. coli cells displaying the ADH and E. coli cells displaying the CHMO at a total OD578nm of 10. E. coli cells displaying ADH and E. coli cells displaying CHMO in a ratio at a total amount of OD578nm 10 were incubated with 10 or 50 mM cyclohexanol and 2 mM NADP+ for 1 h. 1.5 ml supernatant was taken after centrifugation, extracted with 2 ml dichloromethane twice. The organic solvent was vaporized and the sample was resuspended in 100 µl 1 µl of the sample was analyzed with GC.
Fig. S6. A gas chromatography chromatogram with the peaks of the three substances cyclohexanol, cyclohexanone and ε‐caprolactone in a concentration of 0.6 mM. Retention times: cyclohexanol 1.9 min; cyclohexanone 2.1 min; ε‐caprolactone 5.9 min.