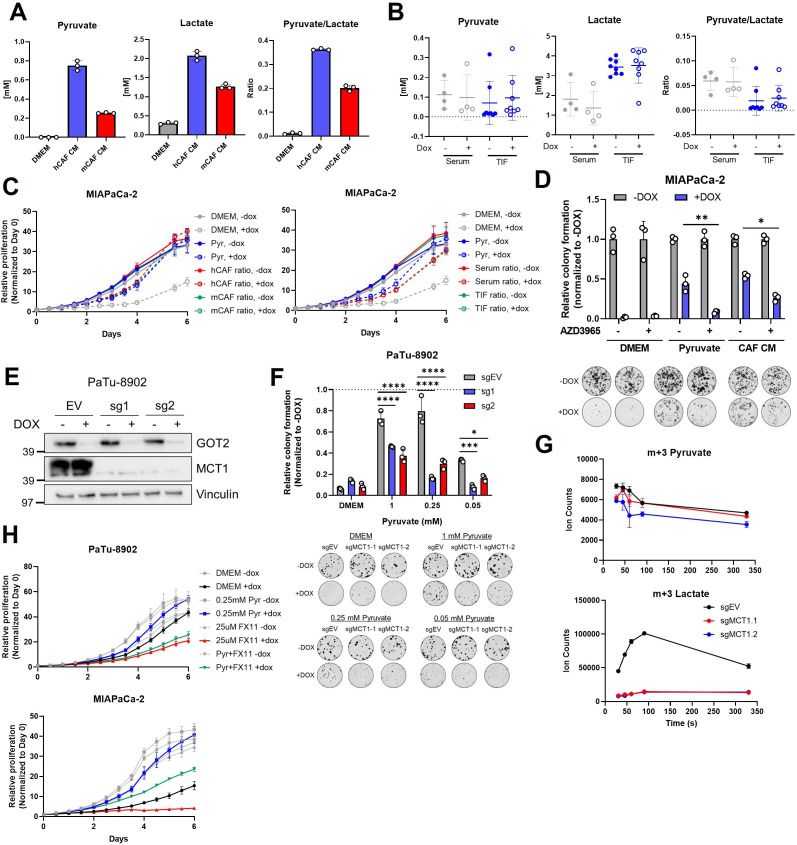
Figure 6. MCT1 inhibition prevents pyruvate-mediated restoration of redox balance in vitro after loss of glutamate-oxaloacetate transaminase 2 (GOT2).
(A) Absolute quantitation of pyruvate (left) and lactate (middle), and the relative pyruvate/lactate ratio (right) in normal Dulbecco’s modified Eagle medium (DMEM), human cancer-associated fibroblasts (hCAF) conditioned media (CM), and mouse CAF (mCAF) CM. (B) Absolute quantitation of pyruvate (left) and lactate (middle), and the relative pyruvate/lactate ratio (right) in serum or the tumor interstitial fluid (TIF) from NOD scid gamma (NSG) mice harboring PaTu-8902 ishGOT2.1 −Dox (n=8 tumors, 4 mice) or +Dox (n=8 tumors, 4 mice) flank xenografts. (C) Relative proliferation of MIAPaCa-2 ishGOT2.1 −Dox (n=3) or +Dox (n=3) cultured with the absolute levels and relative ratios of pyruvate/lactate in hCAF and mCAF CM (left) or serum/TIF (right) from (A) and (B), normalized to Day 0 for each condition. (D) Relative colony formation of MIAPaCa-2 ishGOT2.1 −Dox (n=3) or +Dox (n=3) cultured in normal media (DMEM), 1 mM pyruvate, or hCAF CM, and treated with DMSO control or 100 nM AZD3965, normalized to −Dox for each condition. (E) Immunoblots of GOT2, MCT1, and VINCULIN loading control in PaTu-8902 ishGOT2.1 expressing empty vector (EV), or two sgRNAs targeting MCT1 (sg1, sg2). (F) Relative colony formation of PaTu-8902 ishGOT2.1 −Dox (n=3) or +Dox (n=3) expressing EV, or two sgRNAs targeting MCT1 (sg1, sg2) and cultured in the indicated doses of pyruvate, normalized to −Dox for each condition. (G) Ion counts of intracellular m+3 pyruvate (top) and lactate (bottom) in PaTu-8902 expressing EV, or two sgRNAs targeting MCT1 (sg1, sg2) and cultured in 1 mM 13C3-pyruvate for the indicated time points. (H) Relative proliferation of PaTu-8902 (top) and MIAPaCa-2 (bottom) ishGOT2.1 −Dox (n=3) or +Dox (n=3) cultured in normal DMEM or 0.25 mM pyruvate and treated with DMSO vehicle control or 25 µM FX11, normalized to Day 0 for each condition. For all panels, data represent mean ± SD. *p<0.05, **p<0.01, ***p<0.001, and ****p<0.0001.


