Abstract
This study was designed to investigate the effect of Gelidium amansii (GA) on carbohydrate and lipid metabolism in rats with high fructose (HF) diet (57.1% w/w). Five-week-old male Sprague-Dawley rats were fed a HF diet to induce glucose intolerance and hyperlipidemia. The experiment was divided into three groups: (1) control diet group (Con); (2) HF diet group (HF); and (3) HF with GA diet group (HF + 5% GA). The rats were fed the experimental diets and drinking water ad libitum for 23 weeks. The results showed that GA significantly decreased retroperitoneal fat mass weight of HF diet-fed rats. Supplementation of GA caused a decrease in plasma glucose, insulin, tumor necrosis factor-α, and leptin. HF diet increased hepatic lipid content. However, intake of GA reduced the accumulation of hepatic lipids including total cholesterol (TC) and triglyceride contents. GA elevated the excretion of fecal lipids and bile acid in HF diet-fed rats. Furthermore, GA significantly decreased plasma TC, triglyceride, low density lipoprotein plus very low density lipoprotein cholesterol, and TC/high density lipoprotein cholesterol ratio in HF diet-fed rats. HF diet induced an in plasma glucose and an impaired glucose tolerance, but GA supplementation decreased homeostasis model assessment equation-insulin resistance and improved impairment of glucose tolerance. Taken together, these results indicate that supplementation of GA can improve the impairment of glucose and lipid metabolism in an HF diet-fed rat model.
Keywords: fructose, Gelidium, insulin resistance, liver lipids, plasma lipids, rats
1. Introduction
Metabolic syndrome has been a worldwide healthcare issue and is well known to increase the risk of chronic diseases, such as diabetes and cardiovascular disorders [1–3]. Recently, fructose as a sweetener has been comprehensively used in candy, chocolate, and beverages, which leads to fructose consumption increase very quickly [4]. However, a high fructose (HF) diet can produce hypertriglyceridemia, oxidative stress, obesity, and insulin resistance due to high hepatic lipogenesis and low insulin receptor messenger RNA expression of skeletal muscle and liver [5,6]. Therefore, HF intake is increasingly recognized as causative in development of prediabetes and metabolic syndrome [7].
Gelidium amansii (GA), widely distributed in northeastern Taiwan, is an edible red algae. Its agar product (1,3-linked β-D-galactopyranose and 1,4-linked 3,6-anhydro-α-L-galactopyranose units) [8] is prepared by boiling, filtering, cooling, and then forming a gel [9]. GA has been reported to have a hypoglycemic effect in diabetic rats [10] and diabetic patients [11]. However, the exact mechanisms of this effect are not well understood. In addition, there is little information about the effect of GA on metabolic syndrome.
Rats with a HF diet-induced similar metabolic syndrome can display hyperlipidemia and glucose intolerance [6,12]. This animal model has been used in our previous studies for evaluating functional foods on reducing diabetes and obesity [12]. Moreover, our previous studies have shown the beneficial effects of GA on lipid-lowering and glucose-lowering effects [13]. Therefore, it is possible that the hypolipidemic and hypoglycemic effects of GA may come to be recognized as a promising therapeutic strategy for metabolic syndrome and prediabetes. In the present study, we aimed to investigate the effects and possible mechanisms of long-term feeding of GA on lipid responses and lipid-related metabolic changes in rats with HF diet-impaired glucose tolerance.
2. Methods
2.1. GA
GA (Lamouroux; dry) was purchased in Keelung, the northeast corner of Taiwan. GA was minced with a grinder and then stored at 4°C until used. General compositions, including moisture (7.1%), ash (4.7%), crude fat (0.7%), crude protein (17%), water soluble dietary fiber (45.9%), and water insoluble dietary fiber (15.4%), of GA were determined by the methods of the Association Of Analytical Communities (AOAC) [14,15]. Fructose powder was purchased from Archer Daniels Midland Co. (Chicago, IL, USA) and cellulose was purchased from Sigma Chemical Co. (St. Louis, MO, USA).
2.2. Animals and diets
Male 7-week-old Sprague-Dawley rats were purchased from BioLASCO Taiwan Co., Ltd. (Taipei, Taiwan). Rats were fed a chow diet (Rodent Laboratory Chow, Ralston Purina, St. Louis, MO, USA) for 1 week, and then the animals were randomly divided into three groups: (1) Con group that received control diet; (2) HF group that received a HF (63.1%) diet; and (3) HF + GA group that received HF diet with 5% GA. Each group contained eight rats. The compositions of the experimental diets given to test animals are shown in Table 1. Rats were housed in individual stainless steel cages in a room kept at 23 ± 1°C and 60 ± 5% relative humidity with a 12 hour light and dark cycle (lighting from 8:00 am to 8:00 pm). Food and drinking water were available ad libitum and measured daily. The body weight was measured every week. The oral glucose tolerance test (OGTT) experiments were performed after 22 weeks of feeding study. To the OGTT experiment, rats in each group orally received the glucose solution (2 g/kg of body weight) in the fasted state. Blood samples were obtained at 0 minutes (before diet loading), 30 minutes, 60 minutes, 120 minutes, and 180 minutes from the tail vein using a heparinized capillary tube. Plasma was isolated immediately by centrifugation at 1570 g for 20 minutes at 4°C and stored at −80°C until assay. After 23 week of feeding study, the animals were sacrificed. This study was approved by the Animal House Management Committee of the National Taiwan Ocean University, Keelung, Taiwan. The animals were maintained in accordance with the guidelines for the care and use of laboratory animals as issued by the Animal Center of the National Science Council.
Table 1.
Composition of experimental diets (%).
| Ingredient (%) | CS* | HF | HF + GA |
|---|---|---|---|
| Corn starch | 57.1 | ||
| Fructose | 57.1 | 57.1 | |
| Casein | 20 | 20 | 20 |
| Lard | 10 | 10 | 10 |
| Soybean oil | 2 | 2 | 2 |
| Vitamin mixturea | 1 | 1 | 1 |
| Mineral mixtureb | 4 | 4 | 4 |
| Cholesterol | 0.5 | 0.5 | 0.5 |
| Cholic acid | 0.2 | 0.2 | 0.2 |
| Choline chloride | 0.2 | 0.2 | 0.2 |
| Cellulose | 5 | 5 | — |
| Gelidium | — | 5 |
CS = normal control; HF = high fructose; HF + GA = high fructose + Gelidium.
AIN-93 vitamin mixture.
AIN-93 mineral mixture.
2.3. Collection of blood and tissue samples
At the end of the experimental period, animals fasted for 12 hours prior to being sacrificed (at 10:00 am) by exsanguinations via the abdominal aorta while under diethyl ether anesthesia. Heparin was used as the anticoagulant. Plasma was separated from the blood by centrifugation (1750 g) at 4°C for 20 minutes. The liver and soleus muscle from each animal were excised and weighed.
2.4. Determination of plasma glucose, insulin, adiponectin, leptin, interleukin 6, and tumor necrosis factor-α
Plasma glucose was determined with a kit purchased from Audit Diagnostics Co. (Cork, Ireland). Plasma insulin was determined using a rat insulin enzyme-linked immunosorbent assay (ELISA) kit (Mercodia AB, Uppsala, Sweden). Plasma adiponectin, leptin, IL-6, and tumor necrosis factor-α (TNF-α) levels were determined using the rat ELISA kits (Assay Designs, Inc., Ann Arbor, MI, USA).
2.5. Determination of plasma lipid concentrations and aspartate aminotransferase and alanine aminotransferase activities
Plasma total cholesterol (TC) and triglyceride (TG) levels were determined by an enzymatic method provided by the kits purchased from Audit Diagnostics. The TG-richlipoproteins from a separate aliquot of plasma were isolated by density gradient ultracentrifugation (SP 85G, RPL 42T Rotor; Hitachi, Tokyo, Japan) by 194,000 g at 10°C for 3 hours, and the lipoproteins were recovered by tube slicing [16]. Aspartate aminotransferase and alanine aminotransferase activities were determined with a kit purchased from Randox Ltd. (Antrim, UK).
2.6. Determination of hepatic lipid synthase enzymes
The hepatic lipid synthase enzymes such as fatty acid synthase, acetyl CoA carboxylase activities, and glucose-6-phosphate dehydrogenase were assayed according to the methods by Goodridge [17], Nepokroeff et al [18], and Nakayama et al [19], respectively. The enzyme activities were determined by the rate of nmole of NADPH increased.
2.7. Determinations of liver lipids and fecal lipid concentrations
Liver, adipose tissue, and fecal lipids were extracted with chloroform/methanol solution (v/v, 2:1) according to the method of Folch et al [20]. TG and cholesterol were determined by the method of Carlson and Goldfarb [21].
2.8. Determination of lipid peroxidation
Lipid peroxidation, as measured by thiobarbituric acid reactive substances (TBARS), in plasma and tissues was assessed by the methods of Yagi [22] and Uchiyama and Mihara [23], respectively.
2.9. Statistical analysis
Results are given as the mean ± standard deviation. Statistical differences among groups were calculated by analysis of variance (SAS Institute, Cary, NC, USA), and group means were considered to be significantly different at p < 0.05 as determined by Duncan’s multiple range test.
3. Results
3.1. Effects of GA on body weight, tissue weight in HF diet-fed rats
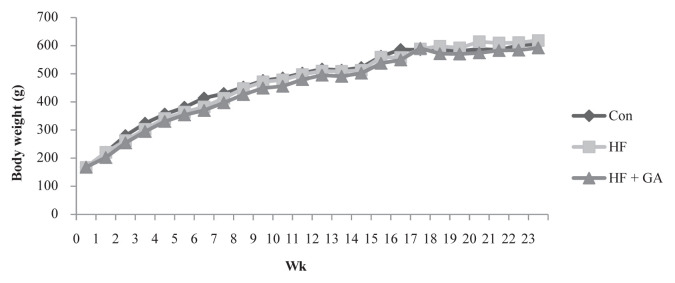
There was no significant difference in body weight among the three groups (Figure 1). However, rats fed an HF diet for 21 weeks had increased liver weight and adipose weight (Table 2; p < 0.05).
Figure 1.
The changes of body weight in normal and high fructose rats fed different experimental diets for 23 weeks. Results are expressed as mean for normal rats and high fructose rats (n = 8). Con = control; HF = high fructose; HF + GA: high fructose + Gelidium.
Table 2.
Effect of Gelidium on liver and adipose tissue weight in rats.
| Con | HF | HF + GA | |
|---|---|---|---|
| Liver weight (g) | 29.9 ± 5.4 * | 34.6 ± 6.3 | 33.0 ± 6.2 |
| Relative liver weight (g/100 g BW) | 5.0 ± 0.5 * | 6.0 ± 0.6 | 5.8 ± 0.9 |
| Perirenal fat (g) | 17.1 ± 6.1 * | 23.3 ± 12.5 | 19.6 ± 5.5 |
| Paraepididymal fat (g) | 9.9 ± 3.6 | 10.5 ± 4.8 | 10.2 ± 2.7 |
| Total adipose tissue weight (g) | 27.0 ± 9.1 * | 36.2 ± 16.5 | 29.8 ± 7.7 |
| Relative adipose tissue weight (g/100 g BW) | 4.4 ± 1.0 * | 5.6 ± 2.1 | 5.2 ± 1.2 |
Results are expressed as mean ± standard deviation values (n = 8).
p < 0.05 compared with HF.
BW = body weight; Con = control; HF = high fructose;
HF + GA = high fructose + Gelidium.
3.2. Effects of GA on plasma glucose and lipid metabolism in HF diet-fed rats
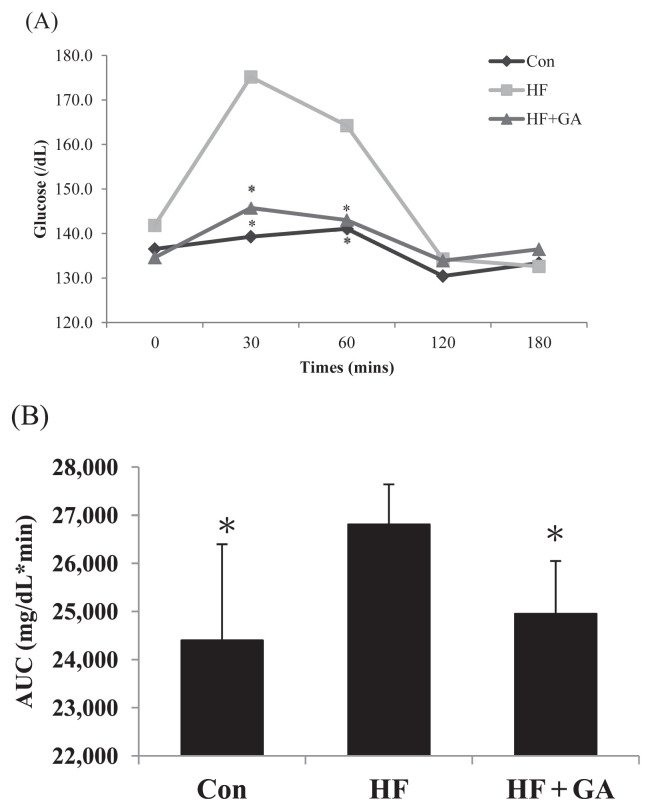
The level of fasting plasma glucose in HF diet-fed rats was significantly increased, but supplementation of GA reversed the increased plasma glucose (Table 3). The plasma insulin levels in HF diet-fed supplemented with GA were significantly lower than the HF diet-fed without GA. Moreover, homeostasis model assessment equation-insulin resistance (HOMA-IR) was enhanced by the fructose diet, but GA supplementation decreased the HOMA-IR. The HF diet significantly increased plasma glucose at 30 minutes after the OGTT performance, indicating that HF diet induced an insulin resistant state. However, GA reversed the increased plasma glucose at 30 minutes for OGTT (Figure 2). GA treatment decreased leptin and TNF-α in rats fed a HF diet (Table 3). These results reflect the amelioration of insulin resistance by supplementation of GA in HF diet-fed rats. By contrast, HF diet-fed rats supplemented with GA had lower plasma levels of TC, TG, low density lipoprotein cholesterol (LDL-C) + very low density lipoprotein cholesterol (VLDL-C), and TC/high density lipoprotein cholesterol (HDL-C) ratio (Table 4). In this study, HF increased TC and TG contents of liver. However, rats fed a GA diet displayed decreased cholesterol and TG contents in liver (Table 5). These results indicated that GA feeding can reduce hepatic lipid accumulation in rats fed a diet enriched in fructose. By contrast, GA supplementation increased fecal cholesterol, TG, and bile acid in rats fed an HF diet (Table 6), indicating that the reduced hepatic lipids accumulation may be related to the increased fecal lipids.
Table 3.
The changes of tumor necrosis factor-α (TNF-α), leptin, interleukin-6 (IL-6), adiponectin, and uric acid concentrations in normal and high fructose rats fed Gelidium for 23 weeks.
| Con | HF | HF + GA | |
|---|---|---|---|
| TNF-α (pg/mL) | 70.0 ± 16.1 * | 103.9 ± 14.0 | 71.3 ± 11.2 * |
| Leptin (pg/mL) | 6.6 ± 2.6 | 9.7 ± 4.5 | 5.3 ± 1.3 * |
| IL-6 (pg/mL) | 34.8 ± 8.7 | 34.3 ± 7.6 | 35.9 ± 5.4 |
| Adiponectin (mg/mL) | 22.0 ± 3.5 | 21.5 ± 3.5 | 20.3 ± 2.3 |
| Uric acid (mg/dL) | 1.8 ± 0.4 | 2.0 ± 0.5 | 1.6 ± 0.4 |
| Glucose (mg/dL) | 177.3 ± 17.8 * | 194.0 ± 12.0 | 181.4 ± 10.4 * |
| Insulin (μg/dL) | 0.59 ± 0.19 * | 0.80 ± 0.07 | 0.59 ± 0.16 * |
| HOMA-IR | 6.1 ± 2.3 * | 9.0 ± 1.1 | 6.7 ± 2.0 * |
| Plasma TBARS (n mol/mL) | 2.8 ± 0.4 * | 3.4 ± 0.5 | 2.7 ± 0.4 * |
Results are expressed as mean ± standard deviation values (n = 8).
p < 0.05 compared with HF.
Con = control; HF = high fructose; HF + GA = high fructose + Gelidium; HOMA-IR = homeostasis model assessment equation-insulin resistance; TBARS = thiobarbituric acid reactive substances.
Figure 2.
The changes of plasma glucose concentration (A) after the oral glucose tolerance test (OGTT) performed and (B) area under the curve (AUC) in rats fed the different experimental diets for 22 weeks. Results are expressed as mean for normal rats and high fructose rats (n = 6–7). * p < 0.05 compared with HF. Con = control; HF = high fructose; HF + GA = high fructose + Gelidium.
Table 4.
The changes of plasma lipids and liver function in normal and high fructose rats fed Gelidium for 23 weeks.
| Con | HF | HF + GA | |
|---|---|---|---|
| Total cholesterol (mg/dL) | 132.8 ± 26.3 * | 237.7 ± 46.6 | 142.9 ± 41.4 * |
| HDL-C (mg/dL) | 46.9 ± 8.9 | 56.9 ± 9.2 | 51.2 ± 10.1 |
| LDL-C + VLDL-C (mg/dL) | 84.4 ± 19.0 * | 166.8 ± 41.2 | 102.2 ± 37.7 * |
| TC/HDL-C | 2.9 ± 0.6 * | 4.0 ± 0.9 | 2.6 ± 0.6 * |
| HDL-C/(LDL-C+VLDL-C) | 0.58 ± 0.16 * | 0.37 ± 0.09 | 0.47 ± 0.14 |
| Triglyceride (mg/dL) | 42.9 ± 13.9 * | 71.6 ± 10.0 | 51.5 ± 7.7 * |
| AST (U/L) | 106.7 ± 21.8 | 119.5 ± 15.2 | 90.8 ± 19.7 * |
| ALT (U/L) | 59.0 ± 25.0 | 73.8 ± 17.3 | 70.4 ± 15.4 |
Results are expressed as mean ± standard deviation (n = 8).
p < 0.05 compared with HF.
ALT = alanine aminotransferase; AST = aspartate aminotransferase; Con = control; HDL-C = high density lipoprotein cholesterol; HF = high fructose; HF + GA = high fructose + Gelidium; LDL-C = low density lipoprotein cholesterol; VLDL-C = very low density lipoprotein cholesterol.
Table 5.
The changes of hepatic total cholesterol and triglyceride concentration in normal and high fructose rats fed Gelidium for 23 weeks.
| Con | HF | HF + GA | |
|---|---|---|---|
| Total cholesterol (mg/g liver) | 115.5 ± 18.1 * | 144.4 ± 18.0 | 107.9 ± 23.6 * |
| Total cholesterol (g/liver) | 3.4 ± 0.9 * | 5.0 ± 1.5 | 3.4 ± 1.1 * |
| Triglyceride (mg/g liver) | 40.7 ± 13.1 * | 96.5 ± 27.9 | 61.5 ± 12.5 * |
| Triglyceride (g/liver) | 1.2 ± 0.4 * | 3.4 ± 1.3 | 2.1 ± 0.6 * |
| Hepatic TBARS (n mol/g) | 29.7 ± 9.5 * | 43.8 ± 18.4 | 27.7 ± 2.7 * |
Results are expressed as mean ± standard deviation (n = 8).
p < 0.05 compared with HF.
Con = control; HF = high fructose; HF + GA = high fructose + Gelidium; TBARS = thiobarbituric acid reactive substances.
Table 6.
The changes of feces total cholesterol and triglyceride concentration in normal and high fructose rats fed the experimental diets for 23 weeks.
| Con | HF | HF + GA | |
|---|---|---|---|
| Feces wet weight (g/d) | 1.7 ± 0.2 | 1.5 ± 0.1 | 1.3 ± 1.0 * |
| Feces dry weight (g/d) | 1.5 ± 0.1 * | 1.2 ± 0.1 | 1.0 ± 0.1 * |
| Fecal total cholesterol (mg/g) | 28.5 ± 1.7 * | 25.6 ± 2.5 | 33.3 ± 2.1 * |
| Fecal triglyceride (mg/g) | 1.4 ± 0.4 * | 2.6 ± 0.5 | 3.8 ± 1.3 * |
| Bile acids (μmoL/g) | 45.9 ± 2.4 * | 32.2 ± 2.9 | 49.5 ± 4.7 * |
Results are expressed as mean ± standard deviation values (n = 8).
p < 0.05 compared with HF.
Con = control; HF = high fructose; HF + GA = high fructose + Gelidium.
3.3. Effects of GA on the hepatic enzyme activities and lipid peroxidation
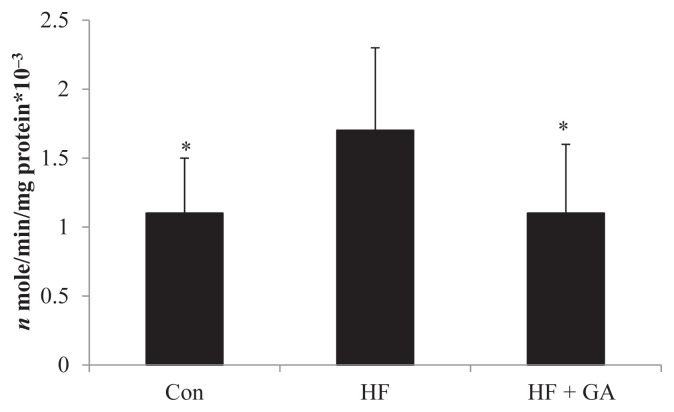
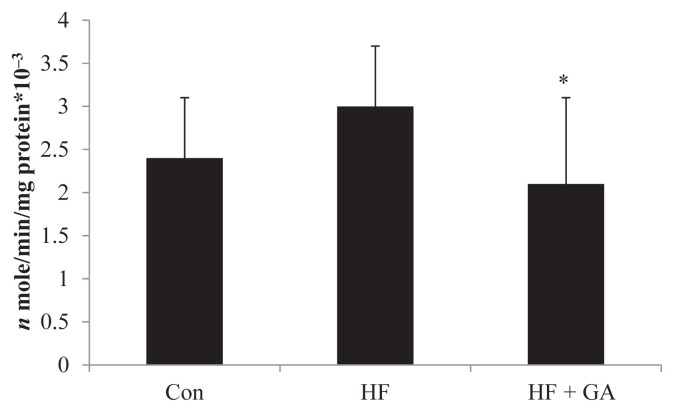
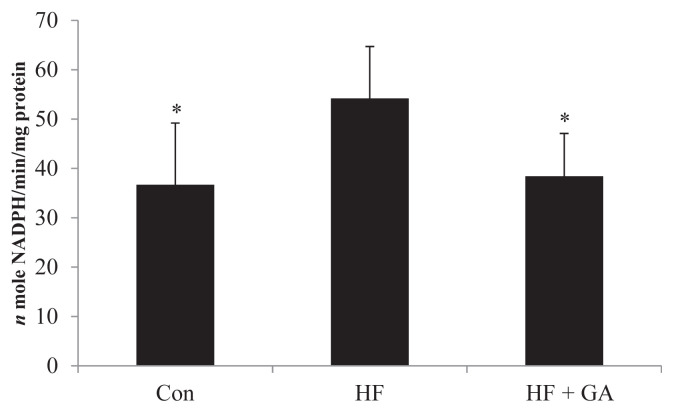
The increased hepatic enzymes of lipid biosynthesis (glucose-6-phospate-dehydrogenase, acetyl CoA carboxylase and fatty acid synthase) in HF diet-fed rats could be alleviated by GA supplementation (Figures 3–5). The liver fatty acid synthase and glucose-6-phosphatase dehydrogenase activities were increased in HF diet-fed rats, but GA supplementation reversed the increase in activities (Figures 3 and 5). Although there was no significant difference in liver acetyl CoA carboxylase activity between the control group and the HF group, GA supplementation decreased liver acetyl CoA carboxylase activity (Figure 4). It is interesting to note that HF diet increased the liver TBAR value, but supplementation of GA in the diet significantly decreased TBAR value (Table 5).
Figure 3.
Effect of Gelidium on fatty acid synthase activity in normal and high fructose rats for 23 weeks. * p < 0.05 compared with HF. Results are expressed as mean ± standard deviation values (n = 8). Con = control; HF = high fructose; HF + GA = high fructose + Gelidium.
Figure 4.
Effect of Gelidium on acetyl-CoA carboxylase activity in normal and high fructose rats for 23 weeks. Results are expressed as mean ± standard deviation values (n = 8). * p < 0.05 compared with HF. Con = control; HF = high fructose; HF + GA = high fructose + Gelidium.
Figure 5.
Effect of Gelidium on glucose-6-phosphate dehydrogenase activity in normal and high fructose rats for 23 weeks. Results are expressed as mean ± standard deviation values (n = 8). Con = control; HF = high fructose; HF + GA = high fructose + Gelidium. * p < 0.05 compared with HF.
4. Discussion
HF diet leads to an insulin resistance in rats by decreasing insulin receptor messenger RNA expression of skeletal muscle and liver [7]. In the present study, long-term HF diet feeding produced impairment of glucose and lipid metabolismin rats, including the induction of hyperglycemia, insulin resistance, and hyperlipidemia. This HF diet-fed animal model shows similar symptoms of type 2 diabetes. Our present work further showed that supplementation of GA in the diet can improve hypercholesterolemia and decrease insulin resistance induced by HF diet feeding in rats. These results indicate that GA possesses the ability to improve the insulin resistance and lipid metabolism in a HF diet-fed rat model.
We have reported that GA feeding may reduce plasma glucose, lipids, and adipocytokine levels in diabetic rats, indicating that GA may improve plasma glucose and lipids and increase lipolysis activity, resulting in the reduction of adipose tissue, thereby reducing TNF-α and IL-6 and lowering the risk of chronic inflammation and cardiovascular disease in diabetic rats [13]. In the present study, GA supplementation decreased plasma glucose, decreased HOMA-IR, and improved the oral glucose tolerance test, suggesting that the hyperglycemia and insulin resistance induced by long-term HF diet can be alleviated by GA.
Hypertrophic adipocytes may increase plasma leptin, TNFα, and IL-6 concentrations but decrease the plasma adiponectin level. Results from this study show that GA feeding significantly reduced plasma TNF-α and leptin concentrations in the HF diet-fed rat model. Consistent with previous results [13], our results showed that GA feeding could reverse the increased TNF-α and leptin levels in the HF diet-fed rat model. These results indicate that GA may regulate plasma adipocytokines in the HF diet rat model.
Diabetic patients have abnormal lipid metabolism [24]. A recent report showed that dietary algae consumption may decrease the risk of type 2 diabetes mellitus [25]. Supplementation of dietary soluble fiber in the diet has been found to lower plasma TC, VLDL-C plus LDL-C levels in high cholesterol diet-fed rats by increasing the fecal excretion of cholesterol [26,27]. We have also found that supplementation of GA in the diet for 7 weeks reduces the plasma glucose, TC, VLDL-C plus LDL-C, and TG levels in streptozotocin-induced diabetic rats [13]. In the present study, long-term supplementation of GA significantly decreased the increased plasma levels of TC, LDL-C + VLDLC, and TC/HDL-C ratio in HF diet-fed rats by increasing the fecal excretion of cholesterol, TG, and bile acid. Because GA is rich in soluble dietary fiber, it is possible that the plasma hypolipidemic effect may be related to soluble dietary fiber.
Lê and Tappy [28] have shown that a diet rich in fructose can induce the accumulation of liver lipids. In the present study, a HF diet induced an increase in liver lipids accumulation and GA supplementation; however, it reversed the increase in hepatic lipids and increased the fecal lipid excretion. In addition, GA reduced the increased liver acetyl CoA carboxylase and glucose-6-phosphate dehydrogenase and fatty acid synthase activities induced by the HF diet. It is possible that GA can attenuate TG and cholesterol accumulation in liver. Therefore, GA improves the accumulation of liver lipid induced in the HF diet rat model. Further investigation is needed to understand the detailed actions and mechanisms of GA on lipid responses and lipid metabolism under an impaired glucose tolerance condition.
In the present study, higher hepatic TBARS level was observed in rats of the HF group than those of the normal group, indicating that a fructose diet resulted in an increase of lipid peroxidation in the liver. Our results supported previous findings showing that HF induces lipid peroxidation [29,30]. However, GA reduced TBARS level in both liver and plasma, suggesting that GA might reduce oxidative stress. Moreover, reduced TBARS level was also accompanied with a lower TNFα level. Since TNF-α plays a central role in initiating and sustaining the inflammatory response and increased oxidative stress in tissues [31], it is proposed that reduced TNF-α levels in the liver and plasma by GA might result in a lower level of oxidative stress. Our present results supported GA having beneficial effects on reducing liver injury caused by oxidative damage.
It is interesting to note that GA contains abundant (45.9%) water soluble fiber. Water soluble fiber in the gastrointestinal tract can delay carbohydrate absorption and induce an increase in bile acid excretion [32]. Long-term intake of water soluble fiber helps to improve the hyperinsulinemia and hyperlipidemia of type 2 diabetes [33]. Therefore, we suggest that the reduction in plasmaglucose and lipids with GA feeding may be partially related to its high water soluble fiber content.
In conclusion, we demonstrate, in this study, that supplementation of GA in the diet can effectively improve the increased hypercholesterolemia, and increased insulin resistance induced by HF diet feeding in rats. These findings suggest that GA possesses the ability to improve the impairment of glucose and lipid metabolism in an HF diet-fed rat model.
Footnotes
Conflicts of interest
There is no potential conflict of interest.
REFERENCES
- 1. Alberti KGMM, Zimmet PZ. Definition, diagnosis and classification of diabetes mellitus and its complications. Part 1: diagnosis and classification of diabetes mellitus, provisional report of a WHO consultation. Diabet Med. 1998;15:539–53. doi: 10.1002/(SICI)1096-9136(199807)15:7<539::AID-DIA668>3.0.CO;2-S. [DOI] [PubMed] [Google Scholar]
- 2. Eckel RH, Grundy SM, Zimmet PZ. The metabolic syndrome. Lancet. 2005;365:1415–28. doi: 10.1016/S0140-6736(05)66378-7. [DOI] [PubMed] [Google Scholar]
- 3. Hayden MR, Tyagi SC. Intimal redox stress: accelerated atherosclerosis in metabolic syndrome and type 2 diabetes mellitus. Atheroscleropathy. Cardiovasc Diabetol. 2002;27:1–3. doi: 10.1186/1475-2840-1-3. [DOI] [PMC free article] [PubMed] [Google Scholar]
- 4. Marriott BP, Cole N, Lee E. National estimates of dietary fructose intake increased from 1977 to 2004 in the United States. J Nutr. 2009;139:1228–35. doi: 10.3945/jn.108.098277. [DOI] [PubMed] [Google Scholar]
- 5. Tappy L, Lê KA. Metabolic effects of fructose and the worldwide increase in obesity. Physiol Rev. 2010;90:23–46. doi: 10.1152/physrev.00019.2009. [DOI] [PubMed] [Google Scholar]
- 6. Catena C, Giacchetti G, Novello M, Colussi G, Cavarape A, Sechi LA. Cellular mechanisms of insulin resistance in rats with fructose-induced hypertension. Am J Hypertens. 2003;16:973–8. doi: 10.1016/s0895-7061(03)01002-1. [DOI] [PubMed] [Google Scholar]
- 7. Bantle JP. Dietary fructose and metabolic syndrome and diabetes. J Nutr. 2009;139:1263–8. doi: 10.3945/jn.108.098020. [DOI] [PMC free article] [PubMed] [Google Scholar]
- 8. Labropoulos KC, Niesz DE, Danforth SC, Kevrekidis PG. Dynamic rheology of agar gels: theory and experiments. Part I. Development of a rheological model. Carbohyd Polym. 2002;50:393–406. [Google Scholar]
- 9. Chen YH, Tu CJ, Wu HT. Growth-inhibitory effects of the red alga Gelidium amansii on cultured cells. Biol Pharm Bull. 2004;27:180–4. doi: 10.1248/bpb.27.180. [DOI] [PubMed] [Google Scholar]
- 10. Wang H, Zhou X, Tang F, Zuo SH. An experimental study on the hypoglycemic effect of agar polysaccharide in diabetic rats. Health Med Res Pract. 2011;4:004. [Google Scholar]
- 11. Maeda H, Yamamoto R, Hirao K, Tochikubo O. Effects of agar (kanten) diet on obese patients with impaired glucose tolerance and type 2 diabetes. Diabetes Obes Metab. 2005;7:40–6. doi: 10.1111/j.1463-1326.2004.00370.x. [DOI] [PubMed] [Google Scholar]
- 12. Liu SH, Cai FY, Chiang MT. Long-term feeding of chitosan ameliorates glucose and lipid metabolism in a high-fructose-diet-impaired rat model of glucose tolerance. Mar Drugs. 2015;13:7302–13. doi: 10.3390/md13127067. [DOI] [PMC free article] [PubMed] [Google Scholar]
- 13. Yang TH, Yao HT, Chiang MT. Red algae (Gelidium amansii) reduces adiposity via activation of lipolysis in rats with diabetes induced by streptozotocin-nicotinamide. J Food Drug Anal. 2015;23:758–65. doi: 10.1016/j.jfda.2015.06.003. [DOI] [PMC free article] [PubMed] [Google Scholar]
- 14.AOAC. Official Methods of Analysis of AOAC International. 14th ed. Gaithersburg, MD: AOAC; 1984. [Google Scholar]
- 15.AOAC. Official Methods of Analysis of AOAC International. 16th ed. Gaithersburg, MD: AOAC; 1996. [Google Scholar]
- 16. Takehisa F, Suzuki Y. Effect of guar gum and cholestyramine on plasma lipoprotein cholesterol in rats. J Jpn Soc Nutr Food Sci. 1990;43:269–74. [Google Scholar]
- 17. Goodridge AG. Regulation of the activity of acetyl coenzyme A carboxylase by palmitoyl coenzyme A and citrate. J Biol Chem. 1972;247:6946–52. [PubMed] [Google Scholar]
- 18. Nepokroeff CM, Lakshmanan MR, Porter JW. Fatty-acid synthase from rat liver. Methods Enzymol. 1975;35:37–44. doi: 10.1016/0076-6879(75)35136-7. [DOI] [PubMed] [Google Scholar]
- 19. Nakayama F, Oshima H, Umezawa K. Distribution of glucose-6-phosphate metabolizing enzyme in fish. Bull Jap Soc Sci Fish. 1972;38:589–93. [Google Scholar]
- 20. Folch J, Lees M, Sloane Stanley GH. A simple method for the isolation and purification of total lipides fromanimal tissues. J Biol Chem. 1957;226:497–509. [PubMed] [Google Scholar]
- 21. Carlson SE, Goldfarb S. A sensitive enzymatic method for determination of free and esterified tissue cholesterol. Clin Chim Acta. 1977;79:575–82. doi: 10.1016/0009-8981(77)90178-4. [DOI] [PubMed] [Google Scholar]
- 22. Yagi K. A simple fluorimetric assay for lipid peroxidation in plasma. Biochem Med. 1976;15:212–6. doi: 10.1016/0006-2944(76)90049-1. [DOI] [PubMed] [Google Scholar]
- 23. Uchiyama M, Mihara M. Determination of malonaldehyde precursor in tissue by thiobarbituric acid test. Anal Biochem. 1978;86:271–8. doi: 10.1016/0003-2697(78)90342-1. [DOI] [PubMed] [Google Scholar]
- 24. Gotto AM. Lipid management in diabetic patients: lessons from prevention trials. Am J Med. 2002;112:19–26. doi: 10.1016/s0002-9343(02)01086-0. [DOI] [PubMed] [Google Scholar]
- 25. Lee HJ, Kim HC, Vitek L, Nam CM. Algae consumption and risk of type 2 diabetes: Korean National Health and Nutrition Examination Survey in 2005. J Nutr Sci Vitaminol. 2009;56:13–8. doi: 10.3177/jnsv.56.13. [DOI] [PubMed] [Google Scholar]
- 26. Ney DM, Lasekan JB, Shinnick FL. Soluble oat fiber tends to normalize lipoprotein composition in cholesterol-fed rats. J Nutr. 1988;118:1455–62. doi: 10.1093/jn/118.12.1455. [DOI] [PubMed] [Google Scholar]
- 27. Terpstra AH, Lapre JA, de Vries HT, Beynen AC. Dietary pectin with high viscosity lowers plasma and liver cholesterol concentration and plasma cholesteryl ester transfer protein activity in hamsters. J Nutr. 1998;128:1944–9. doi: 10.1093/jn/128.11.1944. [DOI] [PubMed] [Google Scholar]
- 28. Lê KA, Tappy L. Metabolic effects of fructose. Curr Opin Clin Nutr Metab. 2006;9:469–75. doi: 10.1097/01.mco.0000232910.61612.4d. [DOI] [PubMed] [Google Scholar]
- 29. Faure P, Rossini E, Lafond JL, Richard MJ, Favier A, Halimi S. Vitamin E improves the free radical defense system potential and insulin sensitivity of rats fed high fructose diets. J Nutr. 1997;127:103–7. doi: 10.1093/jn/127.1.103. [DOI] [PubMed] [Google Scholar]
- 30. Faure P, Rossini E, Wiernsperger N, Richard MJ, Favier A, Halimi S. An insulin sensitizer improves the free radical defense system potential and insulin sensitivity in high fructose-fed rats. Diabetes. 1999;48:353–7. doi: 10.2337/diabetes.48.2.353. [DOI] [PubMed] [Google Scholar]
- 31. Kaur K, Sharma AK, Dhingra S, Singal PK. Interplay of TNF-alpha and IL-10 in regulating oxidative stress in isolated adult cardiac myocytes. J Mol Cell Cardiol. 2006;41:1023–30. doi: 10.1016/j.yjmcc.2006.08.005. [DOI] [PubMed] [Google Scholar]
- 32. Abraham ZD, Mehta T. Three-week psyllium-husk supplementation: effect on plasma cholesterol concentrations, fecal steroid excretion, and carbohydrate absorption in men. Am J Clin Nutr. 1988;47:67–74. doi: 10.1093/ajcn/47.1.67. [DOI] [PubMed] [Google Scholar]
- 33. Yu K, Ke MY, Li WH, Zhang SQ, Fang XC. The impact of soluble dietary fiber on gastric emptying, postprandial blood glucose and insulin in patients with type 2 diabetes. Asia Pac J Clin Nutr. 2014;23:210–8. doi: 10.6133/apjcn.2014.23.2.01. [DOI] [PubMed] [Google Scholar]


