Abstract
A new postchemiluminescence (PCL) reaction was observed when urea was injected into the reaction mixture after the CL reaction of N-bromosuccinimide and dichlorofluorescein. A possible reaction mechanism was proposed based on the studies of the CL kinetic characteristics, CL spectra, fluorescence spectra, and other experiments. A new flow injection CL method for the determination of urea was established based on the PCL reaction. The relative standard deviation for the determination of urea was 1.3% (n = 11, c = 5.0 × 10⁻⁸ g/mL). The CL intensity responded linearly to the concentration of urea in the range 2.0 × 10⁻⁹–1.0 × 10⁻⁶ g/mL (r = 0.9992). The detection limit was 7 × 10⁻¹⁰ g/mL. The method had been applied to the determination of urea in milk with satisfactory results.
Keywords: dichlorofluorescein, milk, N-bromosuccinimide, postchemiluminescence, urea
1. Introduction
Urea is a common fertilizer widely used in agriculture. It is a final metabolic product of proteins and amino acids in the animal body [1]. Urea in blood is one of the most important indicators for several renal diseases. The levels of urea in milk must be periodically monitored, because they can be used to predict the state of animal health, as an indicator of the protein-feeding efficiency. However, to improve the protein content of milk, some profit-seeking producers try to add urea into milk, which may pose a direct health threat to humans. Therefore, it is necessary to establish a method for analyzing urea with high sensitivity and selectivity.
The analytical methods typically used for urea include high-performance liquid chromatography [2], conductometry [3,4], potentiometry [5,6], amperometry [7], fluorimetry [8], and spectrometry [9]. Many of these methods are based on the enzymatic reaction wherein the enzyme catalyzes the conversion of urea to hydrogenocarbonate and ammonium as follows:
Generally, the enzymatic reactions are uncontrollable because the enzyme activities are particularly labile under harsh conditions [10–12]. Therefore, it is better to find new methods for urea analysis that do not require using enzymes.
Chemiluminescence (CL) analysis has received much attention in various fields because it is highly sensitive, has a wide linear range, and only requires simple instruments to perform. CL analyses for urea determination have already been reported [13–16]. These methods were simple and based on nonenzymatic reactions. Most of these methods are based on the CL reaction of urea with oxidants and CL reagent. Unfortunately, the drawback of these methods is their poor detection limits because oxidants can oxidize CL reagents to produce strong a CL signal under the same condition that would be the background signal during the sample determination. The high background signal will have a negative influence on the sensitivity of the CL method. For example, Li et al [13] have reported the CL method of using urea–N-bro-mosuccinimide (NBS)–dichlorofluorescein (DCF) system to determine urea [13]. In their work, NBS was used as the oxidant and DCF was the CL reagent. NBS oxidized DCF accompanied with a very strong CL signal, which was the blank signal for the urea determination. However, the high blank signal influenced the sensitivity of the method. Therefore, the detection limit for urea determination was only 2.7 × 10⁻⁶ mol/L.
Du et al [17] and Sun and Lu [18] found that a new CL reaction will be generated when some substances are added into the solution in which the former CL reaction had finished. They called this as postchemiluminescence (PCL) [17,18]. Compared with regular CL methods, PCL methods always exhibit better sensitivity because the high background signal would be largely decreased by controlling the triggering time of the PCL reaction.
In this work, it was found that urea can initiate a PCL reaction in the NBS–DCF system. A new method for the determination of urea was established by combining the CL reaction with the flow injection technique. NBS and DCF were mixed first. After they have reacted sufficiently, urea was added and the PCL signal was generated, which was used for the determination. Because the high blank signal was eliminated, the sensitivity of the method could be improved considerably. The CL intensity responded linearly to the concentration of urea in the range 2.0 × 10⁻⁹–1.0 × 10⁻⁶ g/mL (r = 0.9992), and the detection limit was 7 × 10⁻¹⁰ g/mL. The relative standard deviation for the determination of urea was 1.3% (n = 11, c = 5.0 × 10⁻⁸ g/mL). The method had been applied to the determination of urea in milk, and the results are in good agreement with those obtained using the colorimetric method [19]. A possible reaction mechanism was proposed based on the studies of the CL kinetic characteristics, the CL spectra, fluorescence spectra, and other experiments.
2. Experimental
2.1. Apparatus
The model IFFM-D flow injection apparatus (Remex Analytical Instrument Limited Co., Xi'an, China) equipped with automatic injection system and detecting system was used. All the experimental components were linked with polytetrafluoroethylene flow tubes (0.8 mm i.d.). The flow cell made by twining colorless glass tubes (20 cm length, 2 mm i.d.) into a spiral disk shape, and it was placed in front of the photomultiplier tube. The CL signal was acquired by a personal computer.
The fluorescence spectra were measured on a 970CRT spectrofluorometer (Shanghai Analysis Instrument Main Plant, Shanghai, China). UV–vis spectra were obtained on a UV-2550 spectrophotometer (Shimadzu, Kyoto, Japan). Ultrapure water was supplied by a Milli-Q system (Millipore Corp., Bedford, MA, USA).
2.2. Reagents
Urea and NBS were purchased from Sigma-Aldrich Co. LLC (Shanghai, China). DCF was purchased from Sinopharm Chemical Reagent Co. Ltd. (Shanghai, China).
The standard solution of urea (5.00 × 0−4 g/mL) was prepared by dissolving 0.0500 g urea with 100 mL water and then diluting to proper concentration with water.
The stock solution (1.0 × 10⁻² mol/L) of DCF was prepared by dissolving 0.4 g DCF with 5 mL NaOH (1.0 mol/L) and then diluting to 100 mL with water.
The NBS solution (1.0 × 10⁻² mol/L) was prepared daily by dissolving 0.18 g NBS with 100 mL water. It remained stable for 2 days.
All reagents used were of analytical grade. Ultrapure water was used throughout the whole experiment.
2.3. Procedure
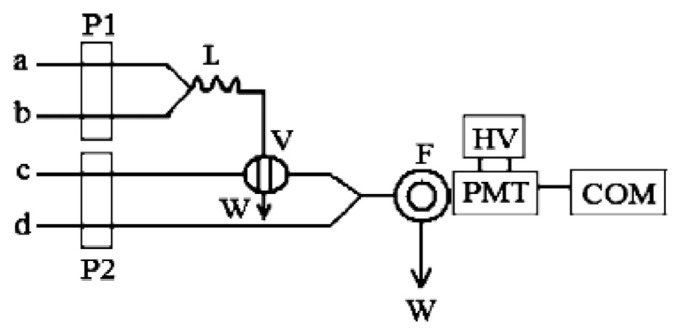
In Figure 1, flow lines (a, b, c, and d) are connected with NBS solution, DCF solution, H2O, and urea standard solution, respectively. NBS solution was first mixed with DCF solution via Y-piece 1. The mixture reacted fully in mixing tube L, then was injected into water by a six-way injection valve. With the help of the water carrier, the mixed stream was merged with urea solution by means of Y-piece 2 to generate PCL. The peak height of the CL signal was recorded. The concentration of urea was quantified by the relative peak height (ΔI = Isample – Iblank).
Figure 1.
Schematic diagram of the flow system. a, NBS solution; b, DCF solution; c, H2O; d, urea standard/sample solution. COM = computer; DCF = dichlorofluorescein; F = flow cell; HV = high voltage; L = mixing tube; NBS = N-bromosuccinimide; P = peristaltic pump; PMT = photomultiplier tube; V = six-way valve; W = waste.
2.4. Sample preparation
Milk samples were purchased from local supermarkets. A 7-mL milk sample was mixed with 3 mL acetic acid solution (v/v, 3%), then the mixture was centrifuged (3500 rpm, 3 minutes). Next, 5 mL supernatant was transferred into a test tube, into which 200 μL of 3.0 mol/L NaOH was added, and the solution was centrifuged (821.7 g, 3 minutes). Then, 1 mL final solution was removed and placed into a 10-mL volumetric flask and was diluted to graduation with ultrapure water.
3. Results and discussion
3.1. Mechanism of the CL reaction
3.1.1. Kinetic characteristic of the CL reaction
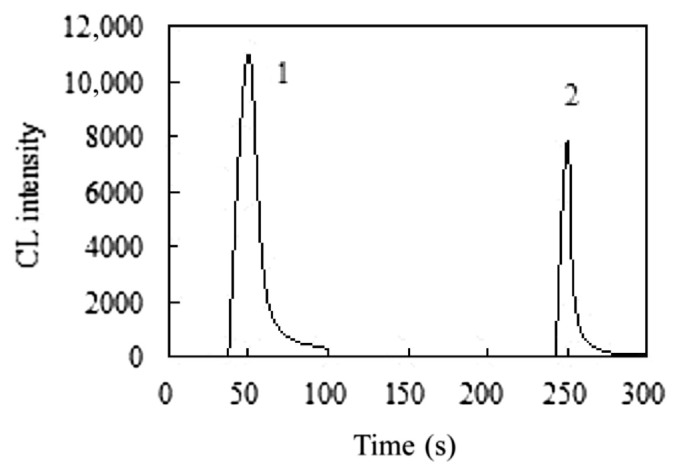
The CL kinetic characteristics of the NBS–DCF reaction and the NBS–DCF–urea reaction were examined using the static system of the CL analyzer. As shown in Figure 2, a strong CL signal (peak 1) was observed when 1.0 mL of NBS solution (1.0 × 10⁻² mol/L) was injected into 1.0 mL of 9.0 × 10⁻⁴ mol/L DCF solution (in 4.0 × 10⁻² mol/L NaOH). After about 50 seconds, the CL reaction terminated and the CL signal declined to the baseline level. Subsequently, a PCL reaction (peak 2) was initiated when 1.0 mL of 5.0 × 10⁻⁶ g/mL urea (in 1.0 × 10⁻⁴ mol/L NaOH) was injected into the above-mentioned reaction mixture. The signal dropped about 90% after approximately 30 seconds. Under identical conditions, no signal was observed when the urea solution was replaced by the blank solution (1.0 × 10⁻⁴ mol/L NaOH). The result indicated that the reaction initiated by urea in the NBS–DCF system was a PCL reaction.
Figure 2.
Kinetic curve of the PCL reaction. (1) 1.0 mL of 1.0 × 10⁻² mol/L NBS solution was injected into 1.0 mL of 5.0 × 10⁻⁴ mol/L dichlorofluorescein solution (in 0.04 mol/L NaOH). (2) 1.0 mL of 5.0 × 10⁻⁶ g/mL urea (in 1.0 × 10⁻⁴ mol/L NaOH) was injected into the above reaction mixture. NBS = N-bromosuccinimide; PCL = postchemiluminescence.
3.1.2. Luminant of the PCL reaction
It was considered that the reaction mechanism was the same in both urea–NBS–DCF CL system and CL system, and the luminant of both CL systems was [13]. In order to test this, further experiments were performed in this work.
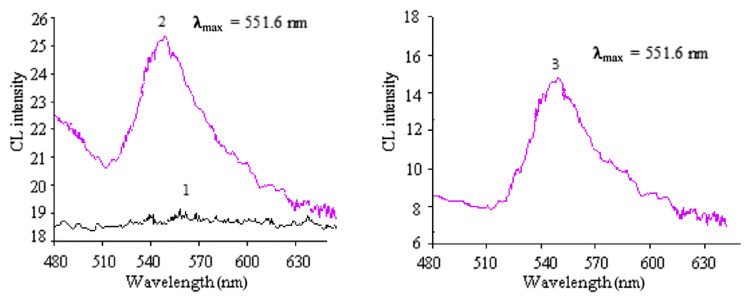
The CL spectra of NBS–DCF, urea–NBS–DCF, and were measured using a refitted 970CRT spectrofluorometer. In Figure 3, no obvious CL spectrum was observed in the NBS–DCF system because the CL signal was too weak. However, the CL spectra of urea–NBS–DCF system and system were obtained with the same maximum emission wavelength at 551.6 nm. Hence, it could be concluded that the luminant of the urea–NBS–DCF system and were the same.
Figure 3.
CL spectra. (1) 1.0 × 10⁻² mol/L NBS + 5.0 × 10⁻⁴ mol/L DCF (in 4.0 × 10⁻² mol/LNaOH). (2) 5.0 × 10⁻⁵ g/mL NBS + 5.0 × 10⁻⁴ mol/L DCF (in 4.0 × 10⁻² mol/L NaOH). (3) 5.0 × 10⁻⁴ g/mL urea + 1.0 × 10⁻² mol/L NBS + 9.0 × 10⁻⁴ mol/L DCF (in 4.0 × 10⁻² mol/L NaOH). CL = chemiluminescence; DCF = dichlorofluorescein; NBS = N-bromosuccinimide; PCL = postchemiluminescence.
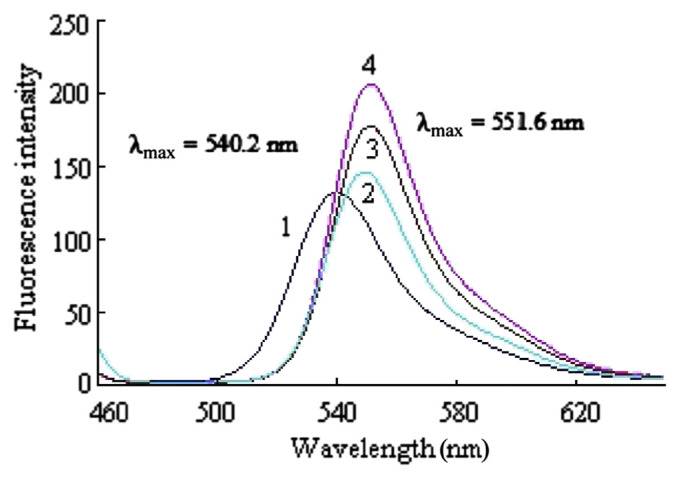
For the purpose of further ascertaining the luminant of the three CL systems, the fluorescence spectra of DCF, NBS–DCF, , and NBS–DCF–urea were scanned. As shown in Figure 4, the maximum emission wavelength of DCF was at 540.2 nm, whereas the maximum emission wavelength of the other three solutions was at 551.6 nm, which indicated that DCF was oxidized by NBS when they were mixed. Because the maximum emission wavelength of the three mixtures was consistent with the above-mentioned maximum CL emission wavelength, the CL luminant may be the oxidative product of DCF.
Figure 4.
Fluorescence spectra. (1) 4.0 × 10⁻⁶ mol/L DCF. (2) 2.5 × 10⁻³ mol/L NBS + 3.0 × 10⁻⁵ mol/L DCF. (3) 2.5 × 10⁻³ mol/L NBS + 3.0 × 10⁻⁵ mol/L DCF + 1.0 × 10⁻⁷ mol/L . (4) 2.5 × 10⁻³ mol/L NBS + 3.0 × 10⁻⁵ mol/L DCF + 5.0 × 10⁻⁶ g/mL urea (5.0 × 10⁻⁴ mol/L NaOH). DCF = dichlorofluorescein; NBS = N-bromosuccinimide; PCL = postchemiluminescence.
Moreover, the UV–vis absorption spectra of different solutions were drawn. As shown in Figure 5, the absorption peak of DCF was similar to that of . Therefore, DCF did not react with . However, in the spectra of NBS–DCF, , and NBS–DCF–urea, a new absorption peak at 516.2 nm can be observed whereas the characterized absorption peak of DCF at 503.6 nm disappeared. It demonstrated that DCF was oxidized and a new substance was generated.
Figure 5.
UV–vis absorption spectra. (1) 3.0 × 10⁻⁵ mol/L DCF. (2) 1.0 × 10⁻⁷ g/mL DCF. (3) 2.5 × 10⁻³ mol/L NBS + 3.0 × 10⁻⁵ mol/L DCF. (4) 2.5 × 10⁻³ mol/L NBS + 3.0 × 10⁻⁵ mol/L DCF + 1.0 × 10⁻⁷ g/mL . (5) 2.5 × 10⁻³ mol/L NBS + 3.0 × 10⁻⁵ mol/L DCF + 5.0 × 10⁻⁶ g/mL urea. DCF = dichlorofluorescein; NBS = N-bromosuccinimide; PCL = postchemiluminescence.
From the above experiments, it could be concluded that DCF was oxidized by NBS when they were mixed, and the oxidative product of DCF was the luminant of the related CL system. The luminant of the urea–NBS–DCF system was same as that of the system.
3.1.3. Mechanism of the PCL reaction
A probable PCL mechanism of the NBS–DCF–urea system was proposed as follows. In alkaline condition, NBS hydrolyzed to hypobromite [20] with strong oxidizability. Hypobromite oxidized DCF to generate a product (P) at its excited state (P*). When P* came back to the ground state, CL was generated (λmax = 551.6 nm). Then, when urea was added into the reaction mixture, urea hydrolyzed to produce ammonium ( ) [21]. The excess NBS oxidized to engender [22]. Subsequently, transferred its energy to P so that P was excited again accompanied by PCL (λmax = 551.6 nm). The mechanism can be simply described as follows:
3.2. Optimization of the reaction conditions
A series of experiments was performed to select the optimal analytical conditions using 5.0 × 10⁻⁸ g/mL urea solution.
3.2.1. Flow system
Initially, to obtain maximum PCL signals, multifold flow systems were carried out. When using the system shown schematically in Figure 1, the sample solution could sufficiently react to the mixture of NBS and DCF. Thus, strong PCL signals were observed. Finally, the flow system in Figure 1 was selected.
3.2.2. Length of mixing tube and flow rate of P2
Because the experiment was based on the PCL of urea in the DCF–NBS system, the length of the mixing tube and the flow rate of P2 influenced the PCL signals. From the kinetic curve, the PCL reaction was fast. Therefore, the CL signals would decay seriously if the flow rate was too slow or if the mixing tube was too long. Although the mixing tube was too short, DCF and NBS would react inadequately and a low signal/noise (S/N) ratio was obtained because of the high baseline. The effect of the flow rate of P2 and the length of the mixing tube were studied respectively when the flow rate of P1 was fixed at 1.2 mL/min. In view of the S/N value and reagent consumption, 90 cm was chosen as the length of the mixing tube and 1.5 mL/min as the flow rate of P2.
3.2.3. Concentration of NBS solution, DCF solution, and NaOH
NBS was the oxidant of the PCL system so that its concentration was an important factor to the CL signals. The effect of NBS concentration was examined in the range from 5.0 × 10⁻³ to 5.0 × 10⁻² mol/L, and 1.0 × 10⁻² mol/L of NBS solution was selected.
DCF solution was used as precursor of luminant in the PCL system, and its concentration directly influenced the PCL intensity. The effect of DCF concentration was examined in the range from 5.0 × 10⁻⁵ to 2.0 × 10⁻³ mol/L, and 9.0 × 10⁻⁴ mol/L DCF solution gave the best PCL signal.
Alkaline solution could improve the oxidation capacity of NBS so that it contributed to the generation of the luminant. The alkalinity was changed by adjusting the concentration of NaOH added into the DCF solution in the range of 5.0 × 10⁻³ to 5.0 × 10⁻¹ mol/L. The PCL signal reached its highest level when the concentration of NaOH was 4.0 × 10⁻² mol/L.
3.2.4. Medium of urea/sample solution
Various media of urea/sample solution were tested, including water, PBS buffer, Tris buffer, NaOH, HCl, and sodium dodecyl sulfate. The results indicated that urea could generate maximum PCL signal in alkaline medium, and NaOH solution was the best reaction medium. The concentration of NaOH was examined in the range 1.0 × 10⁻⁵ to 1.0 × 10⁻² mol/L. Finally, 5.0 × 10⁻⁴ mol/L NaOH was used.
3.3. Analytical characteristics
Under the optimized experimental conditions, the linear experiments between the PCL intensity and the concentration of urea were performed. PCL intensity presented a good linearity with the concentration of urea ranging from 2.0 × 10⁻⁹ to 1.0 × 10⁻⁶ g/mL. The regression equation was ΔI = 5.24C + 14.02 with a correlation coefficient (r) of 0.9992, where C is the urea concentration (10−8 g/mL). The relative standard deviation was 1.3% for 11 parallel determinations of 5.0 × 10⁻⁸ g/mL standard urea solution. According to the suggestions of the International Union of Pure and Applied Chemistry, the limit of detection was 7 × 10⁻¹⁰ g/mL.
3.4. Effect of interferences
The influence of common foreign ions was studied with 5.0 × 10⁻⁸ g/mL urea solution. A substance was considered to show no interference if the variation of the CL intensity was within ±5%. No interference was encountered from (tolerance ratios of foreign species to 5.0 × 10⁻⁸ g/mL urea) the following: citric acid, tartaric acid, glucose, ethanol, lactic acid, , K+, Cl− (1000); , Cd2+, Pb2+ ; lactose, fructose, Zn2+, Cu2+ (100); Fe3+, Fe2+, Mg2+, Al3+, I− (50); uric acid, ascorbic acid, Ca2+, Ba2+ (10); Cr3+, Ni2+ (5).
3.5. Sample analysis
In order to verify the feasibility of the suggested method, urea in the milk was determined using the method described in the section Procedure. The sample solutions were prepared as described in the section Sample preparation. The determination results are shown in Table 1. The result of t test showed that there was no significant difference between the results obtained using the proposed method and those obtained by the colorimetric method [19] at the confidence level of 95%.
Table 1.
Determination results of urea in milk (n = 5).
| Sample | This method (10−4 g/mL) | RSD (%) | Colorimetric method (10−4 g/mL) | RSD (%) |
|---|---|---|---|---|
| Sample.1 | 2.16 | 1.1 | 2.18 | 1.9 |
| Sample.2 | 1.98 | 1.7 | 2.01 | 1.8 |
| Sample.3 | 2.24 | 1.2 | 2.26 | 2.2 |
RSD = relative standard deviation.
4. Conclusion
In this paper, a new method of flow injection PCL to determine urea was established, and the reaction mechanism in the NBS–DCF–urea CL system was proposed. Compared with the existing CL method of detecting urea, this method possesses higher sensitivity because the background signals are reduced dramatically in the PCL system. Moreover, this method was used to quantify urea in the milk, and the result was satisfactory.
Acknowledgments
The authors gratefully acknowledge the financial support of this research by the National Science Foundation of Shaanxi Province (No. 2011JQ2011) and the Scientific Research Foundation of Shaanxi Provincial Key Laboratory (No. 15JS099), China.
Funding Statement
The authors gratefully acknowledge the financial support of this research by the National Science Foundation of Shaanxi Province (No. 2011JQ2011) and the Scientific Research Foundation of Shaanxi Provincial Key Laboratory (No. 15JS099), China.
Footnotes
Conflicts of interests
The authors declare that there are no conflicts of interests.
REFERENCES
- 1.Tietz NW, Berger S. Fundamentals of clinical chemistry. Philadelphia: W. B. Saunders; 1976. [Google Scholar]
- 2. Koebel M, Elsener M. Determination of urea and its thermal decomposition products by high-performance liquid chromatography. J Chromatogr A. 1995;689:164–9. [Google Scholar]
- 3. áde Faria LC, Neto GO. Determination of urea in serum by using naturally immobilized urease in a flow injection conductimetric system. Analyst. 1991;116:357–60. doi: 10.1039/an9911600357. [DOI] [PubMed] [Google Scholar]
- 4. Castillo-Ortega M, Rodriguez D, Encinas J, Plascencia M, Mendez-Velarde F, Olayo R. Conductometric uric acid and urea biosensor prepared from electroconductive polyaniline–poly(n-butyl methacrylate) composites. Sens Actuators B Chem. 2002;85:19–25. [Google Scholar]
- 5. Lakard B, Herlem G, Lakard S, Antoniou A, Fahys B. Urea potentiometric biosensor based on modified electrodes with urease immobilized on polyethylenimine films. Biosens Bioelectron. 2004;19:1641–7. doi: 10.1016/j.bios.2003.12.035. [DOI] [PubMed] [Google Scholar]
- 6. Magalhães JM, Machado AA. Urea potentiometric biosensor based on urease immobilized on chitosan membranes. Talanta. 1998;47:183–91. [PubMed] [Google Scholar]
- 7. Bertocchi P, Compagnone D, Palleschi G. Amperometric ammonium ion and urea determination with enzyme-based probes. Biosens Bioelectron. 1996;11:1–10. doi: 10.1016/0956-5663(96)83708-0. [DOI] [PubMed] [Google Scholar]
- 8. Mana H, Spohn U. Selective flow injection procedures for the determination of nitrogen containing analytes by gasdialytic–fluorimetric detection of enzymatically generated ammonia. Anal Chim Acta. 1996;325:93–104. [Google Scholar]
- 9. Chen H, Wang E. Optical urea biosensor based on ammonium ion selective membrane. Anal Lett. 2000;33:997–1011. [Google Scholar]
- 10. Cano MP, Hernandez A, Ancos Bd. High pressure and temperature effects on enzyme inactivation in strawberry and orange products. J Food Sci. 1997;62:85–8. [Google Scholar]
- 11. Adams J. Review: enzyme inactivation during heat processing of food-stuffs. Int J Food Sci Technol. 1991;26:1–20. [Google Scholar]
- 12. Hernández A, Cano MP. High-pressure and temperature effects on enzyme inactivation in tomato puree. J Agric Food Chem. 1998;46:266–70. doi: 10.1021/jf970455g. [DOI] [PubMed] [Google Scholar]
- 13. Li B, Zhang Z, Jin Y. Flow-injection chemiluminescence determination of urea by oxidation with N-bromosuccinimide. Anal Lett. 2001;34:2141–51. [Google Scholar]
- 14. Hu X, Takenaka N, Kitano M, Bandow H, Maeda Y, Hattori M. Determination of trace amounts of urea by using flow injection with chemiluminescence detection. Analyst. 1994;119:1829–33. doi: 10.1039/an9941901829. [DOI] [PubMed] [Google Scholar]
- 15. Qin W, Zhang Z, Peng Y. Plant tissue-based chemiluminescence flow biosensor for urea. Anal Chim Acta. 2000;407:81–6. [Google Scholar]
- 16. Lewis SW, Francis PS, Lim KF, Jenkins GE. Monitoring urea levels during haemodialysis with a pulsed-flow chemiluminescence analyser. Anal Chim Acta. 2002;461:131–9. [Google Scholar]
- 17. Du J, Liu W, Lu J. Investigation on the chemiluminescence behavior of alkaline earth metal ions Mg2+, Ca2+, Sr2+ and Ba2+ in luminol–permanganate reaction. Acta Chim Sin. 2004;62:1323–6. [Google Scholar]
- 18. Sun S, Lu J. Flow-injection post chemiluminescence determination of atropine sulfate. Anal Chim Acta. 2006;580:9–13. doi: 10.1016/j.aca.2006.07.049. [DOI] [PubMed] [Google Scholar]
- 19. Petrun N, Litvinchuk N. Use of dimethylglyoxime for the determination of urea in urine and blood by colorimetric method. Lab Delo. 1970;7:414. [PubMed] [Google Scholar]
- 20. Pulgarín JM, Molina AA, Boras N. Determination of piroxicam in pharmaceutical preparations by continuous-flow chemiluminescence. Anal Methods. 2010;2:76–81. [Google Scholar]
- 21. Halvatzis SA, Timotheou-Potamia MM. Continuous-flow chemiluminometric determination of ammonium ion in fertilizers. Talanta. 1993;40:1245–54. doi: 10.1016/0039-9140(93)80194-v. [DOI] [PubMed] [Google Scholar]
- 22. Jurgensen H, Winefordner JD. Use of active nitrogen in analytical chemiluminescence spectrometry. Talanta. 1984;31:777–82. doi: 10.1016/0039-9140(84)80198-8. [DOI] [PubMed] [Google Scholar]


